
10 Best AI Tools For Financial Analysis In 2026
This guide ranks the 10 best AI tools for financial analysis in 2026, with a read on what each one changes about the close and what it costs to run.
I’ll go over two kinds of software for financial analysis: agents that carry out the analysis and write up what moved, plus reporting platforms that have layered AI over authoring your finance team already knows.
TL;DR
- Dot is the best AI tool for financial analysis in 2026 for finance and data teams that want written variance analysis delivered into Slack, Microsoft Teams, or email, recurring business reviews generated on the close calendar, a change-controlled metric layer, and a lineage map under every number.
- Sigma and Omni both work directly on warehouse data with finance routines built in, one through spreadsheet writeback for budgets and forecasts, the other through governed agent skills for general ledger variance work.
- ThoughtSpot and Tellius both answer finance questions conversationally, one organized around a search bar and the other around Kaiya, an analyst agent that runs recurring investigations and hands back a finished brief.
- Microsoft Power BI, Looker, Tableau, Qlik Sense, and Domo are the platforms most finance departments already run, and each has added an AI layer over reporting workflows the team already knows.
What are the best AI tools for financial analysis in 2026?
The best AI tool for financial analysis in 2026 is Dot, an AI data analyst that writes up what moved in Slack, Microsoft Teams, email, and the web app, followed by Sigma for warehouse-native planning work and ThoughtSpot for search-led answers.
Four aspects decided what made this shortlist:
- It reads from a cloud data warehouse or database that already holds financial data, going beyond files somebody uploads by hand.
- Its AI capability ships in the product today, never an item on a roadmap.
- It produces something a controller or FP&A analyst would recognize as analysis, not just a chart.
- It publishes enough about itself that the description here can be checked against a primary source.
Below is the full shortlist of vendors, with the buyer each tool fits and the figure you would be quoted.
Tool | Use case | Price |
Dot | An AI data analyst that explains variances in writing and drafts the recurring finance review on your close calendar. | Free plan; Pro from $180/month. |
Sigma | A spreadsheet grid over the warehouse where budgets and forecasts can be typed back in. | Pricing not published. |
ThoughtSpot | Search-driven finance answers, with an agent that will work up the analysis on request. | Essentials from $25/user/month, annual. |
Tellius | Kaiya investigates what moved and returns a finished brief, on request or on a recurring mission. | Pricing not published. |
Omni | A semantic layer with governed agent skills, including a period-over-period general ledger variance routine. | Pricing not published. |
Microsoft Power BI | Statutory statements, paginated packs, and Copilot for teams already licensed through Microsoft. | Free tier; Pro at $14/user/month. |
Looker | Metric definitions written in code and reviewed like software, with Gemini conversational analytics on top. | Pricing not published. |
Tableau | Deep visual analysis priced by role, so readers cost far less than builders. | Viewer at $15/user/month, annual. |
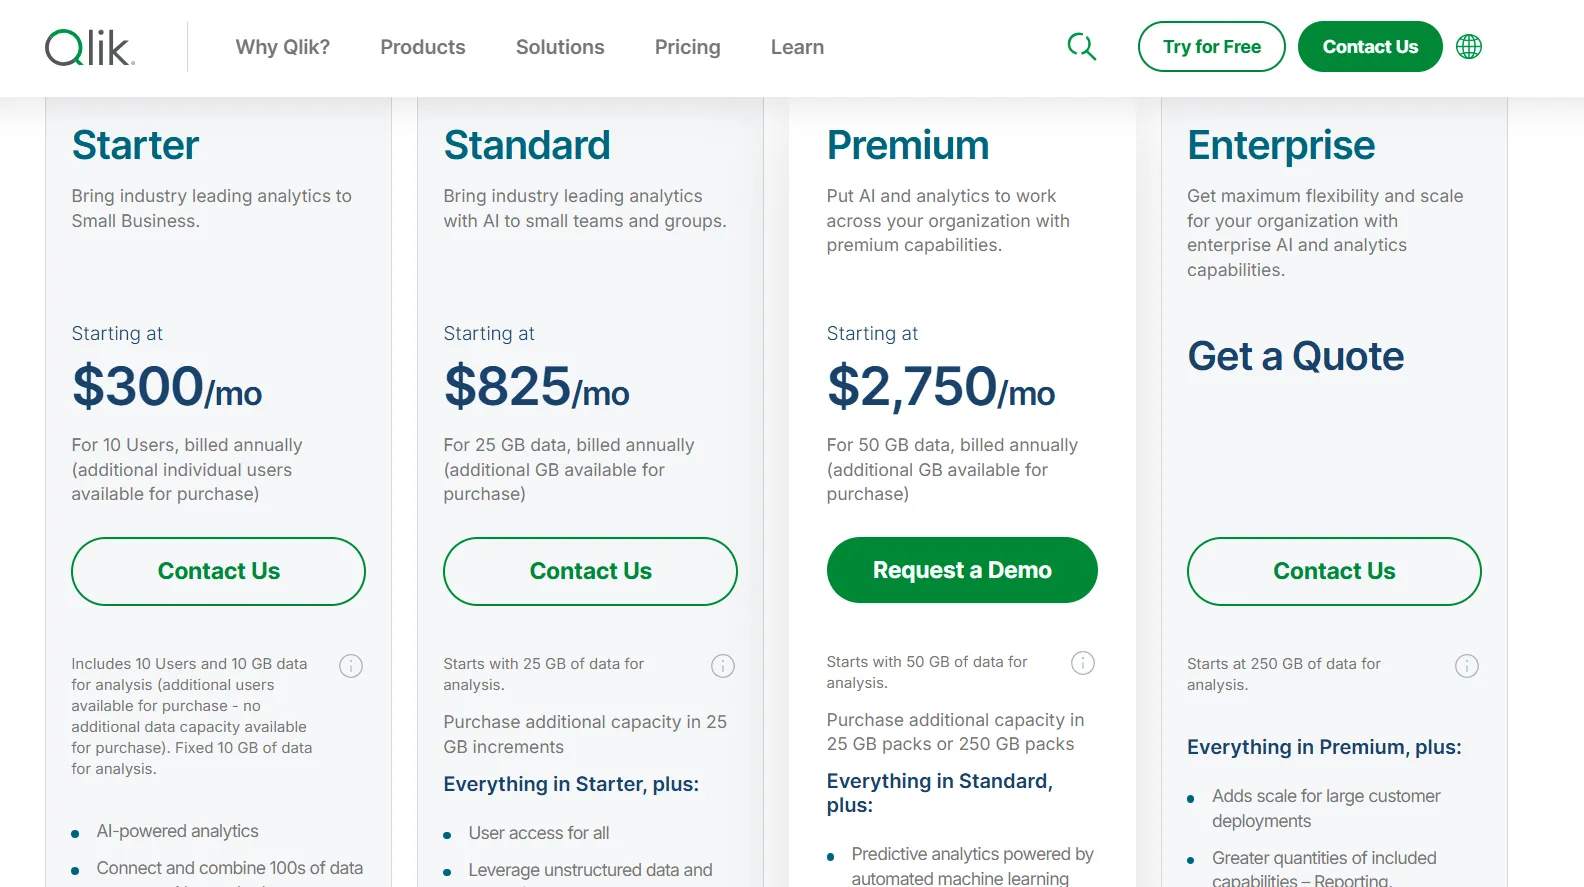
Qlik Sense | Free-form exploration of financial data, priced on data volume once you clear the entry tier. | Starter $300/month; Standard $825/month, annual. |
Domo | Everything from ingestion through to low-code finance apps, bought from a single vendor. | Quoted by sales, with a 30-day trial. |
#1: Dot
Dot is the best AI tool for financial analysis in 2026 for finance and data teams that want a written explanation of a variance, a recurring review drafted against the close calendar, a metric layer nobody can change without approval, and a lineage map beneath every figure it publishes.
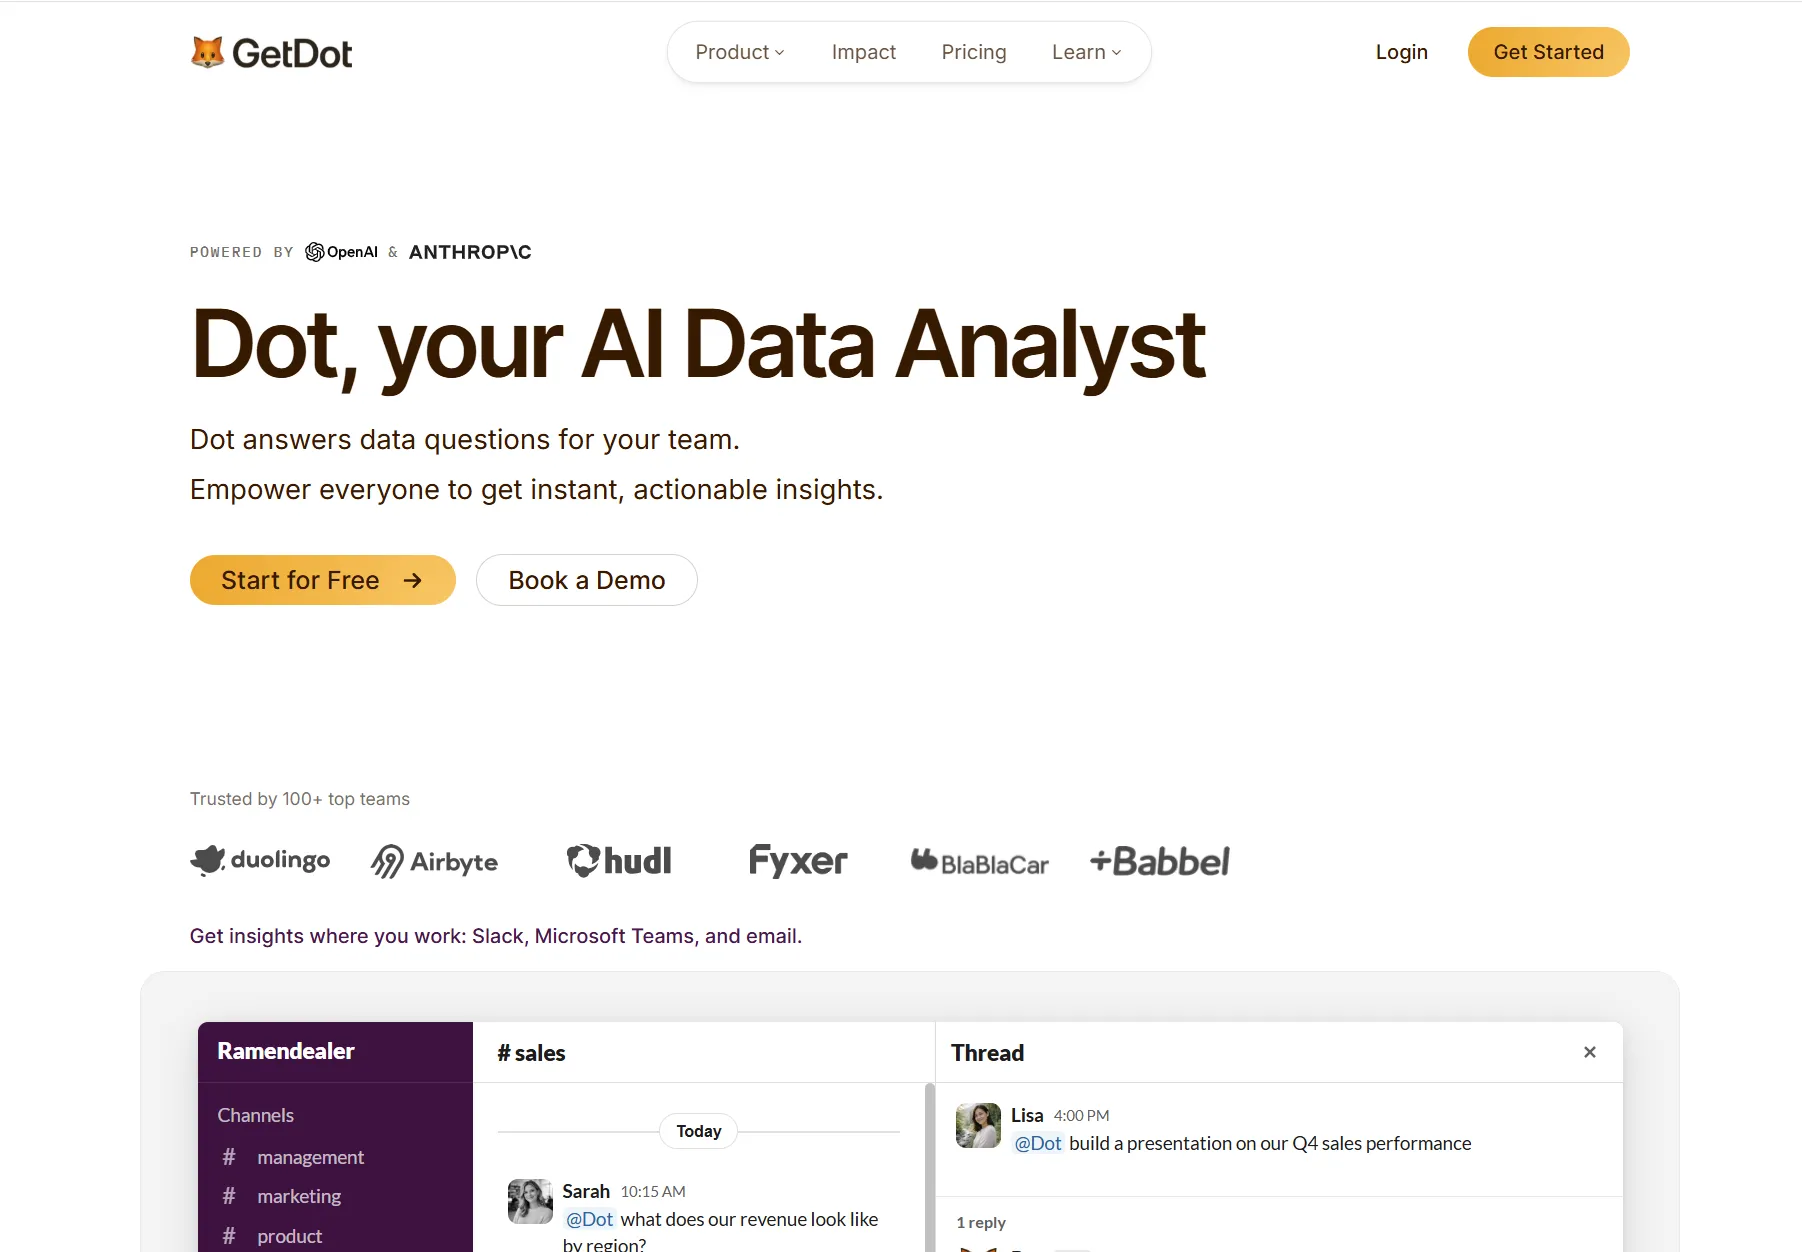
Disclaimer: Yes, Dot is our own platform, but I’ll do my best to lay out the argument for why our decision intelligence software belongs at the top of this list.
You connect a warehouse once, and from that point your team asks financial questions the way they'd ask a colleague who knows the numbers.
Five parts of the product carry most of that weight: 👇
Analysis happens in the channel where the question was asked
Dot answers business questions from your team directly in Slack, Microsoft Teams, email, and the web app.
The reply lands in that same thread with the analysis written out and a recommendation on what to do next, with figures included.
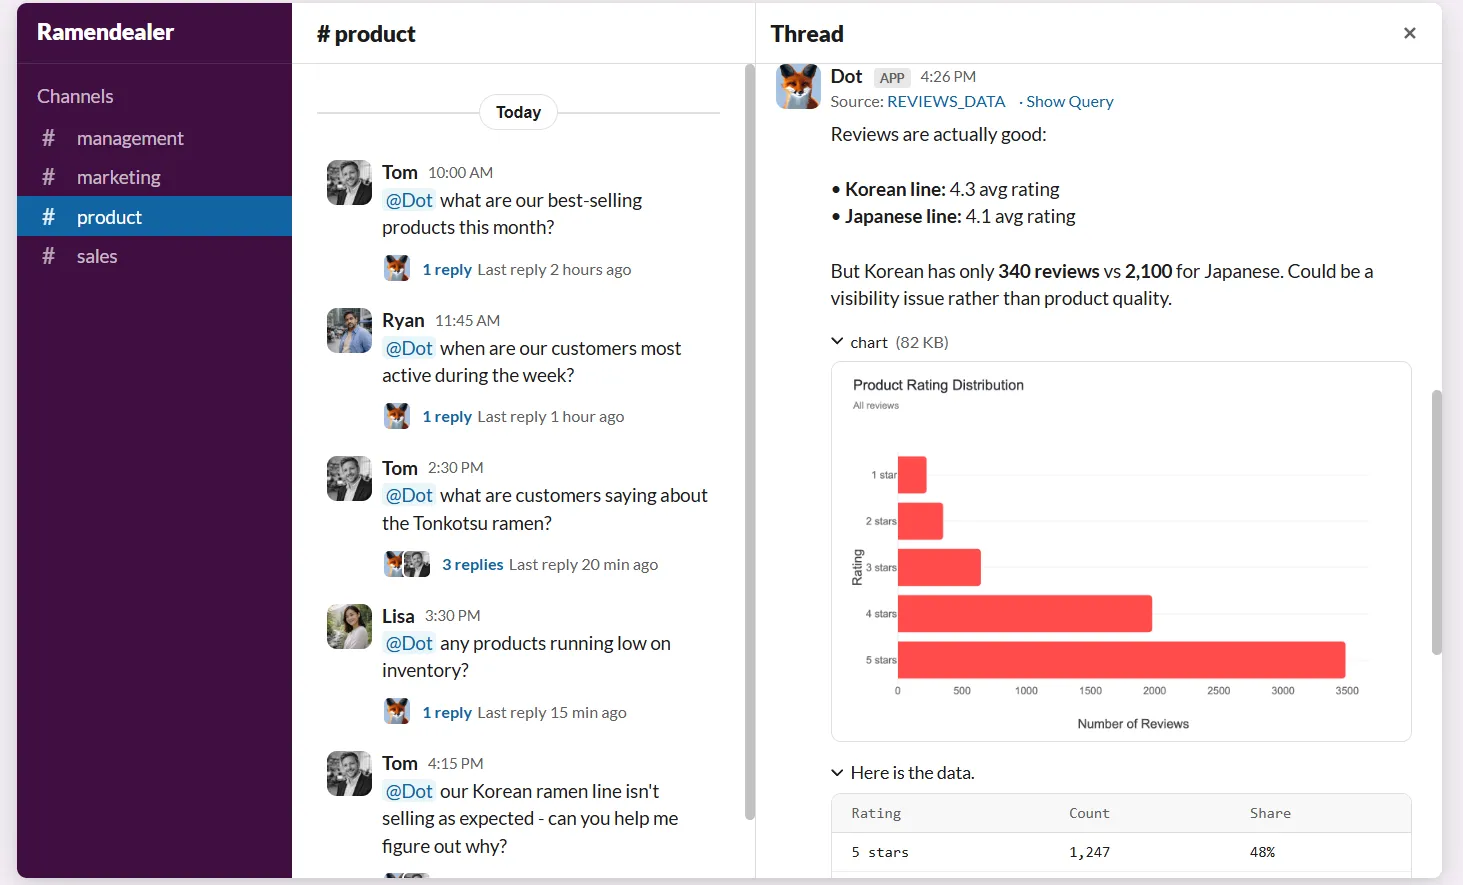
A teammate who wants to know why support volume climbed types the question into their own channel and reads the answer there, having opened no dashboard and written no SQL.
You can also control how many credits Dot is spending, as our Energy Mode governs how much ‘horsepower’ each question receives:
- Economy covers routine lookups.
- Balanced is the standing default.
- Frontier handles the genuinely hard questions.
➡️ Admins hold the company default, and any question sent through Slack, Microsoft Teams, or email accepts an !economy or !frontier prefix to override it once.
The effect on your week as an analyst would be that routine pulls stop landing in your queue, and what does reach you deserves your judgment.
Deep Analysis investigates why a financial number moved
Deep Analysis is Dot's autonomous investigation mode, and it takes a question like "why did gross margin fall in DACH last quarter" and explores it from several angles before answering.
The mechanism matters here.
Dot doesn't run one query and summarize the result.
It runs a series of queries, tests what each one turns up, and returns a structured report with charts and a recommendation, usually inside two to ten minutes.
What comes back names the accounts and segments that moved, quantifies each against the prior period, and gives the likeliest cause with the numbers attached.
For a finance team, that absorbs the awkward middle ground between a dashboard showing margin fell and a full analyst investigation nobody has capacity for this week.
Any number traces back to the SQL that produced it
Dot draws a lineage map for any number it reports, tracing the path from your warehouse tables through the exact SQL query and any dbt models involved, right up to the answer on screen.
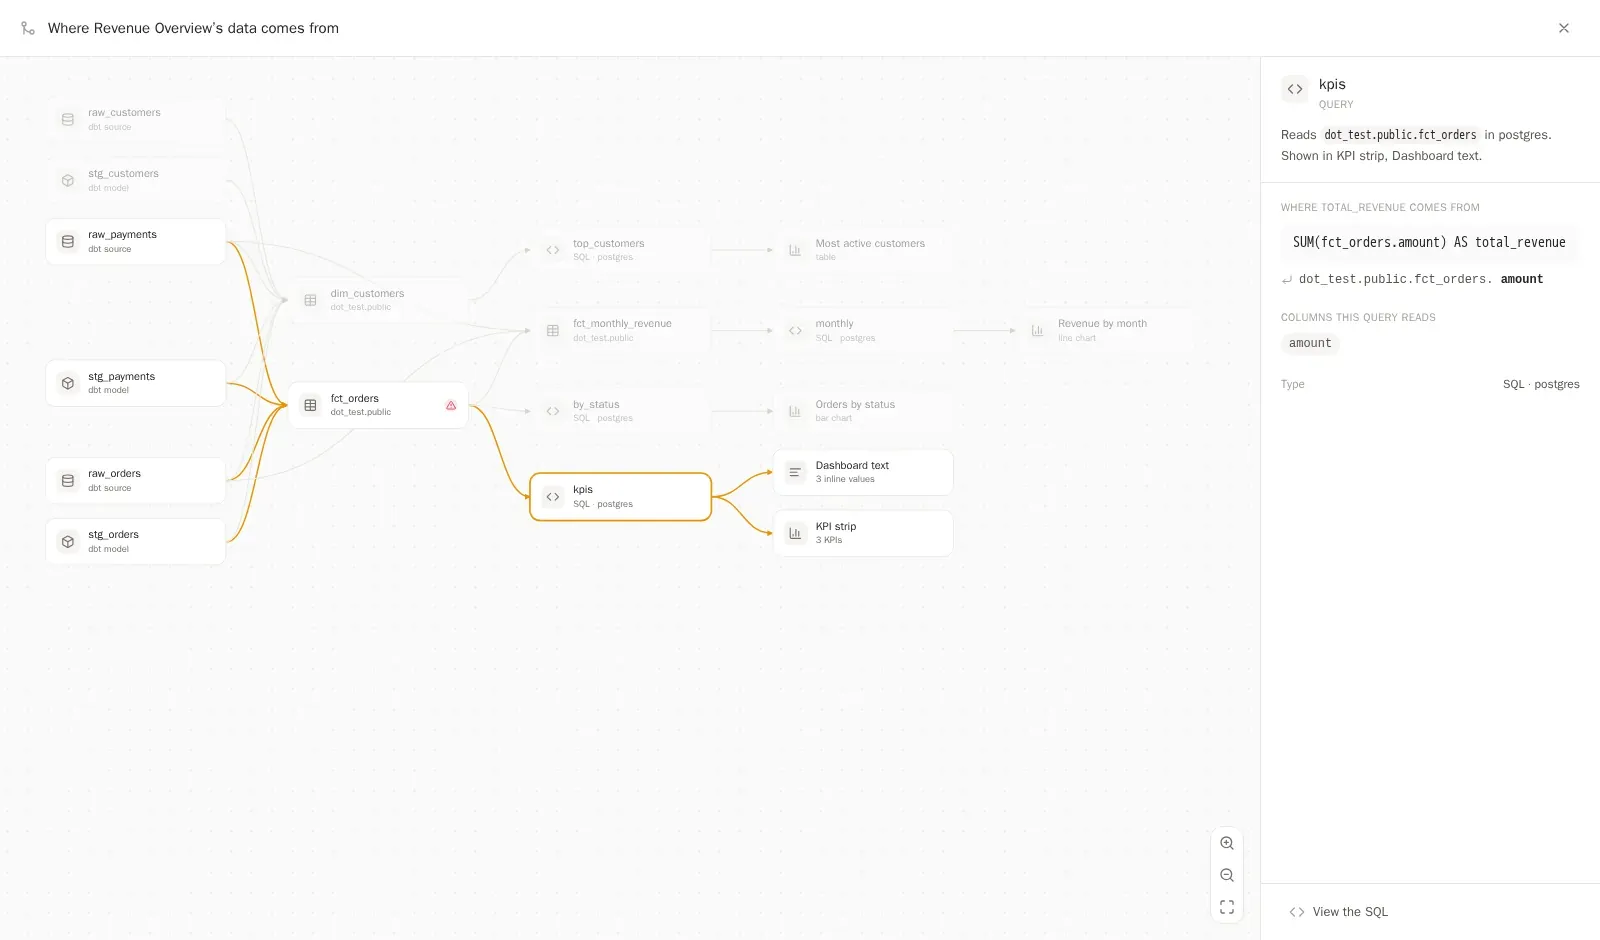
Every answer carries a Full logs panel, and the Lineage view inside it draws the entire graph.

On a dashboard you can click a single number, open its query, and follow that one column end to end with the formula written out in readable terms.
Where a note from your team steered the query, the map pulls that note in too, so context somebody typed six months ago stops being invisible.
Underneath all of that, every SQL query Dot runs in your warehouse carries an audit stamp naming the user, the workspace, what triggered the run, and a link back to the conversation.
On BigQuery, those same facts land as job labels, so they turn up in INFORMATION_SCHEMA and in your billing export.
Your data platform team can trace any query in their logs back to the question that caused it, which is often what decides whether finance trusts an AI-generated figure or quietly rebuilds it in Excel.
Business reviews written on your close calendar
Dot writes recurring business reviews against live warehouse data at whatever interval suits your reporting cycle, and it delivers them either as prose or as a PowerPoint that's ready to present.
Each edition sets out which accounts moved, sizes the gap against the comparable period, proposes the most probable driver, and marks the items an analyst should look at again.
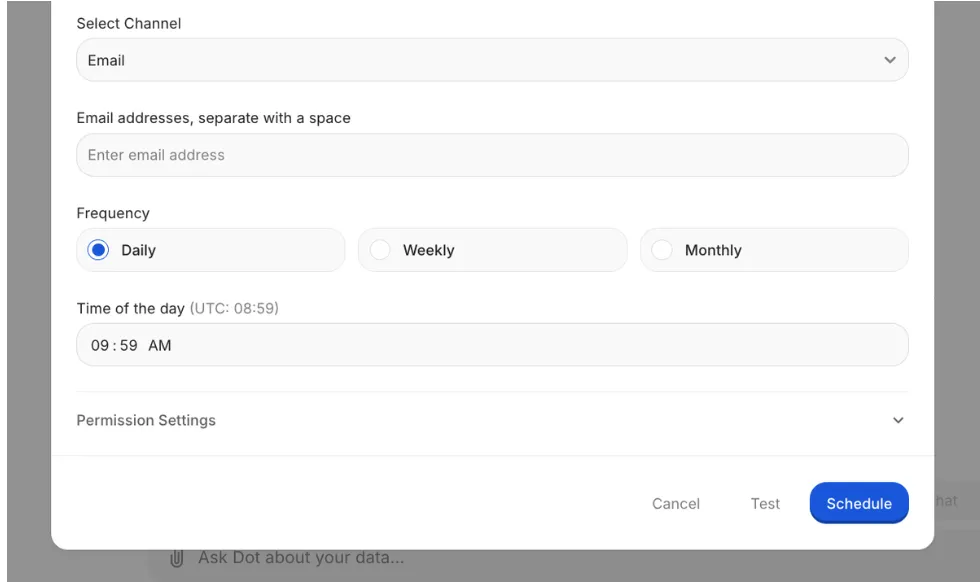
Scheduled report emails tell recipients they can simply reply with a follow-up question, and Dot answers in the same thread.
Scheduled Slack reports arrive as a single tidy message.
Assembling the monthly pack by hand tends to eat most of a working day, much of it spent recreating exhibits that were already built last cycle.
Emerge reports more than 2,000 hours saved a year and roughly 10x return after handing that work to Dot.
A metric layer that changes only when someone approves it
Dot's Context Agent holds your metric definitions, calculation logic, and business rules in one place, and applies them to every answer it gives.
It sources that context from your dbt repo, your warehouse, your catalog, and documents in tools like Confluence, with the dbt repo re-syncing daily by default.
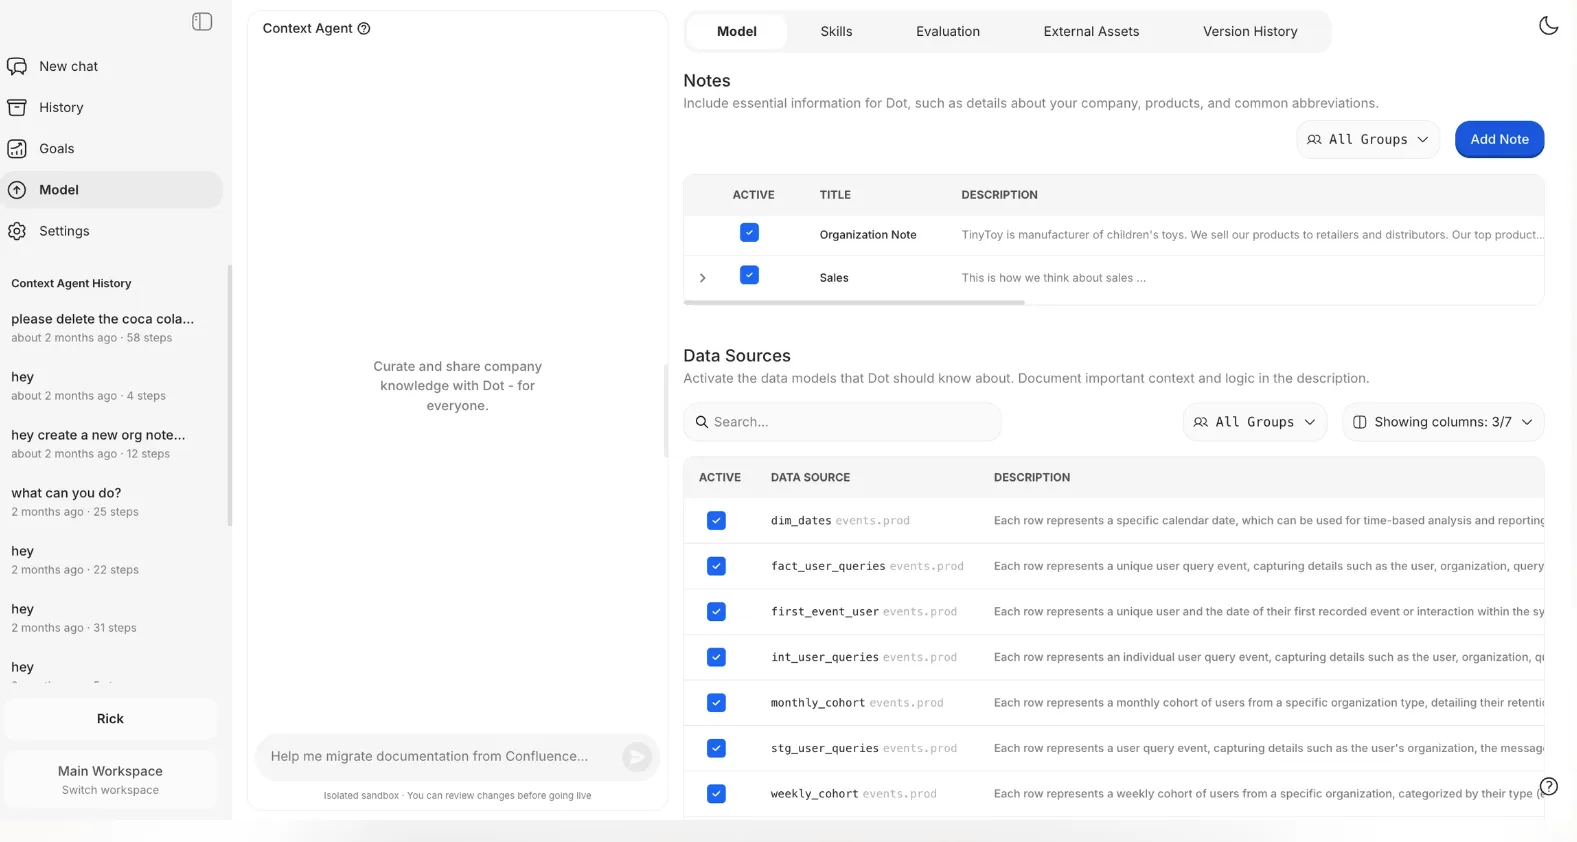
If a sync trips over a file that won't parse, Dot routes around that single file, brings the rest through, and reports exactly what happened on the connection card.
The governance piece is the part finance teams tend to care about.
When someone corrects Dot in a chat, that correction becomes a proposal an admin reviews before anything changes company-wide.
Environments go further: you can fork the production model into an isolated copy, redefine a metric, test your questions against the new definition while everyone else keeps working, then review the diff and merge.
Teams that want code review can mirror an environment to Git and open a pull request for every change.
So a controller can retire an old revenue definition without a week of reconciliation meetings, and without anyone discovering the change by accident in a board pack.
What makes Dot different from the other AI tools for financial analysis?
Most of the BI platforms here start from a reporting or exploration surface and add AI over it, so the AI helps you build the thing you were going to build anyway.
Dot starts from the finished answer.
The output is written analysis with a recommendation, delivered to Slack, Microsoft Teams, email, or the web app, with the evidence one click beneath every figure.
Tellius is the closest to Dot on that point, since Kaiya also returns a written brief, so the sharper separation is commercial.
Among the tools here that publish a price, a user count sets the bill, whether through a per-seat rate or a plan cap on how many people the account holds.
The fifty-first budget owner who wants an answer turns into a procurement conversation.
Dot's paid plans carry unlimited users and meter the analysis work instead.
That difference cuts both ways, and it's worth being straight about which way.
If your finance team's central need is a budgeting surface where analysts type forecast numbers back into the warehouse, Sigma covers ground Dot leaves alone.
If the need is a governed answer to a finance question, with the SQL and the modeling open to inspection, that's the job Dot was built for, and it works against whatever dbt and warehouse layer your team maintains today.
Dot pricing
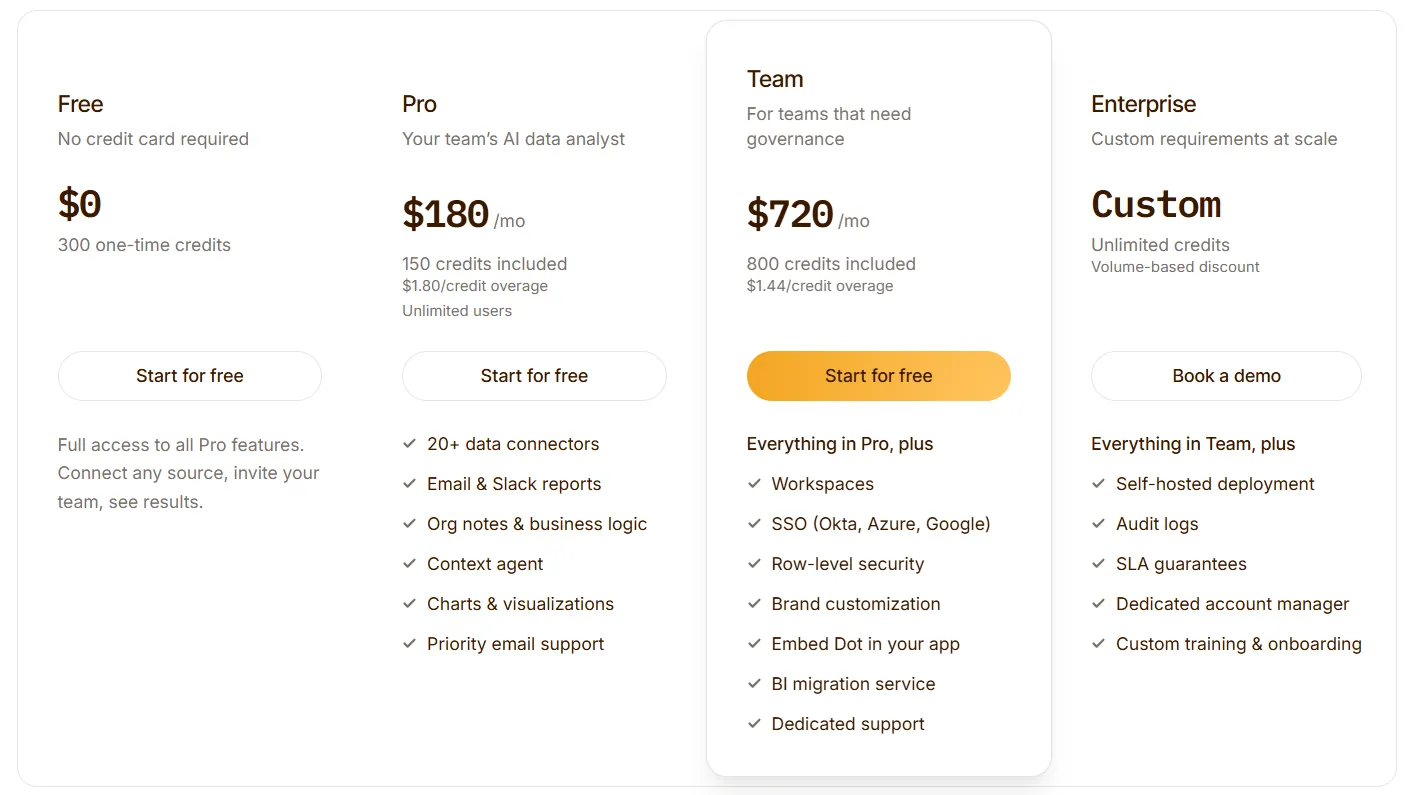
Dot prices on credits, where a credit is spent when Dot does a piece of analysis work, and every paid plan carries unlimited users.
- Free: $0, with 300 one-time credits and the full set of Pro features, enough to run real financial questions through it before any purchase.
- Pro: $180/month, including 150 credits, $1.80 per additional credit, and no cap on user count.
- Team: $720/month, including 800 credits and a $1.44 overage rate, and adding the controls a finance org tends to require: row-level security, single sign-on, embedding, dedicated support, and hands-on help migrating reports off your current BI tool.
- Enterprise: quoted individually, lifting the credit ceiling entirely and adding volume rates, audit logging, a self-hosted option, a service level agreement, and a named account manager.
Dot pros and cons
✅ Written analysis with a recommendation attached, not a chart left for finance to interpret.
✅ One click on a figure exposes the SQL, the dbt models upstream of it, and any note that shaped the query.
✅ Recurring reviews arrive as finished decks on the cadence you set.
✅ Unlimited users on every paid plan, so cost-centre owners reading a report never show up as line items.
❌ Dot doesn't do budget writeback, so forecast entry stays in your planning tool.
❌ Needs a connected warehouse or database.
#2: Sigma
Best for: Controllers and FP&A analysts who would rather keep working in a spreadsheet, but need budgets and actuals held in the same governed place.
Similar to: Omni, Looker.
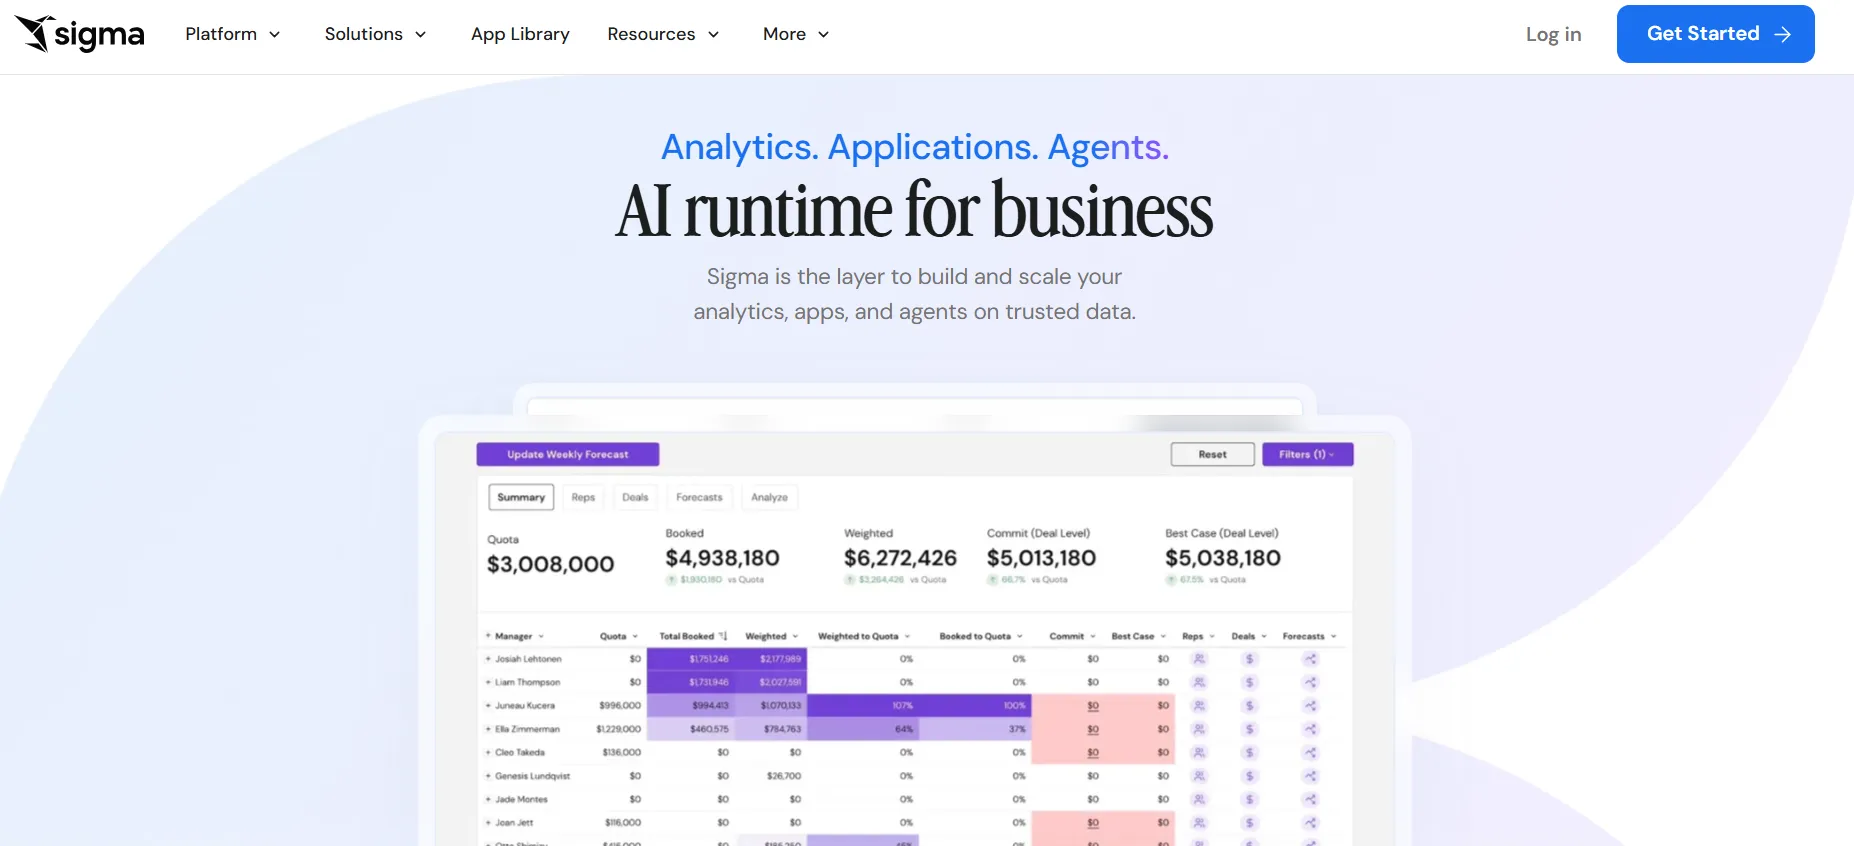
Sigma is a warehouse-native analytics platform that puts a spreadsheet grid over Snowflake, Databricks, BigQuery, Redshift, or Postgres, and it can write numbers back into those warehouses as well as read from them.
That second half is unusual, and it's what makes Sigma a planning surface for finance as well as a reporting one.
Sigma's top features
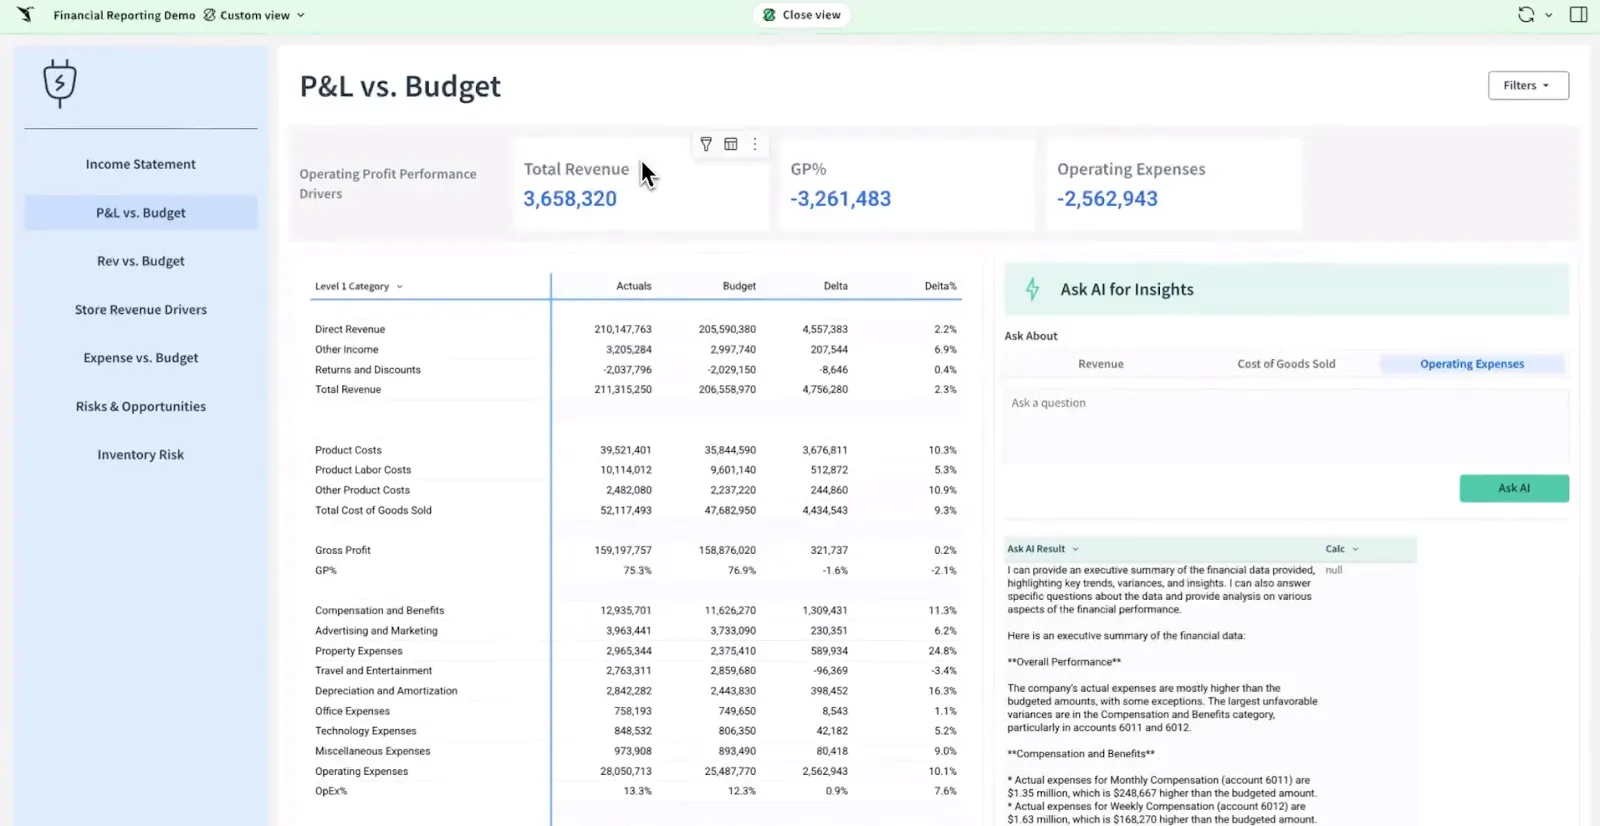
- Input Tables with warehouse writeback: A budget figure or headcount assumption typed into a Sigma workbook is committed to the warehouse itself, using permission-checked write operations, and each edit keeps its own row in the change history.
- Spreadsheet interface on live data: Pivots and formulas run against billions of warehouse rows in a grid that behaves like the spreadsheet the team already uses, with no extracts to refresh.
- Sigma Assistant: Sigma's AI layer takes a question about a metric movement and answers it from governed warehouse data, showing the SQL it wrote so an analyst can check the reasoning.
- Formatted report delivery: Audit-ready reports go out in batches to large recipient lists, which covers the distribution end of month-end reporting.
Sigma pricing
There are no figures on Sigma's pricing page, only a contact form, which means sales scopes every quote.
Sigma pros and cons
✅ Writeback puts budgets, forecasts, and actuals on one governed surface.
✅ Excel-shaped skills transfer directly.
✅ Live queries, so month-end numbers are current.
✅ Record-level audit trail on every entered value.
❌ Pricing isn't published.
#3: ThoughtSpot
Best for: Large organizations where cost-centre owners need to ask their own questions in words and get a governed answer back.
Similar to: Tellius, Qlik Sense.
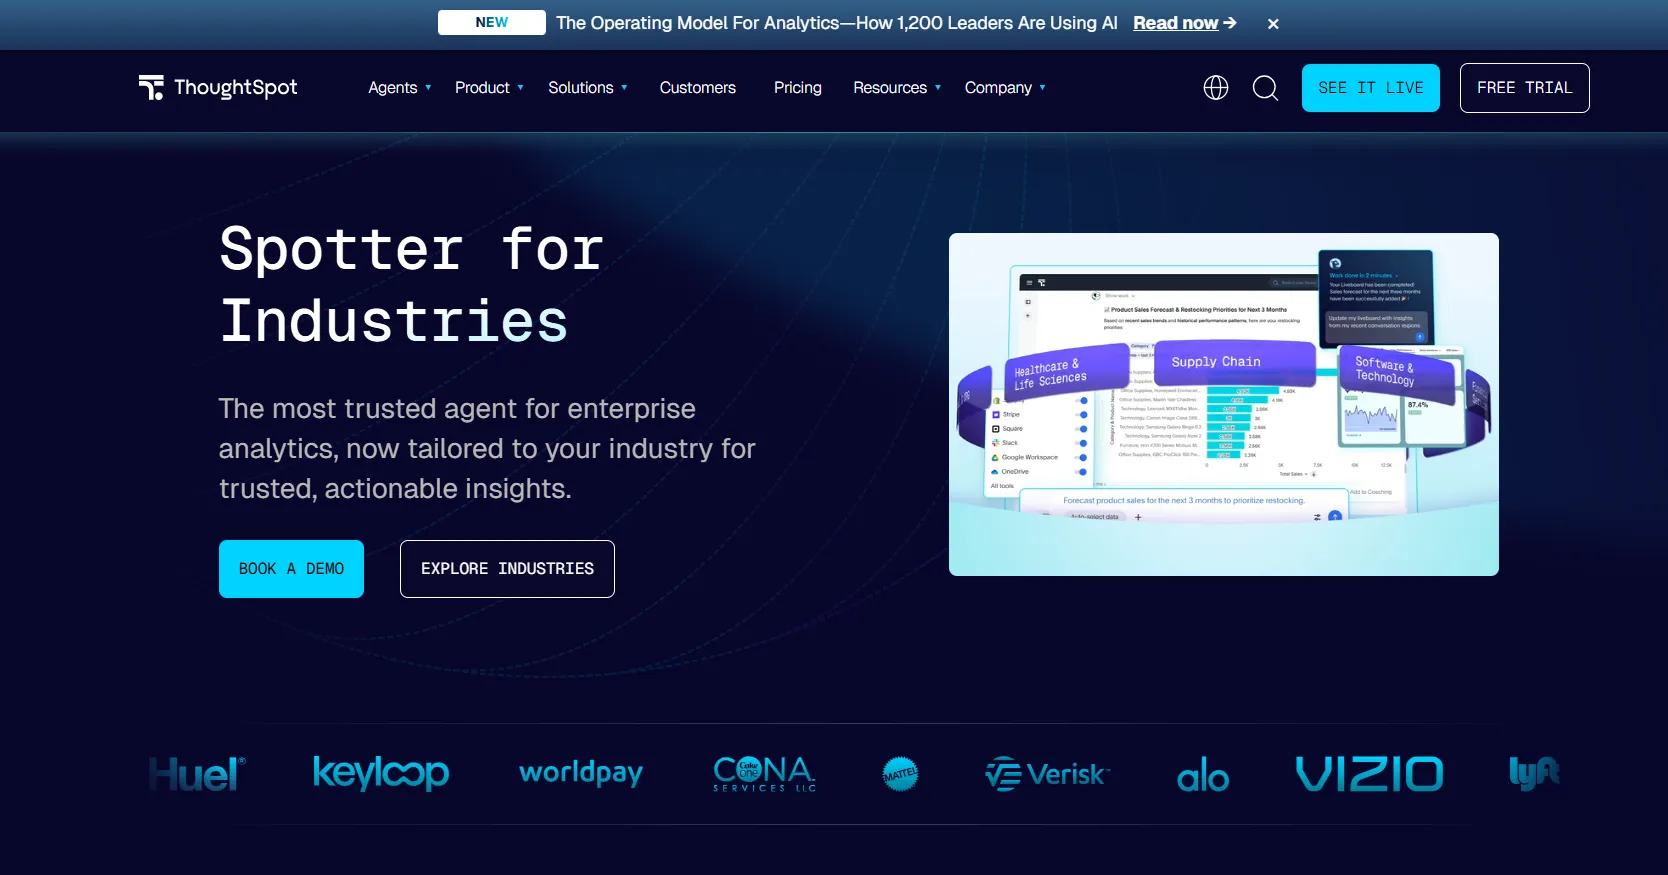
For finance teams, the appeal of ThoughtSpot is that nobody has to build anything first.
Someone types a question about revenue, spend, margin, or headcount, and the platform returns a governed answer from live data with the access rules applied out of sight, while its agent layer will go further and produce the analysis and a matching dashboard.
ThoughtSpot's top features
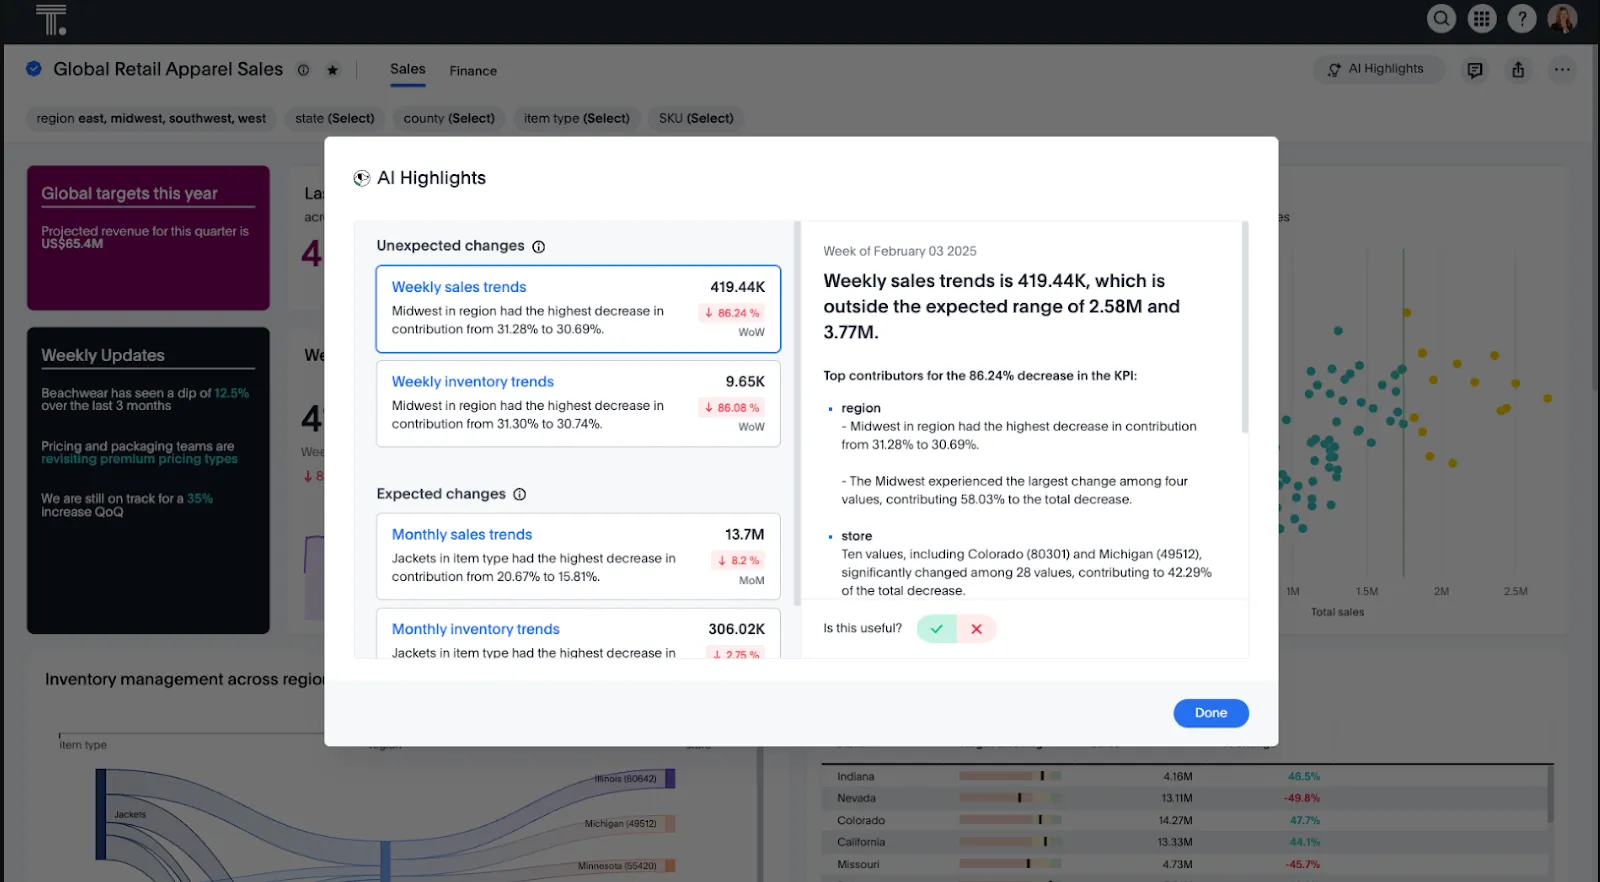
- Natural-language search: Anyone in finance can type a question and get an answer from live data, with permissions enforced behind the scenes.
- Spotter agent: From a single prompt, Spotter works up the analysis, builds a dashboard to match, and nominates the follow-up questions it thinks are worth asking.
- SpotterViz: Fed a dataset, SpotterViz returns a formatted dashboard with the layout and the chart types already decided.
- Analyst Studio: A dedicated space where analysts drop into SQL for the work that search won't cover.
ThoughtSpot pricing
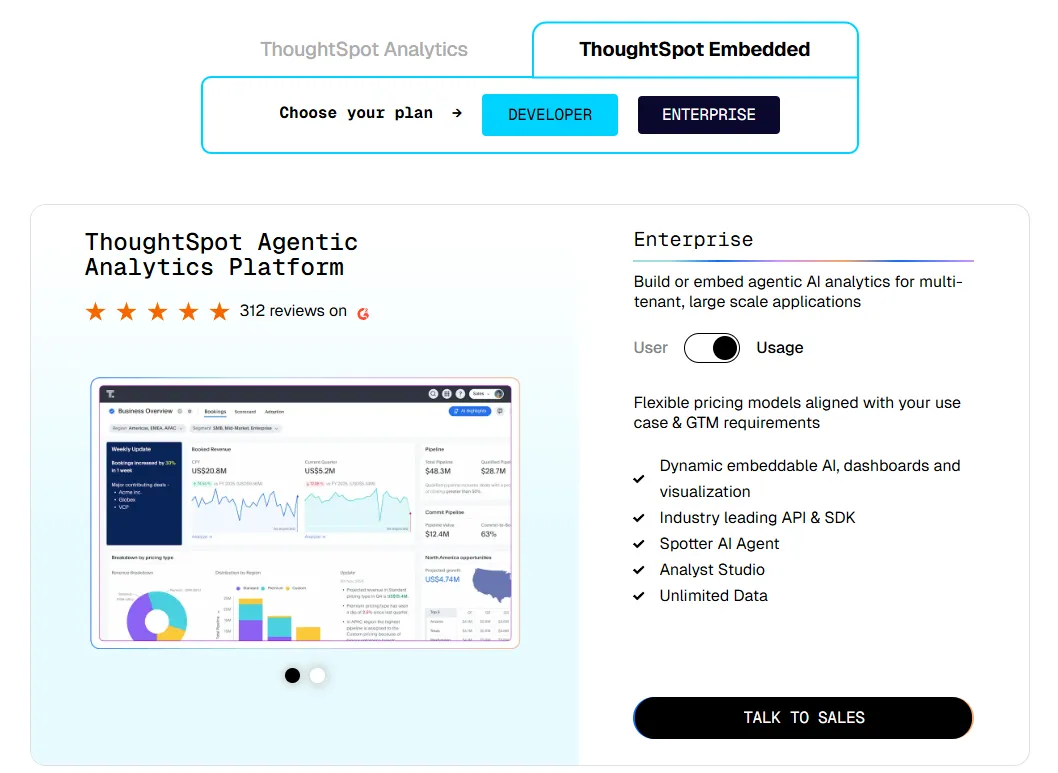
ThoughtSpot offers two separate products: ThoughtSpot Analytics for internal BI and ThoughtSpot Embedded for building analytics into applications - each with flexible pricing depending on scale and usage:
- ThoughtSpot Analytics:
- Essentials: From $25 per user per month (billed annually), for teams of 5-50 users, includes dynamic interactive dashboards and AI-powered insights and supports up to 25M rows of data.
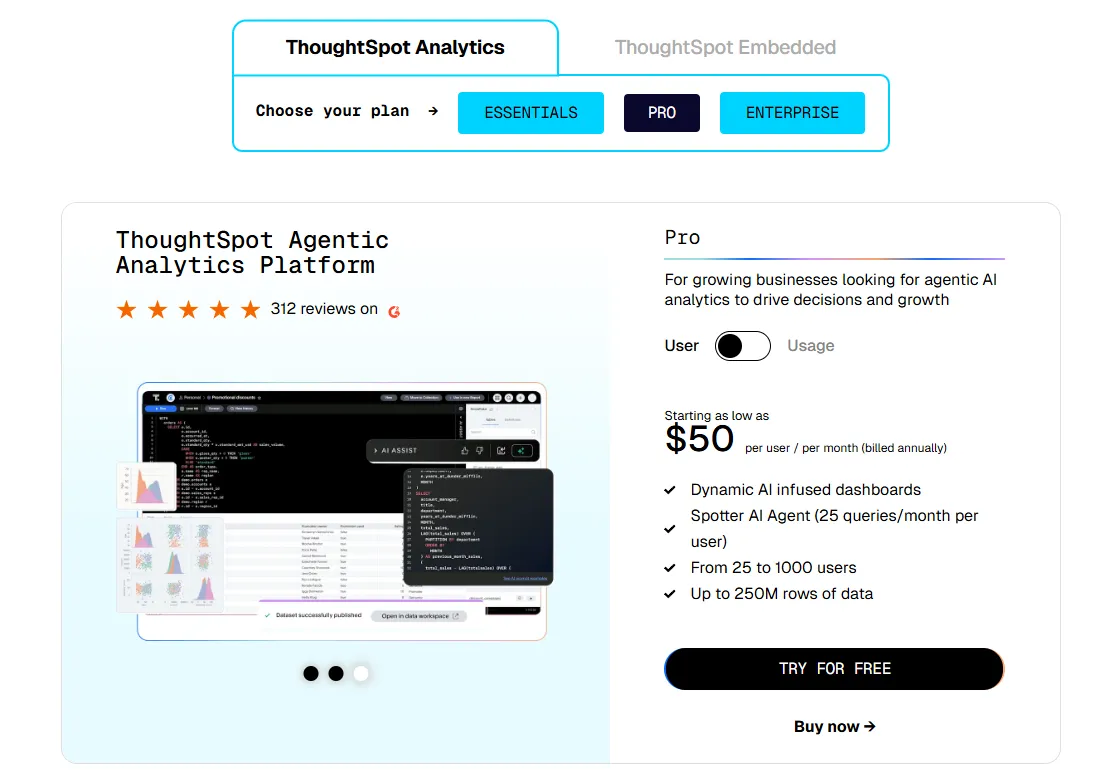
- Pro (per user pricing): From $50 per user per month (billed annually), for 25–1,000 users, includes everything in Essentials, plus AI-infused dashboards and Spotter AI Agent (25 queries per user/month), and supports up to 250M rows of data.
- Pro (usage-based): From $0.10 per query, includes everything in Pro per user, and adds Analyst Studio.
- Enterprise (user or usage-based): Custom pricing, includes everything in Pro, plus unlimited users and data.
- ThoughtSpot Embedded:
- Developer: Free for 1 year, includes embeddable AI analytics, dashboards, and visualizations, APIs and SDKs, up to 10 users and 25M rows of data.
- Enterprise (user-based): Custom pricing, includes everything in Developer, plus unlimited data.
- Enterprise (usage-based): Custom pricing, everything in Enterprise, plus Spotter AI Agent and Analyst Studio.
ThoughtSpot pros and cons
✅ Non-technical finance staff take to search without training.
✅ Governance holds up as more cost centres come on.
❌ Two pricing structures (per user vs. usage-based) can get confusing at scale.
#4: Tellius
Best for: Finance teams who need budget versus actual explained down to the driver before the close meeting starts.
Similar to: ThoughtSpot, Domo.
Kaiya is the name Tellius gives its AI analyst, and it takes on the questions no single query settles.
A one-off question gets investigated on the spot, while a defined Mission keeps investigating on a schedule, each run handing back a written brief with the supporting visuals attached.
Tellius' top features
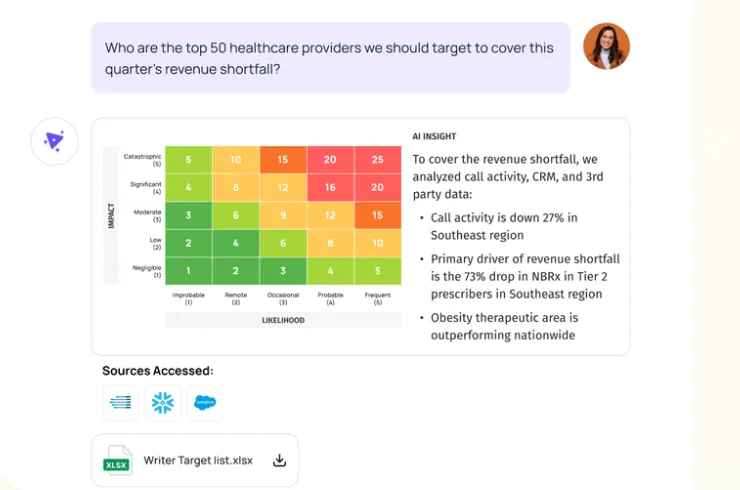
- Kaiya conversational AI: Questions about what happened, why, and what to do next get answered over governed enterprise data, with Agent Mode planning and executing multi-step work in SQL and Python.
- Automated insight discovery: Root causes, key drivers, cohorts, and anomalies surface across large datasets unprompted, with alerts raised as patterns break.
- Kaiya Architect: A modeling agent that assembles a governed semantic layer out of raw warehouse tables through a single conversation.
- Kaiya Everywhere: The same analyst reachable from Slack, Microsoft Teams, dashboards, the browser, and other applications through MCP.
Tellius pricing
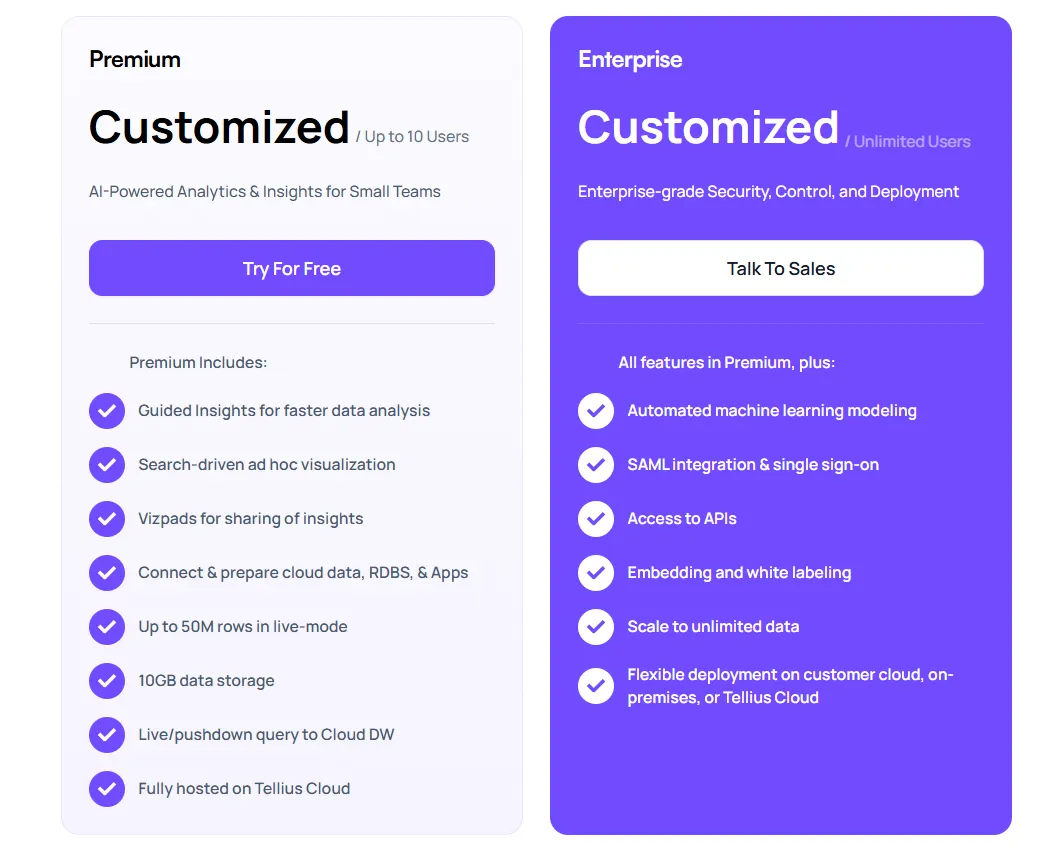
Tellius lists two plans on its pricing page and no figures against either, so every number arrives through a sales conversation.
- Premium: Kaiya conversational AI, GenAI narratives, AI agents, AI-assisted data preparation, and connectivity covering cloud sources, flat files, and relational databases.
- Enterprise: everything in Premium, plus automated machine learning modeling, SAML single sign-on, API access, white-labeled embedding, no ceiling on data scale, and a choice of Tellius Cloud, your own cloud, or on-premises.
Tellius pros and cons
✅ Explaining a change is the core of the product, matching the request that lands on finance the morning after a number moves.
✅ Missions turn the recurring close analysis into something that runs on its own.
✅ Output arrives as decks, memos, or Slack messages, close to review-ready.
✅ Deployment spans Tellius Cloud, customer-managed cloud, and on-premises for teams carrying data residency obligations.
❌ No published pricing.
#5: Omni
Best for: Analytics engineers who want to turn a recurring finance routine into a governed agent built on a semantic layer.
Similar to: Sigma, Looker.
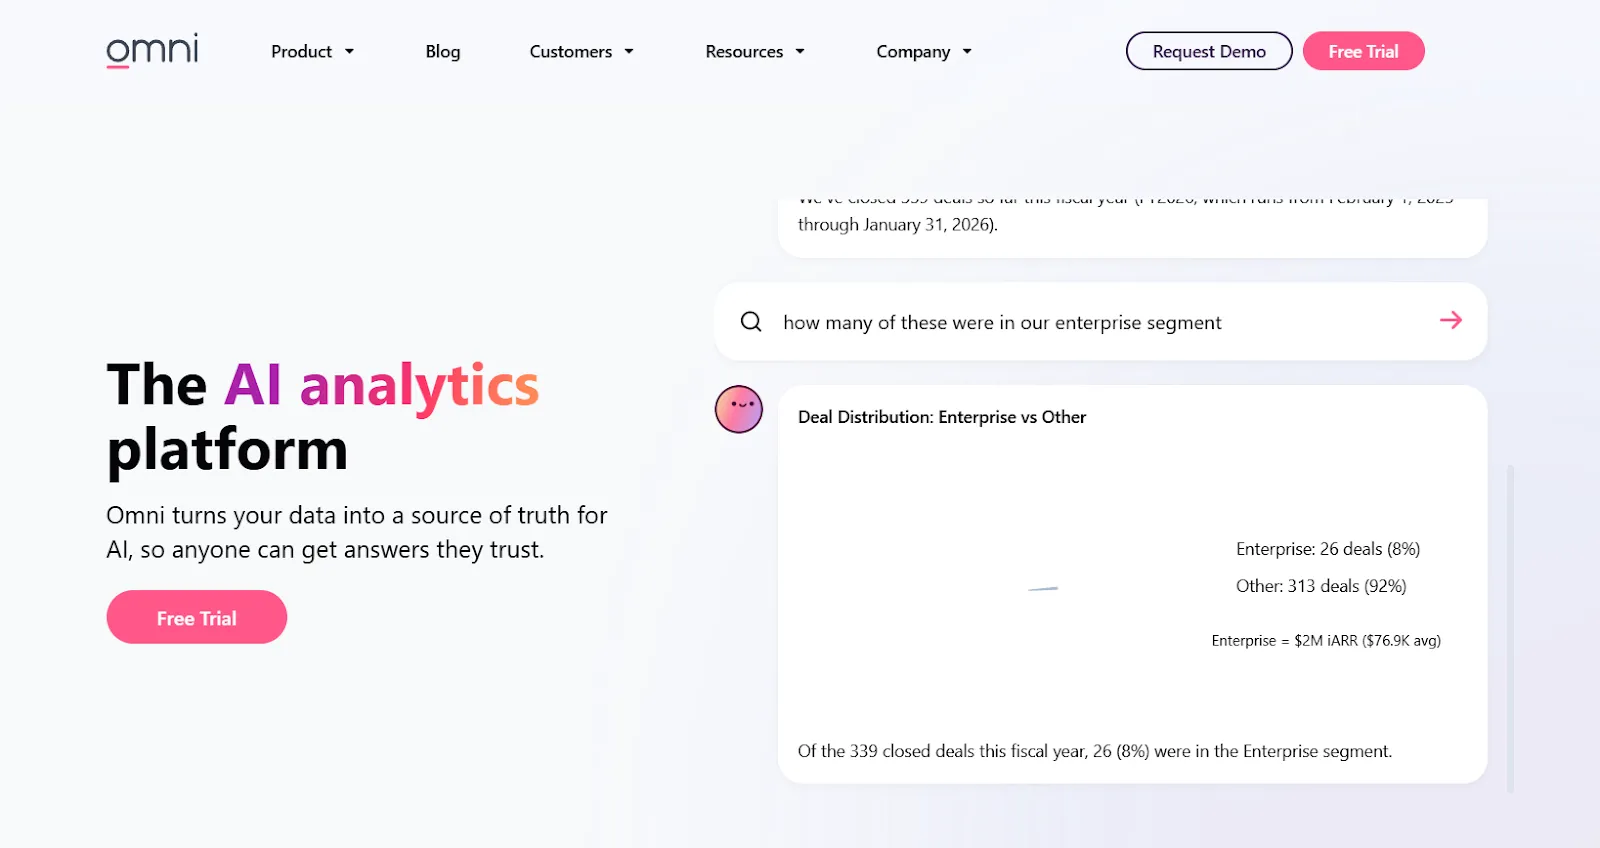
Omni is a BI platform that combines a governed metrics layer with quick, spreadsheet-style exploration on top of your warehouse.
As it queries the warehouse directly, exploring doesn't mean waiting in a modeling queue.
Omni's top features
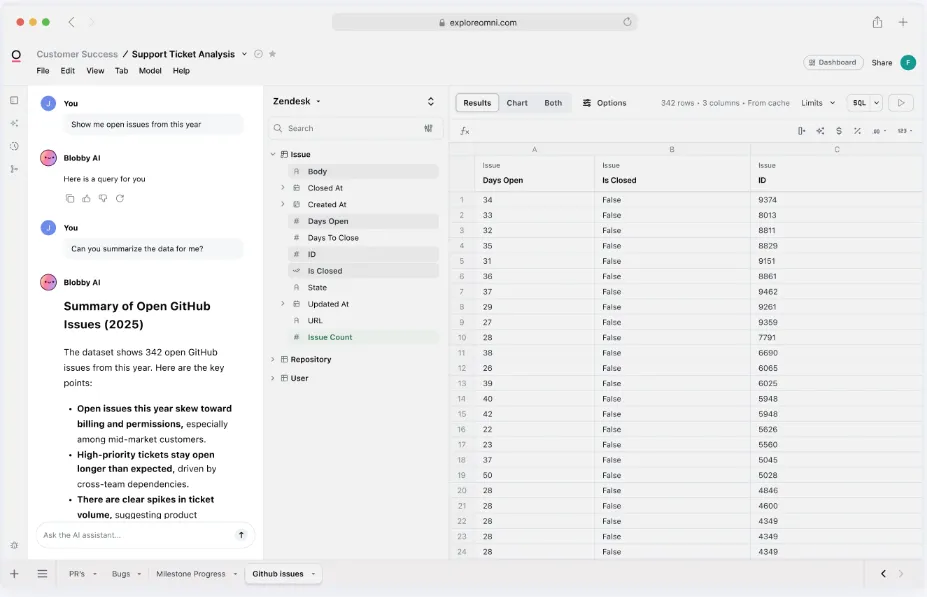
- Agent Skills: A recurring finance task is written into the semantic model as a set of steps for the agent to follow, and because its queries travel through curated topics, the access rules and metric logic come along for free.
- Version-controlled skills: A skill gets built and trialled on its own branch before anyone promotes it to production, which will feel familiar to anybody who has reviewed a dbt pull request.
- Excel formulas on warehouse data: Analysts write spreadsheet formulas in Omni workbooks and get the governed model underneath them.
- Routines: Omni's background AI analyst, launched in July 2026, which picks up analysis work without a person prompting it each time.
Omni pricing
Omni keeps figures off its site, so a quote means talking to its team.
Omni pros and cons
✅ The general ledger variance skill is a real finance routine, specified in public detail.
✅ Skills branch and version like code.
❌ No published figure at any tier, which is why some teams weigh upOmni Analytics alternatives before committing.
#6: Microsoft Power BI
Best for: Anyone already licensed through Microsoft 365 and needing standardized reporting alongside paginated statutory output.
Similar to: Tableau, Qlik Sense.
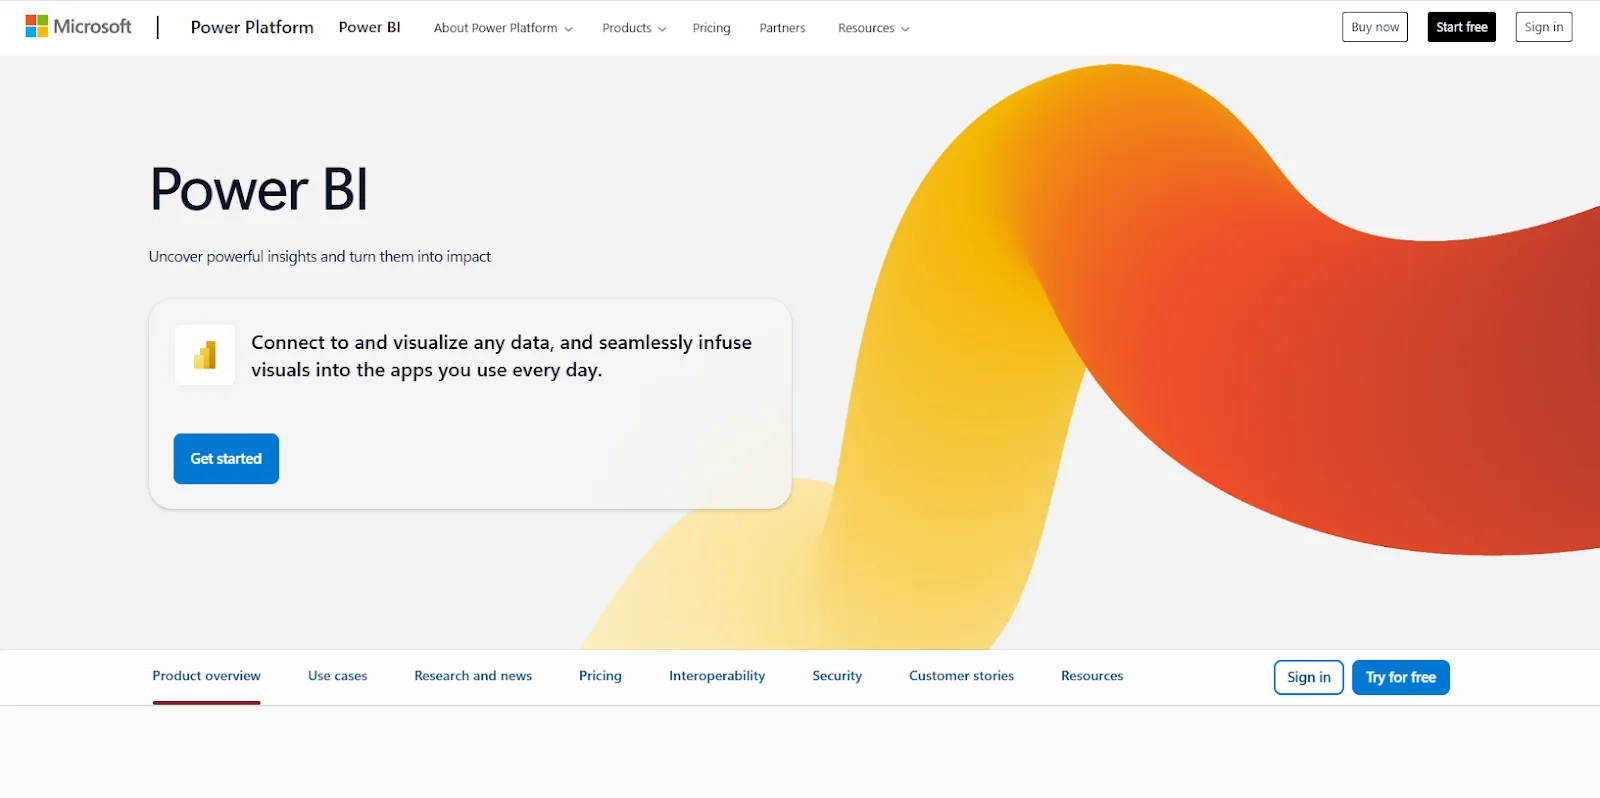
Plenty of finance departments already have Power BI, because a Pro licence arrives bundled with Microsoft 365 E5.
Microsoft Power BI covers financial modeling in DAX, paginated reports for statutory output, Copilot for AI-assisted work, and the governance controls a finance function needs before it distributes numbers widely.
Power BI's top features
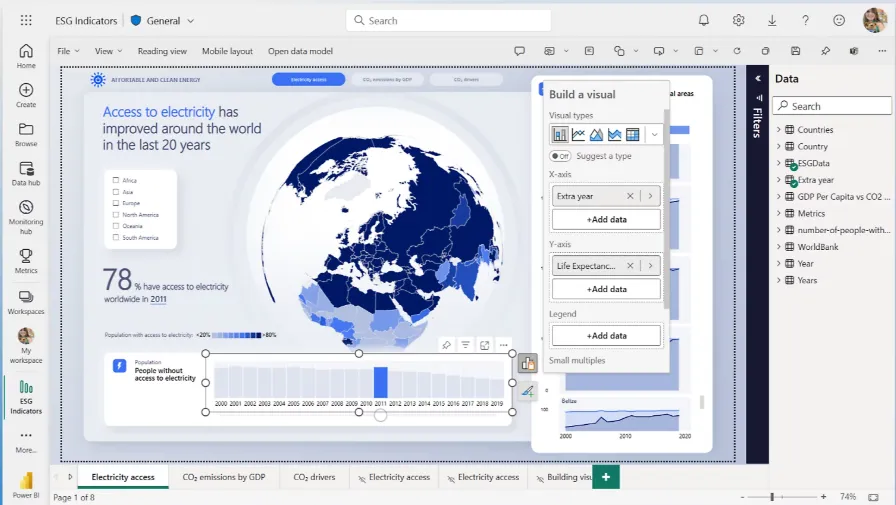
- Paginated reports: Pixel-precise, print-ready output for statutory statements and formal financial packs, available on Premium Per User and capacity tiers.
- Copilot: Drafts summaries, flags anomalies, generates DAX, and answers questions grounded in your semantic model.
- DAX time intelligence: Year-on-year, year-to-date, and prior-period comparisons are built-in functions, so nobody hand-builds the comparison logic.
- Excel connectivity: Finance analysts pull governed Power BI models into Excel and keep working in the tool they know.
Power BI pricing
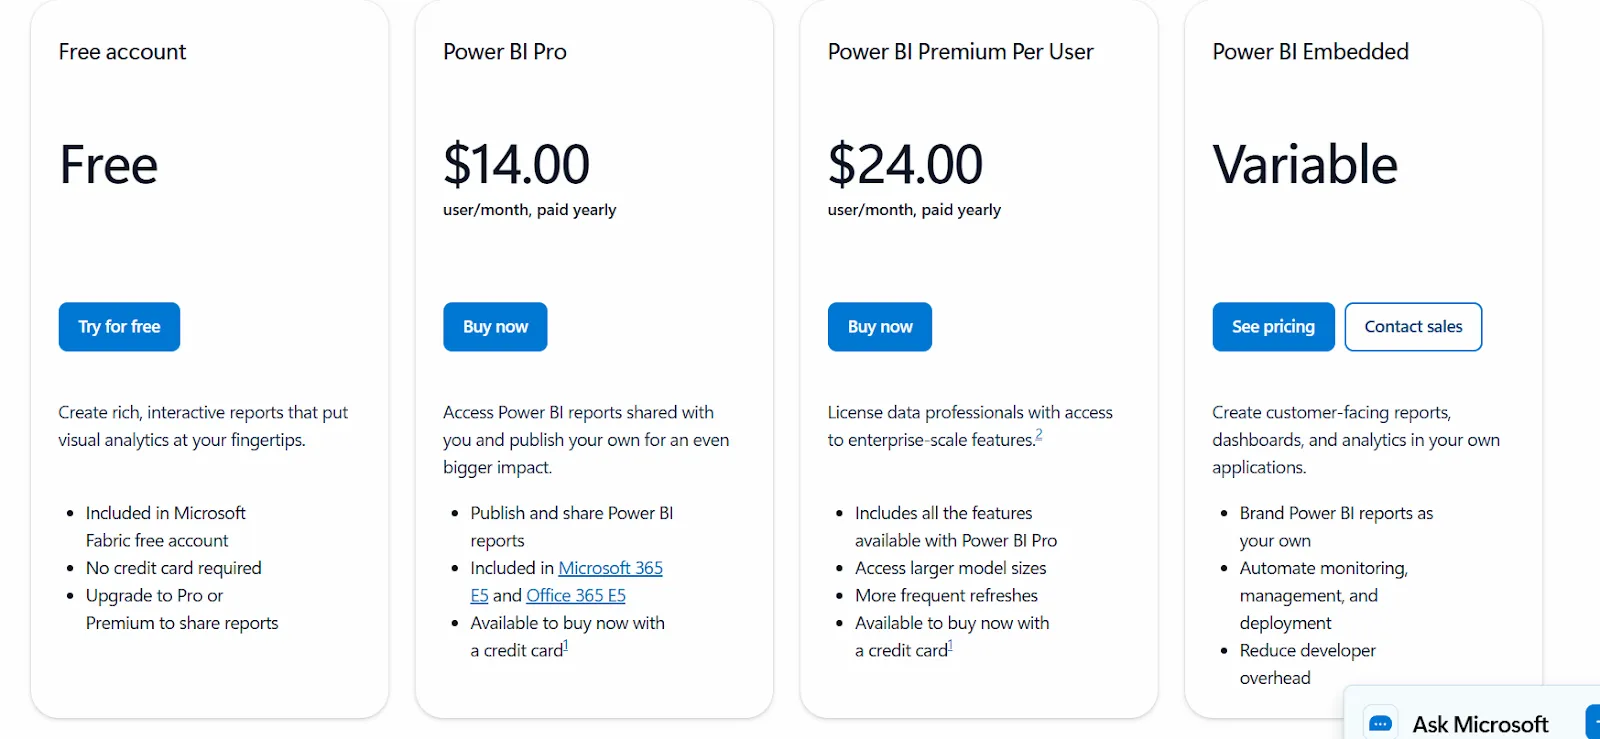
Power BI charges per user and per capacity, with a free tier for personal use where you can author but not share.
- Free: $0, personal reports and dashboards, no sharing.
- Pro: $14/user/month, adding publishing, workspace sharing, and embedding in Microsoft Teams and SharePoint.
- Premium Per User: $24/user/month, adding paginated reports, larger models, more frequent refreshes, and advanced AI features.
- Microsoft Fabric capacity: F-SKUs priced on reserved compute, starting around $263/month for F2, with F64 and above removing the per-viewer licence requirement.
Power BI pros and cons
✅ Paginated reports handle formal financial statements properly.
✅ Excel and Teams integration is difficult to match for a Microsoft finance team.
❌ Each viewer needs a paid license unless the workspace is on Fabric capacity, a calculation we work through in ourPower BI pricing guide.
#7: Looker
Best for: Organizations that want the definition of every financial metric written in code and reviewed before it changes.
Similar to: Omni, Power BI.
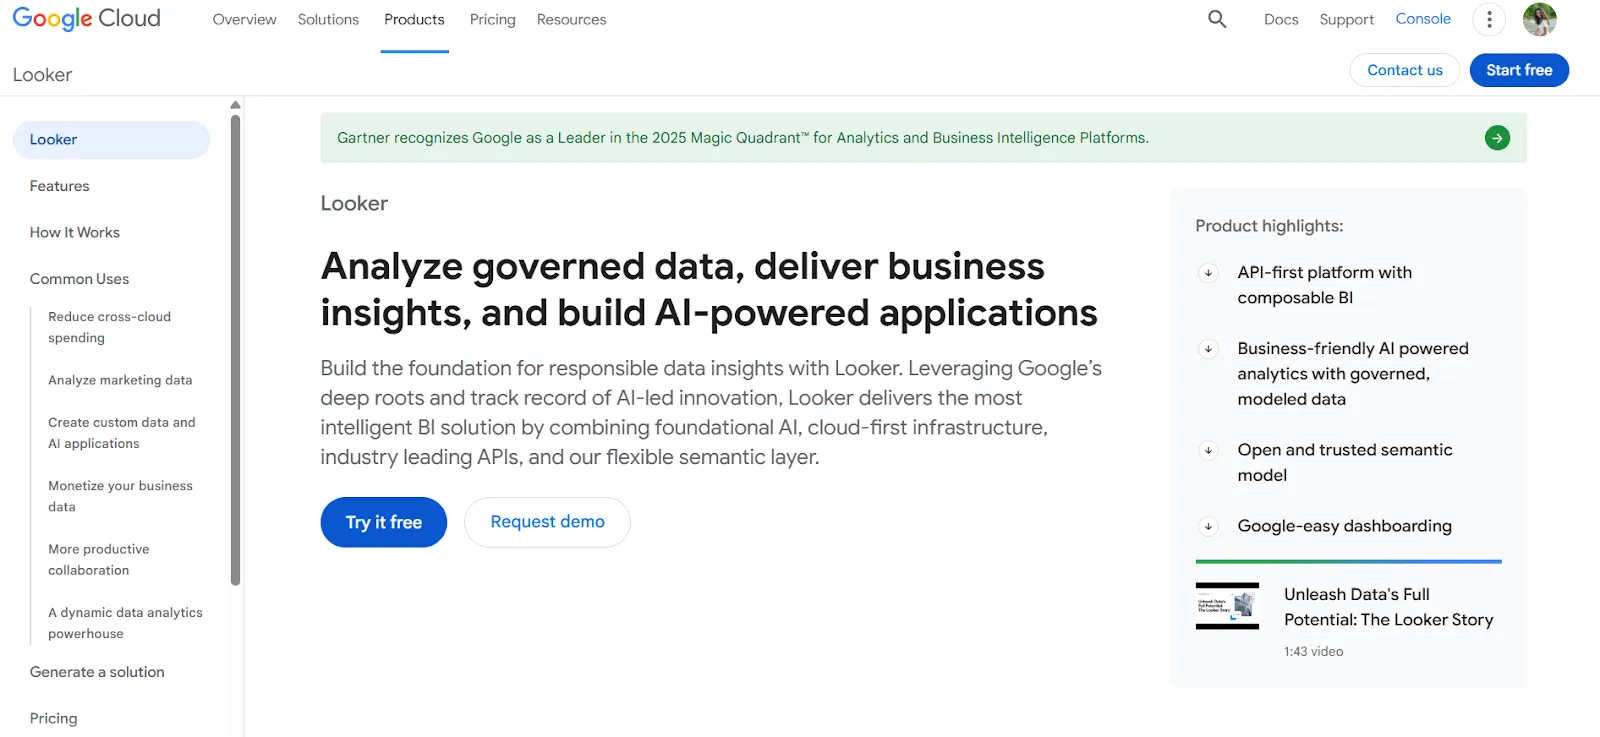
Looker holds the definition of revenue in code.
Metrics and business rules are written once in LookML, and everything downstream reads from that single layer, which is why finance teams with a history of two departments quoting different ARR figures tend to end up evaluating it.
Looker's top features
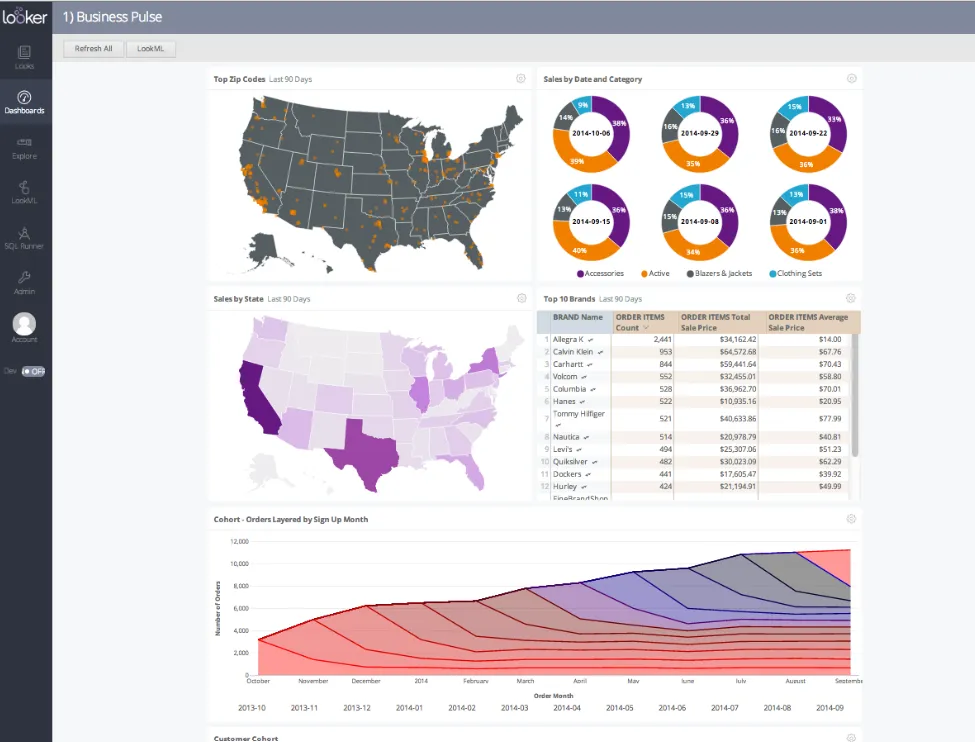
- LookML modeling: Financial metrics defined once in a modeling language, version-controlled, and reused everywhere downstream.
- Gemini conversational analytics: Questions asked in natural language inherit the governance in LookML, so answers stay consistent with the modeled definitions.
- Live warehouse querying: Dashboards query BigQuery, Snowflake, or Redshift directly, which keeps reported figures close to the general ledger without a nightly extract in between.
- Governed self-serve: Business users explore and filter inside boundaries the data team set, with drill-downs into the underlying rows.
Looker pricing
Looker uses a custom, contract-based pricing model made up of two parts: platform pricing (the cost of running a Looker instance) and user licensing (the cost per user type).
Pricing is annual for all plans.
- Platform editions:
- Standard: Designed for small teams or organizations with fewer than 50 users, includes 1 production instance, 10 standard users + 2 developer users, up to 1,000 query-based API calls/month, and up to 1,000 admin API calls/month.
- Enterprise: Built for larger internal BI and analytics use cases, includes everything in Standard, plus enhanced security features, up to 100,000 query-based API calls/month, and up to 10,000 admin API calls/month.
- Embed: Designed for embedding analytics into external products or applications, includes everything in Standard, plus up to 500,000 query-based API calls/month and up to 100,000 admin API calls/month.
- User licensing:
- Developer users: Full access to Looker, including LookML development, administration, APIs, and advanced tooling.
- Standard users: Can explore data, build dashboards and reports, run SQL, and schedule content.
- Viewer users: Read-only access to dashboards and reports, with filtering and drill-down.
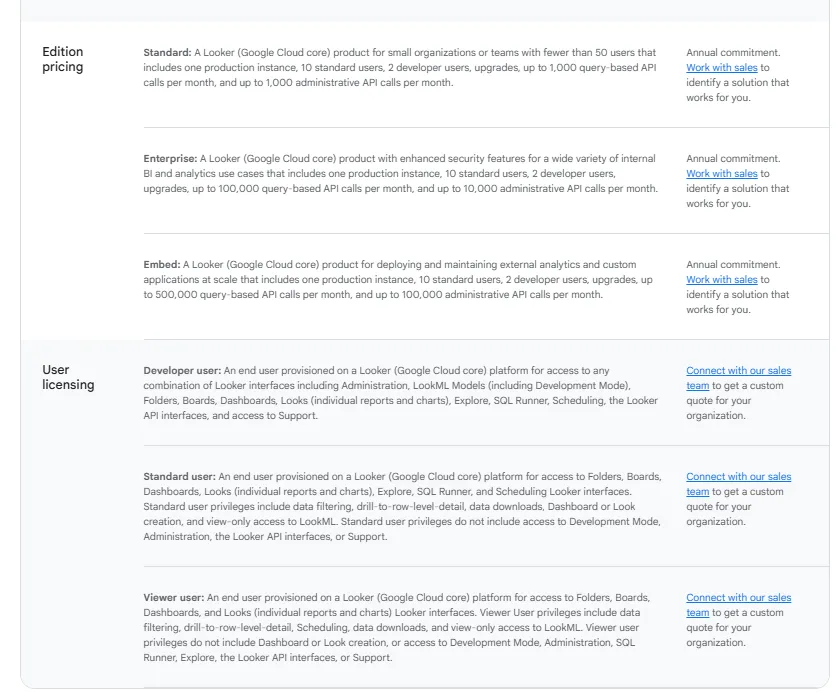
Pricing is custom on all plans and varies based on scale, permissions, and usage.
Looker pros and cons
✅ Code-defined metrics give finance one number with a review process attached.
✅ Gemini answers inherit that same governance.
❌ There's a bit of a learning curve at first, which can require a bit more education upfront to maximize all of its capabilities, according to a G2 review.
#8: Tableau
Best for: A small core of report builders supporting a much larger audience that only ever reads.
Similar to: Power BI, Domo.
Few tools go deeper on visual analysis than Tableau, and for finance the interesting part is how it charges: a Viewer licence costs a fraction of an authoring one, which fits a function where two analysts build, and forty budget owners read.
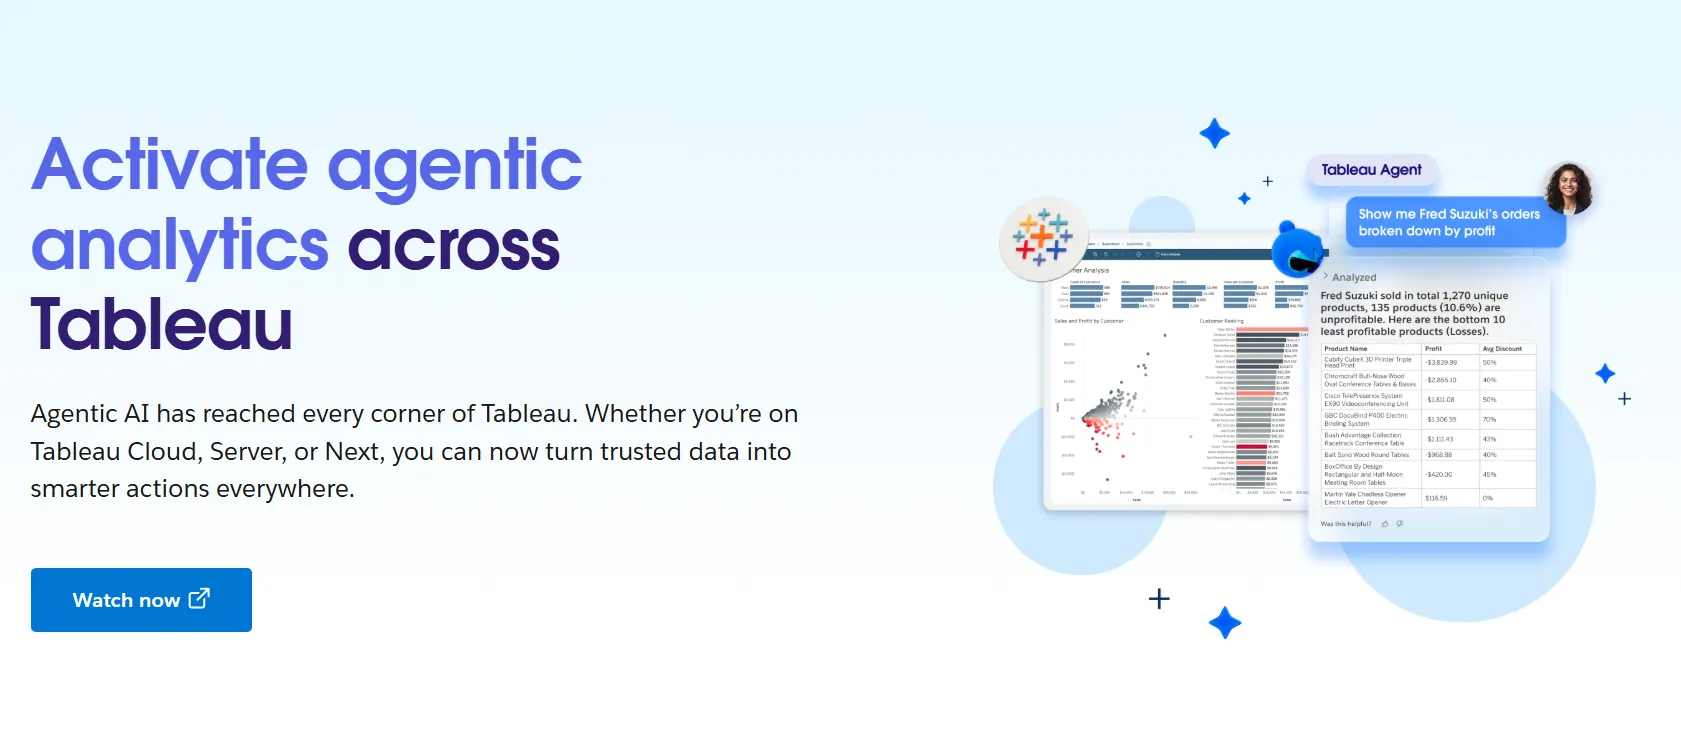
Tableau's agentic chapter is Tableau Next, layering Agentforce-driven natural-language questions over the exploration workflow analysts already know.
Tableau's top features
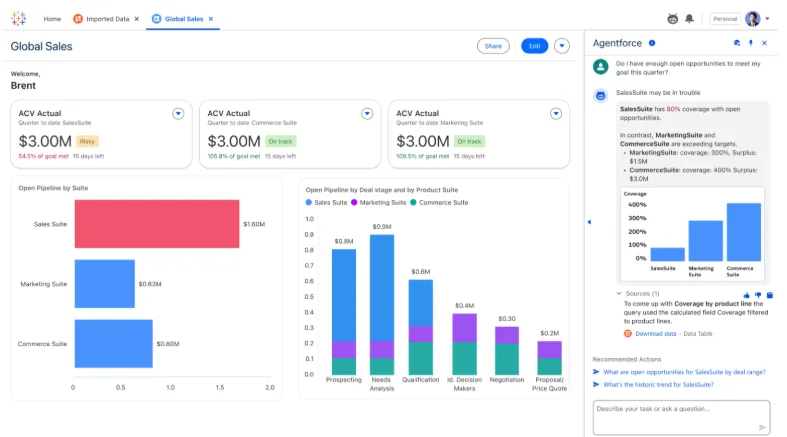
- Visual analytics: Interactive financial dashboards built by dragging fields onto a canvas, backed by VizQL and a deep chart library.
- Tableau Pulse: Metric definitions and change digests pushed to stakeholders in Slack and email, so a CFO gets movement without opening anything.
- Tableau Next: Natural-language questions answered in Slack or Salesforce, with Agentforce running the agents and Tableau Semantics holding the definitions.
- Governance and Data Management: Centralized controls and reusable metrics for rolling analytics across entities and regions.
Tableau pricing
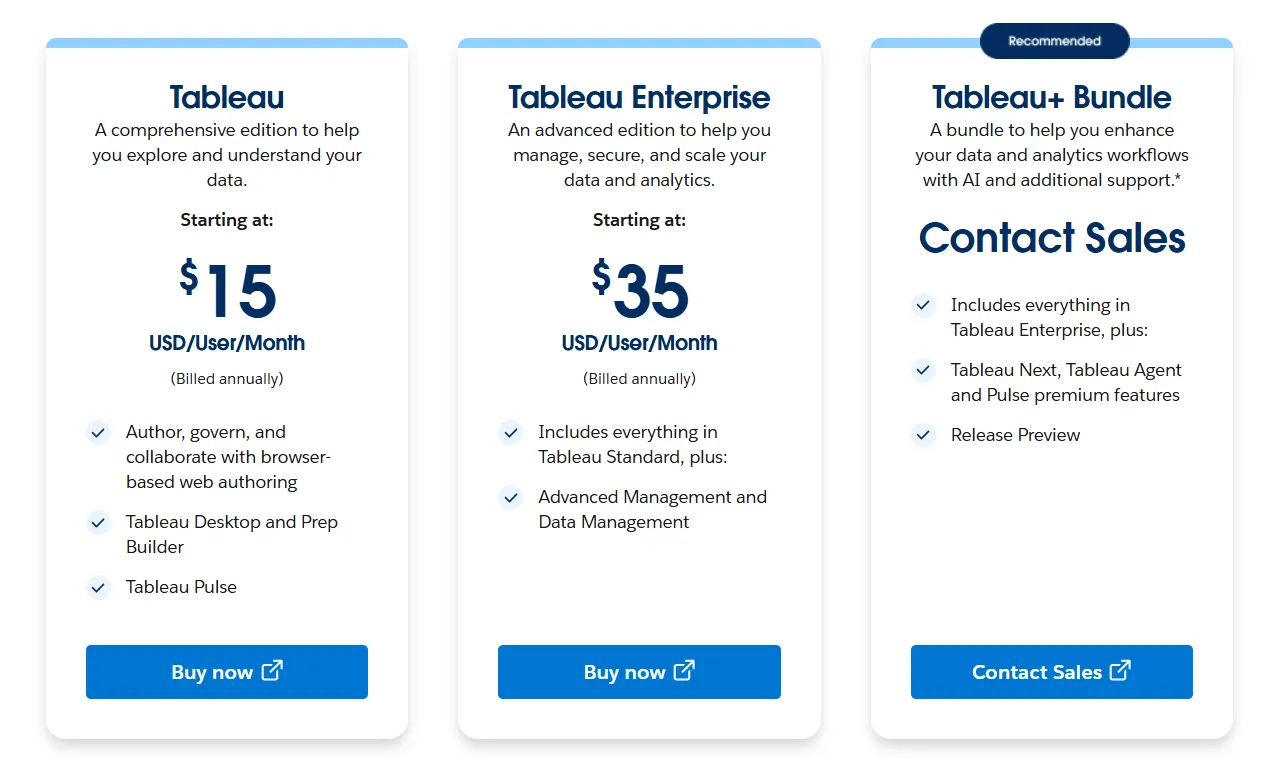
Tableau prices per user each month on annual billing, split by role, and every deployment needs at least one Creator license.
- Tableau Cloud has three pricing plans:
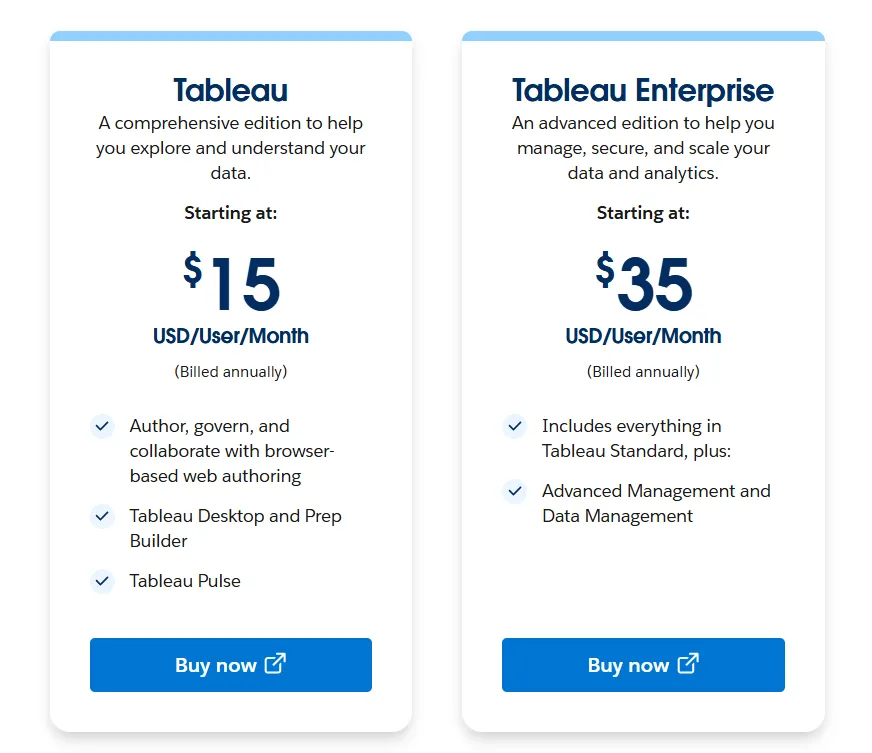
- Tableau Standard: Starts at $15/user/month, which includes browser-based authoring and collaboration, Tableau Desktop and Prep Builder, Tableau Pulse for metrics and insights.
- Tableau Enterprise: Starts at $35/user/month and includes everything in Standard, plus Advanced Management and Data Management for governance and scale.
- Tableau+ Bundle (Cloud + AI): Custom pricing, includes everything in Tableau Enterprise, plus Tableau Next, Tableau Agent, and Pulse premium features, with access to release previews and early AI capabilities.
- Tableau Server has two pricing plans:
- Tableau Standard: Starts from $15 per user/month, which includes authoring, governance, and collaboration and Tableau Desktop and Prep Builder.
- Tableau Enterprise: Starts from $35 per user/month, which includes everything in Standard, plus Advanced Management, Data Management, and eLearning.
- Tableau Next (agentic analytics) has 2 plans:
- Tableau Next: Starts from $40/month/seat, and includes Agentforce Tableau, Tableau Semantics, and its Native Slack integration.
- Tableau + Bundle: Custom pricing, which includes everything in Tableau Enterprise, plus Tableau Next, Tableau Agent and Pulse premium features.
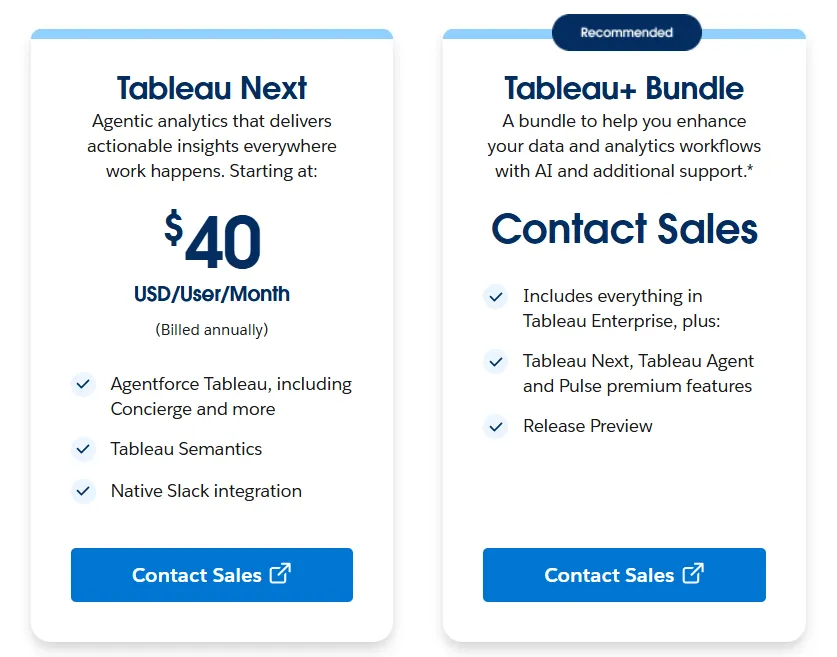
Tableau pros and cons
✅ Role-based licensing keeps read-only finance users cheap.
✅ Visual depth few platforms match.
✅ Pulse pushes metric changes without anyone opening a dashboard.
❌ Per-user pricing can scale fast for organizations rolling out broadly.
#9: Qlik Sense
Best for: Regulated industries needing on-premise deployment and no ceiling on how many people read a report.
Similar to: Tableau, ThoughtSpot.
Selecting one value in Qlik Sense refilters every other chart at once, showing what relates to that selection and what has been excluded, with no predefined query path.
A controller chasing an unexpected cost movement across entities gets real value from that free-form exploration, and Qlik has layered agentic AI over it.
Qlik Sense's top features
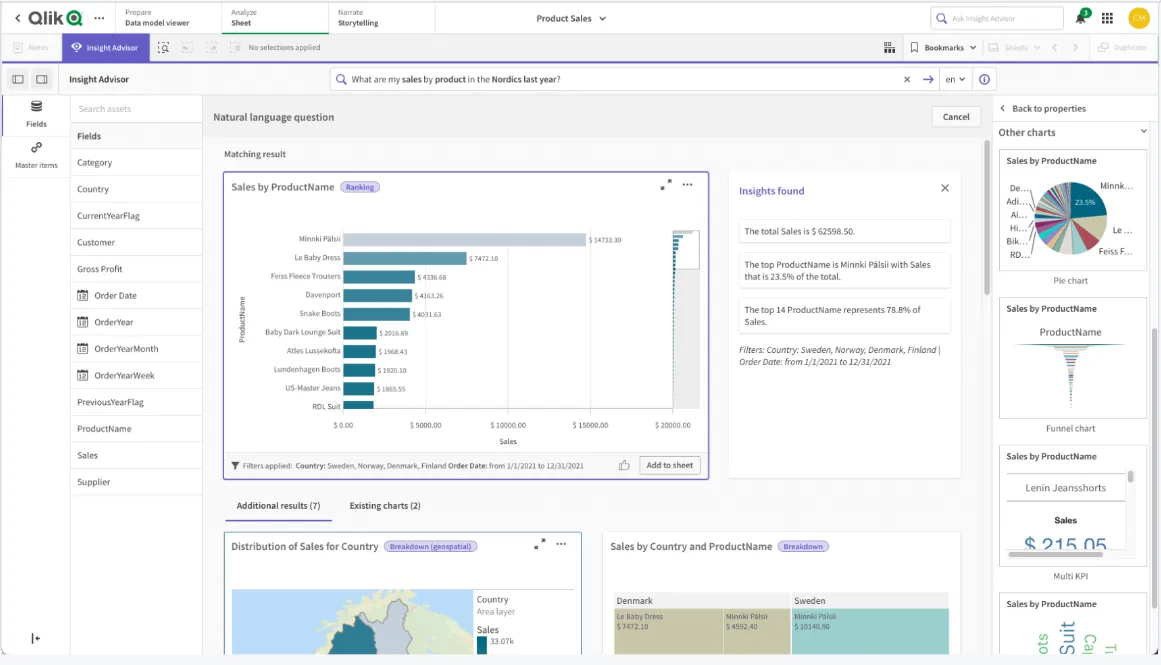
- Associative engine: Any value you pick sends every other chart into recalculation around it, which suits the kind of exploring where the question is not fully formed yet.
- Qlik Answers: An agentic assistant fielding natural-language questions, reaching into unstructured documents as well as modeled data.
- Qlik Predict: Predictive analytics through automated machine learning, available from the Premium tier, for forecasting work.
- Data lineage connectors: Available on Premium, for tracing where a reported figure originated.
Qlik Sense pricing
Qlik Cloud Analytics (the SaaS version of Qlik Sense) has four pricing tiers, all billed annually:
- Starter: $300/month, includes 10 users, 10 GB of data for analysis (fixed), AI-powered analytics, 100s of standard data source connectors, interactive dashboards, 5 GB max app size, and Qlik Community Support.
- Standard: $825/month, starts with 25 GB of data for analysis (additional capacity available in 25 GB increments), includes everything in Starter, plus user access for all, GenAI for unstructured data, managed and shared spaces, 1 GB of Personal Space, augmented advanced analytics, and 24x7 critical support.
- Premium: $2,750/month, starts with 50 GB of data for analysis (additional capacity in 25 GB or 250 GB packs), includes everything in Standard, plus predictive analytics powered by automated machine learning, additional GenAI capacity, anonymous access, SAP and Mainframe connectors, data lineage, 10 GB max app size, and guided customer success onboarding.
- Enterprise: Custom pricing, starts at 250 GB of data for analysis, includes everything in Premium, plus greater capacity for reporting, automations, machine learning models, and dataset size, 15 GB apps as standard (up to 50 GB per app available), 3 GB of Personal Space, multi-region tenants, and a personalized customer success plan.
Qlik Sense pros and cons
✅ Unlimited users above the Starter tier.
✅ Self-hosted deployment remains available, quoted outside the published tiers.
✅ Lineage connectors trace a reported figure to its origin.
❌ One user on G2 mentions that sometimes there are loading issues, especially when business intelligence is running updates.
#10: Domo
Best for: Mid-market and enterprise buyers consolidating ingestion, reporting, automation, and apps under one vendor.
Similar to: Power BI, Tableau.
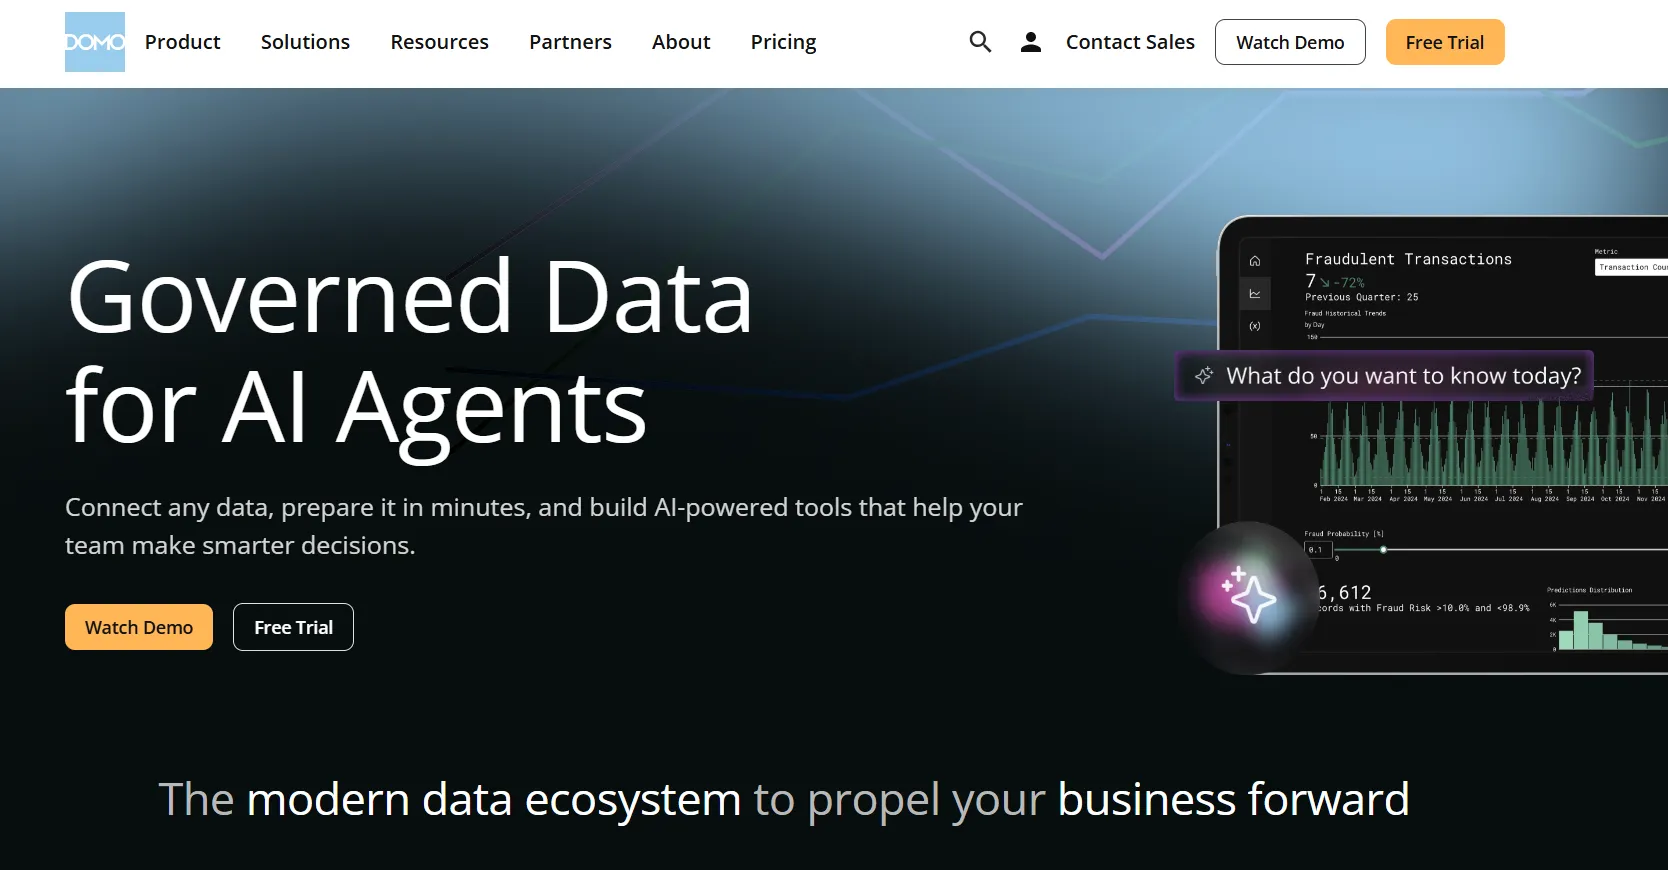
One vendor, one platform, and Domo covers the path from the source system through to the app built on top of it.
Domo connects an ERP or billing system, turns what arrives into live dashboards, and supports low-code apps over the result.
Domo's top features
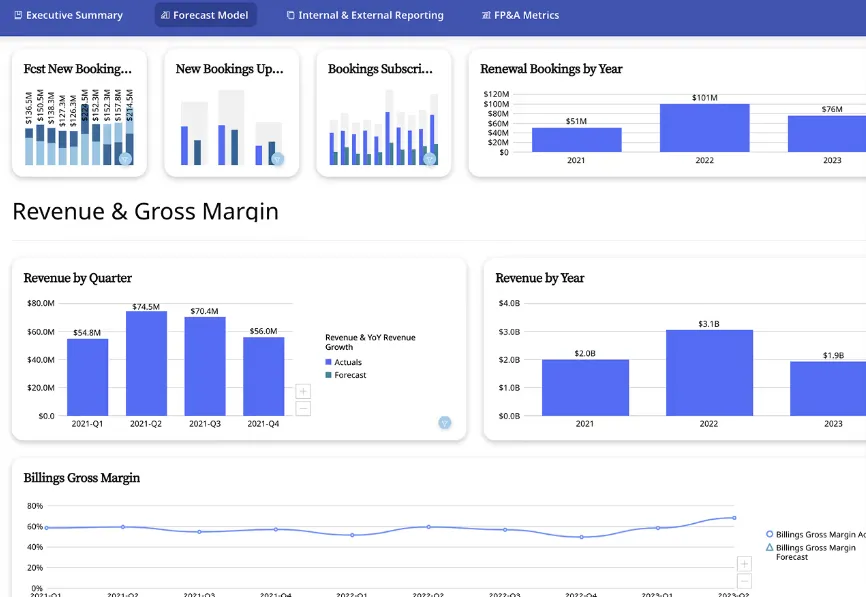
- Broad connector library: More than a thousand connectors pull finance data in from accounting, billing, CRM, and payment systems with little setup.
- Cards and dashboards: Financial reports assembled from modular Cards that refresh in real time and embed into portals.
- AI agents and chat: Natural-language questions on your data, plus agents assigned to a metric that raise an alert the moment a threshold breaks.
- Low-code app studio: Forecasting, planning, and monitoring apps shipped without much engineering involvement.
Domo pricing
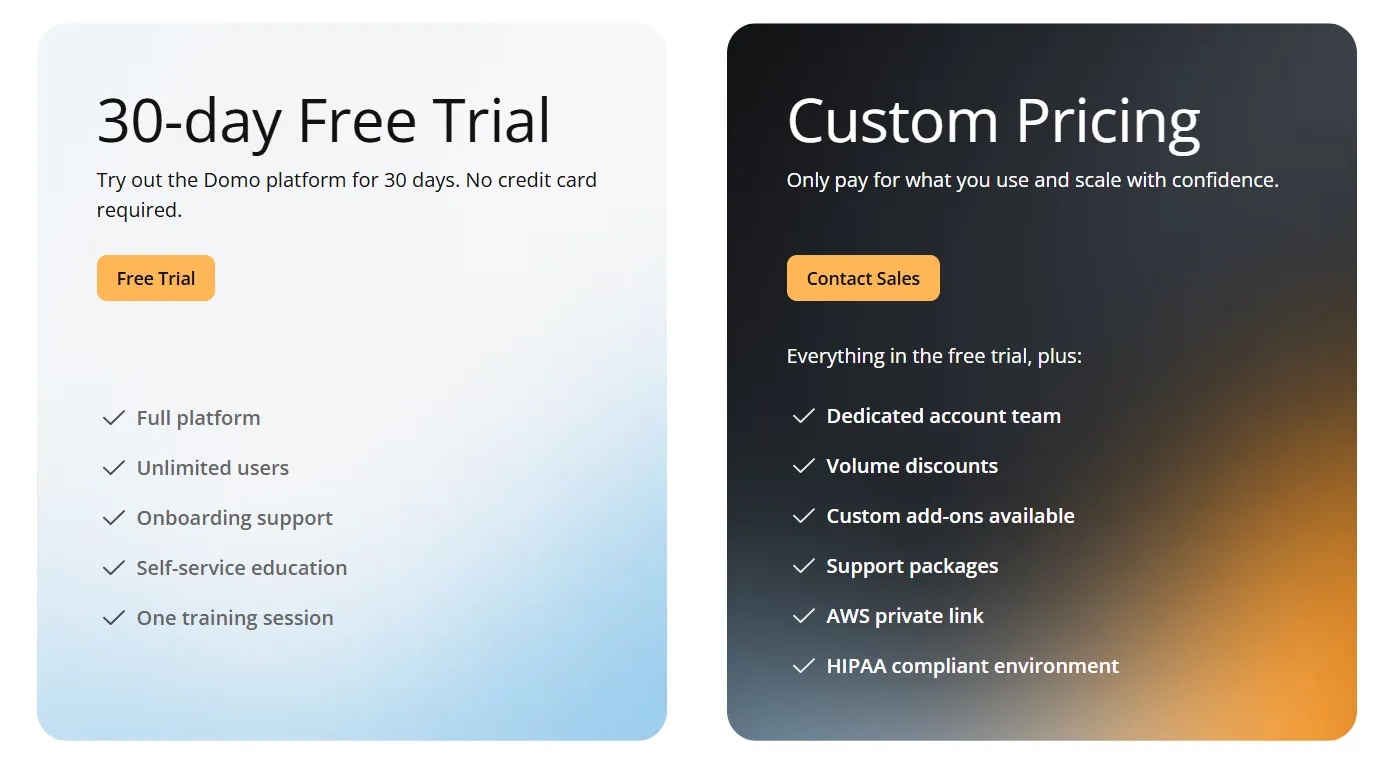
Domo's pricing page offers a trial or a quote, and nothing in between.
- Free trial: 30 days, no credit card, full platform access for unlimited users, plus onboarding support and a guided training session.
- Paid: consumption credits that scale with how hard the platform is worked, plus volume discounts, purchasable support packages, a named account team, private connectivity through AWS PrivateLink, and a HIPAA-ready environment.
Domo pros and cons
✅ One platform from raw source system to automated action.
✅ Ingestion is rarely the bottleneck, given the connector count.
Get started with Dot for free
That's the 10 best AI tools for financial analysis in 2026, from spreadsheet surfaces that write budgets back to the warehouse through to the reporting platforms most finance departments already run.
Several will serve a finance function well, and a few cover ground Dot deliberately leaves alone.
Dot works from the other end: the analysis and the periodic review arrive already written, in whichever channel your finance team happens to use, drawn from the models your data team already looks after.
Your finance and data teams get:
- Variance and spend questions answered in the same thread they were asked, whether that thread is in Slack, Microsoft Teams, an email, or the web app.
- Deep Analysis taking a "why did this move" question and investigating it from several angles before reporting back.
- Recurring business reviews written from warehouse data and delivered as prose or a finished PowerPoint.
- A lineage map and a signed query behind every figure, so a number survives scrutiny from finance and from audit.
- A Context Agent holding metric definitions steady, with changes routed through admin approval and testable in an isolated environment first.
- Warehouse and semantic-layer connections spanning Snowflake, BigQuery, Redshift, Databricks, dbt, Looker, and Power BI, under SOC 2 Type II certification, with no seat limit on any paid tier.
➡️ Get started for free with Dot's free plan, or schedule a demo to see how it works with your data.
⚠️ Disclaimer: This article was last updated on August 19 2026. If you spot any inaccuracies, please do contact us, and we'll fact-check it.
Theo Tortorici
Theo writes about AI-powered analytics, data tools, and the future of business intelligence at Dot.