
10 Best Qlik Sense Alternatives & Competitors In 2026
In this Qlik Sense alternatives article, I’ll walk you through ten options across AI-native analytics, self-service BI for business teams, and enterprise BI platforms, with features, pricing, and pros and cons for each.
TL;DR
- Dot leads as the strongest Qlik Sense alternative, as it delivers full written analysis instead of charts to interpret, runs on a Context Agent that maintains shared business definitions across teams, and offers root cause analysis.
- ThoughtSpot, Domo, and Zoho Analytics are the next tier of AI-driven options, each leaning into natural-language interaction with a different go-to-market focus.
- Metabase, Sigma, and Omni cover the self-service lane for teams that want to point their business users at live warehouse data and let them work.
- Tableau, Microsoft Power BI, and Looker round out the list as the enterprise BI standards, and each has a long track record at large organizations.
What are the best Qlik Sense alternatives in 2026?
The best Qlik Sense alternatives are Dot, ThoughtSpot, and Domo.
Here’s the full breakdown of the 10 alternatives I shortlisted:
Tool | Use Case | Price |
Dot | Conversational AI analyst that turns business questions into written answers and ships scheduled executive reports straight to Slack or Teams. | Free plan; Paid from $180/month. |
ThoughtSpot | Search-bar analytics with AI agents that generate dashboards and explanations from plain-language prompts. | From $25/user/month (annual). |
Domo | End-to-end cloud BI bundling ingestion, modeling, dashboards, automation, and AI agents in one platform. | Custom pricing (30-day free trial). |
Zoho Analytics | BI suite with Zia conversational AI, 250 no-code data transformations, and 50 chart types at mid-market pricing. | From $60/month. |
Metabase | Open-source analytics for SQL and non-SQL users, with Metabot AI for plain-language querying and lightweight embedding. | Free (Open Source); Cloud from $100/month. |
Sigma | Excel-style workbooks running live against Snowflake, BigQuery, Databricks, or Redshift, popular with finance teams. | Custom pricing. |
Omni | Warehouse-native BI built on a flexible semantic model with AI baked into the exploration flow. | Custom pricing (free trial). |
Tableau | Drag-and-drop visual analytics with Tableau Next agents and Agentforce-driven natural-language analysis. | From $15/user/month. |
Microsoft Power BI | Microsoft-stack BI for dashboarding, paginated reports, and Copilot-assisted exploration at enterprise scale. | Free plan; Pro from $14/user/month. |
Looker | LookML-based semantic layer that keeps metrics consistent across dashboards, reports, and embedded apps. | Custom pricing (annual contract). |
What are the best AI-native analytics platforms?
This group is for teams who'd rather get an answer than build another chart.
The platforms here don't all work the same way.
Some lean on a search bar, some on agents that produce reports, and one of them writes the analysis for you instead of handing back a visualization to interpret:
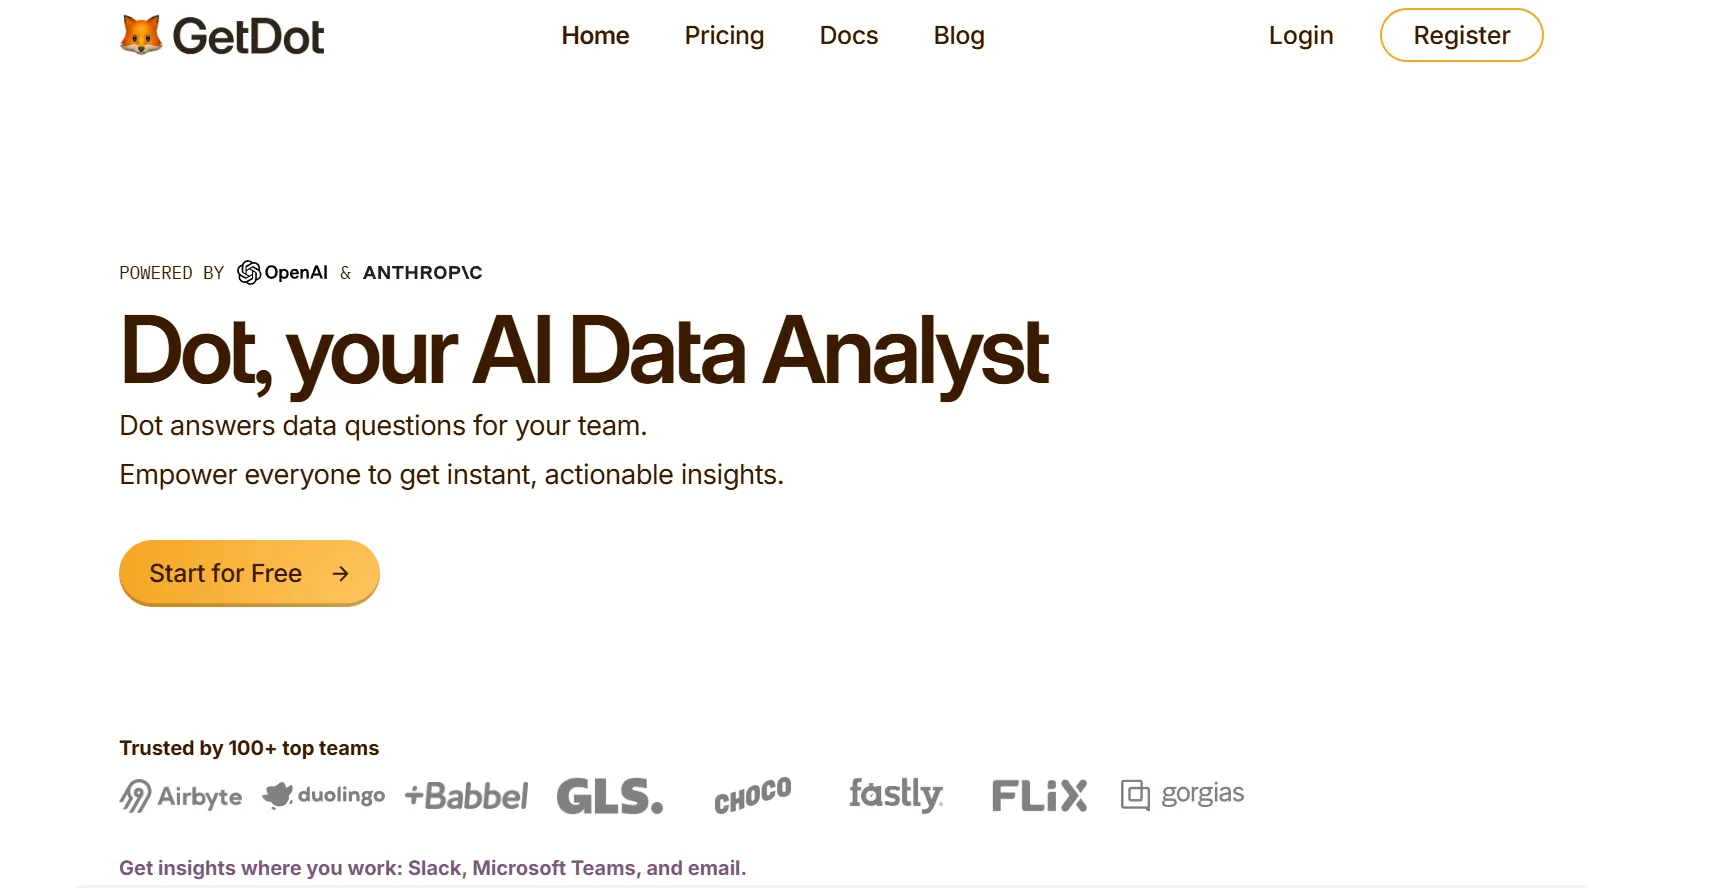
#1: Dot
Dot offers the best alternative to Qlik Sense with its AI data analyst that connects directly to your data warehouse and does the analysis for you.
So, instead of spending time building dashboards, writing DAX, or maintaining reports, your analytics team can ask Dot real business questions and get clear, narrative answers with recommendations in minutes.
Moreover, our AI data analyst automatically produces executive-ready business review reports, handles ad-hoc analysis in Slack or Teams, and maintains shared business context so insights stay consistent across teams.
What that means for you is that Dot will replace a huge amount of manual reporting and analyst back-and-forth rather than adding yet another BI layer.
Here are some of the key features that make Dot a powerful AI-native Qlik Sense alternative:
Ad-hoc deep data analysis via Slack or Teams
We know that most questions that people ask day-to-day aren’t clean.
Someone asks, “Why did conversion drop last week?” or “What changed in EMEA compared to last month?” and the answer usually involves jumping between dashboards, tweaking filters, or asking an analyst to run a custom query.
Dot removes that back-and-forth by letting teams ask business questions directly in Slack or Microsoft Teams.
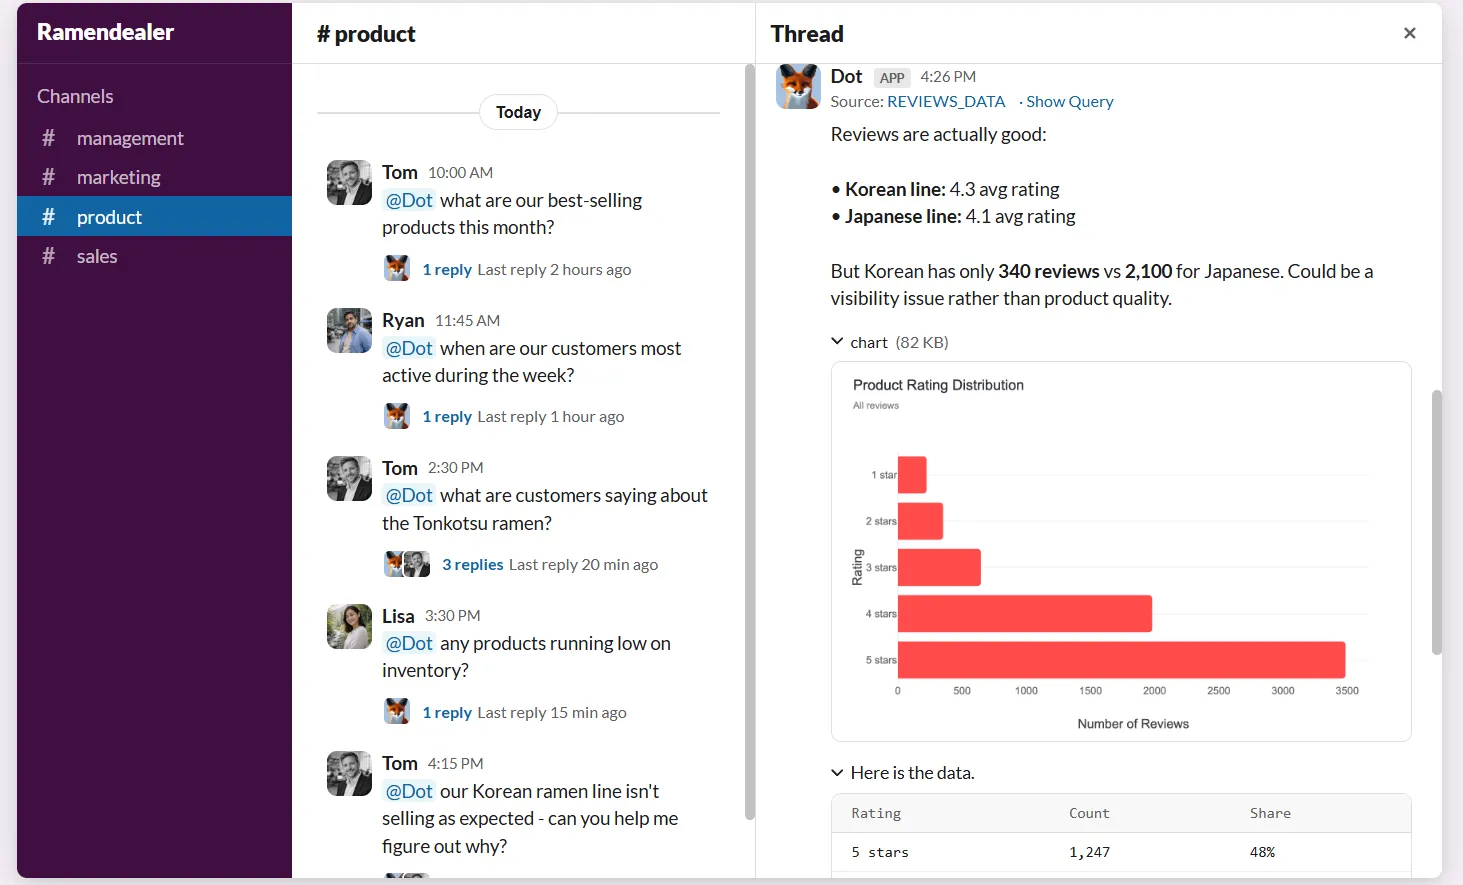
Instead of navigating dashboards or waiting in an analyst queue, you and your team can ask a question and get a full analysis back in minutes.
And the response doesn’t just show numbers: it explains what’s happening, why it’s likely happening, and which segments, regions, or metrics are driving the change.
Our customers find this especially useful because it absorbs a large volume of ad-hoc requests that would normally interrupt planned data analytics work.
Your team will get faster answers without needing to learn tools like Power BI, SQL, or data models, while your analysts will regain time to focus on deeper, higher-impact analysis instead of having to pull “one more chart.”
Persistent business context & shared definitions with Dot’s Context Agent
We’ve seen how metrics get defined slightly differently across reports, dashboards multiply, and soon enough, teams are debating numbers instead of acting on them.
Even when everyone is using the same tool, there’s no guarantee they’re using the same logic.
Dot addresses this with a Context Agent that learns and maintains business definitions, metric logic, and documentation across your data environment.
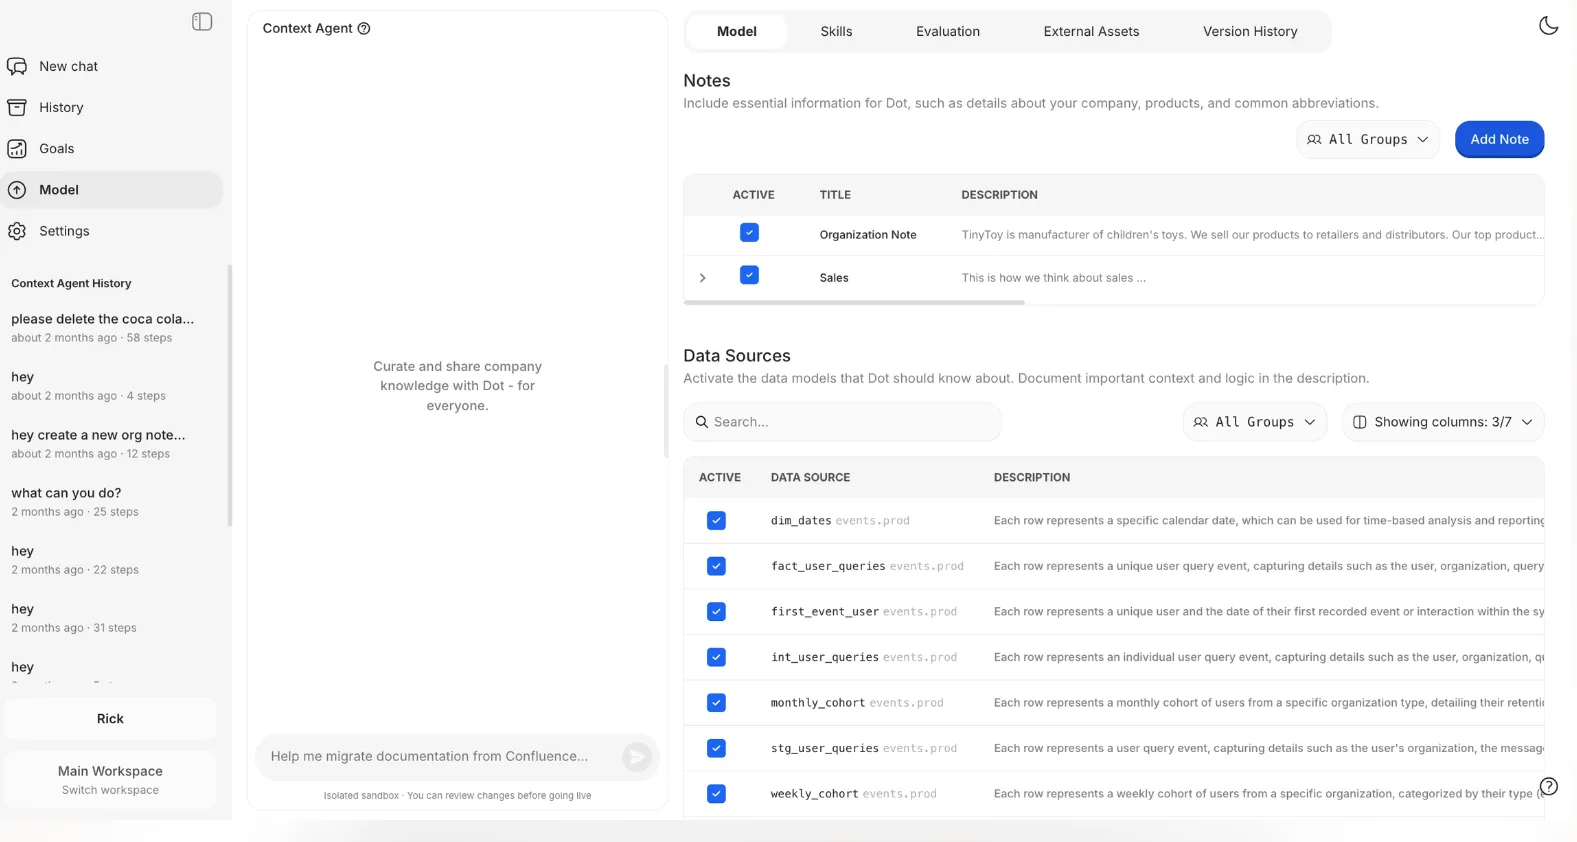
Our AI data analyst keeps track of how key metrics are calculated, what tables should be used, and how different teams talk about the same concepts, then applies that context consistently whenever it generates an insight or report.
In practice, this means stakeholders stop asking “Which dashboard is right?” or “How is this metric defined here?”
Every answer Dot gives is actually grounded in the same shared understanding of the business, which reduces confusion, builds trust in the data, and prevents the slow erosion of confidence that often happens in large environments.
Automated business review reports
One of the main reasons teams use enterprise-grade BI analytics tools is to prepare weekly or monthly business reviews for leadership.
In practice, that usually means analysts spending hours refreshing dashboards, double-checking numbers, exporting slides, and then explaining what changed and why.
The dashboard shows the data, but the actual analysis still lives in the analysts’ head or in meeting notes.
Dot approaches this differently by automating the entire business review, not just the visuals.
Our platform can generate executive-ready reports on a set schedule (daily, weekly or monthly) directly from the data warehouse, and turn raw metrics into a written narrative that explains what happened, what changed compared to previous periods, and where your attention is needed.
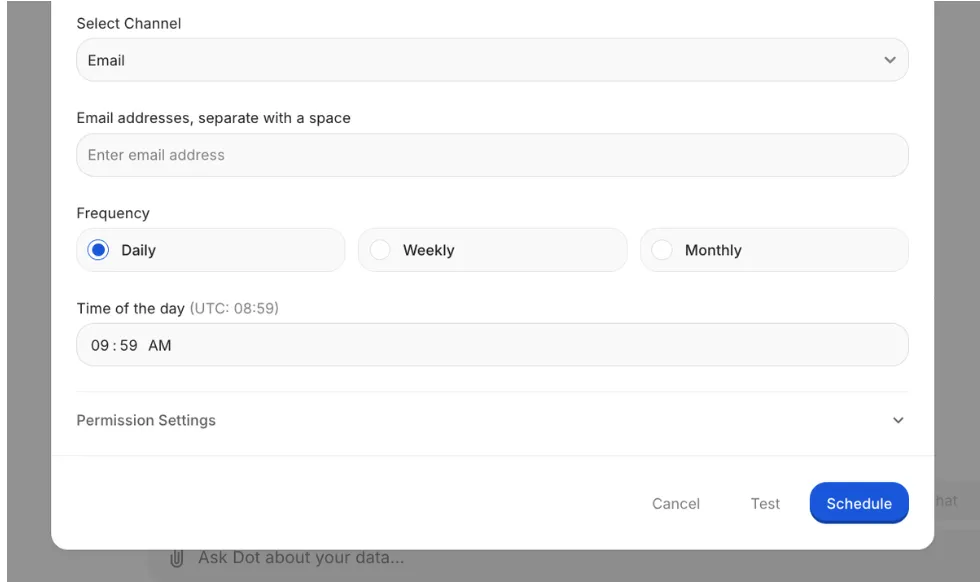
The end result is a reporting process that’s going to be easier for you to maintain and even easier to act on.
Leadership gets a consistent, easy-to-read business update without needing to interpret dashboards, and data teams stop spending a large portion of their time producing the same reports over and over again.
Full audit trail for every insight
Dot attaches a full audit trail to every insight it produces.
Each answer or report links directly back to the underlying SQL queries, Python logic, and datasets used to make it clear exactly where the numbers came from and how they were calculated. Everything is inspectable.
This matters especially for analysts who need to stand behind the numbers.
Instead of saying “the dashboard says so,” you can trace insights back to the source of truth, validate them quickly, and move forward with confidence.
The AI data analyst turns analytics from something you hope is correct into something you can actually verify.
Dot’s integrations
Dot is designed to work on top of the tools your team already uses, rather than forcing data into a new BI-specific model.
Our solution connects directly to modern data warehouses like Snowflake, BigQuery, Redshift, Databricks, and even operational databases such as Postgres, MySQL, and SQL Server, so analysis happens where the data already lives.
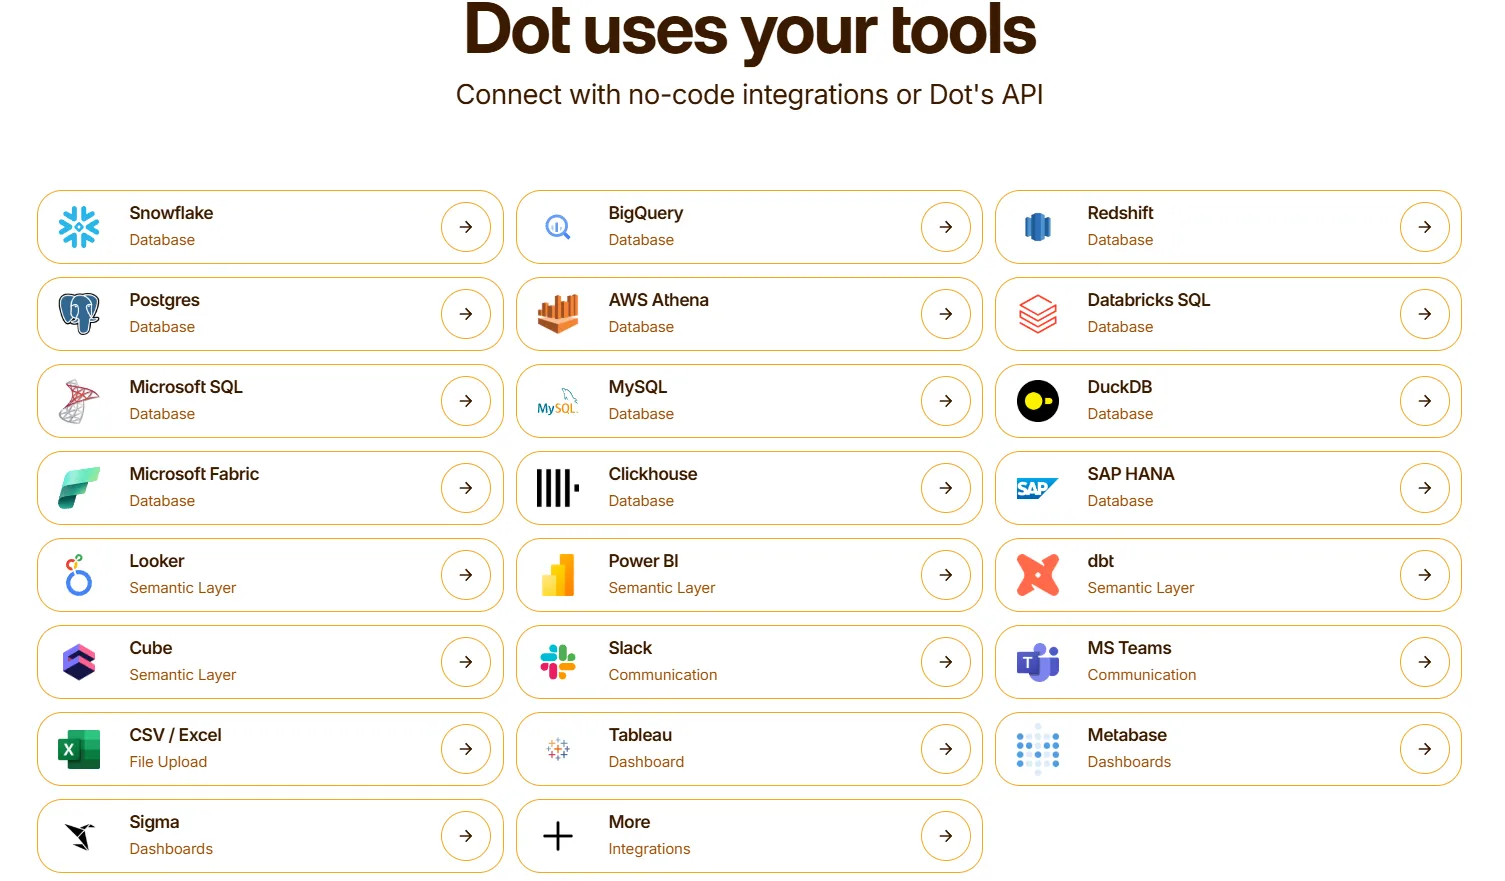
Beyond raw data access, Dot also integrates with semantic layers and transformation tools like dbt, Looker, Power BI models, and Cube.
That means it can reuse existing business logic and metric definitions instead of recreating them inside yet another analytics tool, which is a common pain point with traditional BI setups.
Dot also fits into day-to-day workflows by delivering insights through Slack, Microsoft Teams, email, and the web app, rather than asking users to log into dashboards.
Moreover, our AI data analyst can sit alongside existing BI tools like Tableau, Metabase, or Sigma.
What makes Dot different from Qlik Sense and other AI analytics tools?
Qlik Sense and Qlik's broader platform have moved firmly into agentic territory.
Qlik Answers acts as a conversational entry point, the agent network covers discovery, analytics, knowledge retrieval, prediction, and action, and Qlik Reporting Service handles scheduled PowerPoint, tabular, and PixelPerfect reports across email, cloud storage, and SharePoint.
The associative engine still runs underneath all of it, and the platform is genuinely deep.
Dot solves an adjacent problem with a different architecture, and the cleanest way to think about the difference is across three dimensions.
- The first is where each tool reads from.
Qlik's model brings data into the Qlik environment via load scripts and apps, then layers AI and reporting on top of the associative engine.
Dot reads from your existing warehouse (Snowflake, BigQuery, Redshift, Databricks) and your existing semantic layer (dbt, Looker, Power BI models, Cube), without asking you to copy or reshape data into a new system.
The Context Agent grounds itself in the definitions and documentation your team has already written elsewhere, rather than asking you to rebuild that work inside the analytics tool.
- The second is what the tool produces.
Both platforms generate scheduled reports and respond to natural-language questions.
The artifact Dot ships is a written analysis with the supporting math, the SQL that ran, and any Python used in the calculation, all linked together so a reviewer can trace every number back to its source.
Charts appear inside Dot's answers when they help the explanation, not as the destination.
- The third is where the analysis shows up.
Qlik's primary surface is the Qlik app, with reports going to email, cloud storage, and SharePoint.
Dot delivers natively into Slack and Microsoft Teams, where most operational conversations actually happen.
Dot pricing
Dot offers a free plan with 300 one-time credits and full access to Pro features, so teams can try the platform before spending anything.
There are three paid plans:
- Pro: $180/month, 150 credits per month, $1.80 per credit overage, unlimited users.
- Team: $720/month, 800 credits per month, $1.44 per credit overage, SSO, row-level security, embedded analytics, BI migration support, and dedicated support.
- Enterprise: Custom pricing, unlimited credits, volume discounts, self-hosted deployment, audit logs, SLA, and a dedicated account manager.
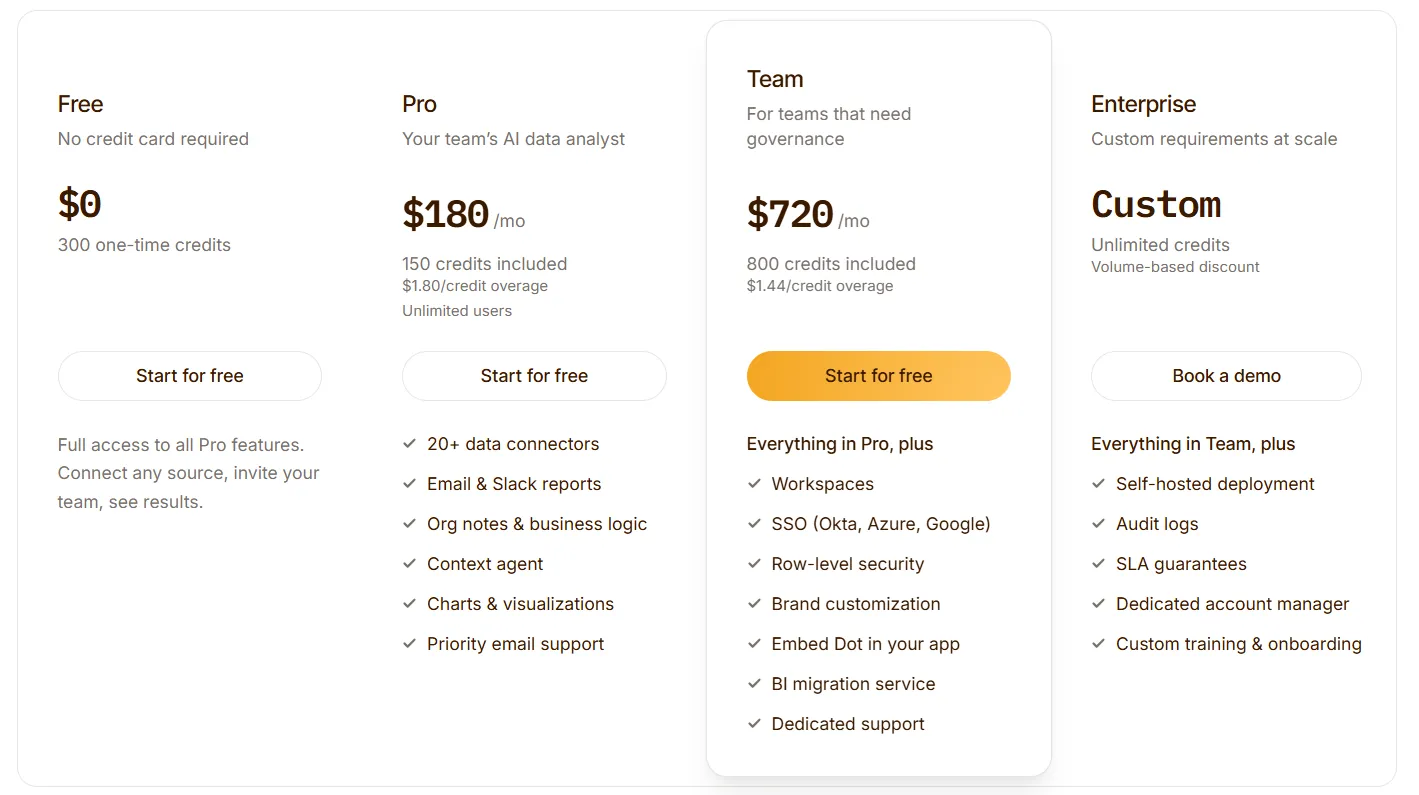
➡️ Annual billing saves 10% across all paid plans.
Dot pros and cons
✅ Written analysis as the deliverable.
✅ Recurring executive reports run themselves.
✅ Footnoted audit trail behind every answer.
✅ Context Agent keeps cross-team definitions aligned.
✅ Runs on top of your existing warehouse and semantic layer.
✅ Credit-based pricing tied to usage, not seats.
❌ Not a dashboarding tool.
❌ Requires a connected warehouse.
#2: ThoughtSpot
Best for: Teams that want a search-bar interface to data instead of a dashboard library, and AI agents that generate analyses on prompt.
Similar to: Dot,MindsDB.
You type a question into ThoughtSpot's search bar, and a chart appears.
That's the platform's core premise, and over the past decade, the layer underneath it has grown to include AI agents, embedded analytics, and governance for enterprise rollouts.
ThoughtSpot's top features
- Search-based analytics: Plain-language search returns a visualization with drill-downs, no SQL required.
- Spotter AI agents: Agentic tools generate analyses, dashboards, and insights from data, including unstructured sources.
- Application embedding: Drop ThoughtSpot's search and dashboards into customer-facing products with SDK and theming control.
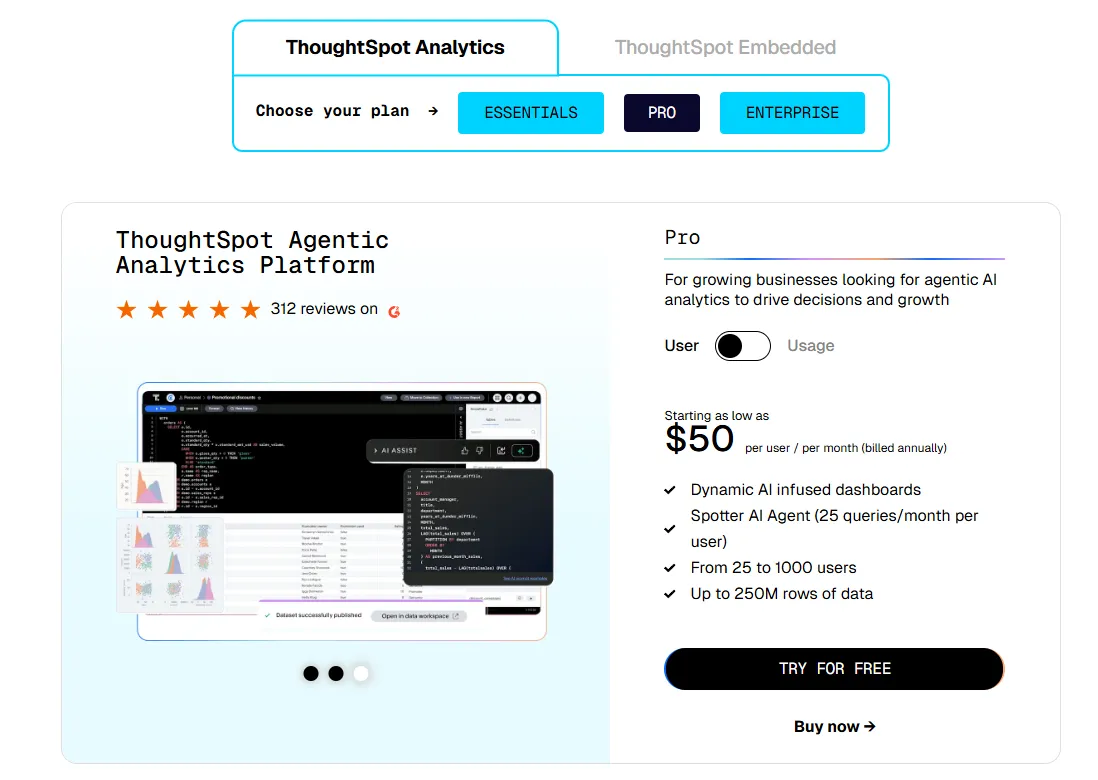
ThoughtSpot pricing
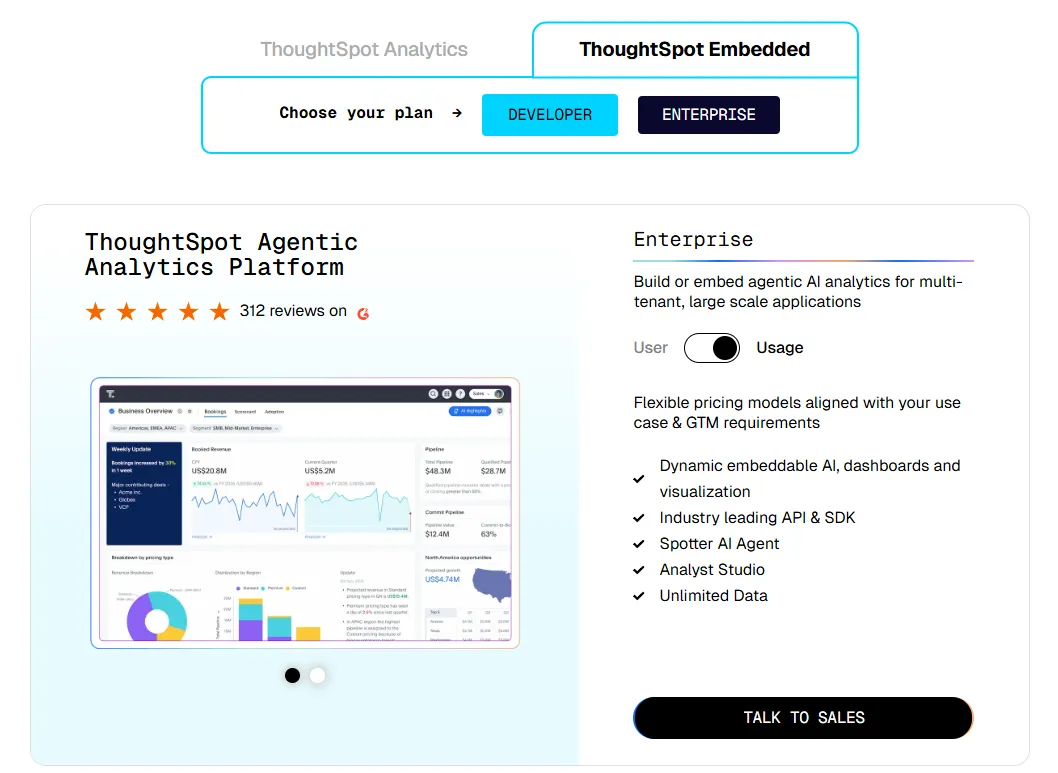
ThoughtSpot offers two separate products: ThoughtSpot Analytics for internal BI and ThoughtSpot Embedded for building analytics into applications - each with flexible pricing depending on scale and usage:
- ThoughtSpot Analytics:
- Essentials: From $25 per user per month (billed annually), for teams of 5-50 users, includes dynamic interactive dashboards and AI-powered insights and supports up to 25M rows of data.
- Pro (per user pricing): From $50 per user per month (billed annually), for 25–1,000 users, includes everything in Essentials, plus AI-infused dashboards and Spotter AI Agent (25 queries per user/month), and supports up to 250M rows of data.
- Pro (usage-based): From $0.10 per query, includes everything in Pro per user, and adds Analyst Studio.
- Enterprise (user or usage-based): Custom pricing, includes everything in Pro, plus unlimited users and data.
- ThoughtSpot Embedded:
- Developer: Free for 1 year, includes embeddable AI analytics, dashboards, and visualizations, APIs and SDKs, up to 10 users and 25M rows of data.
- Enterprise (user-based): Custom pricing, includes everything in Developer, plus unlimited data.
- Enterprise (usage-based): Custom pricing, everything in Enterprise, plus Spotter AI Agent and Analyst Studio.
ThoughtSpot pros and cons
✅ Search-bar interface is genuinely accessible.
✅ Strong governance for enterprise deployments.
❌ Two pricing structures (per user vs. usage-based) can get confusing at scale.
#3: Domo
Best for: Mid-to-large teams that want ingestion, modeling, dashboarding, and automation in a single product instead of a stack.
Similar to: Microsoft Power BI, Tableau.
Where most BI tools pick a slice (modeling, or dashboards, or automation), Domo packages all of it into one workspace and adds AI agents that can take downstream actions.
That breadth makes it a frequent shortlist entry at companies that don't want to glue three products together.
Domo's top features
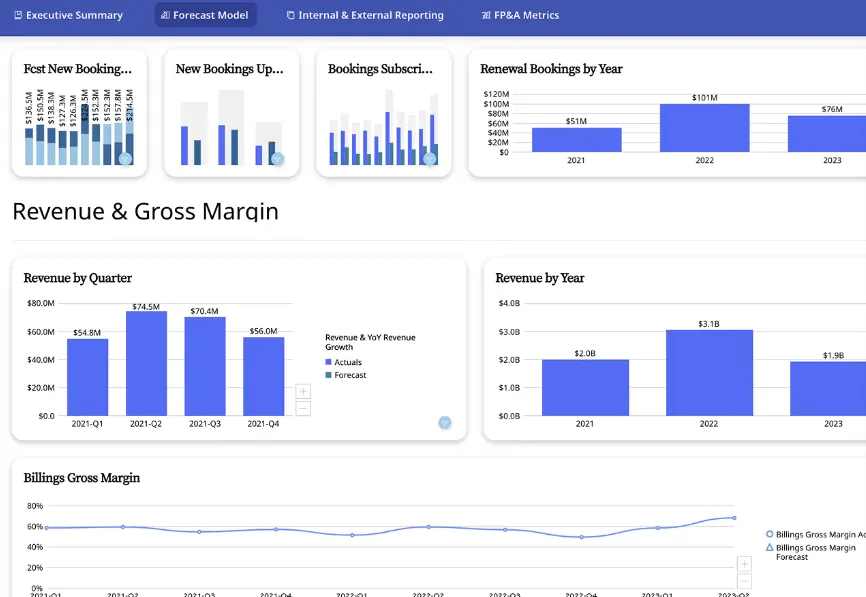
- Cards and dashboards: Reports live as modular Cards that compose into dashboards, embed into apps, or share across departments.
- App builder: Drag-and-drop tool for building forecasting, planning, or monitoring apps without code.
- AI Chat and agents: Conversational interface for asking questions, with agents that can trigger alerts, updates, or workflows downstream.
Domo pricing
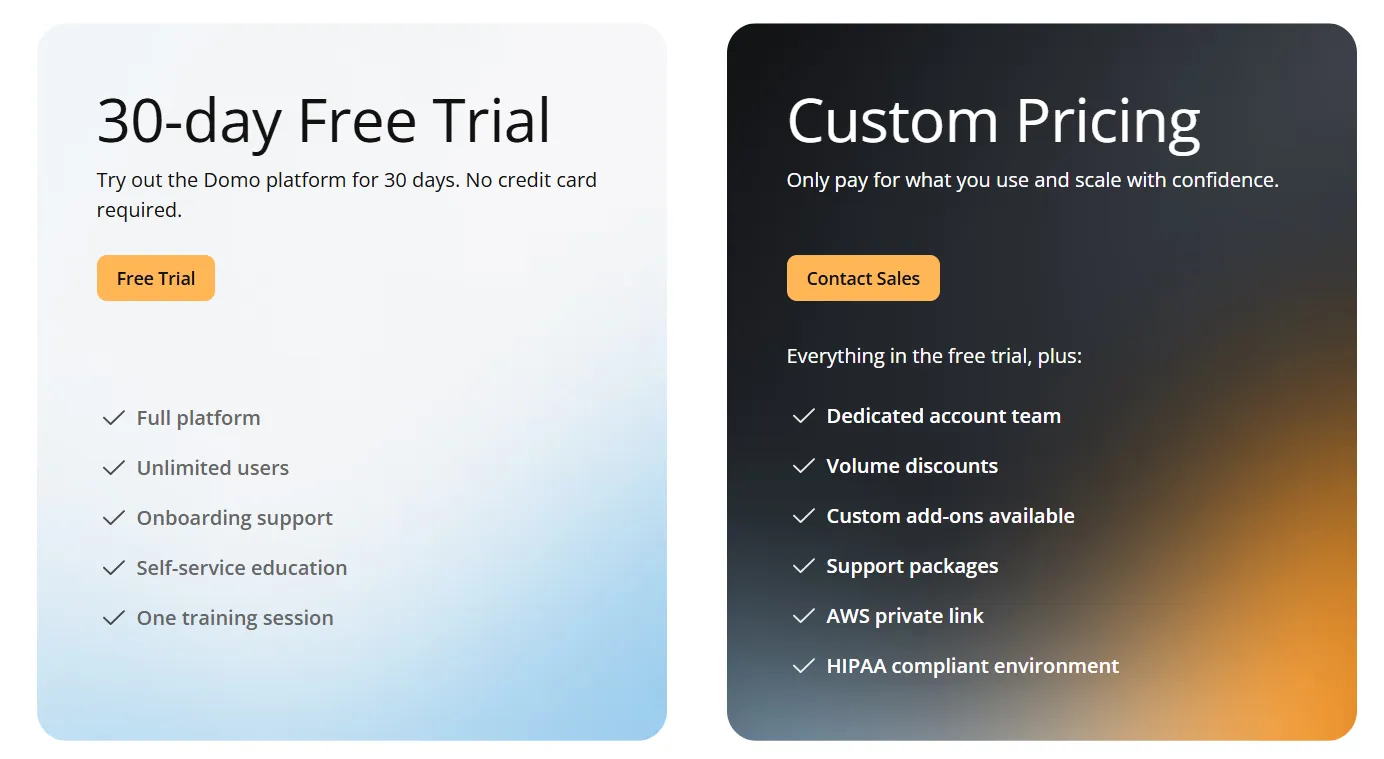
One paid plan with a generous trial:
- Free trial: 30 days, no credit card, full platform access, onboarding support, and one guided training session.
- Paid plan: Usage-based, includes everything in the trial plus a dedicated account team, volume discounts, custom add-ons, and support packages.
Domo pros and cons
✅ Genuinely all-in-one for mid-market deployments.
✅ Large connector library.
❌ Pricing is not disclosed. We covered affordable options in our Domo alternatives breakdown.
#4: Zoho Analytics
Best for: Teams that want a BI suite with built-in conversational AI, broad connector support, and pricing that doesn't require an enterprise contract.
Similar to: Microsoft Power BI, Metabase.
Zoho Analytics bundles self-service data preparation, dashboards, predictive modeling, and a conversational AI assistant called Zia, with deep ties into the Zoho ecosystem (CRM, Finance, and People).
Teams already using Zoho apps adopt it as the analytics layer, and outside that ecosystem, it shows up regularly on mid-market shortlists for buyers who want a real BI feature set without an enterprise commitment.
Zoho Analytics' top features
- Zia conversational AI: Ask questions in plain English, get charts, predictions, and written commentary back.
- Self-service data prep and metrics: 250 no-code transformations for cleaning and reshaping data, plus a central metrics layer for cross-report consistency.
- Visualizations and embedding: 50 chart types and embedded dashboards, AI assistants, or full reports into customer-facing products.
Zoho Analytics pricing
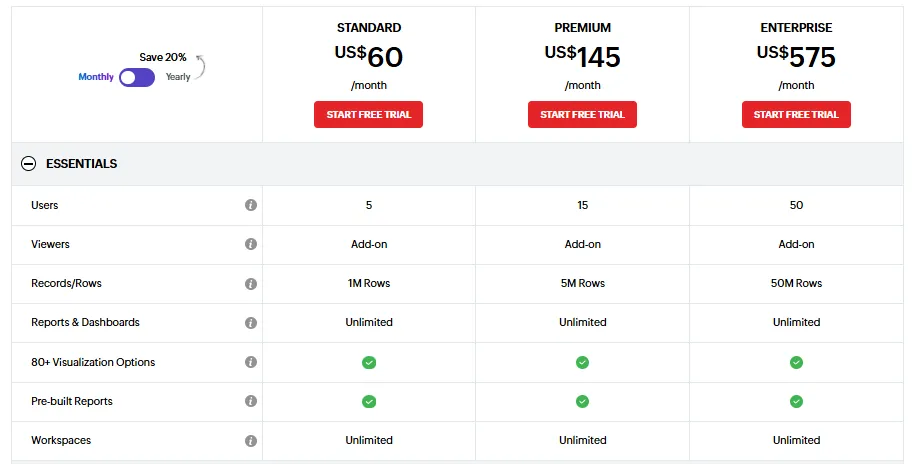
Zoho Analytics has three pricing plans:
- Standard: $60/month, includes up to 5 users, 1M rows, unlimited workspaces, reports and dashboards, and basic AI features.
- Premium: $145/month, includes up to 15 users, 5M rows, advanced data integration, and all AI features except AI Studio.
- Enterprise: $575/month, includes up to 50 users, 50M rows, advanced governance and security, and AI Studio.
Zoho Analytics pros and cons
✅ Approachable pricing for small and mid-sized teams.
✅ Native integration with Zoho's CRM, finance, and people products.
❌ The user interface is not top-notch, according to a G2 review.
What are the best self-service BI tools for business teams?
Not every team wants an AI agent in the middle of the workflow.
For teams that prefer to put analysts and business users directly in front of warehouse data, this lane is the bigger one.
The platforms here put more emphasis on direct querying, governed metrics, and embedding than on automation, and they tend to be lighter to set up:
#1: Metabase
Best for: Startups, product teams, and data-lean orgs that want fast self-service analytics with the option of embedding without enterprise BI complexity.
Similar to: Sigma, Omni.
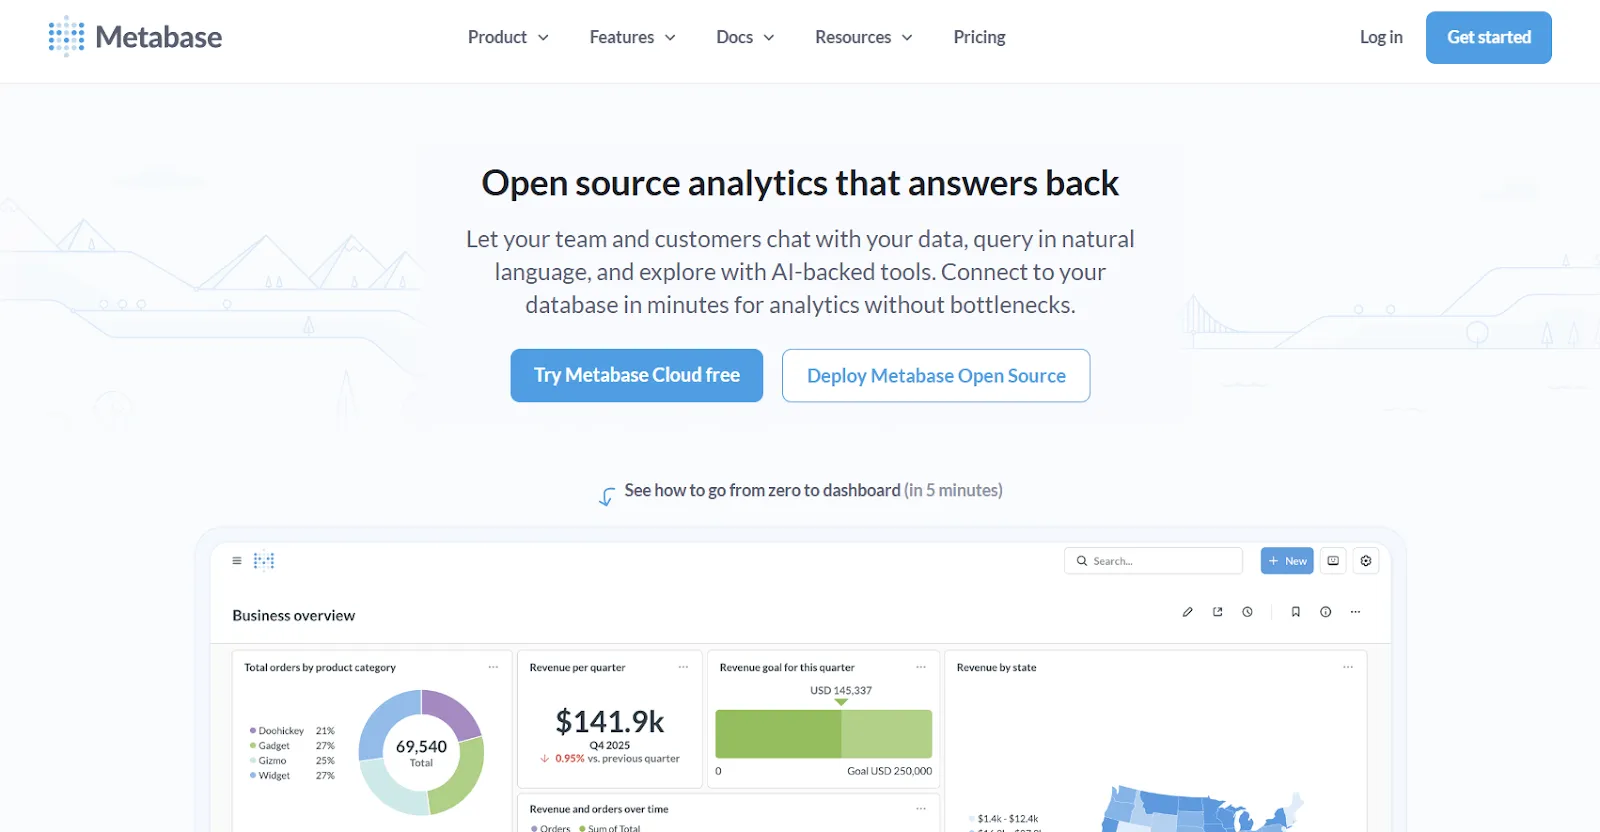
Metabase supports SQL and a no-code question builder, runs self-hosted or in the cloud, and now includes Metabot AI for plain-language querying.
Metabase's top features
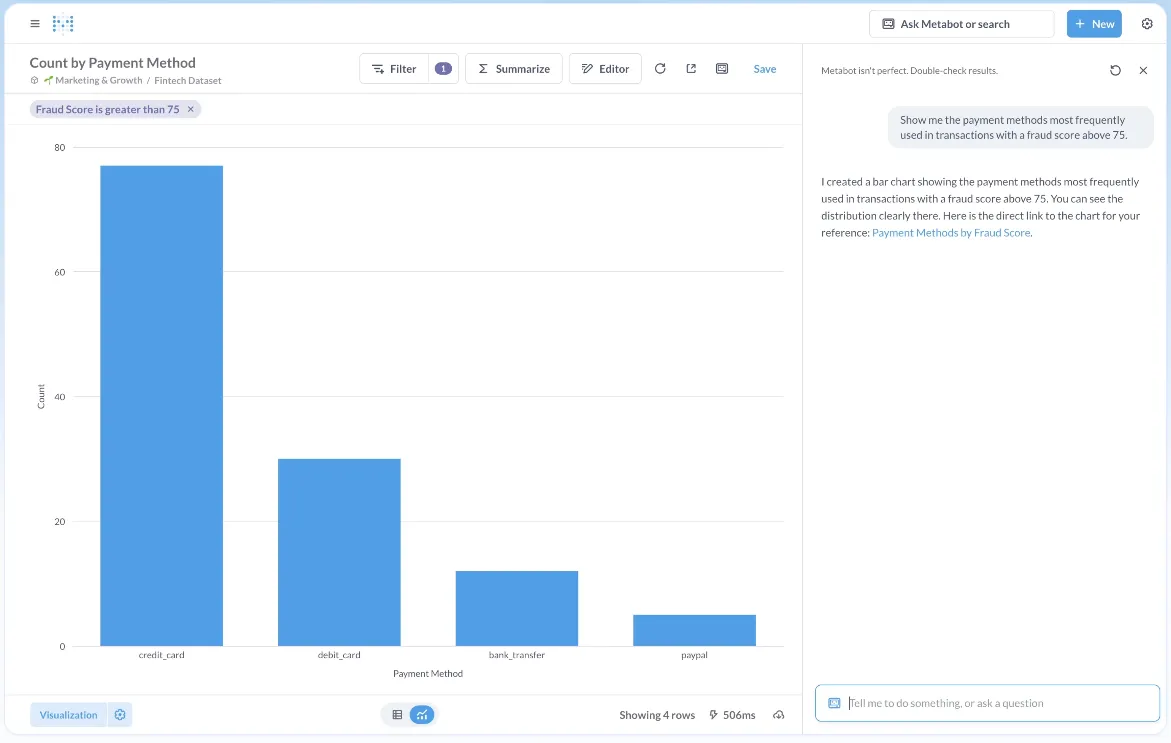
- Metabot AI: Natural-language questions translate into SQL and visualizations automatically.
- Question builder: A guided UI for joins, filters, and aggregations, with the SQL editor one click away.
- Click-to-explore: Click anything on a chart to filter, segment, or pivot without rebuilding the query.
Metabase pricing
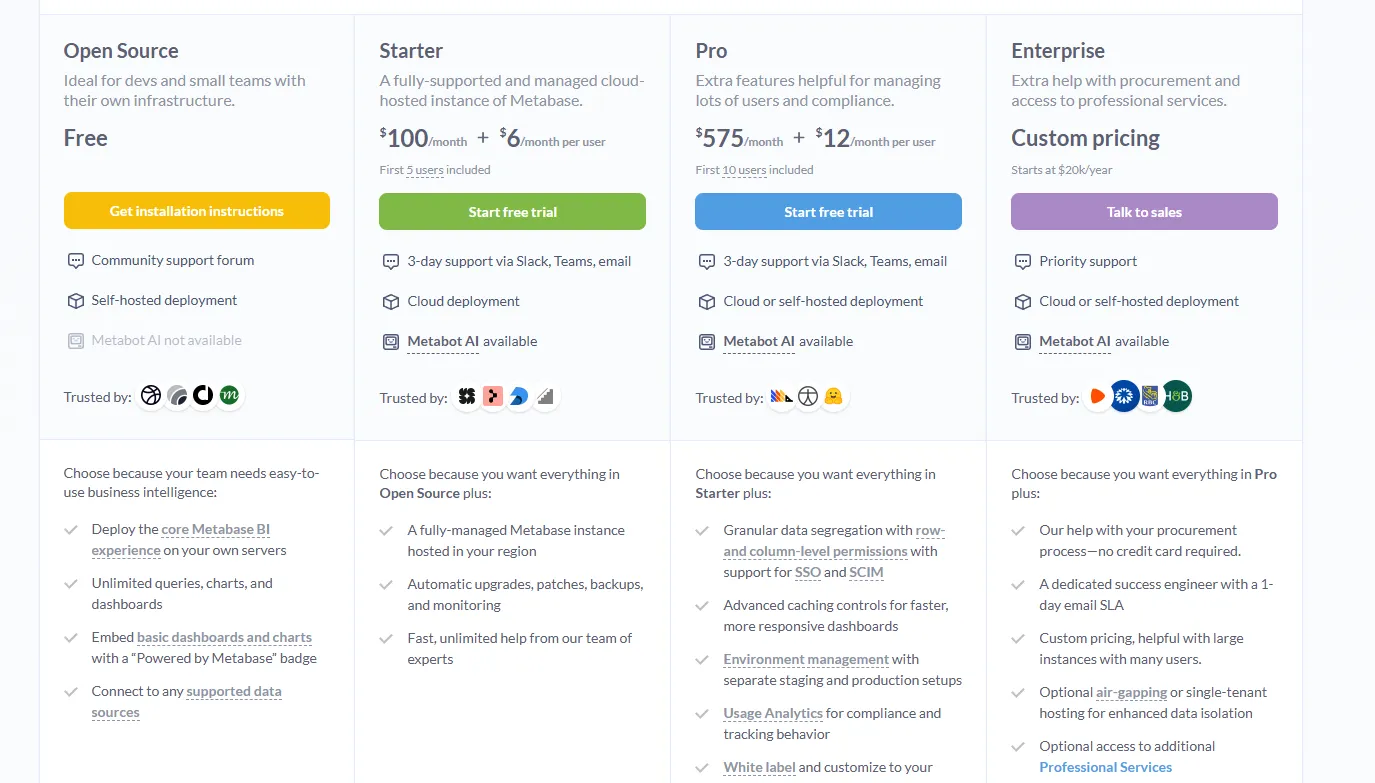
Metabase offers two pricing options depending on how you use the product: internal business intelligence or customer-facing embedded analytics.
- Business Intelligence:
- Open Source (Self-hosted): Free, self-hosted deployment, includes unlimited queries, charts, and dashboards, connects to all supported data sources, basic embedding with “Powered by Metabase” branding, community support only.
- Starter (Cloud-hosted): $100/month + $6/user/month, first 5 users included, includes everything in Open Source, plus option to include Metabot AI (charged extra), automatic upgrades, backups, and monitoring, support via Slack, Teams, and email (3-day SLA).
- Pro: $575/month + $12/user/month, first 10 users included, cloud or self-hosted deployment, includes everything in Starter, plus row- and column-level permissions, SSO and SCIM support, advanced caching and performance controls, staging + production environments, usage analytics and audit visibility, white-labeling, and embedded analytics capabilities.
- Enterprise: Custom pricing (starts at $20k/year), includes everything in Pro, plus priority support, dedicated success engineer (1-day email SLA), optional single-tenant or air-gapped deployment, and optional professional services.
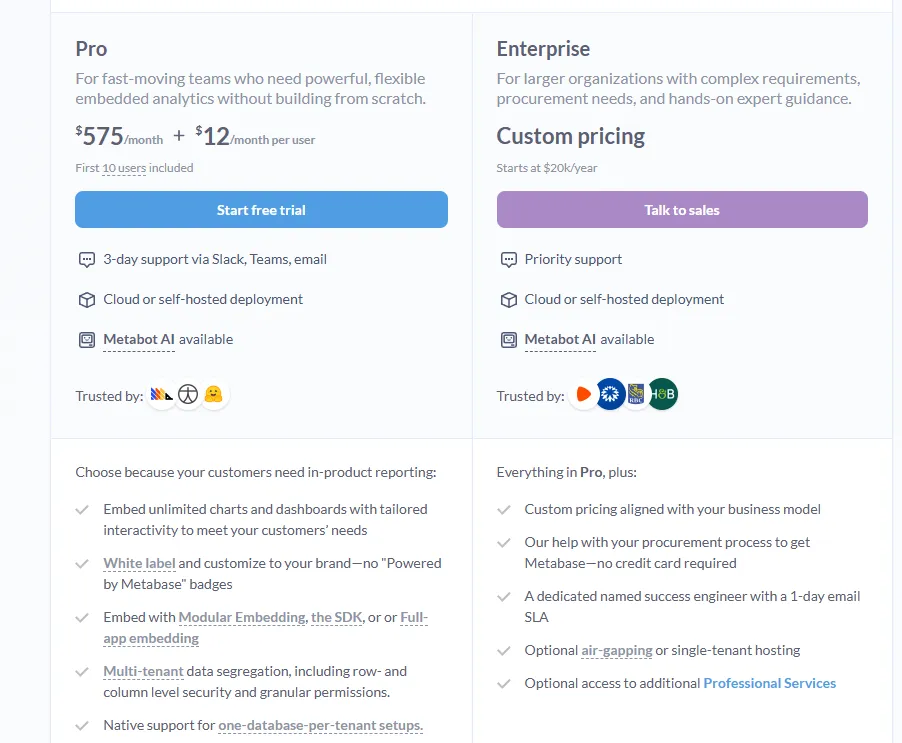
- Embedded Analytics pricing:
- Pro: $575/month + $12/user/month, first 10 users included, includes unlimited embedded dashboards and charts, full white-labeling, modular embedding, SDK, or full-app embedding, multi-tenant security (row- and column-level), one-database-per-tenant support, staging + production environments, usage analytics, internal BI for your team, and option to include Metabot AI (charged extra).
- Enterprise: Custom pricing (starts at $20k/year), includes everything in Pro, plus a dedicated success engineer, priority support, optional single-tenant or air-gapped hosting, and optional professional services.
Metabase pros and cons
✅ Open-source version is genuinely free.
✅ Setup is faster than almost any other BI tool.
❌ A user on G2 believes that Metabase could benefit from having an AI assistant that understands the databases and assists in building queries
#2: Sigma
Best for: Finance, ops, and analyst teams that want a spreadsheet interface on top of live warehouse data without exporting to Excel.
Similar to: Omni, Metabase.
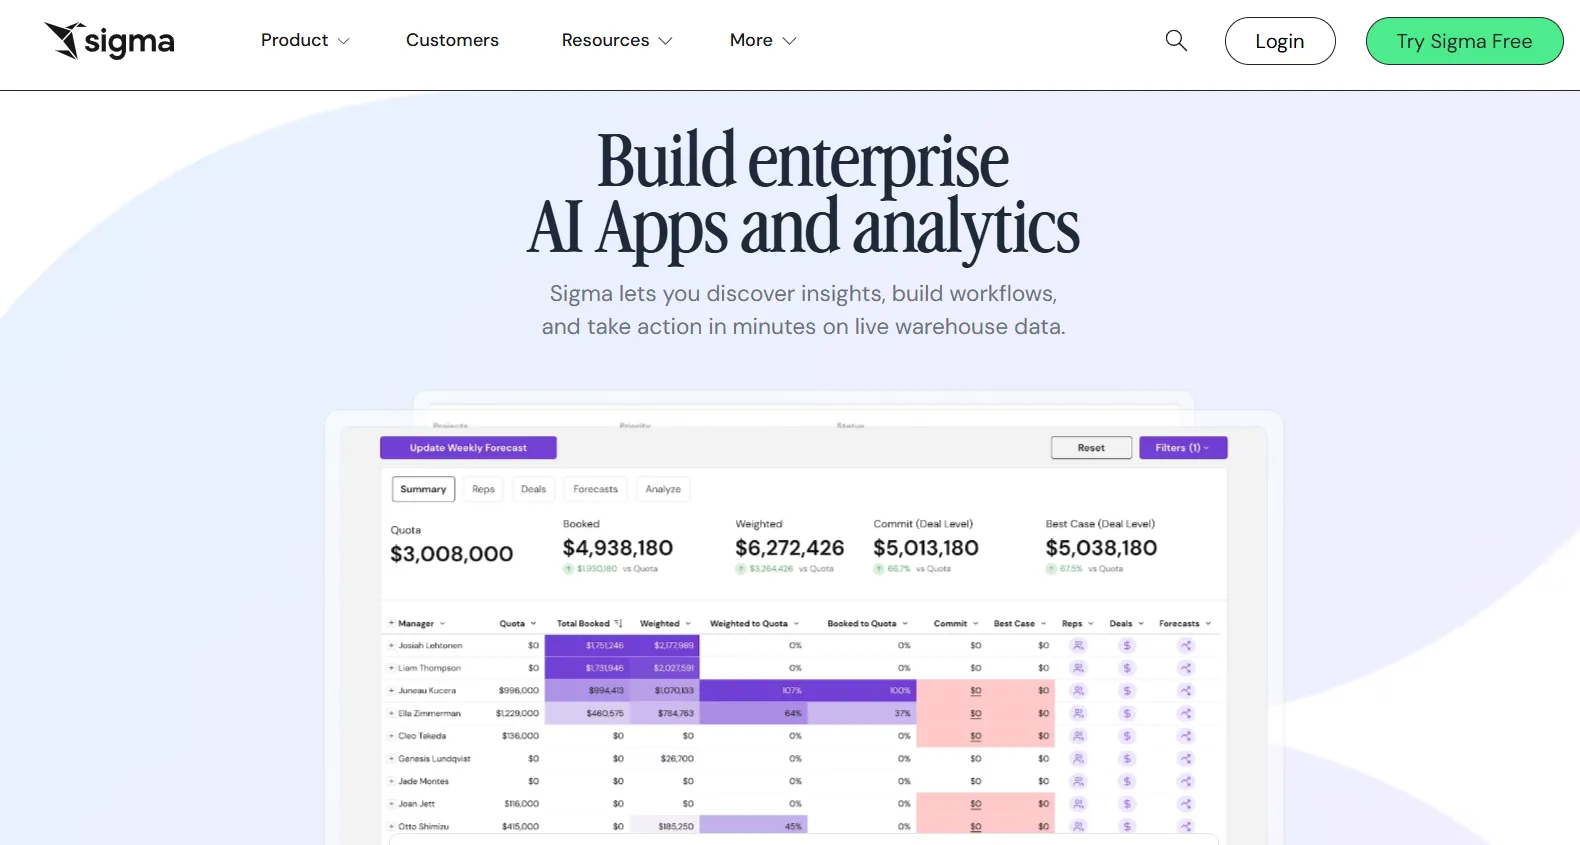
Sigma's workbook interface will feel instantly familiar if you've spent any time in Excel.
Pivots, formulas, grouped tables, and live cell references all work the way you'd expect, but the data underneath is sitting in Snowflake, BigQuery, Databricks, or Redshift, queried in real-time.
Sigma's top features
- Workbooks: Pivot tables, formulas, and grouped views over warehouse-scale data with a UI that maps directly to Excel.
- Ask Sigma: Plain-language prompts inside a workbook generate dashboards, summaries, and analytics apps.
- Collaboration: Shared workbooks with comments, versioning, and live edits instead of emailed spreadsheets.
Sigma pricing
Sigma doesn't publish pricing. Contact their sales team for a custom quote.
Sigma pros and cons
✅ No data duplication, queries hit the warehouse live.
✅ Excel-familiar interface lowers the bar for finance teams.
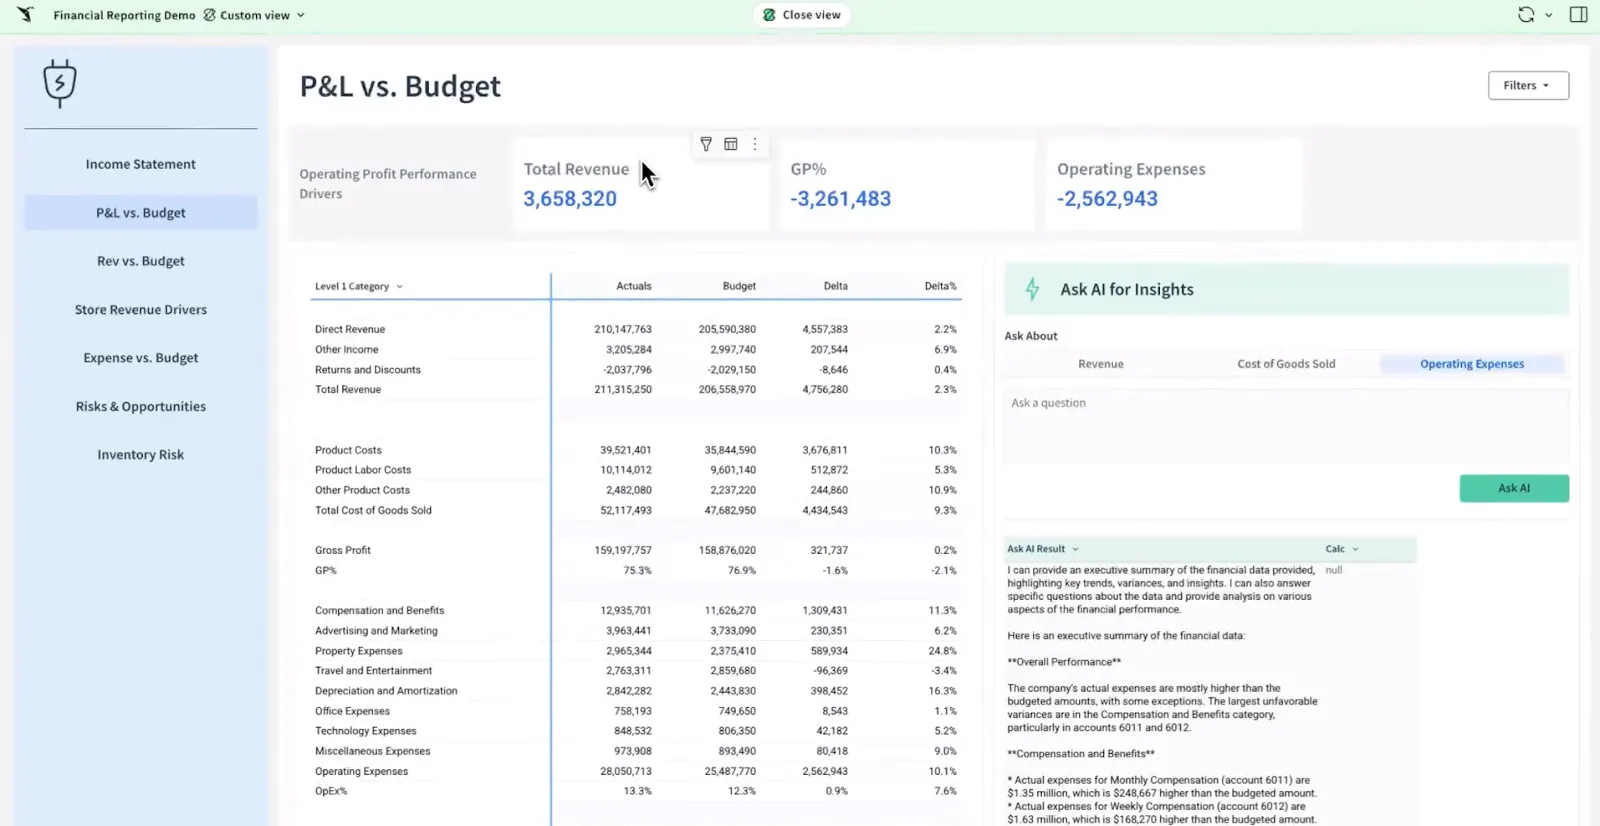
#3: Omni
Best for: Data teams that want a semantic layer without LookML's rigidity, plus AI that lives inside the exploration flow rather than bolted on as a chatbot.
Similar to: Looker, Sigma.
Omni connects to cloud warehouses directly, lets analysts and business users move quickly without weeks of upfront modeling, and treats AI as part of the exploration surface.
Omni's top features
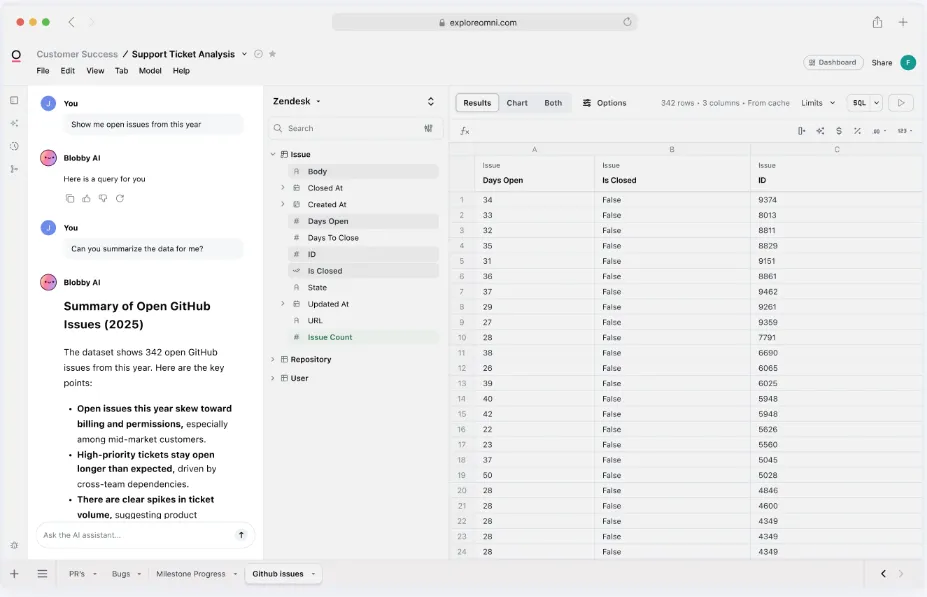
- Metrics-first model: Define metrics once in a central, reusable model, no LookML-style ceremony required.
- AI inside exploration: Built-in AI summarizes charts, generates queries, explains trends, and recommends follow-ups during analysis.
- Spreadsheet exploration: Live warehouse data in a spreadsheet-style interface, with governed metrics intact underneath.
Omni pricing
Omni doesn't publish subscription pricing. You can request a free trial on their site, then get a quote.
Omni pros and cons
✅ Strong dbt integration and direct warehouse querying.
✅ Less modeling overhead than older semantic-layer tools.
What are the best enterprise BI platforms?
For organizations that need analytics infrastructure with the kind of weight Qlik Sense itself carries, this is the group most evaluations come down to.
These platforms have the largest user bases, the deepest partner ecosystems, and the cross-department reporting reach that newer tools are still building toward:
#1: Tableau
Best for: Data teams and enterprises that need advanced visual analytics and flexible deployment across cloud and self-hosted environments.
Similar to: Power BI, Looker.
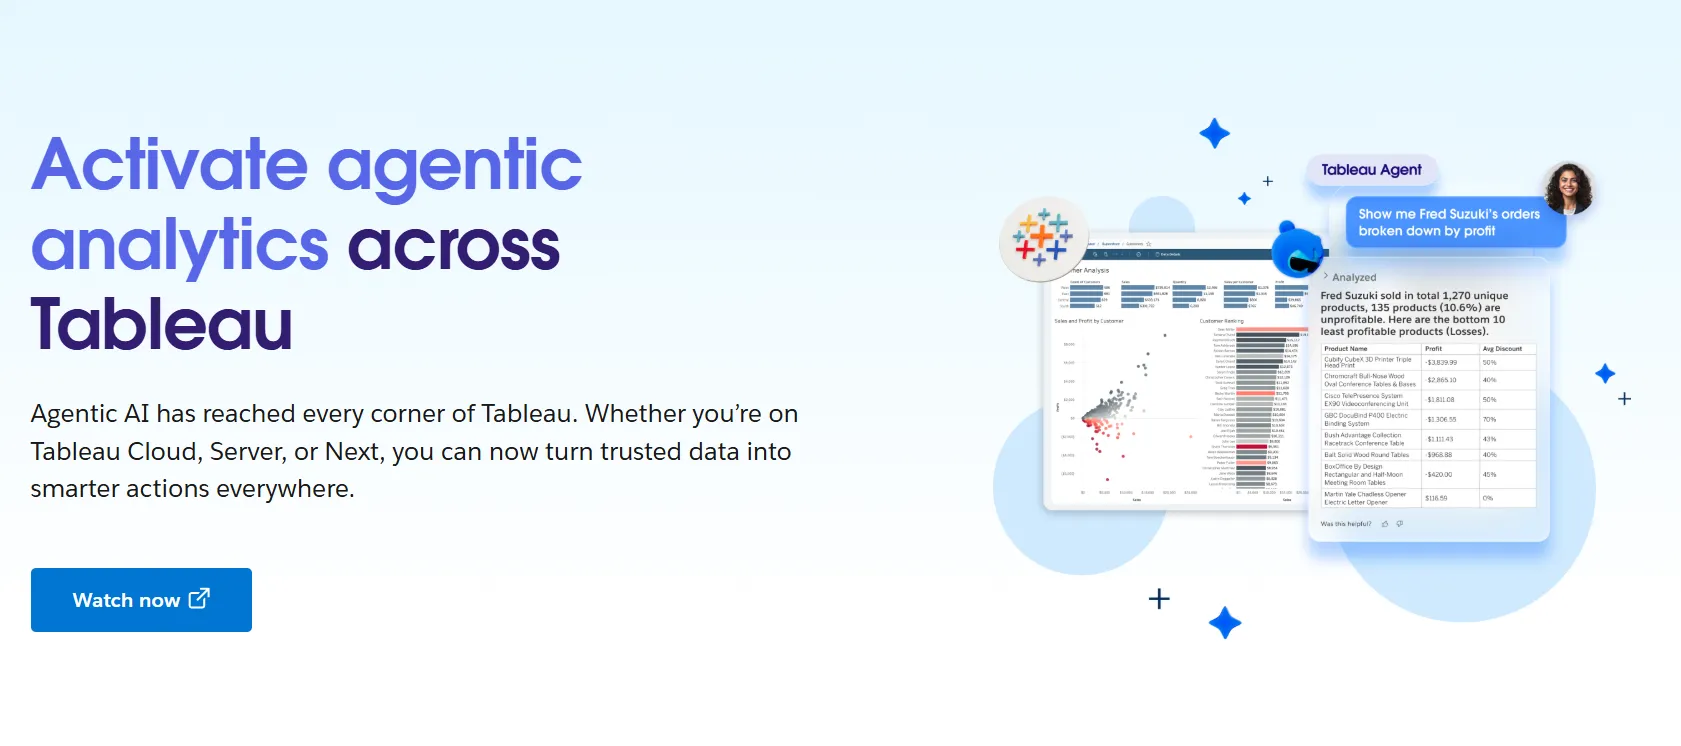
Tableau has been the visual analytics benchmark for over a decade.
Drag-and-drop dashboard construction, an enormous chart library, and one of the largest user communities in BI made it the default at large analytics teams.
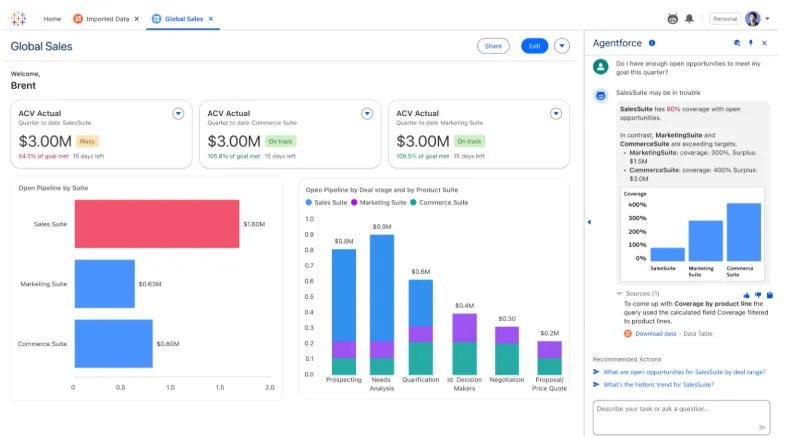
With Tableau Next, the company is layering agentic analytics on top of the existing exploration surface and tying it into Salesforce via Agentforce.
Tableau's top features
- Visual exploration: Drag fields onto a canvas, get interactive dashboards back, with drill-throughs and inline filtering across dozens of chart types.
- Tableau Next agents: Agentic analytics in Slack and Salesforce, plus natural-language analysis backed by Agentforce.
- Pulse and governance: Centralized metric definitions, role-based permissions, and data sensitivity controls for large deployments.
- Cloud, server, or Tableau Next: Hosted Tableau Cloud, self-hosted Tableau Server, or the newer agentic offering.
Tableau pricing
Tableau uses per-user, per-month pricing, with separate plans depending on whether you deploy Tableau in the cloud, on your own servers, or as part of its newer AI-driven offering:
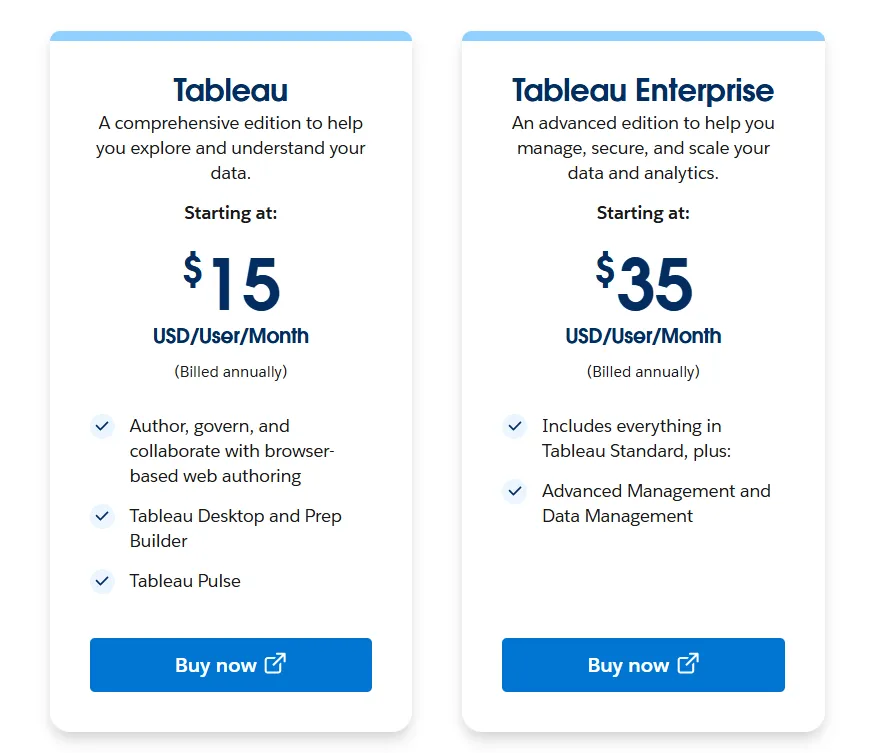
- Tableau Cloud has three pricing plans:
- Tableau Standard: Starts at $15/user/month, which includes browser-based authoring and collaboration, Tableau Desktop and Prep Builder, Tableau Pulse for metrics and insights.
- Tableau Enterprise: Starts at $35/user/month and includes everything in Standard, plus Advanced Management and Data Management for governance and scale.
- Tableau+ Bundle (Cloud + AI): Custom pricing, includes everything in Tableau Enterprise, plus Tableau Next, Tableau Agent, and Pulse premium features, with access to release previews and early AI capabilities.
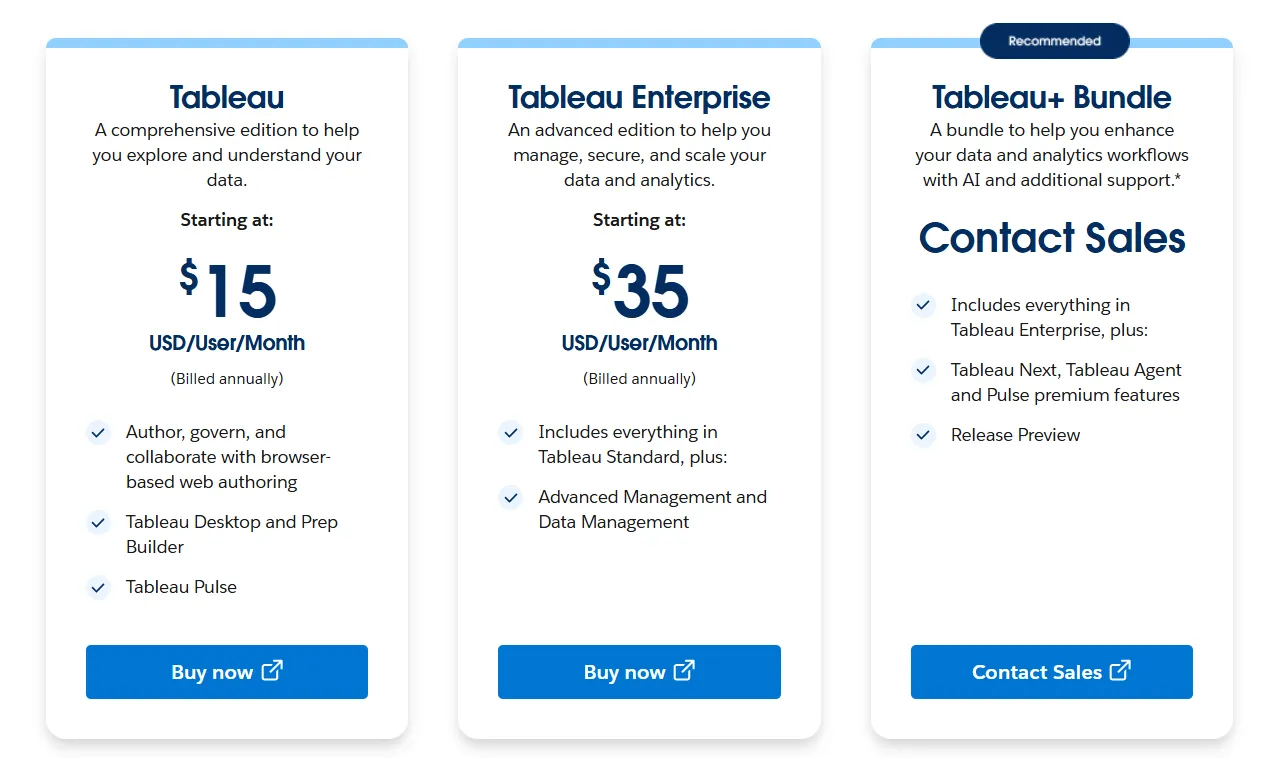
- Tableau Server has two pricing plans:
- Tableau Standard: Starts from $15 per user/month, which includes authoring, governance, and collaboration and Tableau Desktop and Prep Builder.
- Tableau Enterprise: Starts from $35 per user/month, which includes everything in Standard, plus Advanced Management, Data Management, and eLearning.
- Tableau Next (agentic analytics) has 2 plans:
- Tableau Next: Starts from $40/month/seat, and includes Agentforce Tableau, Tableau Semantics, and its Native Slack integration.
- Tableau + Bundle: Custom pricing, which includes everything in Tableau Enterprise, plus Tableau Next, Tableau Agent and Pulse premium features.
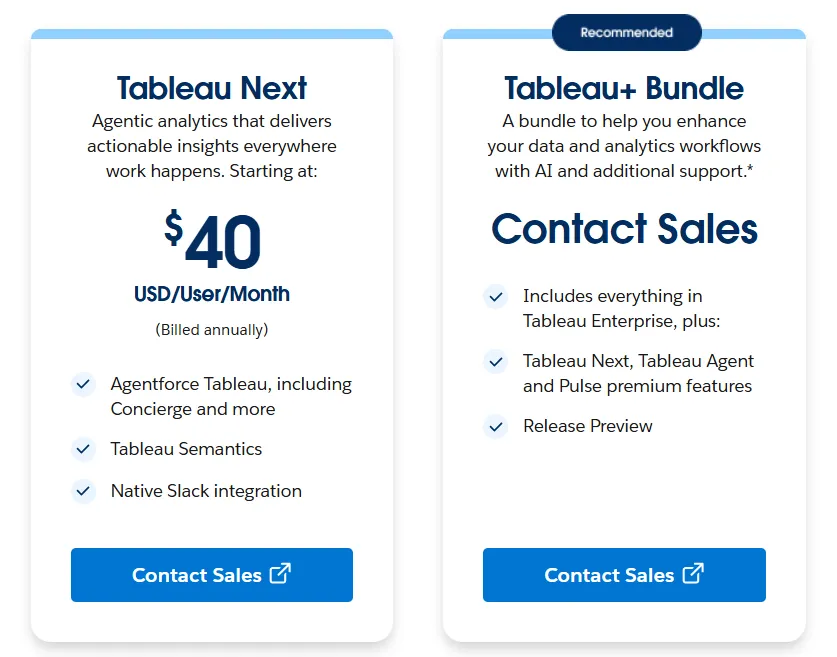
Tableau pros and cons
✅ Most likely the deepest visualization library in BI.
✅ Massive global community with certifications and tutorials.
❌ Per-user pricing can scale fast for organizations rolling out broadly.
#2: Microsoft Power BI
Best for: Organizations standardized on Microsoft 365 that want dashboards, paginated reports, and self-service analytics inside the existing stack.
Similar to: Tableau, Domo.
For organizations already running on Microsoft 365, Power BI is rarely a question of whether, more often a question of when.
The product handles modeling, interactive dashboards, paginated reports, and AI-assisted insights through Copilot, and the deep ties into Excel, Teams, SharePoint, and Microsoft Entra ID make it the path of least resistance in Microsoft-first stacks.
Power BI's top features
- Reports and dashboards: Multi-visual, filterable, drillable reports published across an organization with workspace controls.
- Enterprise governance: Row-level security, sensitivity labels, and Microsoft Entra ID controls at scale.
- Copilot: AI-assisted analysis for pattern detection, forecasting, and report summary writing.
Power BI pricing
A per-user and capacity-based model:
- Free: Personal reports and dashboards, no sharing.
- Power BI Pro: $14/user/month, includes publishing, sharing, scheduled refresh, and Teams or SharePoint embedding.
- Power BI Premium Per User: $24/user/month, adds larger model sizes, more daily refreshes, paginated reports, and AI features.
- Power BI Embedded: Custom pricing for customer-facing analytics inside applications.
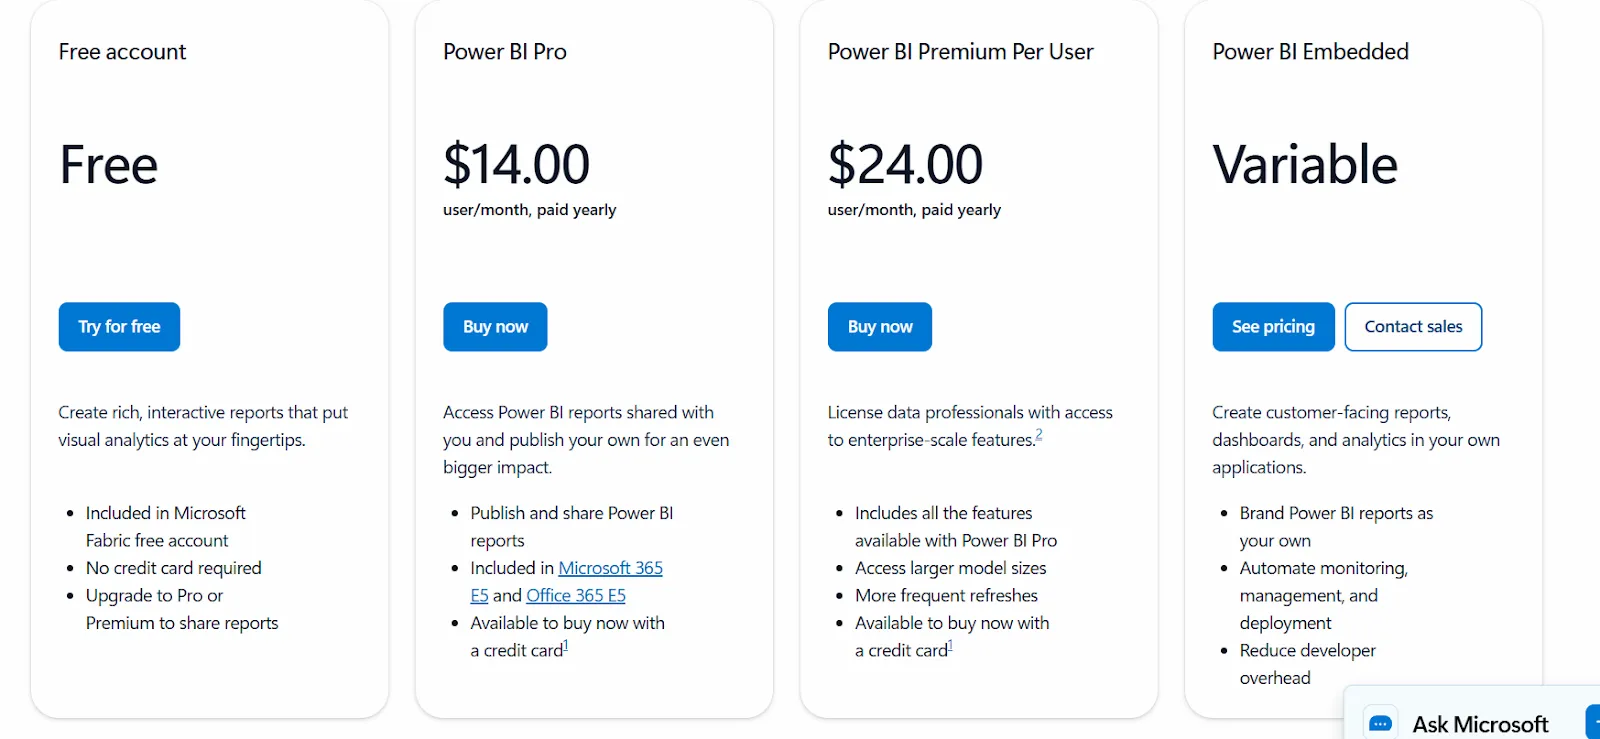
Power BI pros and cons
✅ One of the cheapest entry points in mainstream BI at $14/user/month.
✅ Native Excel, Teams, and SharePoint integration.
❌ For beginners, the learning curve can feel steep, particularly when you start working with data modeling and DAX formulas, according to a G2 review.
#3: Looker
Best for: Data teams that want consistent metrics across reports, governed access at scale, and tight integration with BigQuery and Google Cloud.
Similar to: Tableau, Omni.
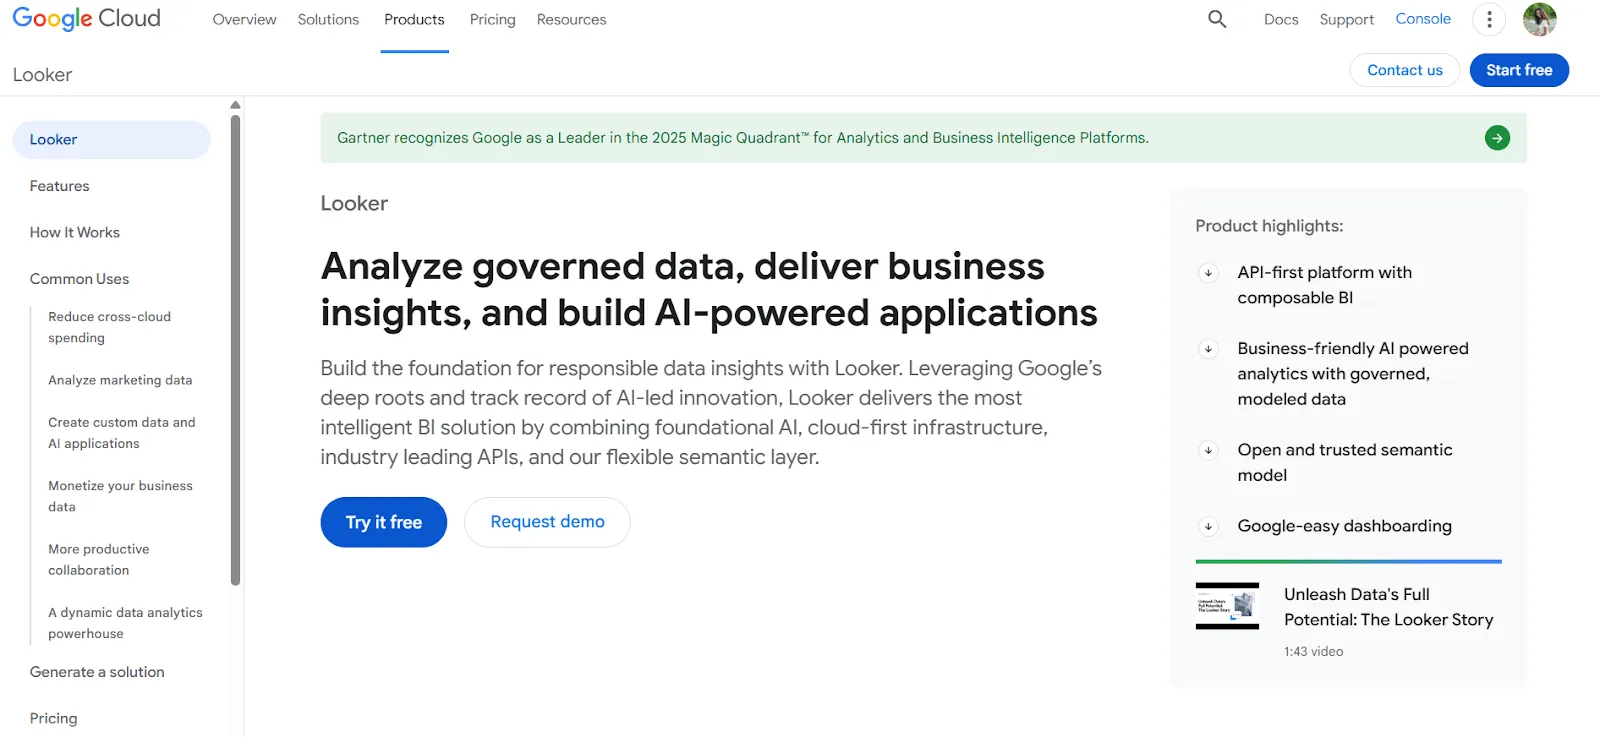
Looker centers everything around LookML, the semantic modeling language that lets a data team define every metric, dimension, and relationship in one place.
Reports, dashboards, embedded analytics, and the newer Gemini-powered conversational layer all pull from that single model.
Looker's top features
- LookML modeling: Metrics and business rules defined once, referenced everywhere across the platform.
- Gemini conversational analytics: Plain-language questions answered against the LookML model.
- Real-time, governed dashboards: Live warehouse data, explored, filtered, and drilled into with metrics that don't drift between reports.
Looker pricing
Looker uses a custom, contract-based pricing model made up of two parts: platform pricing (the cost of running a Looker instance) and user licensing (the cost per user type).
Pricing is annual for all plans.
- Platform editions:
- Standard: Designed for small teams or organizations with fewer than 50 users, includes 1 production instance, 10 standard users + 2 developer users, up to 1,000 query-based API calls/month, and up to 1,000 admin API calls/month.
- Enterprise: Built for larger internal BI and analytics use cases, includes everything in Standard, plus enhanced security features, up to 100,000 query-based API calls/month, and up to 10,000 admin API calls/month.
- Embed: Designed for embedding analytics into external products or applications, includes everything in Standard, plus up to 500,000 query-based API calls/month and up to 100,000 admin API calls/month.
- User licensing:
- Developer users: Full access to Looker, including LookML development, administration, APIs, and advanced tooling.
- Standard users: Can explore data, build dashboards and reports, run SQL, and schedule content.
- Viewer users: Read-only access to dashboards and reports, with filtering and drill-down.
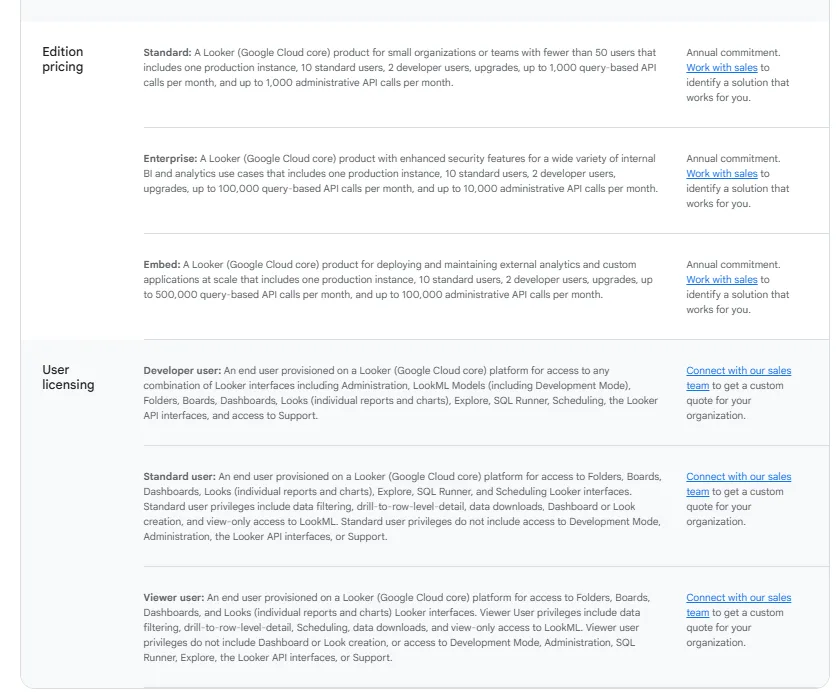
Pricing is custom on all plans and varies based on scale, permissions, and usage.
Looker pros and cons
✅ Semantic modeling keeps metrics consistent at enterprise scale.
✅ Tight integration with BigQuery and Google Cloud.
❌ There's a bit of a learning curve at first, which can require a bit more education upfront to maximize all of its capabilities, according to a G2 review.
Get started with Dot for free
If the bottleneck on your team isn't building more dashboards but turning the data already there into clearer decisions, Dot is one of the few platforms in this category designed around analysis as the output rather than visualization.
Here’s what you get with Dot:
- Slack and Teams as the front door for asking questions, with answers and scheduled reports landing there, in email, or in the web app.
- Recurring business reviews automated end-to-end and delivered as scheduled PowerPoints.
- A persistent Context Agent that keeps metric definitions aligned across teams.
- Inspectable audit trails on every output, with one click back to the query and the data.
- Native connections to Snowflake, BigQuery, Redshift, Databricks, and a range of other warehouses, databases, and SaaS sources.
- Compatibility with existing dbt, Looker, and Power BI modeling work, no migration required.
- SOC 2 compliance and enterprise-grade access controls.
- Credit-based pricing tied to usage, not seats.
➡️ Get started for free with Dot's Starter plan, or schedule a demo to see how it works with your data.
⚠️ Disclaimer: This article was last updated on the 15th of May, 2026, and if there's any misinterpretation of the information, please contact us, and we will fact-check it.
Theo Tortorici
Theo writes about AI-powered analytics, data tools, and the future of business intelligence at Dot.