
Microsoft Power BI Pricing: Is It Worth It In 2026? [Reviewed]
Microsoft Power BI pricing is public, which already puts it ahead of the analytics tools that keep their numbers behind a sales call.
The catch is that the published price is only the start of the story.
Power BI splits its cost across per-user licenses, per-capacity licensing, an embedded option for software teams, and its move into Microsoft Fabric.
In this guide, I break down what each Power BI plan costs in 2026 and what a real deployment tends to bill once the licensing model kicks in.
➡️ At the end, I'll introduce you to a Power BI alternative, Dot, that prices on the analysis work it does for you and skips the per-seat licensing entirely.
TL;DR
- Power BI charges two ways: per user and per capacity (Microsoft Fabric plus the older Premium capacities), with a separate Embedded option for teams building reports into their own software.
- There is a free tier through the Microsoft Fabric free account, plus free trials of the paid plans, though you can author but not share on the free tier.
- Paid per-user pricing is $14 a user each month for Pro and $24 a user each month for Premium Per User, both billed yearly; capacity and Embedded are priced variably and quoted by sales.
- Dot is the alternative I'd point a data team to, because it answers business questions in Slack or Teams and writes its own reports, and it prices on credits for that work with unlimited users included, so viewers don't each need a paid seat.
How Does Power BI Calculate Its Pricing?
Power BI uses more than one pricing model, and which one applies depends on the product and how widely you plan to share your work.
Here are the models in play:
- The free tier: One person can build reports in Power BI Desktop at no cost, but sharing them with anyone needs a paid license.
- Paid per-user seats: Pro adds publishing and collaboration at $14 a user each month. Premium Per User keeps the per-seat structure and adds enterprise features such as larger data models and faster refreshes, at $24 a user each month.
- Per-capacity licensing: Fabric capacity (the F SKUs) and the older Premium capacities (the P SKUs) are priced on reserved compute, not on seats. You buy a capacity, and it powers the workspaces on it, with pricing quoted by sales.
- Embedded: For software teams that put reports inside their own product, Power BI Embedded runs on variable pricing handled by sales.
One detail worth knowing before you budget is that people can only view reports without their own paid license once you reach an F64 or P1 capacity.
Below that threshold, every viewer needs a Pro seat, which is what drives most of the real cost.
➡️ If I were sizing this up, I'd start with who needs to see the reports, not who builds them.
Does Power BI Have a Free Plan or Free Trial?
Yes on both counts. Power BI has a free tier that runs through the Microsoft Fabric free account, and Microsoft offers free trials of the paid plans.
Here is what you get at no cost:
- Free account: Build interactive reports in Power BI Desktop and explore them yourself, with data security and encryption included. Publishing and sharing with a wider team needs a Pro license or higher.
- Free trials: The paid tiers come with a trial you can start without a credit card, reachable from the pricing page.
⚠️ Note: the pricing page doesn't state how long the trial lasts or what it includes.
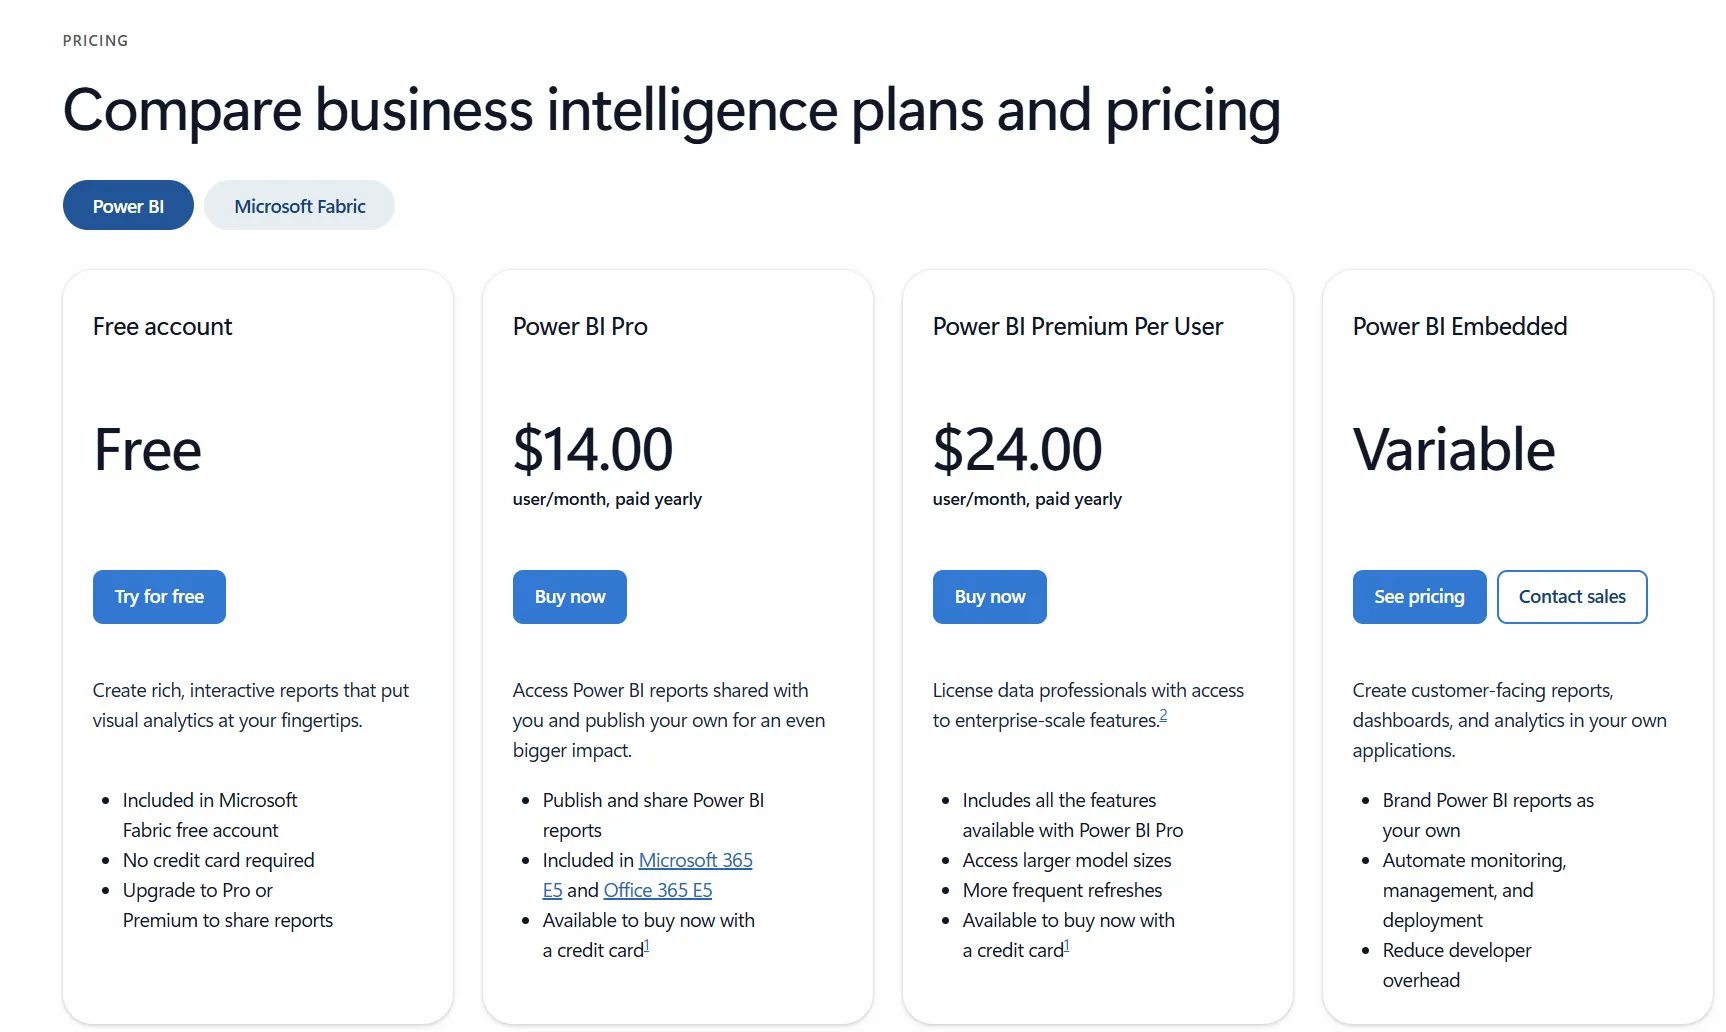
Power BI's Plan Breakdowns
Power BI has five ways to pay, from a free tier up to variable capacity pricing. I'll take each in turn, with the price and what's included.
Power BI Free
The free tier costs nothing and comes with the Microsoft Fabric free account, with no credit card needed to start.
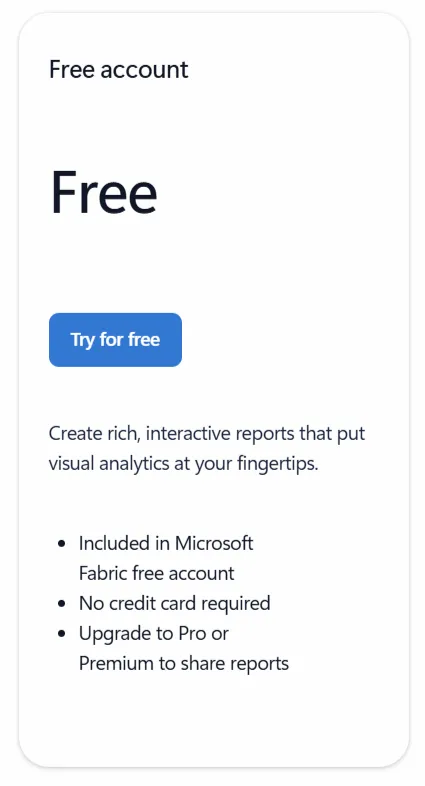
Here's what you get:
- Report authoring in Power BI Desktop.
- Data security and encryption included.
Sharing and publishing aren't part of it, so as soon as a second person needs the report, you'll be paying for a license.
I’d treat the free tier as a solo workbench, which is fine for one person building and poking around on their own.
Power BI Pro
Pro is $14 a user each month on annual billing, which comes to $168 a year per user.
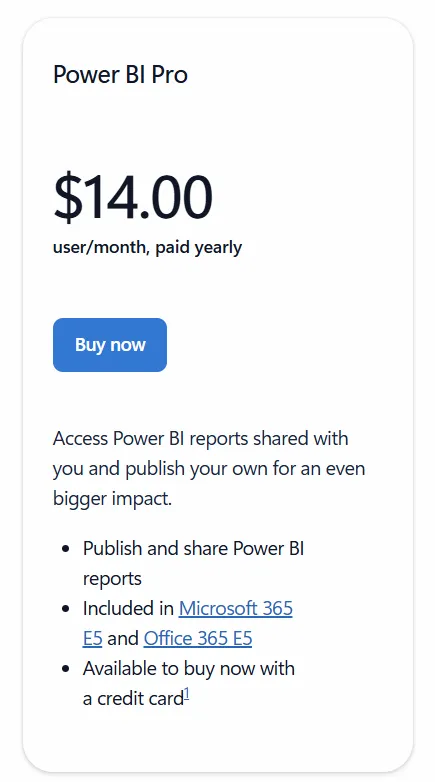
The plan covers:
- Publishing and sharing for team collaboration.
- Bundled access through Microsoft 365 E5 and Office 365 E5.
- Data models up to 1 GB.
- Dataset refreshes up to 8 times a day.
- 10 GB of storage per license.
- Data security and encryption.
Pro is the tier most teams actually run day to day. Since anyone who so much as opens a shared report needs a seat, it usually sets the floor on how many licenses you end up buying.
Power BI Premium Per User
Premium Per User is $24 a user each month on annual billing, so $288 a year per user.
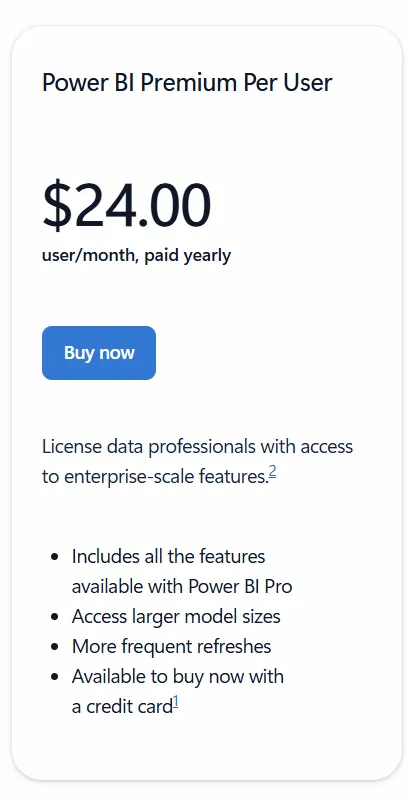
It carries everything in Pro and adds:
- Data models up to 100 GB.
- Dataset refreshes up to 48 times a day.
- 100 TB of storage.
- Advanced AI, dataflows, datamarts, and XMLA endpoint read/write.
If you're already on Pro or an E5 license, a $14 a user monthly step-up add-on moves you to Premium Per User.
It suits data professionals who want enterprise-scale models and quicker refreshes while keeping to per-seat pricing.
Power BI Embedded
Embedded is priced variably, so you'll get a quote from sales.
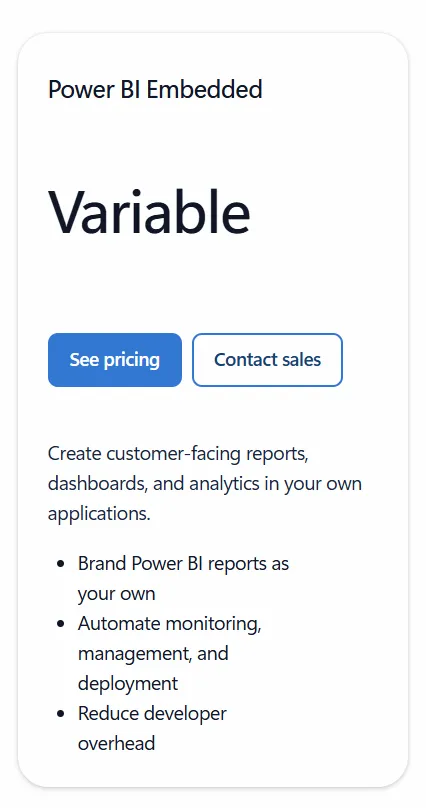
Here’s what's in it:
- Power BI reports embedded inside your own application.
- Reports branded as your own.
- Automated deployment and monitoring.
- Content consumption without a per-user license, in the App Owns Data model.
Embedded is aimed at software teams that want analytics inside their own product without building the reporting layer from the ground up. Model memory and storage scale with the capacity you buy.
Microsoft Fabric capacity
Fabric capacity is also quoted by sales, with an annual reservation that discounts the pay-as-you-go rate.
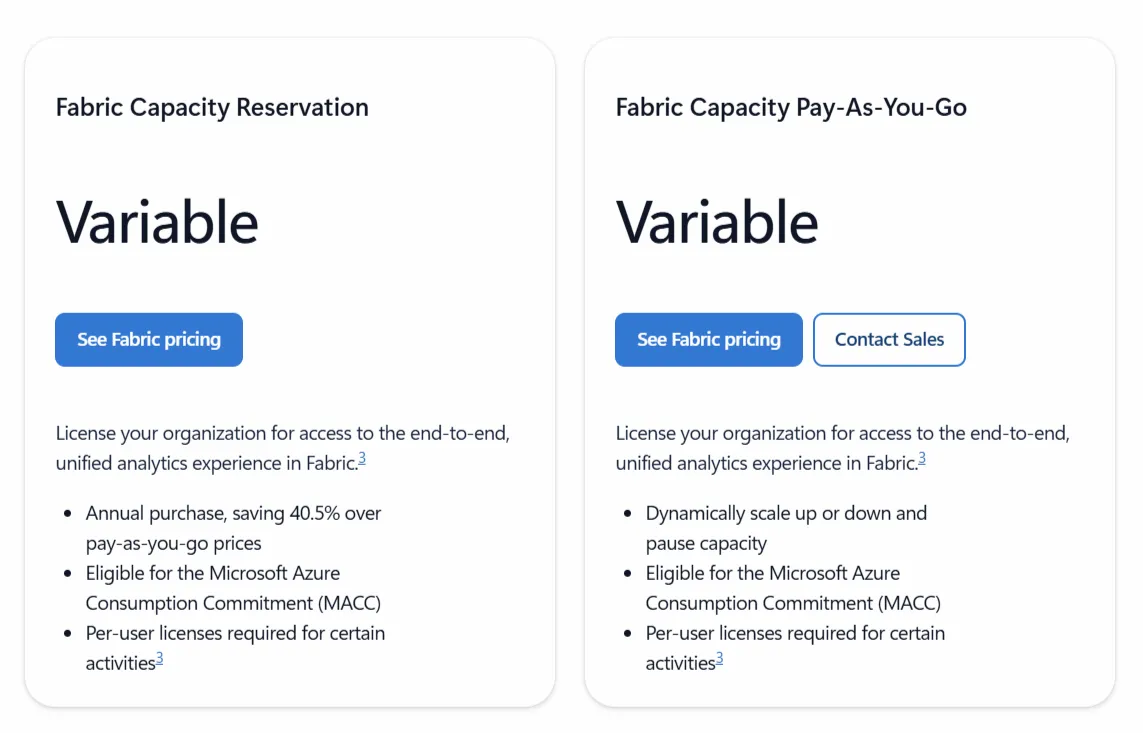
What sets it apart:
- Power BI licensed through Fabric capacity SKUs (the F range).
- Report viewing without a per-seat Pro license at F64 and above.
- Access to Fabric workloads and Copilot in Fabric.
- An annual reservation that Microsoft says saves around 40% over pay-as-you-go.
Capacity is the enterprise-scale play, and F64 is the number to watch. Under it, every single viewer still burns a Pro seat, which is exactly what nudges big teams toward buying capacity.
What Would Power BI Cost Your Team?
The published prices are simple, although the real bill depends on how many people need access and what they do with it.
Here's how that plays out at a few common team sizes, with the annual figure attached:
Small teams that build and share:
- Five people on Pro: $70 a month, or $840 a year. Everyone can author, publish, share, and collaborate.
- Three data analysts on Premium Per User: $72 a month, or $864 a year, for the larger models and faster refreshes.
In the deployments I've seen, the viewer count is the line that catches teams out, as it's the one that grows on its own.
Report consumers need a Pro seat until you reach F64 capacity, so a team that wants lots of people reading dashboards pays for each of them:
- Three authors and ten viewers, all on Pro: thirteen seats at $14, so $182 a month, or $2,184 a year.
- Fifty viewers on Pro: $700 a month, or $8,400 a year.
- One hundred viewers on Pro: $1,400 a month, or $16,800 a year, before any authors.
- Two hundred viewers on Pro: $2,800 a month, or $33,600 a year.
That last figure is usually the point where organizations start pricing out Fabric capacity, since an F64 reservation lets viewers read reports without a per-seat license.
Whether capacity works out cheaper depends on your headcount and how much compute your reports need, so it's worth modeling both before you commit.
⚠️ Note: The hard number to forecast going in is viewer growth. Author seats are predictable; viewer counts tend to climb once reports catch on internally, and every one of them costs a Pro license until you move to capacity.
Looking For A Power BI Alternative?
Dot takes a different shape from Power BI.
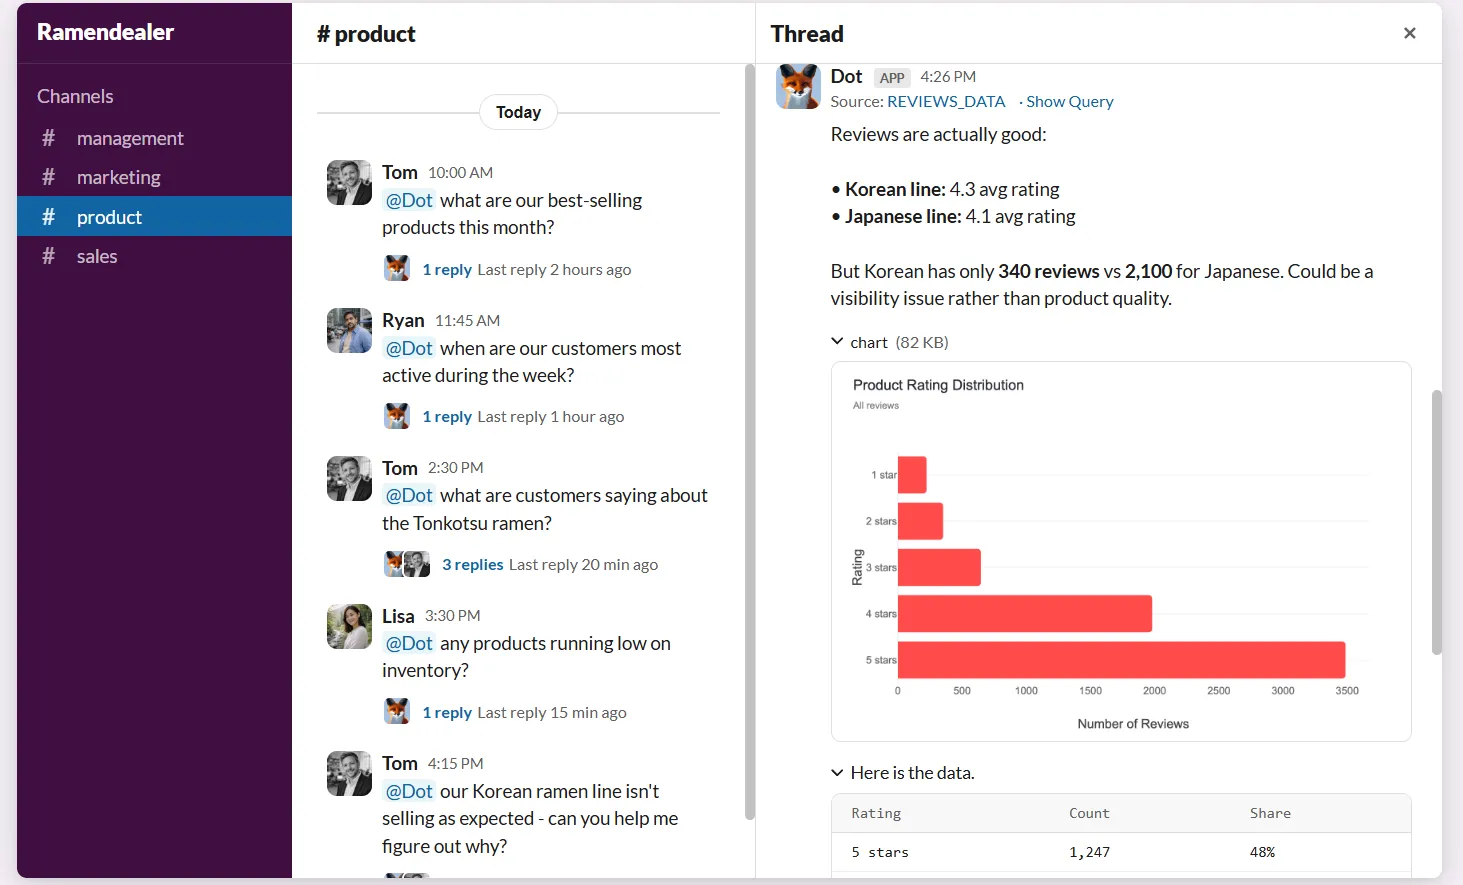
It works as an AI data analyst that reads straight from your warehouse and produces the analysis itself, so you put a business question to it in Slack or Teams and get a written answer back, complete with the reasoning and a recommendation.
Our conversational analytics software also writes recurring business reviews on a schedule and keeps a single, shared definition of your metrics so teams quote the same numbers.
For a data team that likes the reporting Power BI produces but has no appetite for spending the week building dashboards, maintaining models, writing DAX, and paying for a seat per reader, it's worth a serious look.
Below are the pieces that set Dot apart: 👇
Ad-hoc deep analysis in Slack or Teams
A dashboard answers the questions you built it to answer.
The trouble is that the sharpest questions tend to arrive after the fact, and they don't fit the filters you set up.
A finance lead pings you asking why gross margin slipped in the DACH region, or a PM wants to know which onboarding step is losing new users this quarter.
Dot takes the question in everyday language, right in Slack or Microsoft Teams, and comes back with the whole analysis. It doesn't stop at the figure; it lays out what moved and the most likely reason, then names the segments carrying the change.
For the data team, that absorbs the steady drip of one-off requests that would otherwise derail focused work.
Business users get their answer without picking up SQL or learning the data model, and analysts get their week back for the work that needs a human.
A single source of truth for your metrics
The thing that can quietly break a large Power BI setup isn't any single dashboard. It's that definitions wander.
One report counts active users one way, another counts them slightly differently, the dashboard list keeps growing, and before long a meeting stalls while two people argue over which figure is real.
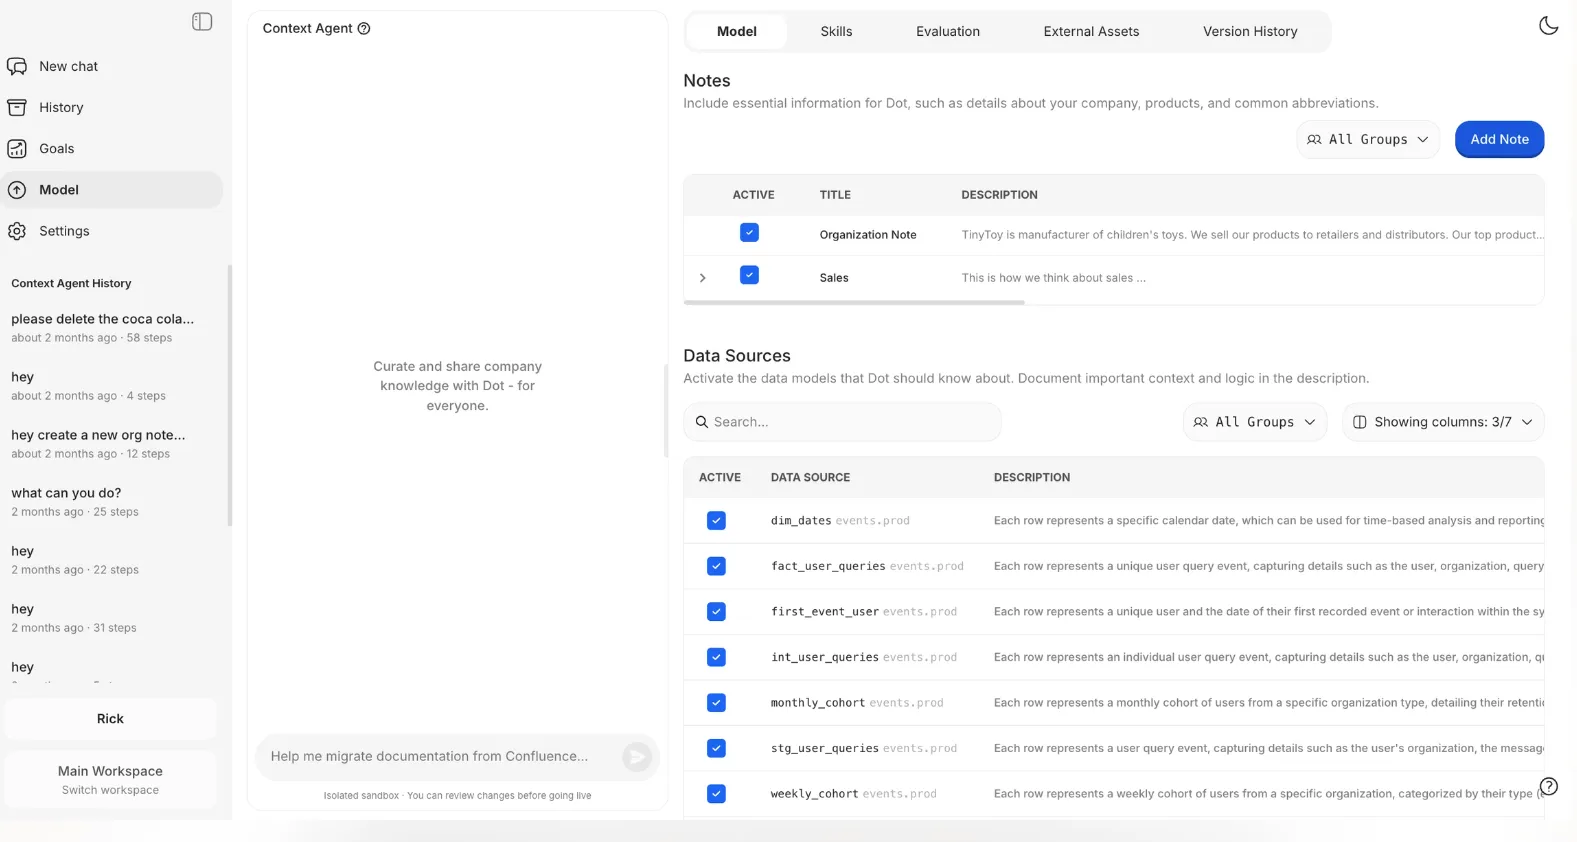
Dot works from a Context Agent that keeps those definitions in one place.
Our platform tracks how each metric is calculated, which tables to pull from, how different teams phrase the same idea, and where the documentation is kept, then applies all of it to every answer.
So the question stops being which dashboard to trust.
Once that context holds steady, confidence in the data stops slipping the way it tends to as a Power BI estate gets bigger.
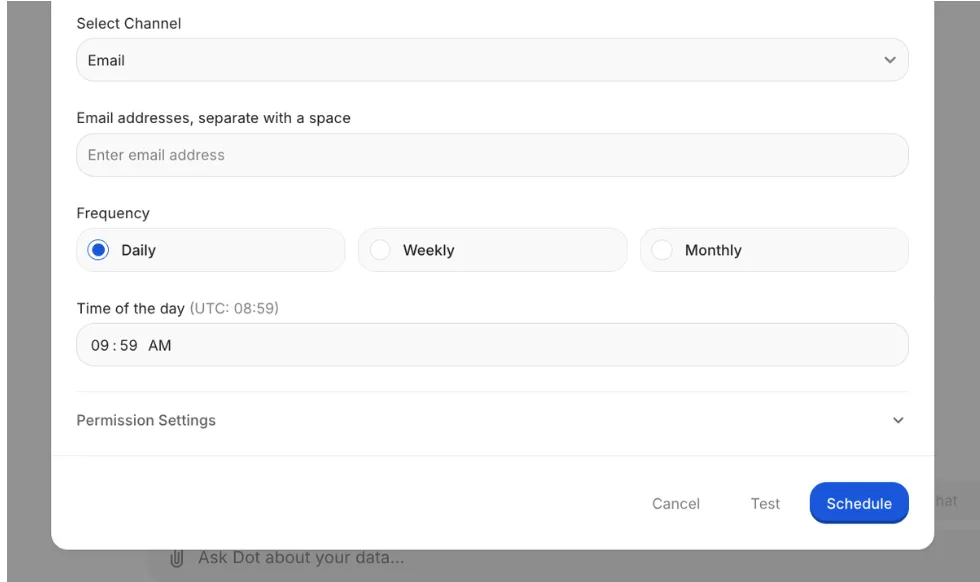
Automated business review reports
For a lot of teams, the whole reason Power BI stays open is the weekly or monthly review deck for leadership.
Building it can be quite the grind. Someone reruns the dashboards, sanity-checks the totals, drops screenshots into slides, and then writes the talk track explaining what actually moved.
The chart carries the numbers, while the interpretation stays in someone's head until the meeting.
Dot writes the review itself, analysis and all.
On the cadence you choose, it pulls from the warehouse and returns a report written as prose, covering what happened, how it compares with the period before, the reason behind the move, and the spots that need a closer look.
Leadership reads a steady, digestible update without decoding a single chart, and the data team is freed from rebuilding the same deck every cycle.
A full audit trail behind every answer
With a dashboard, you see the number but not the path it took to get there.
When something looks wrong, the hunt starts.
You open the model, read the DAX, check the last refresh, or track down the person who built the thing.
Every one of those steps burns time and chips at how much anyone trusts the figure.
Dot ships the receipts with the answer.
Every insight it returns carries a link back to the SQL it ran and the tables it touched, so anyone can retrace the number and confirm it holds.
There is no closed box to pry open.
That matters most for the analyst or data lead who has to defend a figure in a room.
They can trace it to the raw query and confirm it in a minute, then speak to it without hedging.
Dot's integrations
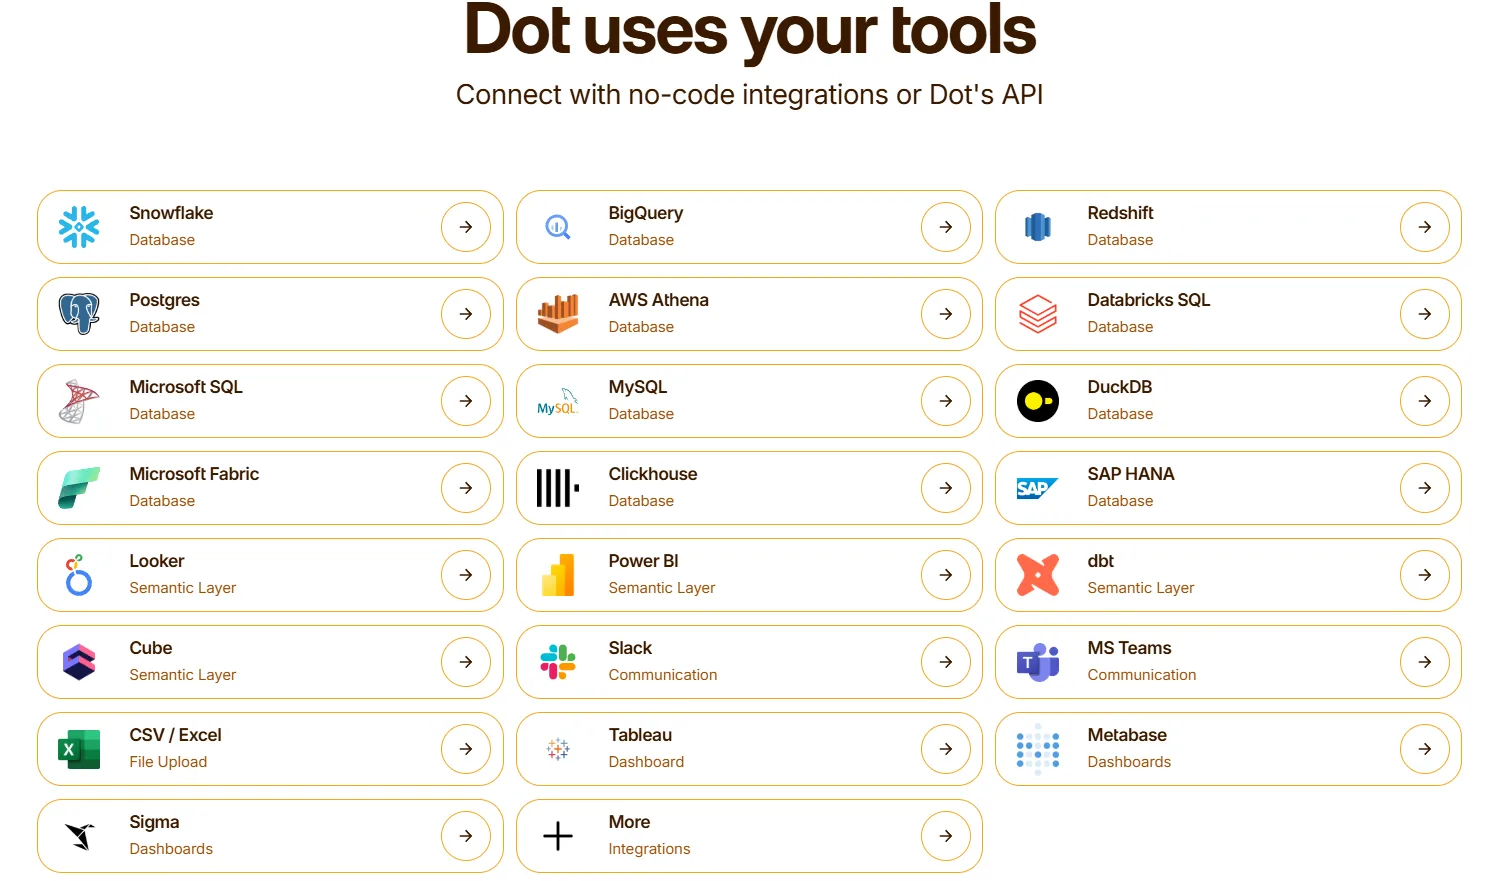
Dot connects directly to Snowflake, BigQuery, Redshift, and Databricks, plus operational databases like Postgres, MySQL, and SQL Server.
It also reads from semantic and transformation layers like dbt, Cube, Looker, and Power BI models, so your existing metric definitions get reused.
Delivery happens through Slack, Microsoft Teams, email, and the Dot web app. Dot can sit alongside an existing BI tool like Tableau, Metabase, or Sigma for gradual rollouts.
How Is Dot's Pricing Different From Power BI's?
The clearest difference is the unit you pay for.
Power BI charges by the seat and, at scale, by the capacity.
Dot charges by the credit, where a credit is spent when Dot does a piece of analysis work for you, and every paid plan includes unlimited users, so the people reading the output don't each need a license.
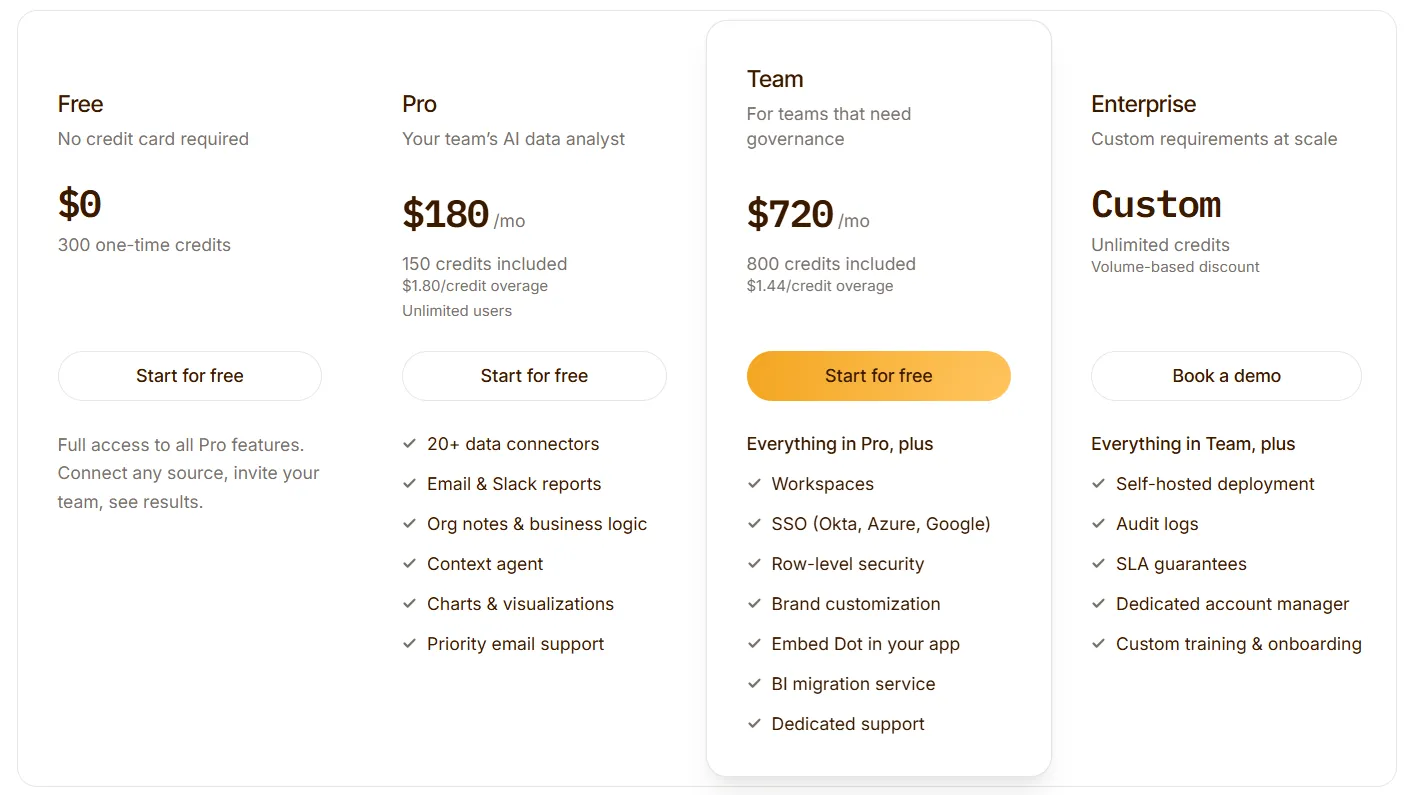
Dot runs a free plan and three paid tiers:
- Free: $0, with 300 one-time credits and the full set of Pro features to try.
- Pro: $180 a month for 150 credits, with extra credits at $1.80 each and unlimited users.
- Team: $720 a month for 800 credits, extra credits at $1.44 each, and admin-grade controls including SSO, row-level security, embedding, BI migration help, and dedicated support.
- Enterprise: custom pricing with unlimited credits, a volume discount, self-hosting, audit logs, an SLA, and a dedicated account manager.
Try Dot For Free
You came here to work out what Power BI costs. If the licensing math, especially the per-seat viewing, is starting to look heavy, Dot is worth a look before you commit to another year.
Here is what your team gets with Dot:
- An AI data analyst that answers business questions in Slack, Microsoft Teams, email, and the web app.
- Recurring business reviews generated on your schedule, straight from the warehouse.
- A shared context layer that keeps metric definitions consistent as your data estate grows.
- A full audit trail on every insight, linked back to the SQL and datasets behind it.
- Direct connections to warehouses like Snowflake, BigQuery, Databricks, and Redshift, plus your existing dbt and semantic models.
You can start on the free plan with 300 credits and the full Pro feature set, no credit card needed. Or, if you would rather see it against your own data first, book a demo with our team.
⚠️ Disclaimer: This article was last updated on the 2nd of July, 2026, and if there's any misinterpretation of the information, please contact us, and we will fact-check it.
Theo Tortorici
Theo writes about AI-powered analytics, data tools, and the future of business intelligence at Dot.