
10 Best Tellius Alternatives & Competitors In 2026
I've pulled together the 10 best Tellius alternatives in 2026 for data teams, breaking down how each one works, who they are best for, and what the solutions cost.
TL;DR
- Dot is the best Tellius alternative in 2026 for data and analytics teams that want analysis delivered in Slack or Teams, scheduled business reviews as PowerPoints, a Context Agent that keeps metric definitions aligned, and a clickable audit trail under every number.
- If you want AI-native analysis with strong natural-language querying and automated insight generation, ThoughtSpot, Zenlytic, and Domo are mature options that go well beyond search.
- For self-service work directly on top of your warehouse, Sigma, Omni, and Metabase give business and data teams governed access without a heavy modeling project first.
- And for established dashboarding at scale, Tableau, Microsoft Power BI, and Qlik Sense are the platforms most large organizations already run.
What are the best Tellius alternatives in 2026?
The best alternatives to Tellius in 2026 are Dot with its decision intelligence software that non-technical users can use, ThoughtSpot, and Zenlytic.
Here's the full shortlist, with a one-line read on who each tool suits and what it costs:
Tool | Use case | Price |
Dot | An AI data analyst that returns written analysis, recommendations, and scheduled executive reports instead of dashboards. | Free plan; paid from $180/month. |
ThoughtSpot | Search-and-AI analytics with agents that generate analyses and styled dashboards from plain-language questions. | From $25/user/month (annual). |
Zenlytic | An enterprise AI analyst (Zoë) that answers questions and builds decks and models, with citations on every result. | Pricing not public (self-serve for up to 10 users). |
Domo | An all-in-one cloud platform that ties data integration, dashboards, apps, and AI agents together in one place. | Custom pricing (30-day free trial). |
Sigma | Spreadsheet-style analysis on live warehouse data, built for finance and ops teams who think in formulas. | Pricing not public. |
Omni | A flexible semantic layer with self-service exploration and AI summaries on top of cloud warehouses. | Pricing not public (free trial). |
Metabase | Open-source BI for fast, lightweight dashboards and self-serve querying with a low setup cost. | Free (open source); Cloud from $100/month. |
Tableau | Deep visual analytics and data storytelling, now with agentic answers through Tableau Next. | From $15/creator/month. |
Microsoft Power BI | Standardized reporting and self-service analytics for organizations already living inside Microsoft 365. | Free plan; Pro from $14/user/month. |
Qlik Sense | An associative engine for exploring complex data relationships, popular in governed, on-prem settings. | From $300/month (Starter). |
#1: Dot
Dot offers the best Tellius alternative in 2026 for data and analytics teams that want an analyst's answer delivered into the tools they already use.
Apart from ad hoc and comprehensive analysis on Slack and Microsoft Teams, your team will also get automated business reports, a shared definition layer, and a clickable audit trail on every number.
The way it works is that you connect a warehouse once, and from there on you can ask questions and get a written answer back the way you'd message a senior analyst.
A few examples of how that feels in practice. 👇
Ask in chat and get the actual analysis back
Someone in Monday standup wonders why win rates dipped in mid-market last month.
All they have to do is type it into Slack like they'd ask a colleague, and a few minutes later Dot replies with the read: which stages leaked and which accounts dragged the number down, with figures attached.
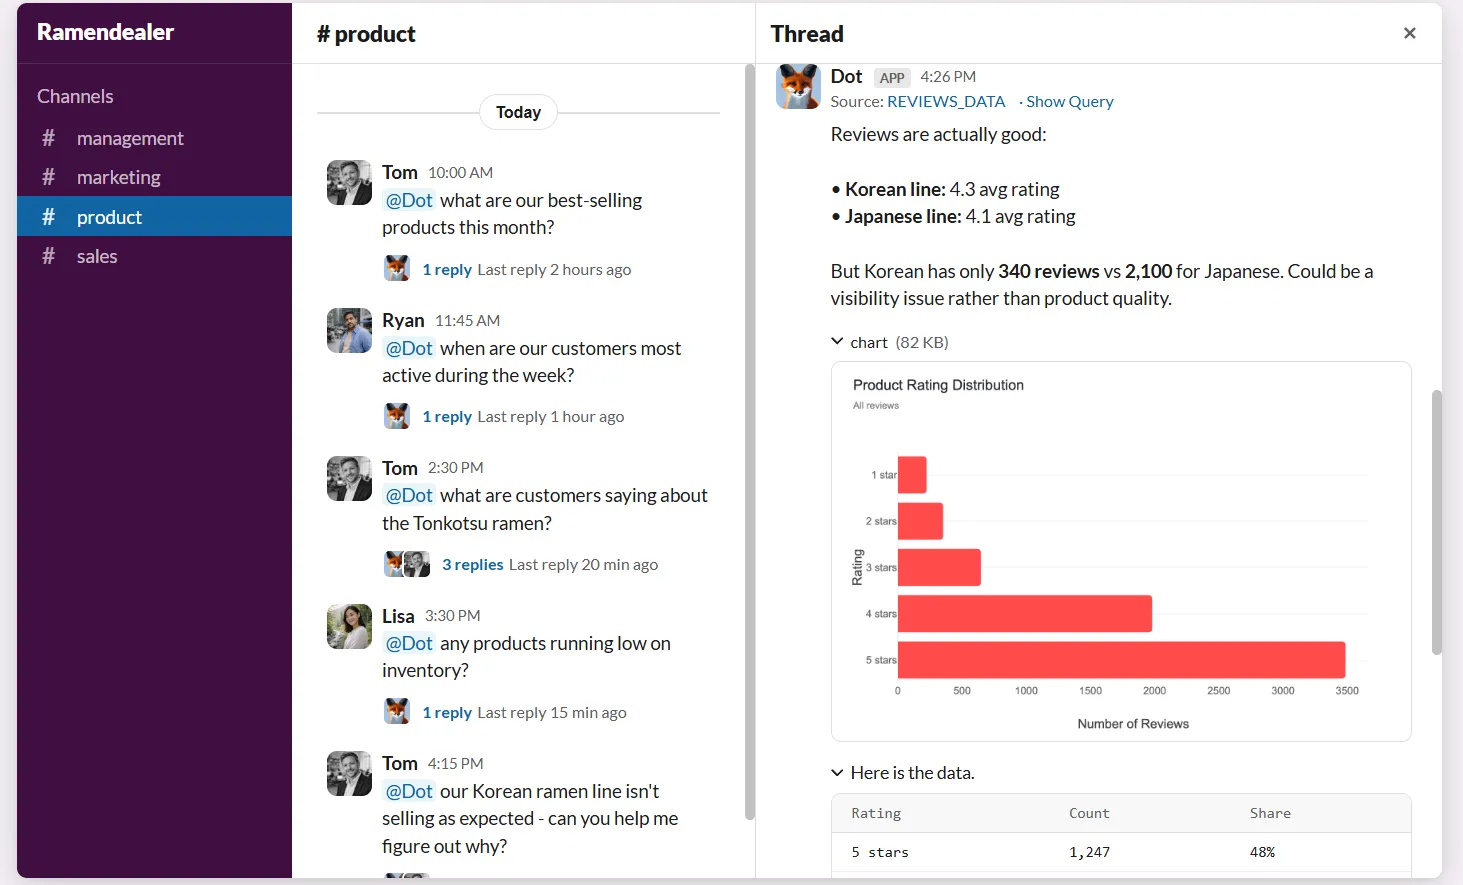
No dashboard to dig through and no filters to guess at.
Your team wouldn’t have to learn SQL, and your data team would get its afternoon back from one-off pulls.
Reports that write themselves on a schedule
The monthly business review is nobody's favorite afternoon.
Same charts pulled, last month's commentary retyped, a deck that gets four minutes in the meeting and then dies in a folder.
Dot takes it off your plate.
You set the cadence and the source once, and every cycle it queries live data, writes the analysis, and ships an executive-ready PowerPoint with the period-over-period numbers and a short written take on what moved and why.

One definition of every metric, shared by everyone
Ask two teams what "churn" means, and you'll get two answers, both reasonable, neither matching.
That's how a status meeting turns into a debate about whose number is right.
Dot's Context Agent learns how your business actually defines things, reading your dbt models and whatever catalog and documentation it can reach, then keeping one definition layer that every answer pulls from.
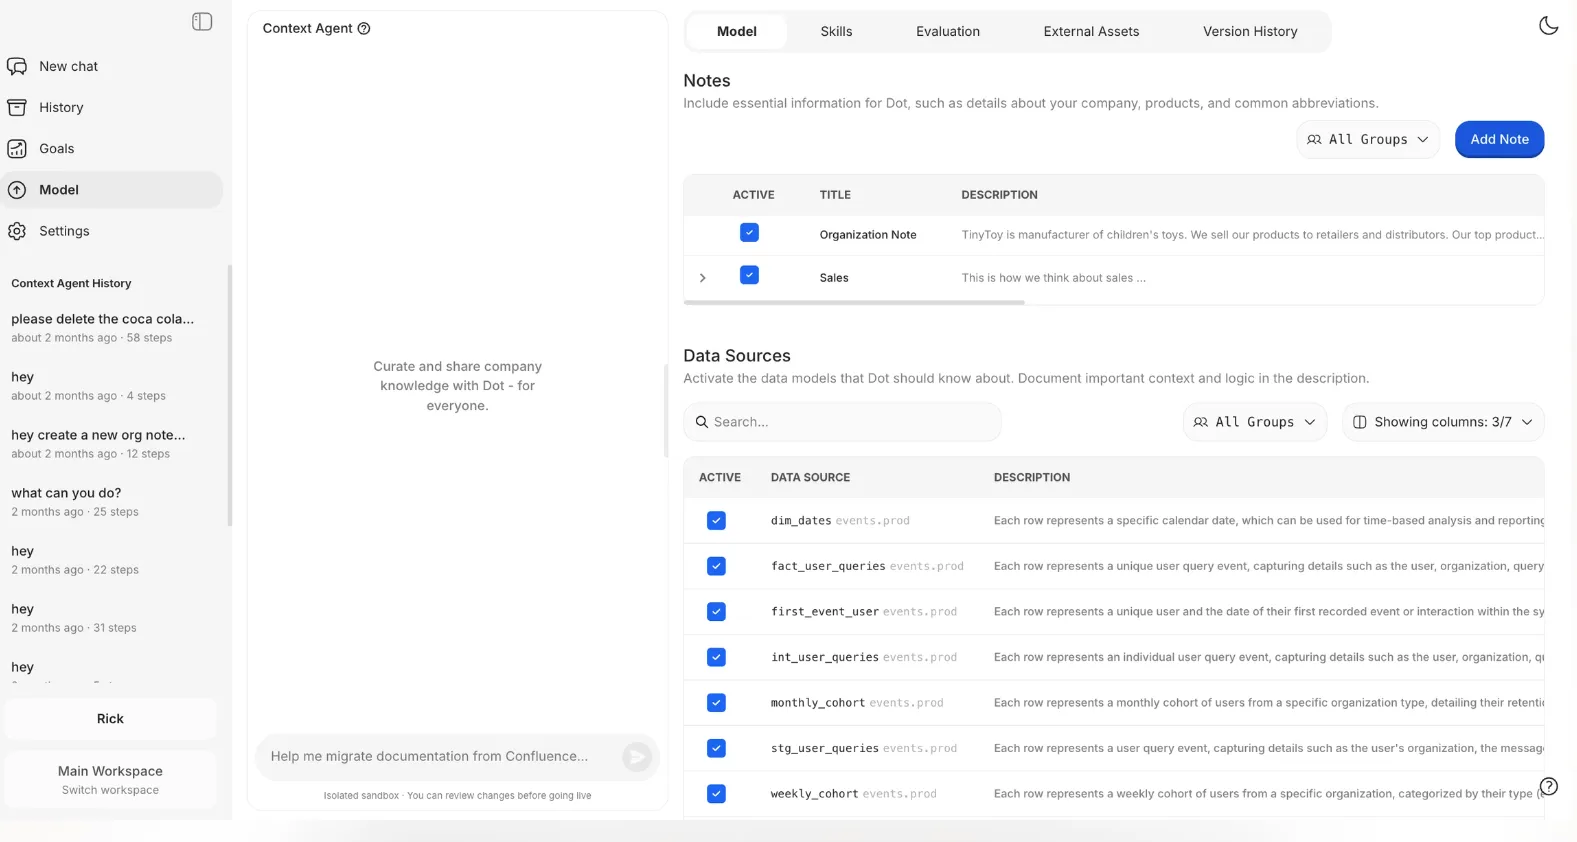
Where a metric has no documentation, it writes some, and where two systems disagree, it flags the clash and leaves the call to you.
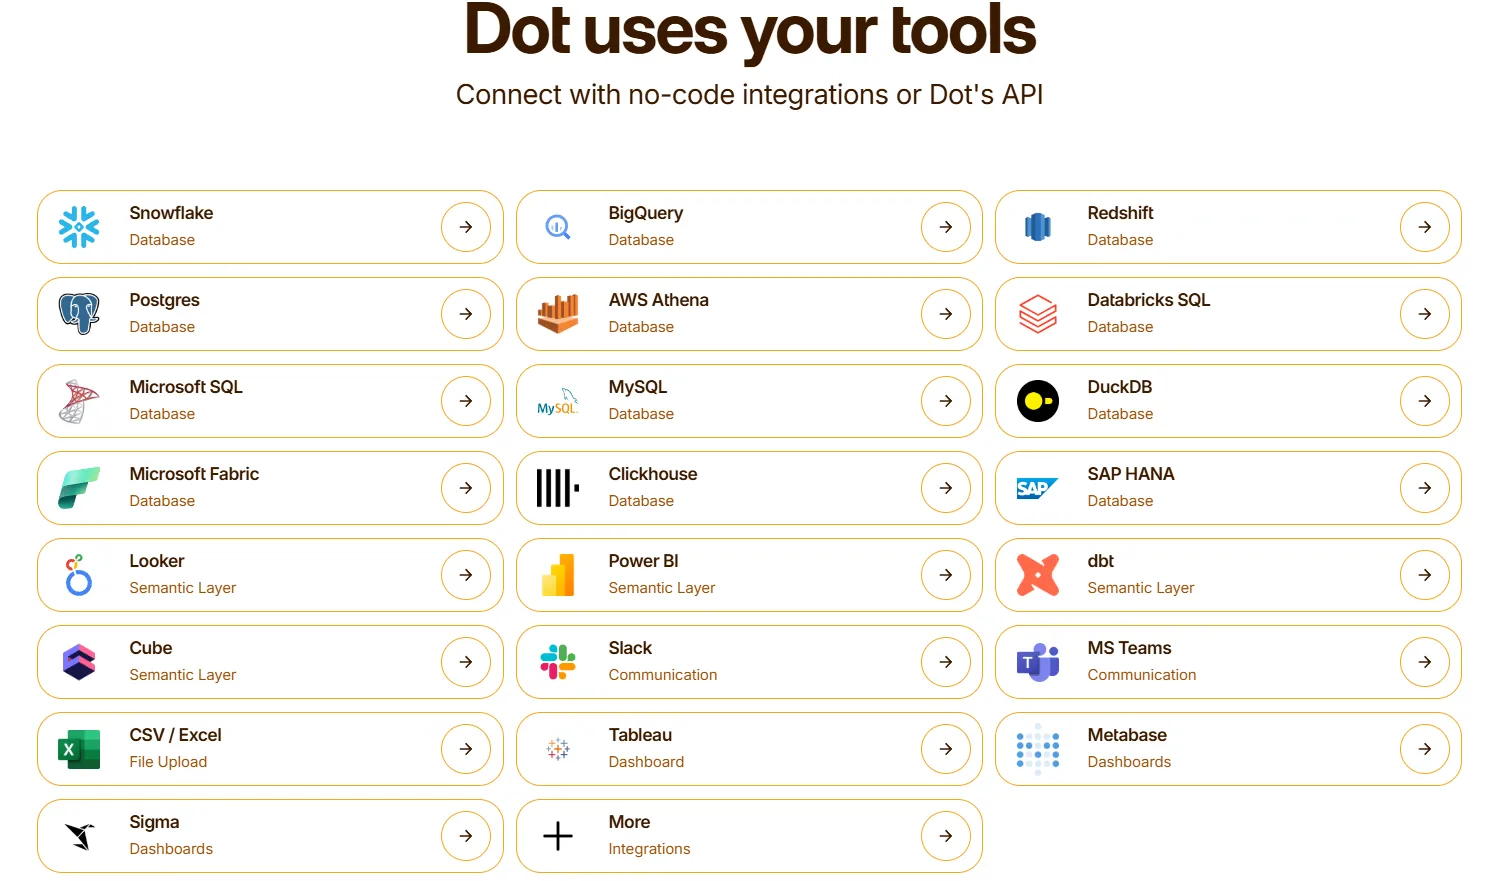
How Dot fits your existing stack
Dot doesn't replace anything you've already built.
It reads from the warehouses most teams run: Snowflake, BigQuery, Redshift, and Databricks, and from operational databases like Postgres and SQL Server.
Our AI data analyst also picks up the semantic models you've defined in dbt, Looker, Power BI, or Cube, so the metric logic you've already written carries over.
Answers and reports come back through Slack, Microsoft Teams, email, or the web app.
And if you keep Tableau or another BI tool around for a particular dashboard, Dot works happily alongside it.
What makes Dot different from Tellius?
Tellius and Dot agree on the big thing: a dashboard by itself doesn't decide anything, so the tool should do the analysis and explain the why.
Tellius is good at that, and it has strengths worth naming plainly.
It reasons over structured and unstructured data together, so the numbers in your warehouse and the context buried in call transcripts and PDFs can land in one investigation.
Its Kaiya agents and Missions run scheduled, vertical-aware analysis, and its packaged knowledge for pharma, life sciences, healthcare, and CPG runs deep.
So the gap between them isn't about quality. It's about shape.
- Tellius is a destination: You go into its platform, set up agents and missions, and pick up the finished work there.
- Dot sends the analysis into Slack, Teams, email, or a web app, so nobody has to adopt a new place to work.
The two also start from different foundations.
Tellius brings its own semantic layer and verticalized models, which is part of how it earns its depth.
Dot has a semantic layer too, but it's built to plug into the dbt, Looker, and Power BI logic your team has already modeled.
So instead of recreating that business logic inside another tool, Dot reuses it, and the job becomes adding an analyst over your current stack rather than modeling the business from scratch a second time.
Put simply, Tellius is the heavier, deeper choice for unstructured-heavy, vertically specific enterprise work.
Dot is the one to reach for when you want an analyst working inside the tools you've already got, on the models you've already built.
Dot pricing
Dot opens with a free plan that includes 300 one-time credits and full access to Pro features, so a team can run real analyses before committing to anything.
There are three paid tiers:
- Pro: $180/month, with 150 credits per month, $1.80 per credit beyond that, and unlimited users.
- Team: $720/month, with 800 credits per month, $1.44 per credit overage, plus SSO, row-level security, embedded analytics, BI migration, and dedicated support.
- Enterprise: Custom pricing, with unlimited credits, volume discounts, self-hosted deployment, audit logs, an SLA, and a dedicated account manager.
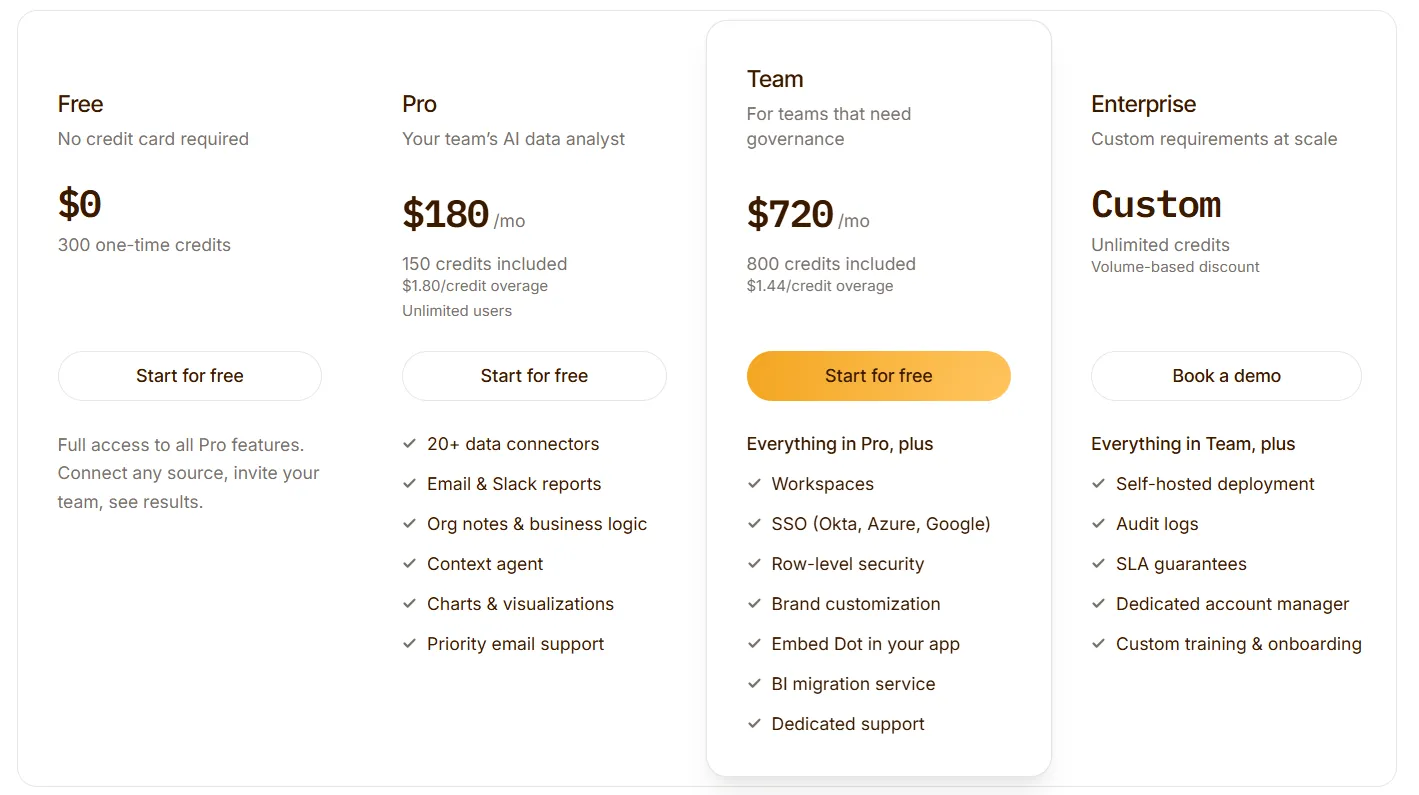
➡️ Annual billing takes 10% off any paid plan.
Dot pros and cons
✅ Written analysis with a recommendation, not just a chart to squint at.
✅ Weekly and monthly reviews build themselves into finished decks.
✅ Open the query and data behind any number it gives you.
✅ Metric definitions stay consistent, so the whose-number-is-right fights stop.
✅ Runs on the warehouse and models you already have, no migration.
✅ Billed on usage; seats are unlimited.
❌ It's not a dashboard builder.
❌ You'll need a connected warehouse.
#2: ThoughtSpot
Best for: Teams where business users keep pinging analysts for numbers, and everyone would be happier if they could just self-serve.
Similar to: Dot, Zenlytic.
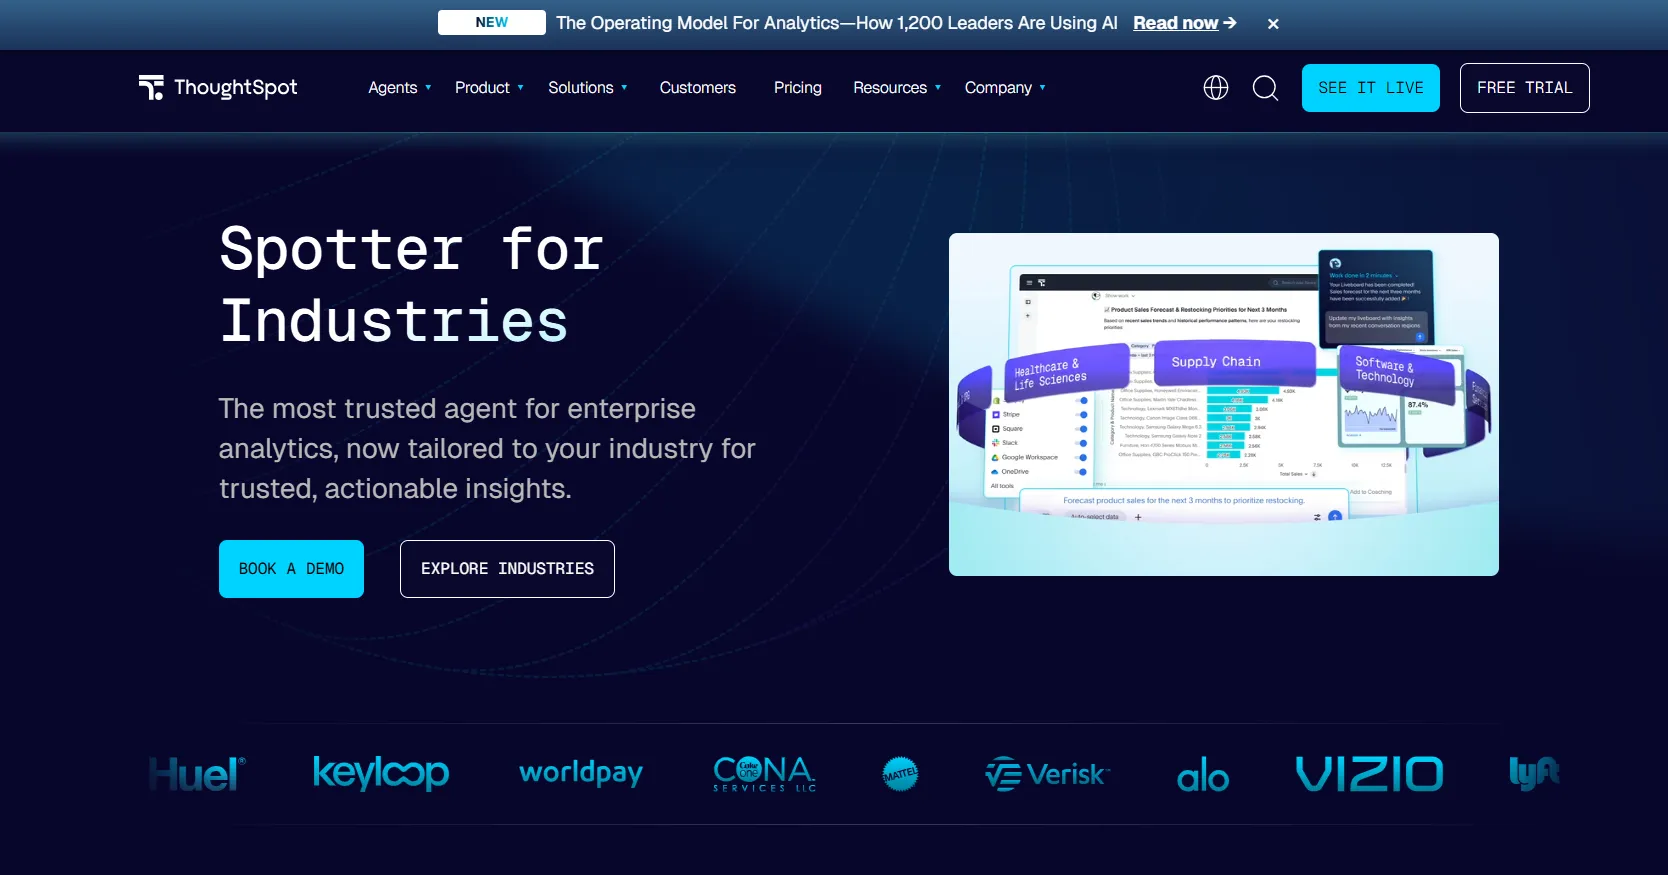
ThoughtSpot has been around long enough that most data leaders already have an opinion on it.
The original pitch was search: type a question, get a chart, and the newer one is Spotter, an agent that takes a prompt and comes back with a full analysis and a built-out dashboard, so the tool does more of the assembling than it used to.
ThoughtSpot's top features
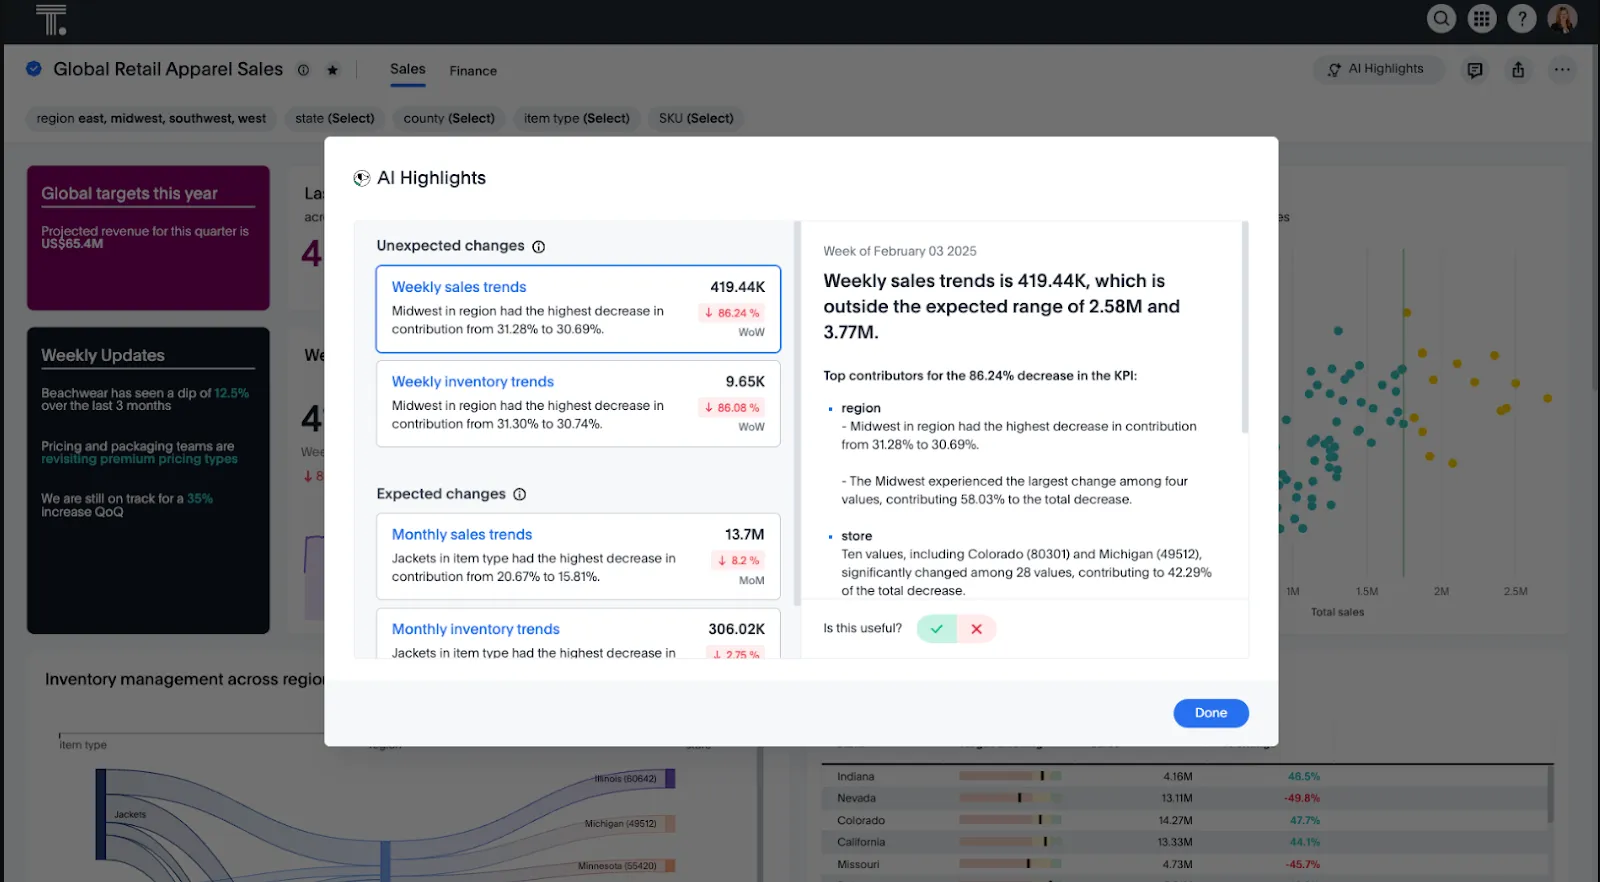
- Spotter agent: Hand it a question, and it returns a governed chart, then builds the surrounding dashboard for you, follow-ups included.
- Embeds into your own product: Teams shipping customer-facing analytics can place ThoughtSpot's search inside their app.
- SpotterViz: hand it a dataset, and it returns a finished, styled dashboard, layout and formatting included.
ThoughtSpot pricing
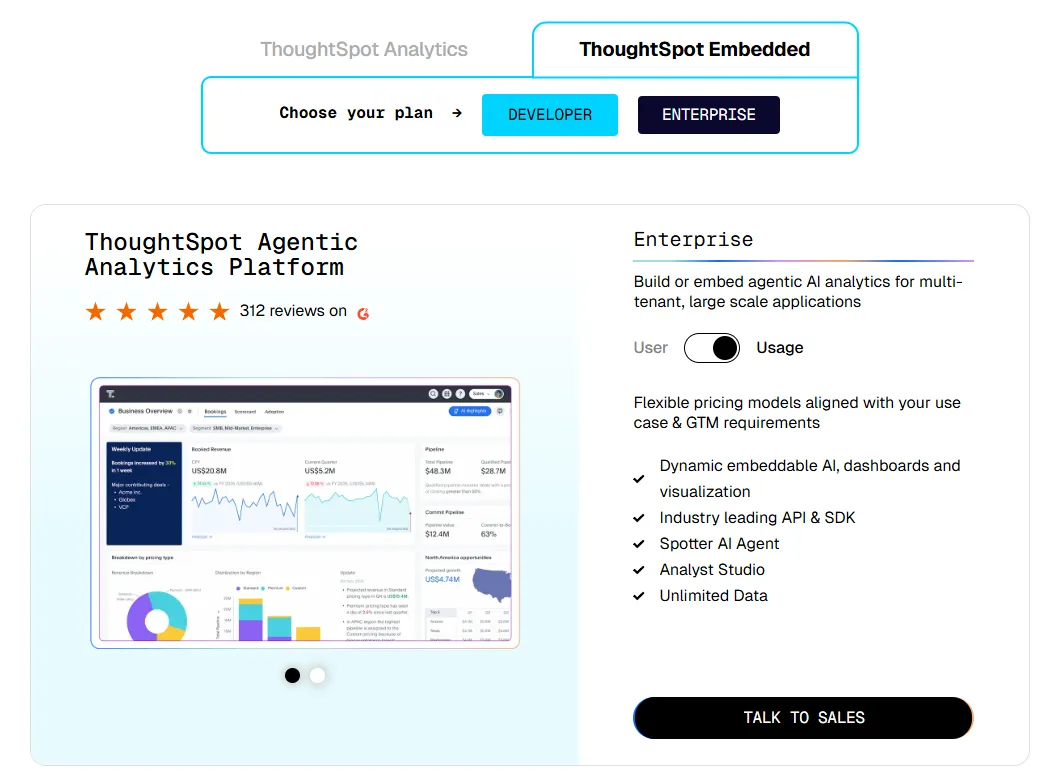
ThoughtSpot offers two separate products: ThoughtSpot Analytics for internal BI and ThoughtSpot Embedded for building analytics into applications - each with flexible pricing depending on scale and usage:
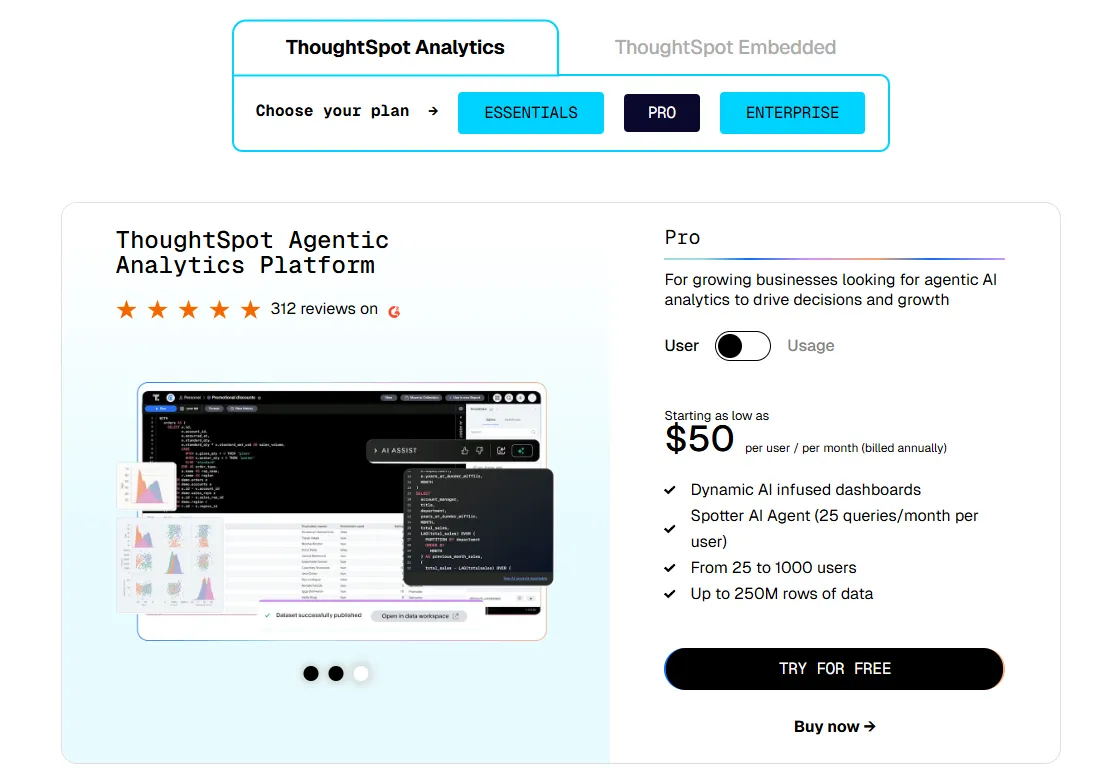
- ThoughtSpot Analytics:
- Essentials: From $25 per user per month (billed annually), for teams of 5-50 users, includes dynamic interactive dashboards and AI-powered insights and supports up to 25M rows of data.
- Pro (per user pricing): From $50 per user per month (billed annually), for 25–1,000 users, includes everything in Essentials, plus AI-infused dashboards and Spotter AI Agent (25 queries per user/month), and supports up to 250M rows of data.
- Pro (usage-based): From $0.10 per query, includes everything in Pro per user, and adds Analyst Studio.
- Enterprise (user or usage-based): Custom pricing, includes everything in Pro, plus unlimited users and data.
- ThoughtSpot Embedded:
- Developer: Free for 1 year, includes embeddable AI analytics, dashboards, and visualizations, APIs and SDKs, up to 10 users and 25M rows of data.
- Enterprise (user-based): Custom pricing, includes everything in Developer, plus unlimited data.
- Enterprise (usage-based): Custom pricing, everything in Enterprise, plus Spotter AI Agent and Analyst Studio.
ThoughtSpot pros and cons
✅ Non-technical people actually use the search bar, which is rather the whole point.
✅ Governance scales cleanly across a lot of teams.
❌ Two pricing structures (per user vs. usage-based) can get confusing at scale.
#3: Zenlytic
Best for: Data teams that have been burned by black-box AI tools and want answers they can defend.
Similar to: Dot, ThoughtSpot.
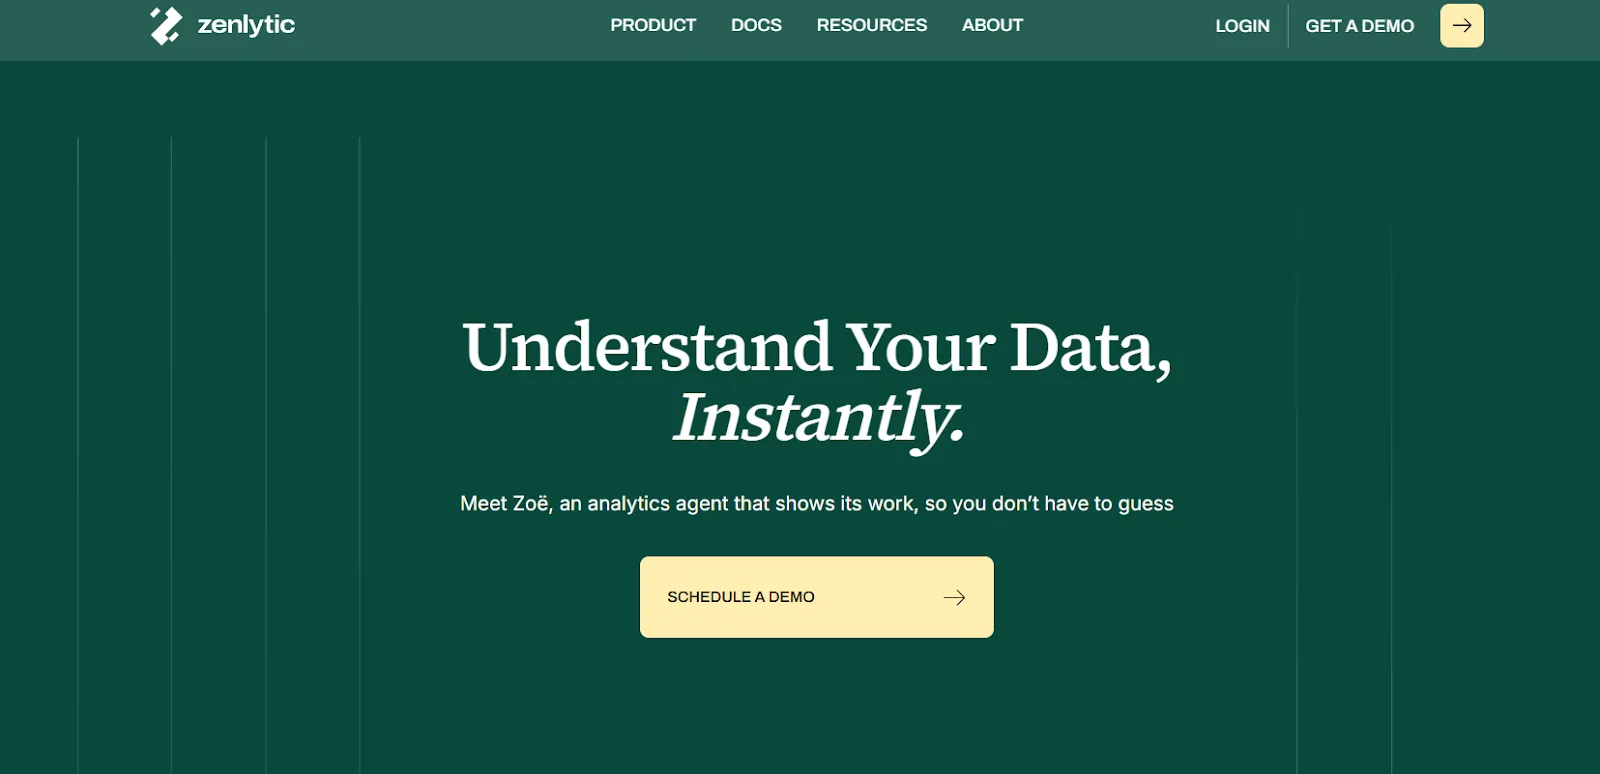
Zenlytic is an intelligent analytics platform built around Zoë, an AI analytics agent that helps users explore data and make decisions fast.
Zoë answers data questions and then shows the receipts, tracing each figure back to where it came from, and lately it's gone past answers into decks and Excel models that stay wired to the warehouse and refresh on their own.
Zenlytic's top features
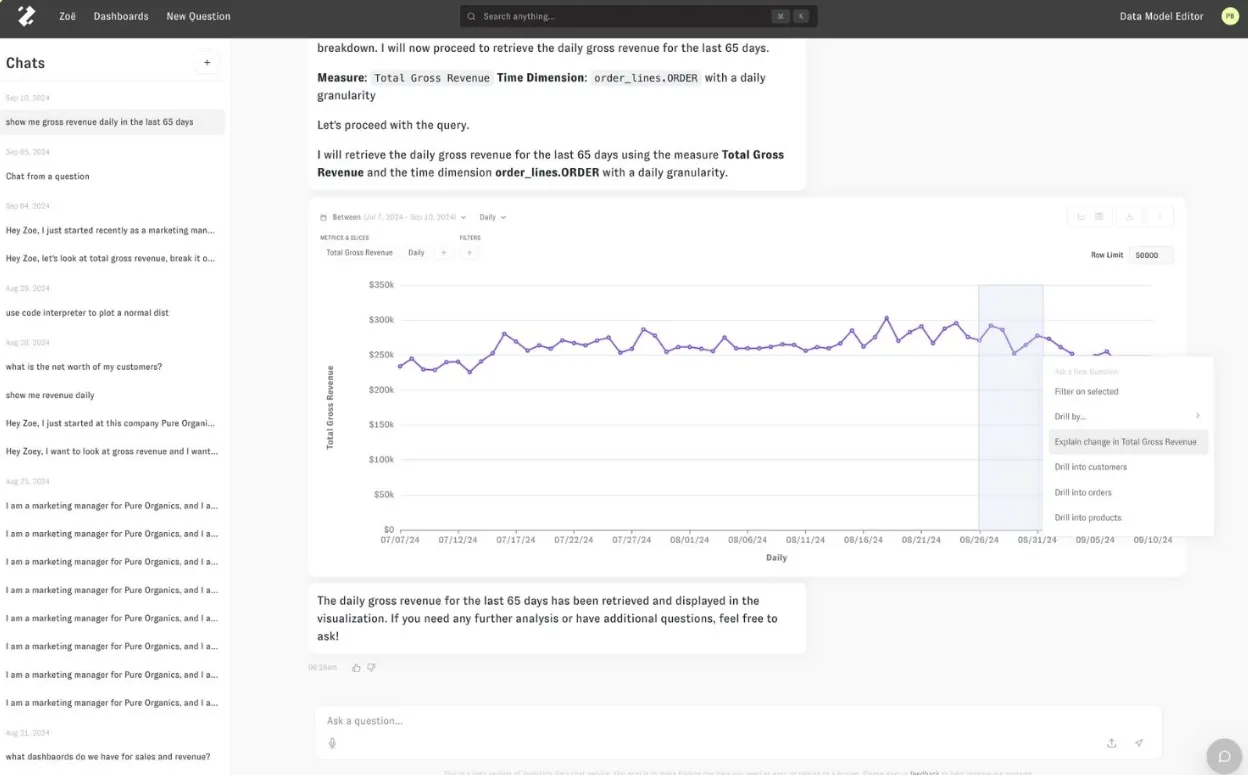
- Zoë with citations: Get a verifiable answer and click into the exact metrics and logic behind it, with locked definitions (Zenlytic calls them Memories) keeping the same question on the same number.
- Clarity Engine: An LLM-native semantic layer that lets teams define metrics and business logic once and reuse them across all queries, keeping answers consistent.
- Living artifacts: Presentations, financial models, and small data apps that pull from live warehouse data, so a deck doesn't rot the moment you export it.
Zenlytic pricing
Zenlytic keeps its numbers off the website, so you’ll need to book a demo to see the platform in action and request a custom quote.
Zenlytic pros and cons
✅ Showing its work is the headline feature, not a checkbox.
✅ Onboarding is light, since the agent learns your data and builds the semantic layer on its own.
❌ Pricing is not public.
#4: Domo
Best for: Mid-market and enterprise teams tired of duct-taping a stack together, who'd happily take one platform that does most of it.
Similar to: Power BI, ThoughtSpot.
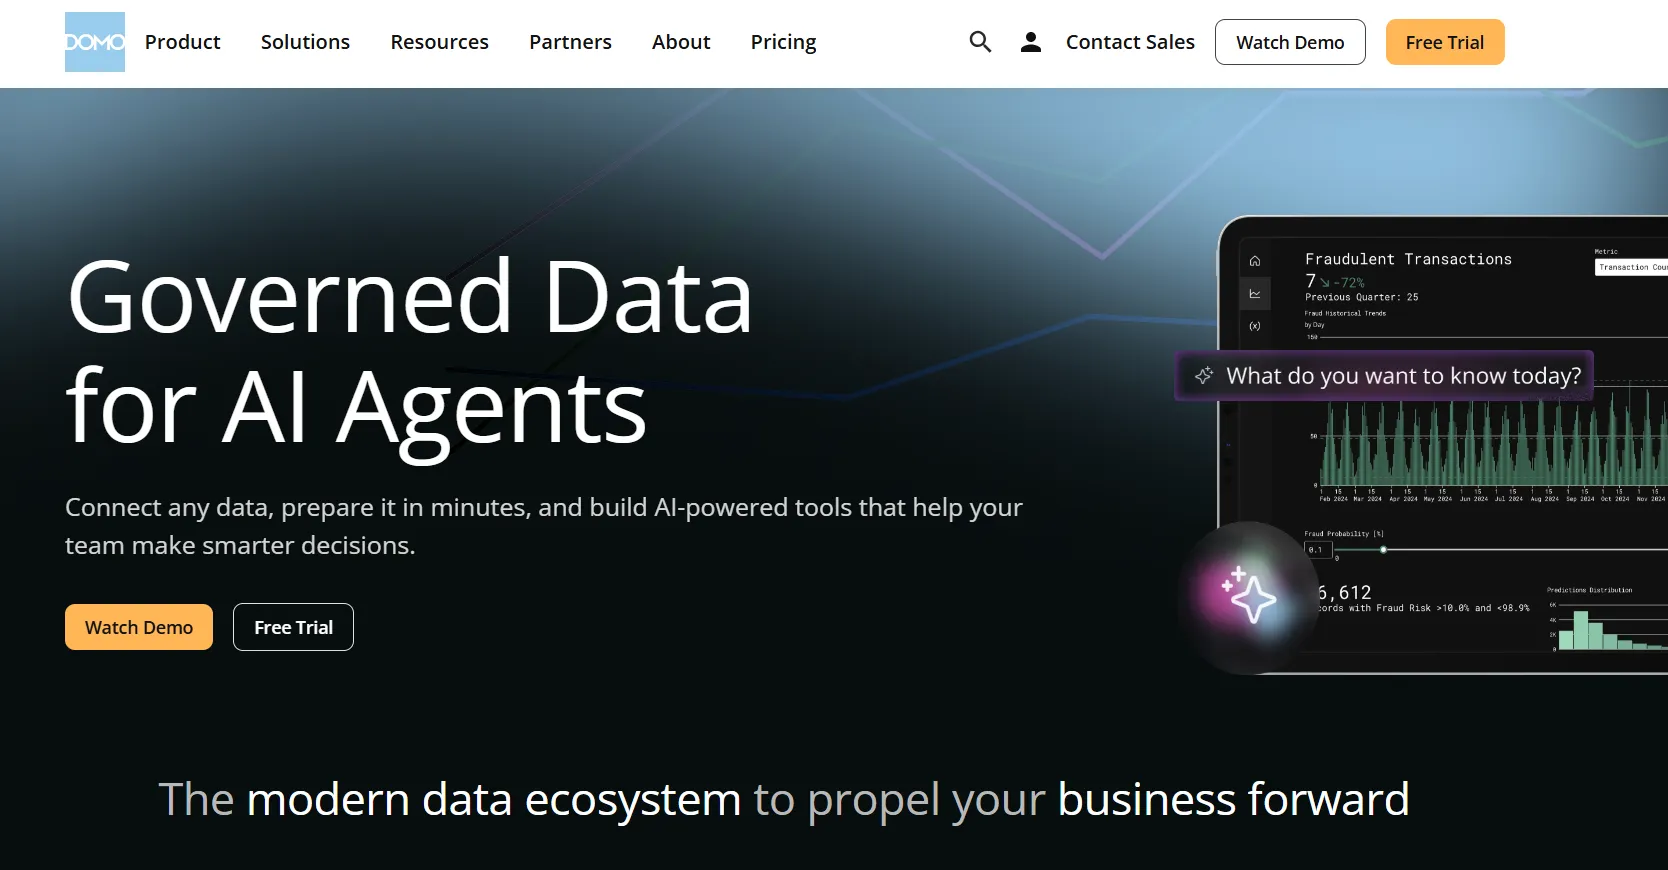
Domo's appeal is breadth.
Ingestion, modeling, dashboards, apps, and AI all happen in one cloud workspace, which is why it tends to land at companies that don't want five separate tools.
Domo's top features

- Modular cards and data apps: Reports snap together as Cards, and you can build no-code apps for planning or monitoring on top of them, then share or embed them wherever they're useful.
- Conversational AI with agents: Pose a question in natural language, and where you want action over an answer, point an agent at it to fire alerts or push updates when something crosses a line.
- Low-code app studio: build planning, forecasting, or monitoring apps with little to no engineering time.
Domo pricing
Domo has one paid plan and a free trial:
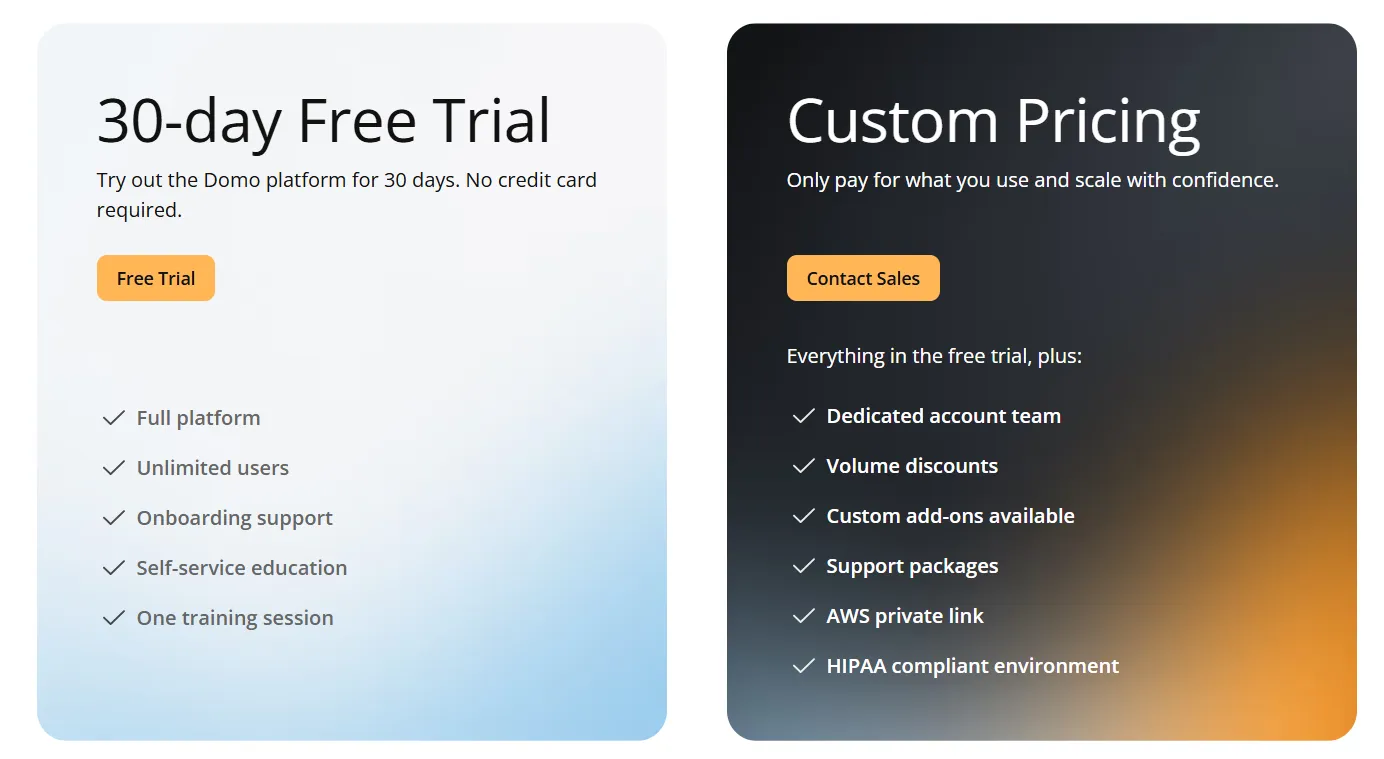
- Free trial: 30 days, no credit card required, includes unlimited users, full platform access, onboarding support, self-service education, and one guided training session.
- Paid plan: Usage-based pricing that scales with analytics needs, adds a dedicated account team, volume discounts, custom add-ons, and support packages.
Domo pros and cons
✅ Genuinely end-to-end, from raw data through to automation, under one roof.
✅ The connector catalog is deep, so getting data in is rarely the bottleneck.
#5: Sigma
Best for: Finance and ops people who'd rather build in a spreadsheet than learn a chart tool, but want warehouse-scale data underneath.
Similar to: Omni, Metabase.
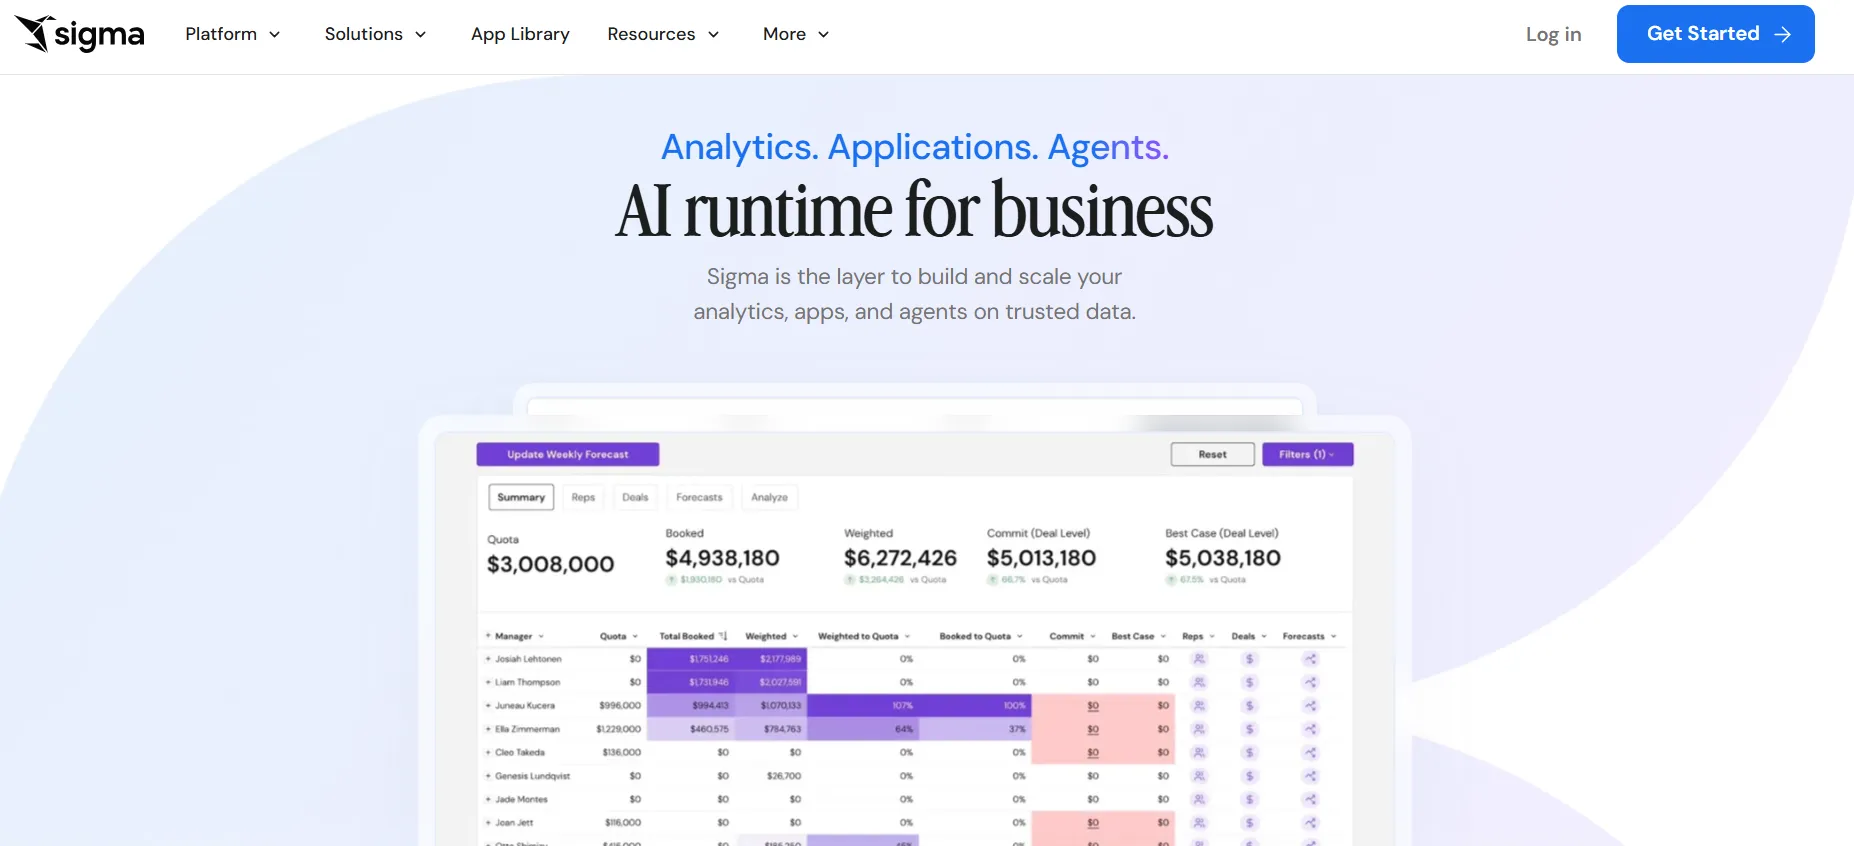
If your finance team's first instinct is to export everything to Excel, Sigma is the tool that talks them out of it.
The grid looks and behaves like a spreadsheet, but the formulas and pivots run live against Snowflake, BigQuery, Databricks, or Redshift, so nobody's working off a three-day-old extract, and AI features have been arriving on top of that grid over the past year.
Sigma's top features
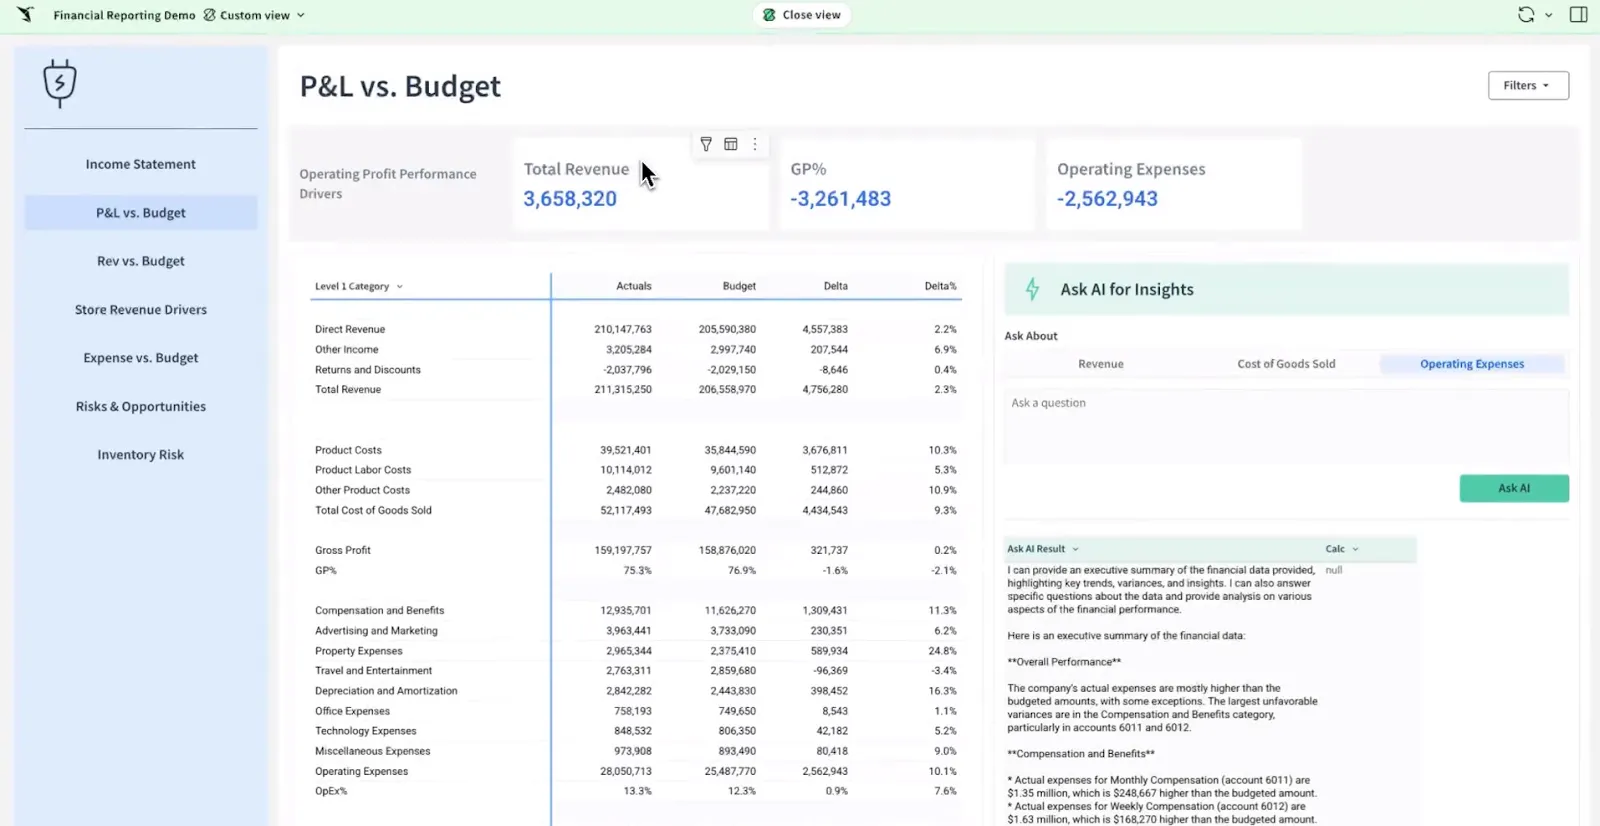
- A spreadsheet on the warehouse: Pivots, formulas, and grouped tables over billions of rows, in a layout anyone who's used Excel can navigate on day one.
- Ask Sigma: Describe the dashboard, summary, or small app you want, and it gets generated inside the workbook from a plain-language prompt.
- Team workbooks: Your team can build, comment on, and version analyses in a shared file without emailing CSVs around.
Sigma pricing
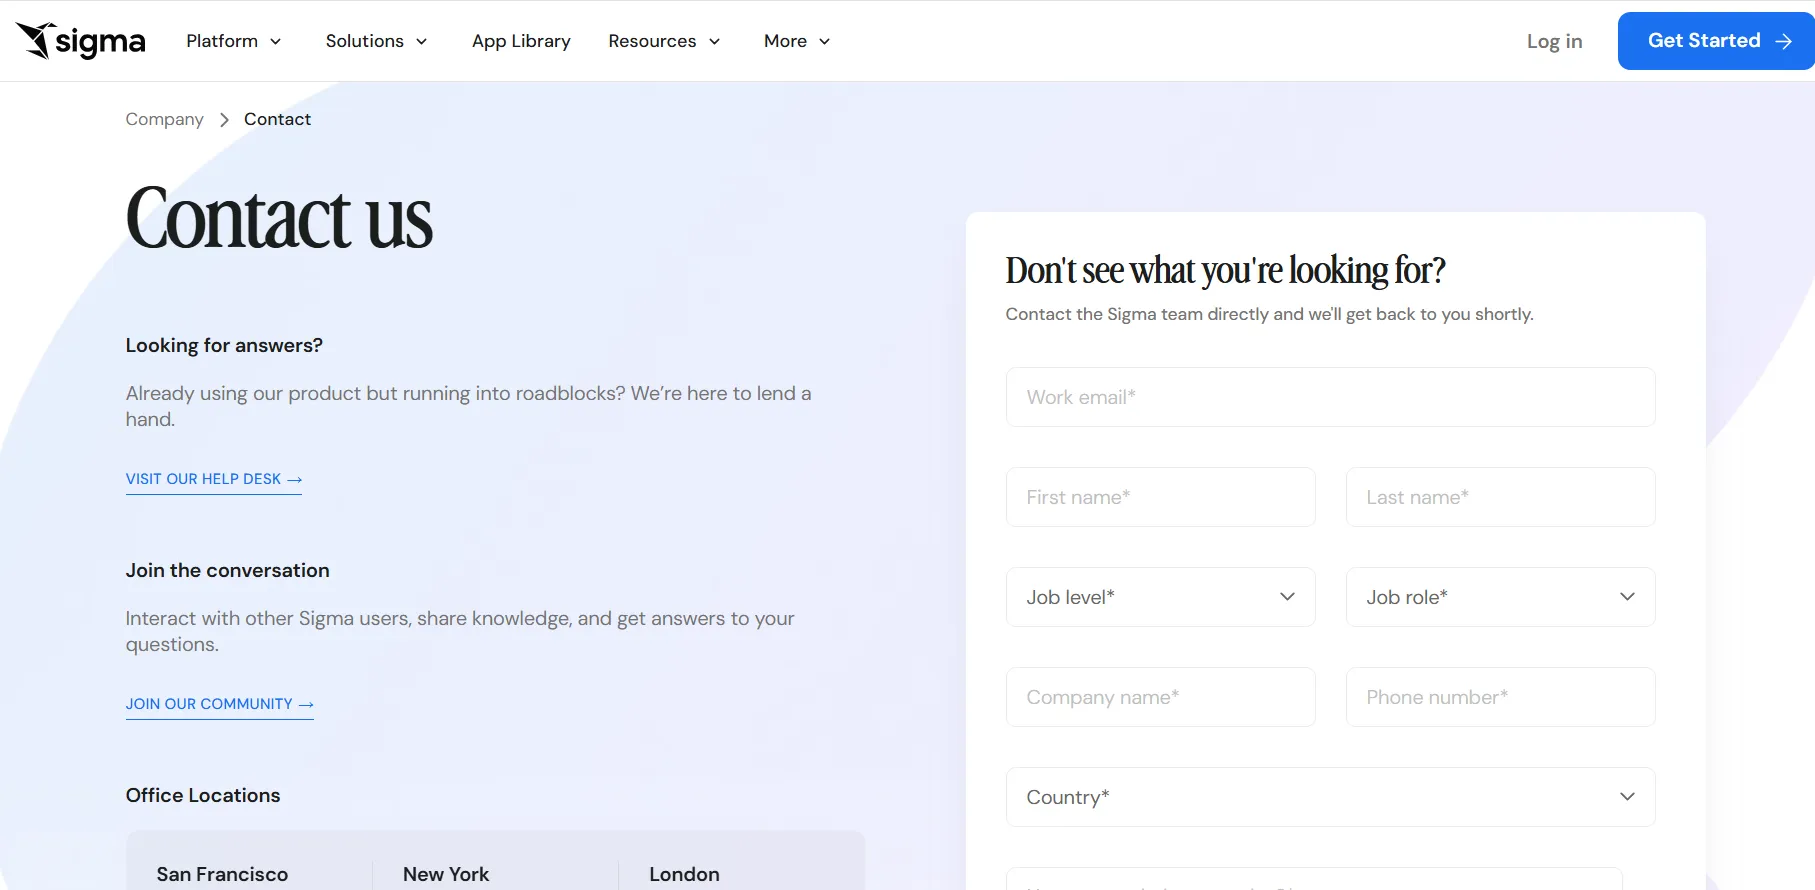
Sigma doesn't list prices publicly, so a tailored quote means a conversation with their sales team.
Sigma pros and cons
✅ Querying the warehouse directly keeps the data current and governed, with nothing copied out.
✅ The spreadsheet feel means finance and ops onboard themselves.
#6: Omni
Best for: Data teams that want a governed metrics layer without committing to a heavyweight modeling language.
Similar to: Looker, Sigma.
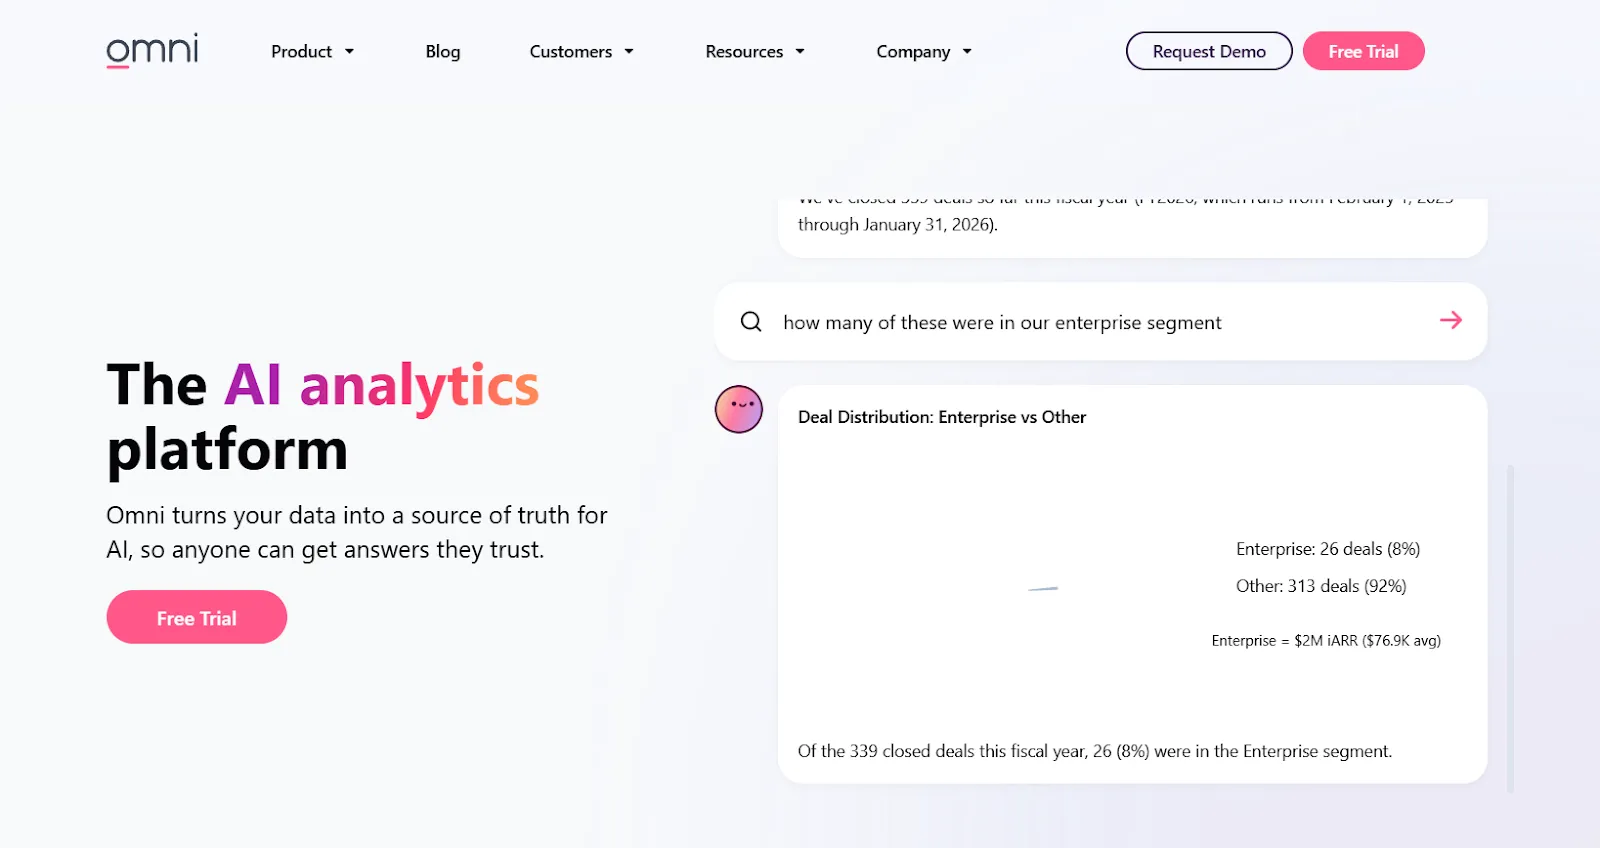
With Omni, you get a central place to define metrics so numbers stay consistent, and it plugs straight into your warehouse, so you can explore without waiting on a modeling backlog.
Omni's top features
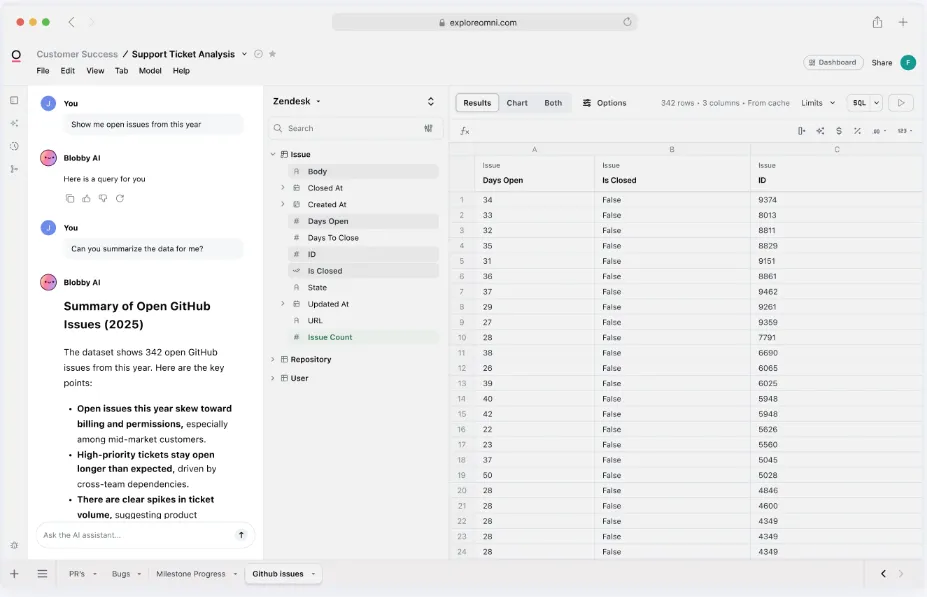
- Define once, reuse anywhere: Set a calculation in the shared model and it stays governed across every report, with none of the rigid modeling-language ceremony.
- AI where you explore: Chart summaries, drafted queries, and suggested next steps appear inside the workbook while you're working, not buried in a separate panel.
- Grid-style analysis: dig through live warehouse data in a familiar spreadsheet view while the governed metrics hold.
Omni pricing
Omni doesn't post subscription fees.
Omni pros and cons
✅ Exploration is genuinely fast, and the drag-and-drop is easy to pick up.
✅ It leans hard into dbt and direct warehouse queries, which fits a modern stack.
#7: Metabase
Best for: Startups and small data teams that want dashboards live this week, with the option to run the whole thing for free.
Similar to: Sigma, Omni.
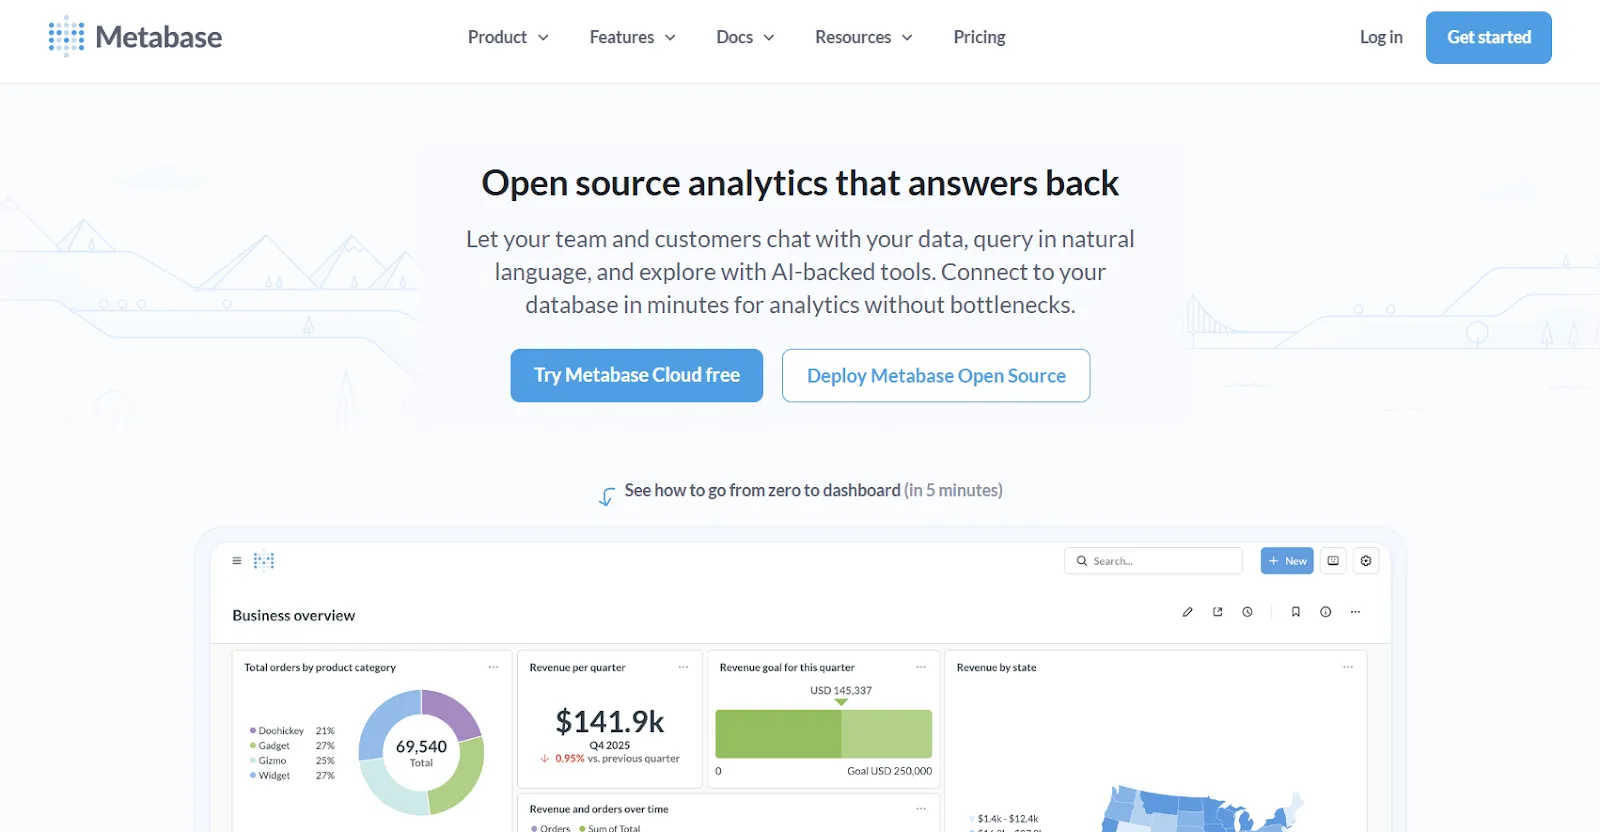
Metabase is usually the first BI tool a company installs, and for good reason.
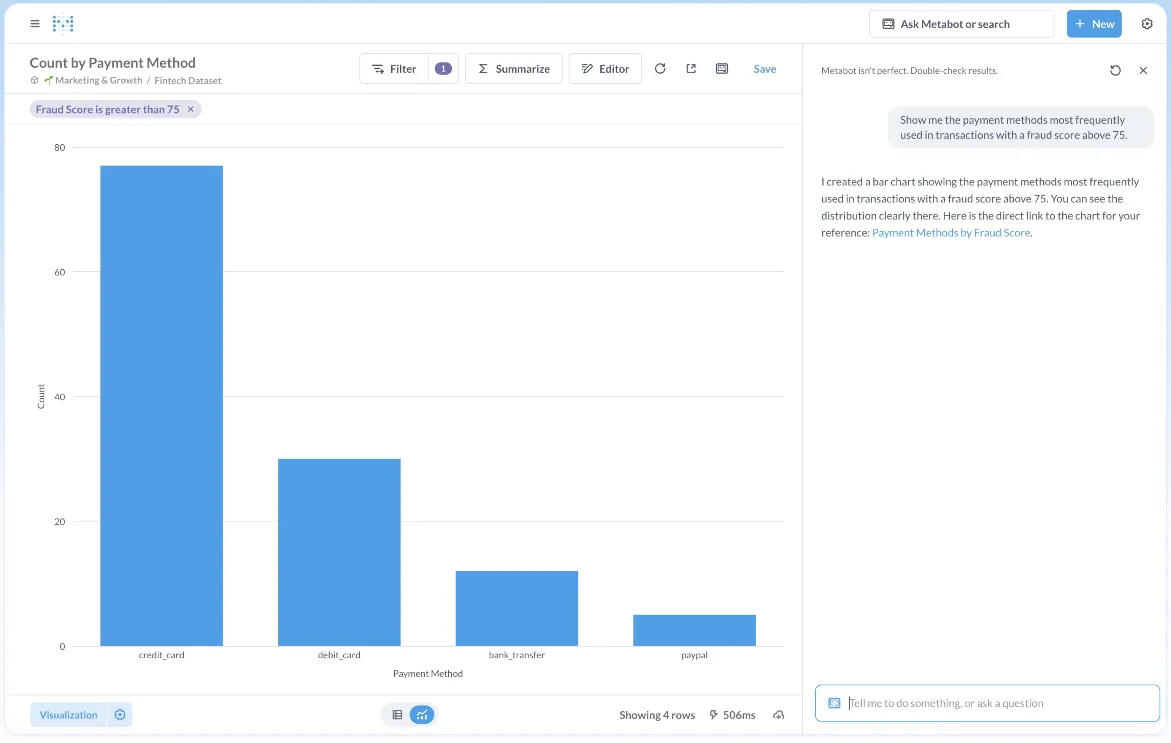
It's open source, quick to stand up, and carries no enterprise price tag, and you can click your way to a question through the builder or write SQL when you need it, with Metabot AI handling the plain-language asks.
Metabase's top features
- Builder, with SQL underneath: Point and click through joins and filters, and switch to raw SQL the moment a question outgrows the visual flow.
- Metabot and drill-downs: Type a question to get a query back, and click into any chart to slice it further without starting over.
Metabase pricing
Metabase offers two pricing options depending on how you use the product: internal business intelligence or customer-facing embedded analytics.
- Business Intelligence:
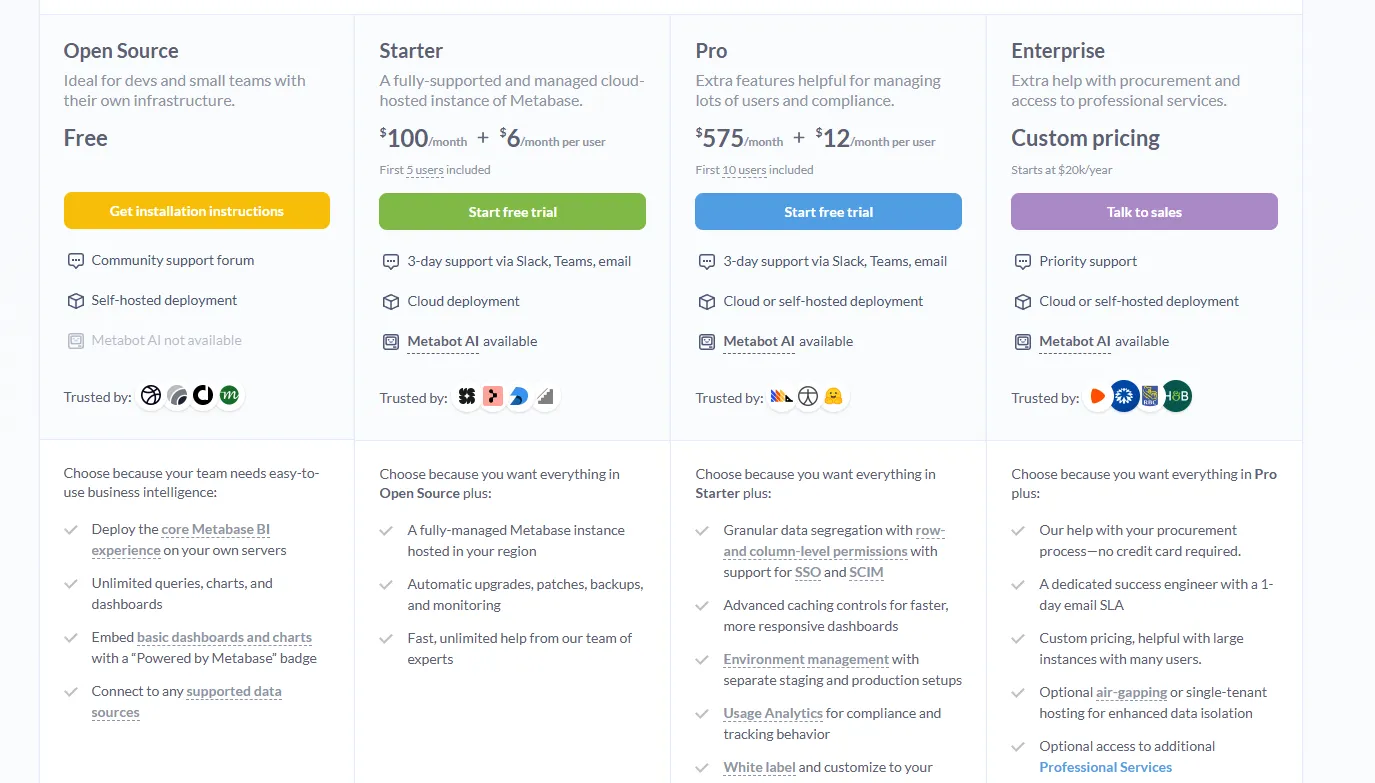
- Open Source (Self-hosted): Free, self-hosted deployment, includes unlimited queries, charts, and dashboards, connects to all supported data sources, basic embedding with “Powered by Metabase” branding, community support only.
- Starter (Cloud-hosted): $100/month + $6/user/month, first 5 users included, includes everything in Open Source, plus option to include Metabot AI (charged extra), automatic upgrades, backups, and monitoring, support via Slack, Teams, and email (3-day SLA).
- Pro: $575/month + $12/user/month, first 10 users included, cloud or self-hosted deployment, includes everything in Starter, plus row- and column-level permissions, SSO and SCIM support, advanced caching and performance controls, staging + production environments, usage analytics and audit visibility, white-labeling, and embedded analytics capabilities.
- Enterprise: Custom pricing (starts at $20k/year), includes everything in Pro, plus priority support, dedicated success engineer (1-day email SLA), optional single-tenant or air-gapped deployment, and optional professional services.
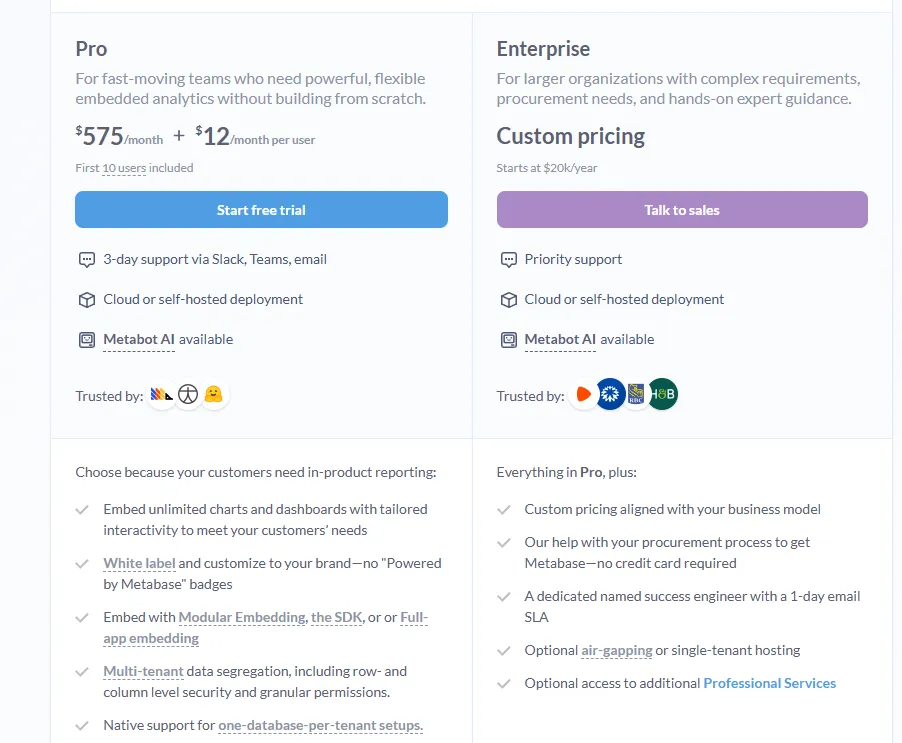
- Embedded Analytics pricing:
- Pro: $575/month + $12/user/month, first 10 users included, includes unlimited embedded dashboards and charts, full white-labeling, modular embedding, SDK, or full-app embedding, multi-tenant security (row- and column-level), one-database-per-tenant support, staging + production environments, usage analytics, internal BI for your team, and option to include Metabot AI (charged extra).
- Enterprise: Custom pricing (starts at $20k/year), includes everything in Pro, plus a dedicated success engineer, priority support, optional single-tenant or air-gapped hosting, and optional professional services.
Metabase pros and cons
✅ Self-hosting the open-source edition costs nothing but your own server.
✅ Setup on a fresh database is a same-afternoon job.
❌ The platform has limited advanced analytics and some dashboard customization constraints, according to a G2 review.
#8: Tableau
Best for: Analysts and large organizations that care about visualization craft and want a choice between cloud and self-hosted.
Similar to: Power BI, Qlik Sense.
For a lot of analysts, Tableau set the bar for what a dashboard could look like, and the visualization depth is still hard to match.
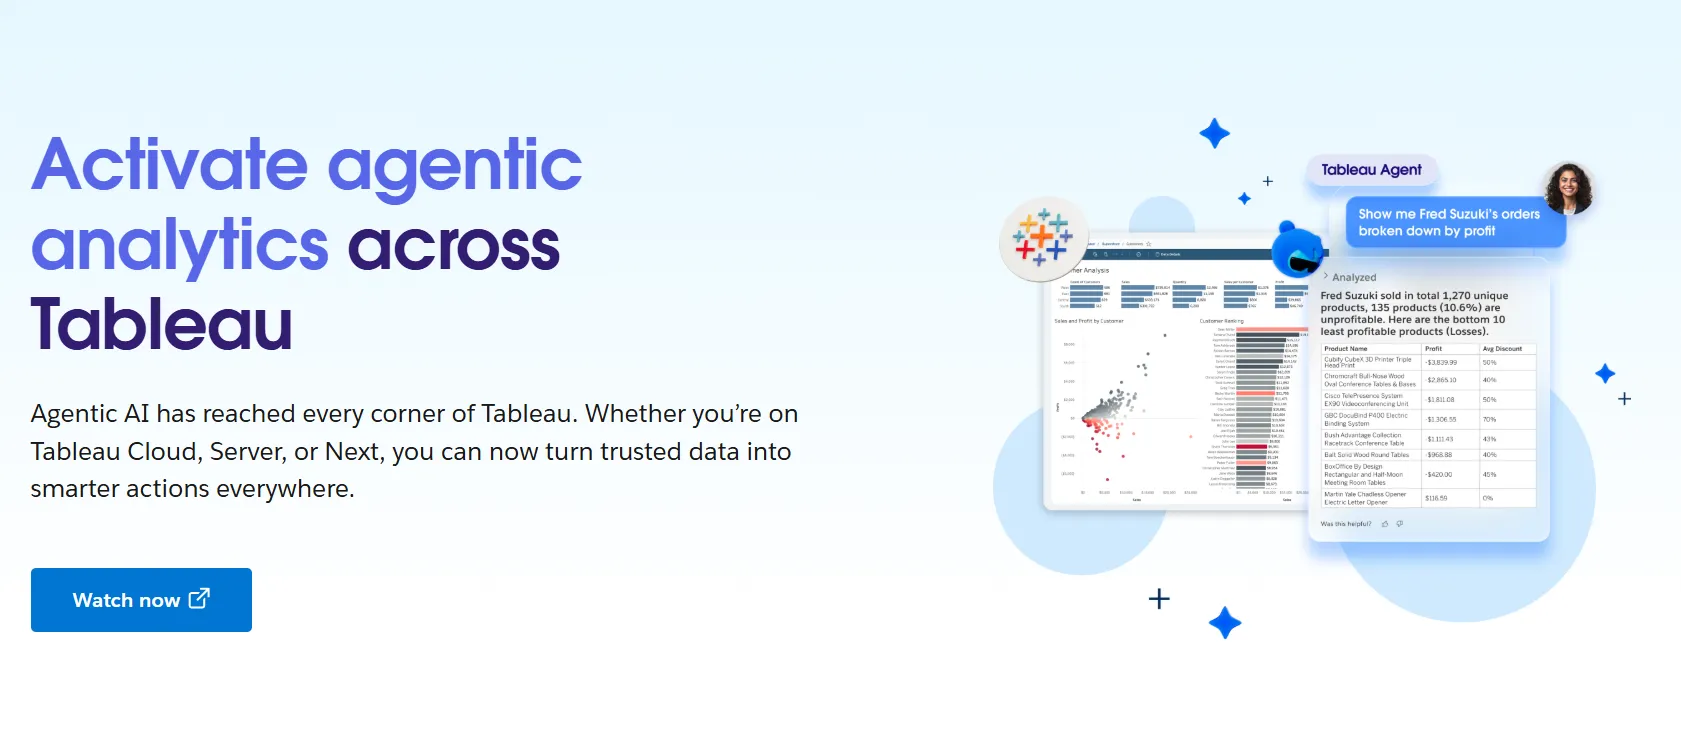
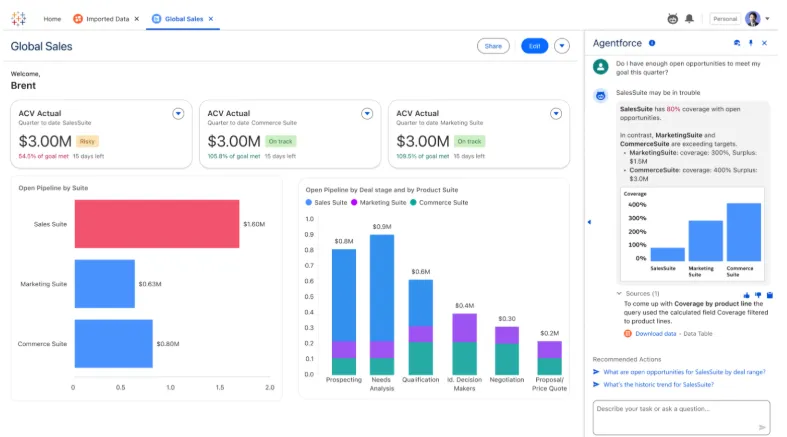
Tableau Next is the company's answer to the agentic era, bolting Agentforce-powered natural language and AI agents onto the exploration tools people already know.
Tableau's top features
- Visualization craft: A canvas where you pull fields into interactive dashboards, with a chart library and inline filtering that goes properly deep.
- Tableau Next and Pulse: Natural-language questions answered in Slack or Salesforce, while Pulse handles shared metric definitions and role-based permissions across bigger rollouts.
Tableau pricing
Tableau uses per-user, per-month pricing, with separate plans depending on whether you deploy Tableau in the cloud, on your own servers, or as part of its newer AI-driven offering:
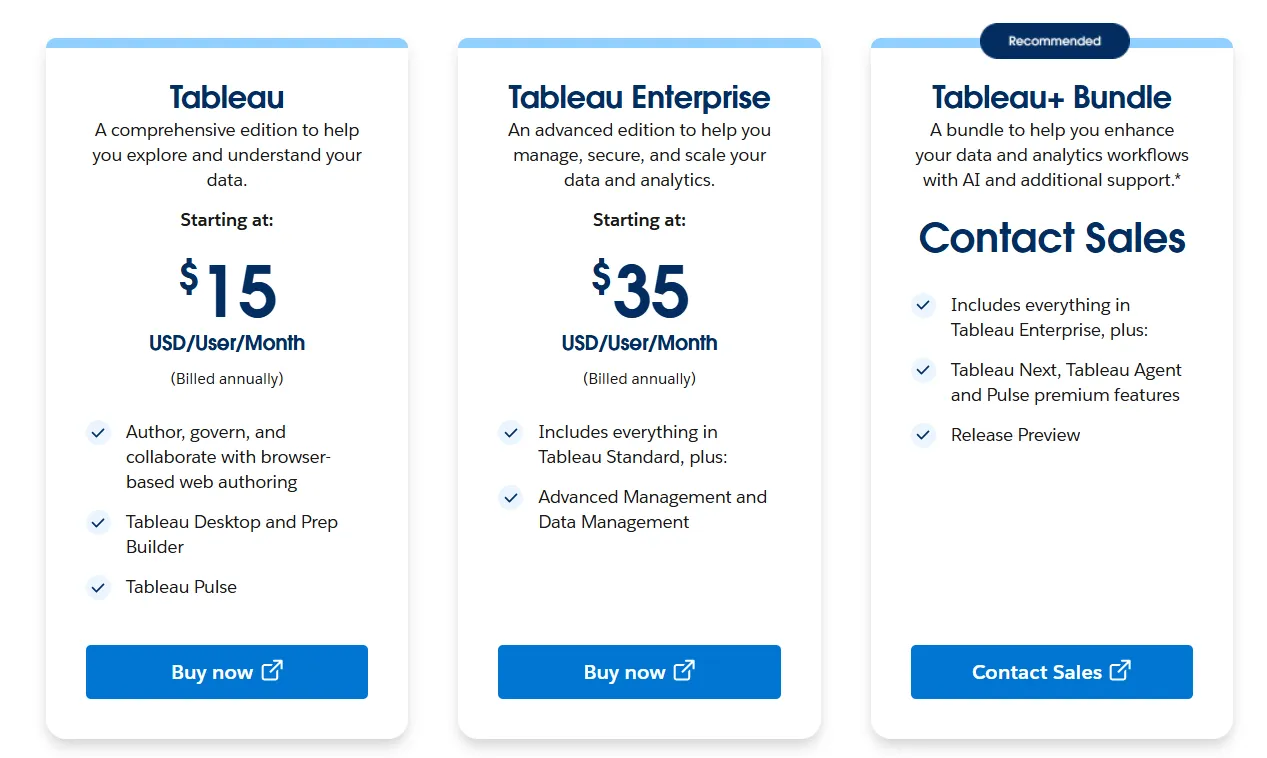
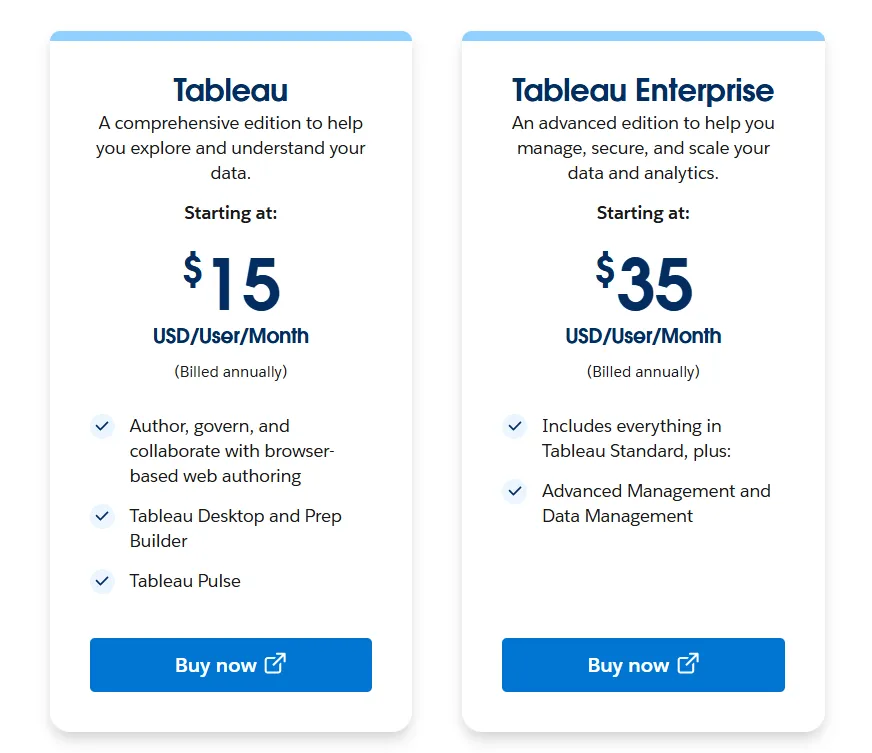
- Tableau Cloud has three pricing plans:
- Tableau Standard: Starts at $15/user/month, which includes browser-based authoring and collaboration, Tableau Desktop and Prep Builder, Tableau Pulse for metrics and insights.
- Tableau Enterprise: Starts at $35/user/month and includes everything in Standard, plus Advanced Management and Data Management for governance and scale.
- Tableau+ Bundle (Cloud + AI): Custom pricing, includes everything in Tableau Enterprise, plus Tableau Next, Tableau Agent, and Pulse premium features, with access to release previews and early AI capabilities.
- Tableau Server has two pricing plans:
- Tableau Standard: Starts from $15 per user/month, which includes authoring, governance, and collaboration and Tableau Desktop and Prep Builder.
- Tableau Enterprise: Starts from $35 per user/month, which includes everything in Standard, plus Advanced Management, Data Management, and eLearning.
- Tableau Next (agentic analytics) has 2 plans:
- Tableau Next: Starts from $40/month/seat, and includes Agentforce Tableau, Tableau Semantics, and its Native Slack integration.
- Tableau + Bundle: Custom pricing, which includes everything in Tableau Enterprise, plus Tableau Next, Tableau Agent and Pulse premium features.
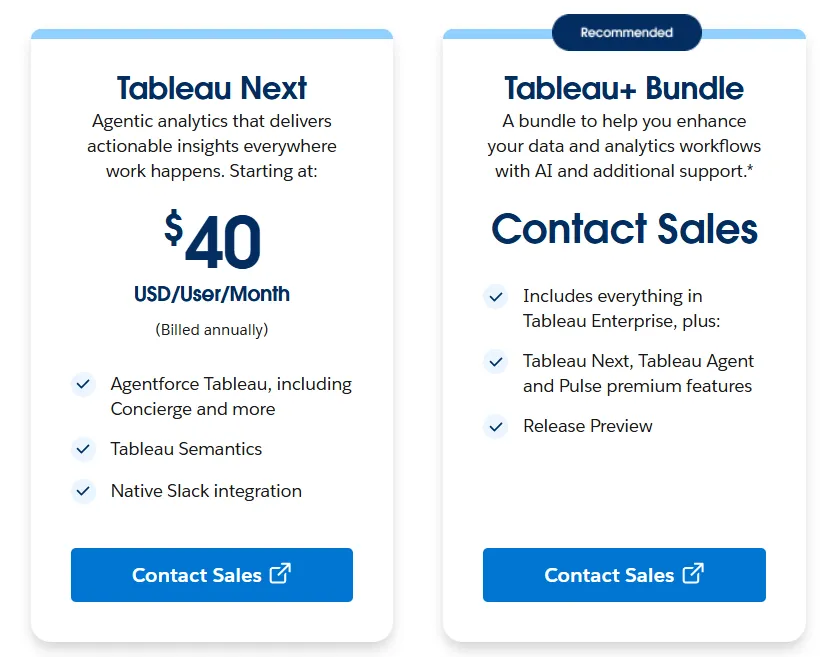
Tableau pros and cons
✅ The visualization depth is about as good as BI gets.
✅ A massive community means there's a tutorial or a certification path for almost anything.
❌ Per-user pricing can scale fast for organizations rolling out broadly.
#9: Microsoft Power BI
Best for: Microsoft 365 shops that want reporting and self-service analytics without adding a tool from outside the ecosystem.
Similar to: Tableau, Domo.
Power BI's real edge isn't any single feature; it's that it already lives where Microsoft shops work.
Modeling, dashboards, paginated reports, and Copilot-style AI all come in the box, and the tight wiring into Excel, Teams, and SharePoint usually settles the decision before a bake-off even starts.
Power BI's top features
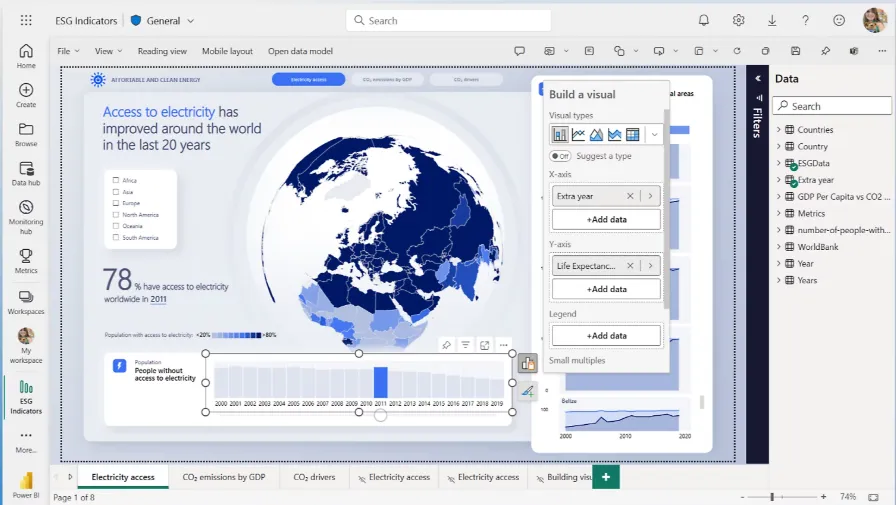
- Publishable reports: You can layer visuals, filters, and drill-throughs, then push the result out to the whole org.
- Enterprise governance: Apply row-level security, sensitivity labels, and Microsoft Entra ID controls.
- Copilot assists: The solution drafts forecasts, flags the odd anomaly, and writes the summary commentary so you don't have to.
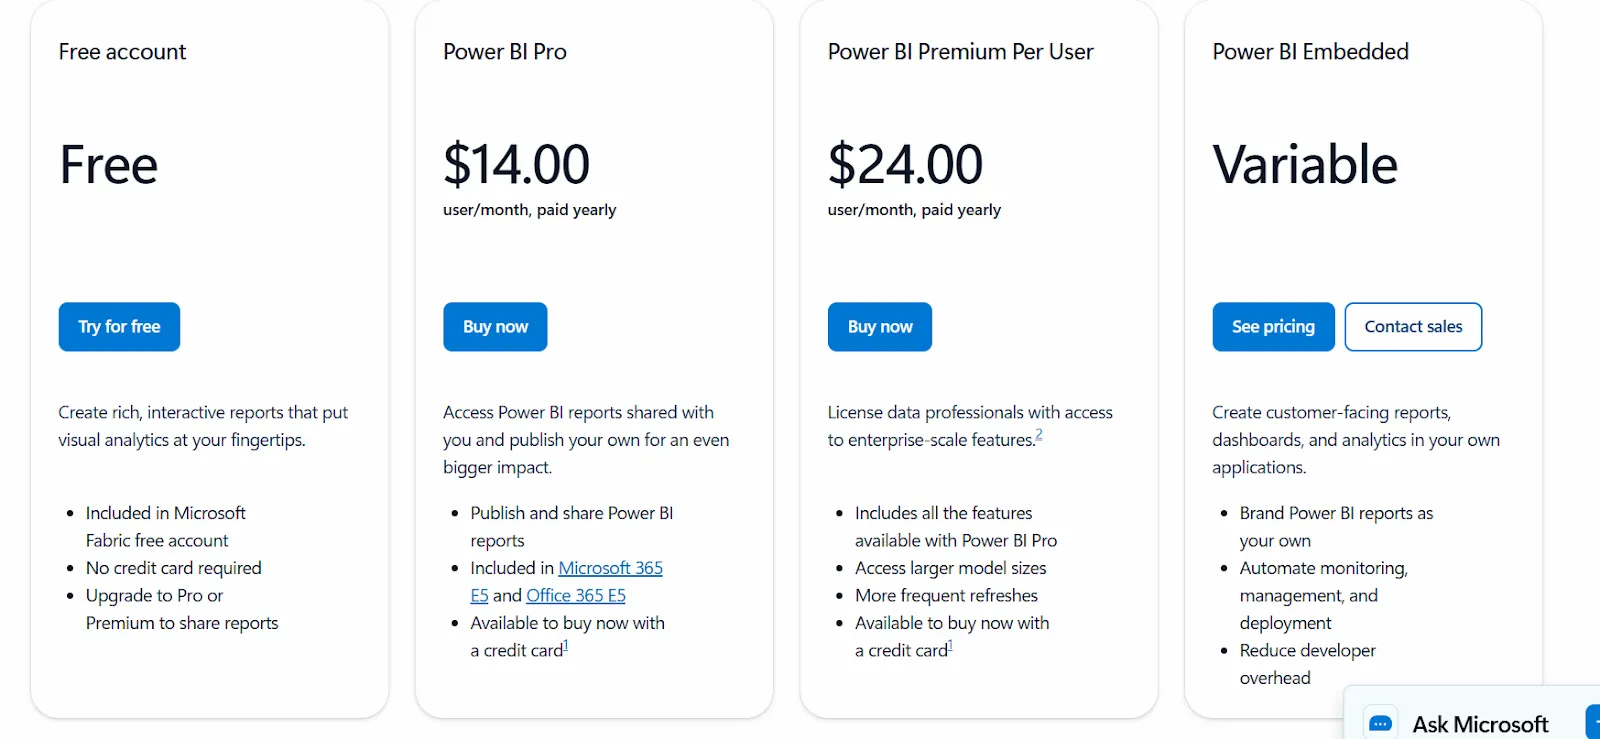
Power BI pricing
Power BI uses a per-user and capacity-based model:
- Free: Build personal reports and dashboards, but no sharing or collaboration.
- Power BI Pro: $14/user/month, includes report publishing, workspace sharing, scheduled refresh, and Teams or SharePoint embedding.
- Power BI Premium Per User: $24/user/month, adds larger model sizes, more refreshes per day, paginated reports, and AI features.
- Power BI Embedded: Custom pricing for customer-facing analytics inside your own apps.
Power BI pros and cons
✅ Publishable reports for the whole company to see.
✅ Inside a Microsoft shop, the Excel and Teams integration is tough to argue with.
❌ The learning curve can feel steep (for beginners), particularly when you start working with data modeling and DAX formulas, according to a G2 review.
#10: Qlik Sense
Best for: Governed or on-prem environments that need to explore data sideways, not just down a fixed drill path.
Similar to: Tableau, Power BI.
Qlik's associative engine lets you click any value and the whole view recalculates around it, which surfaces connections a top-down drill path tends to bury.
That flexibility, paired with solid on-prem options, is why Qlik shows up so often in regulated, security-conscious orgs.
Qlik Sense's top features
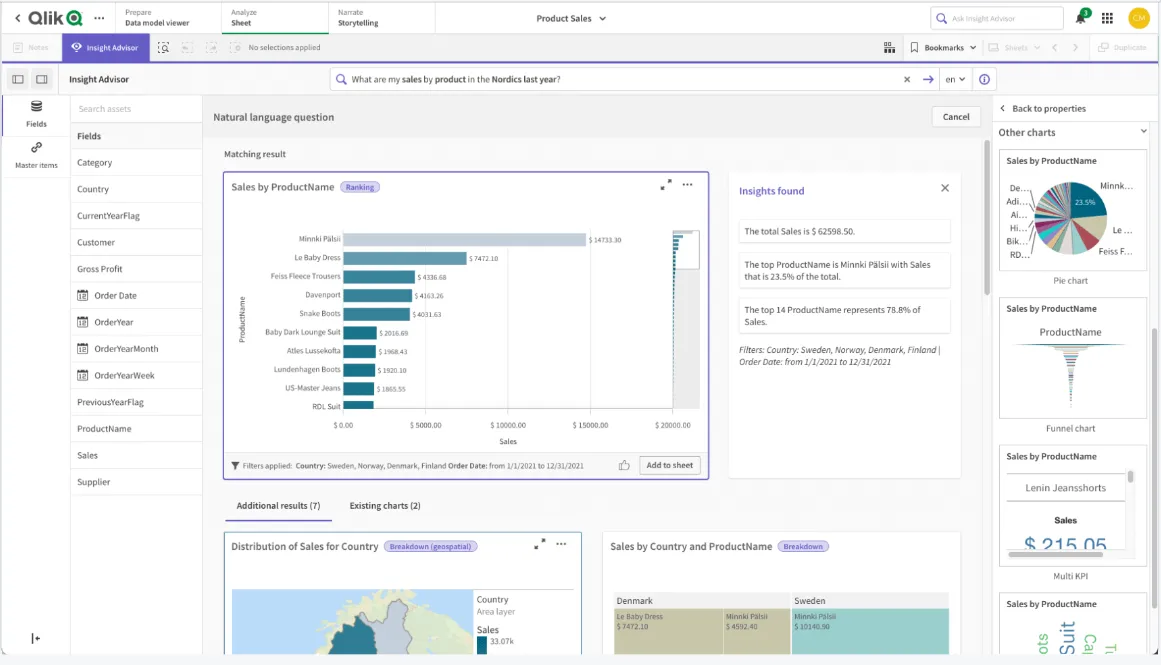
- Associative exploration: Pick a value and everything else on screen recomputes at once, so you can wander across dimensions freely.
- Insight Advisor: AI-suggested insights and natural-language search, with alerts that fire when a metric you're watching crosses a threshold.
- Real-time alerts: Trigger notifications or downstream actions when monitored metrics cross defined thresholds.
Qlik Sense pricing
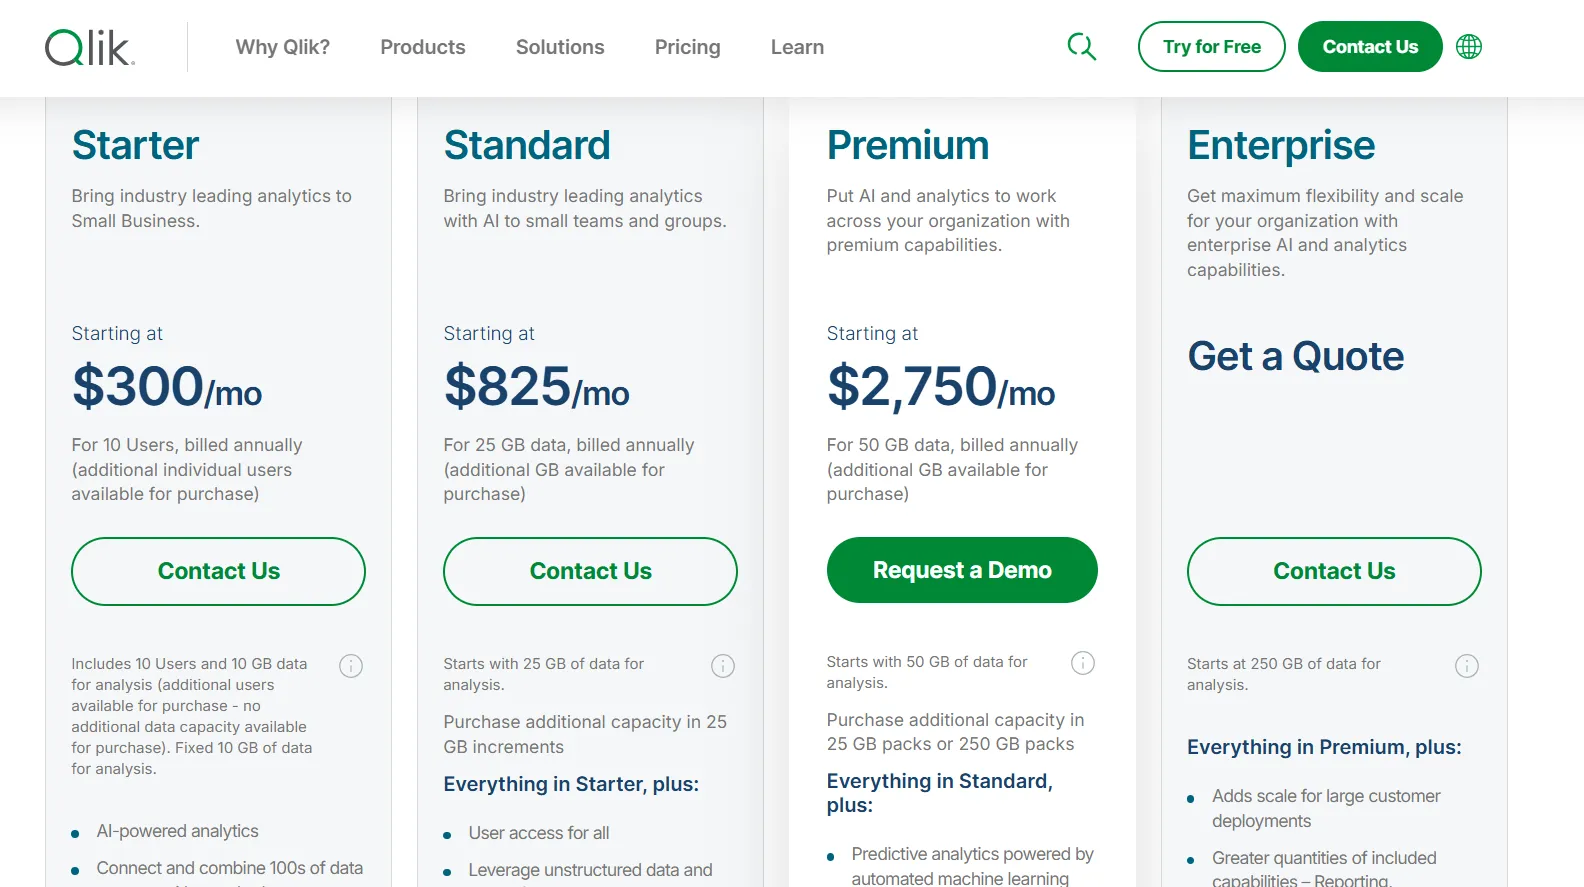
Qlik Cloud Analytics (the SaaS version of Qlik Sense) has four pricing tiers, all billed annually:
- Starter: $300/month, includes 10 users, 10 GB of data for analysis (fixed), AI-powered analytics, 100s of standard data source connectors, interactive dashboards, 5 GB max app size, and Qlik Community Support.
- Standard: $825/month, starts with 25 GB of data for analysis (additional capacity available in 25 GB increments), includes everything in Starter, plus user access for all, GenAI for unstructured data, managed and shared spaces, 1 GB of Personal Space, augmented advanced analytics, and 24x7 critical support.
- Premium: $2,750/month, starts with 50 GB of data for analysis (additional capacity in 25 GB or 250 GB packs), includes everything in Standard, plus predictive analytics powered by automated machine learning, additional GenAI capacity, anonymous access, SAP and Mainframe connectors, data lineage, 10 GB max app size, and guided customer success onboarding.
- Enterprise: Custom pricing, starts at 250 GB of data for analysis, includes everything in Premium, plus greater capacity for reporting, automations, machine learning models, and dataset size, 15 GB apps as standard (up to 50 GB per app available), 3 GB of Personal Space, multi-region tenants, and a personalized customer success plan.
Qlik Sense pros and cons
✅ The associative engine is excellent for complex, many-angle exploration.
✅ It's a comfortable fit for governed and on-prem requirements.
❌ One user on G2 mentions that sometimes there are loading issues, especially when business intelligence is running updates.
Get started with Dot for free
Dot is built specifically for teams that want the answer written out, and not a chart handed over to interpret.
Here’s what you get with Dot:
- Questions asked in Slack or Teams come back as answers there, in email, or in the web app, scheduled reports included.
- Weekly and monthly reviews run themselves and arrive as ready-to-present PowerPoints.
- The Context Agent keeps definitions consistent, so teams aren't reconciling numbers before meetings.
- Any figure traces back to its query and source data in a single click.
- Native connections to Snowflake, BigQuery, Redshift, Databricks, and more.
- Your dbt, Looker, and Power BI modeling carries over without a migration.
- SOC 2 Type II compliance and enterprise-grade access controls.
- Usage-based pricing, with unlimited seats.
➡️ Get started for free with Dot's Starter plan, or schedule a demo to see how it works with your data.
⚠️ Disclaimer: This article was last updated on the 4th of June, 2026. If anything here has been misinterpreted, reach out, and we'll fact-check it.
Theo Tortorici
Theo writes about AI-powered analytics, data tools, and the future of business intelligence at Dot.