
10 Best ThoughtSpot Alternatives & Competitors In 2026
If you're shopping around for a ThoughtSpot alternative in 2026, this guide breaks down the 10 strongest options across three categories: AI-powered analytics platforms, enterprise BI tools, and warehouse-native or open-source BI tools.
For each one, I'll cover the features that matter, the actual pricing, and the honest pros and cons.
TL;DR
- Dot offers the best ThoughtSpot alternative, as it delivers full written analysis instead of charts to interpret, runs on a Context Agent that maintains shared business definitions across teams, and has root cause analysis.
- If you want classic dashboarding and visual exploration at scale, Tableau, Microsoft Power BI, and Qlik Sense are the established enterprise platforms with the deepest BI track record.
- For warehouse-native semantics, spreadsheet-style analysis, or open-source flexibility, Looker, Sigma, and Metabase give data teams more direct control over how analytics get modeled and shared.
What are the best ThoughtSpot alternatives in 2026?
The best ThoughtSpot alternatives in 2026 are: Dot, Tableau, and Microsoft Power BI.
Here's a breakdown of the 10 tools I’ve shortlisted:
Tool | Use Case | Price |
Dot | An AI data analyst that writes the analysis for you, with recommendations and a full audit trail on every insight. | Free plan; Paid from $180/month. |
Tableau | Visual analytics, exploratory dashboards, and Gemini-powered agentic features for large data teams. | From $75/creator/month. |
Microsoft Power BI | Standardized reporting and self-service analytics for organizations on the Microsoft stack. | Free plan; Pro from $14/user/month. |
Qlik Sense | Associative analytics for free-form exploration across complex datasets. | Custom pricing. |
Domo | All-in-one cloud BI that bundles data integration, dashboards, automation, and AI. | Custom pricing (30-day free trial). |
Omni | A flexible, modern semantic layer without the rigidity of older BI platforms. | Custom pricing. |
Hex | AI-powered analytics platform combining notebooks, conversational self-serve, and data apps in one workspace. | Free plan; Professional from $36/Editor/month. |
Looker | Warehouse-native BI built around LookML semantics and Gemini-powered conversational analytics. | Custom pricing (annual contract). |
Sigma | Spreadsheet-style analytics on live warehouse data without exports or extracts. | Custom pricing. |
Metabase | Open-source BI that ships fast and works for both technical and business users. | Free (Open Source); Cloud from $100/month. |
What are the best AI-powered ThoughtSpot alternatives?
The tools in this section all use AI to close the gap between question and answer, but they approach it from different angles.
Here are the best AI-powered ThoughtSpot alternatives in 2026:
#1: Dot
Dot is the best AI-powered ThoughtSpot alternative on the market for teams that want their answers delivered as written analysis, in the workflow tool they already use, with the reasoning shown.
Our platform is not trying to give you a faster way to build charts: we believe that AI on top of your warehouse can produce decision-ready analysis with the same rigor a human analyst would apply, delivered in the chat tool where the actual conversation is already happening.
That changes who gets to use analytics, and it changes what "self-service" actually means in practice.
Here's what that looks like day to day: 👇
Ask a business question and get the analysis written for you
With Dot, the write-up is the headline output, not the chart.
When your VP of Sales asks why pipeline velocity dropped 18% in the last two weeks, the response isn't a line chart with a downward trend.
It's a multi-paragraph analysis that breaks down the drop by region, segments it by deal size, identifies which reps and which campaigns drove the change, and ends with a list of specific things worth investigating next.
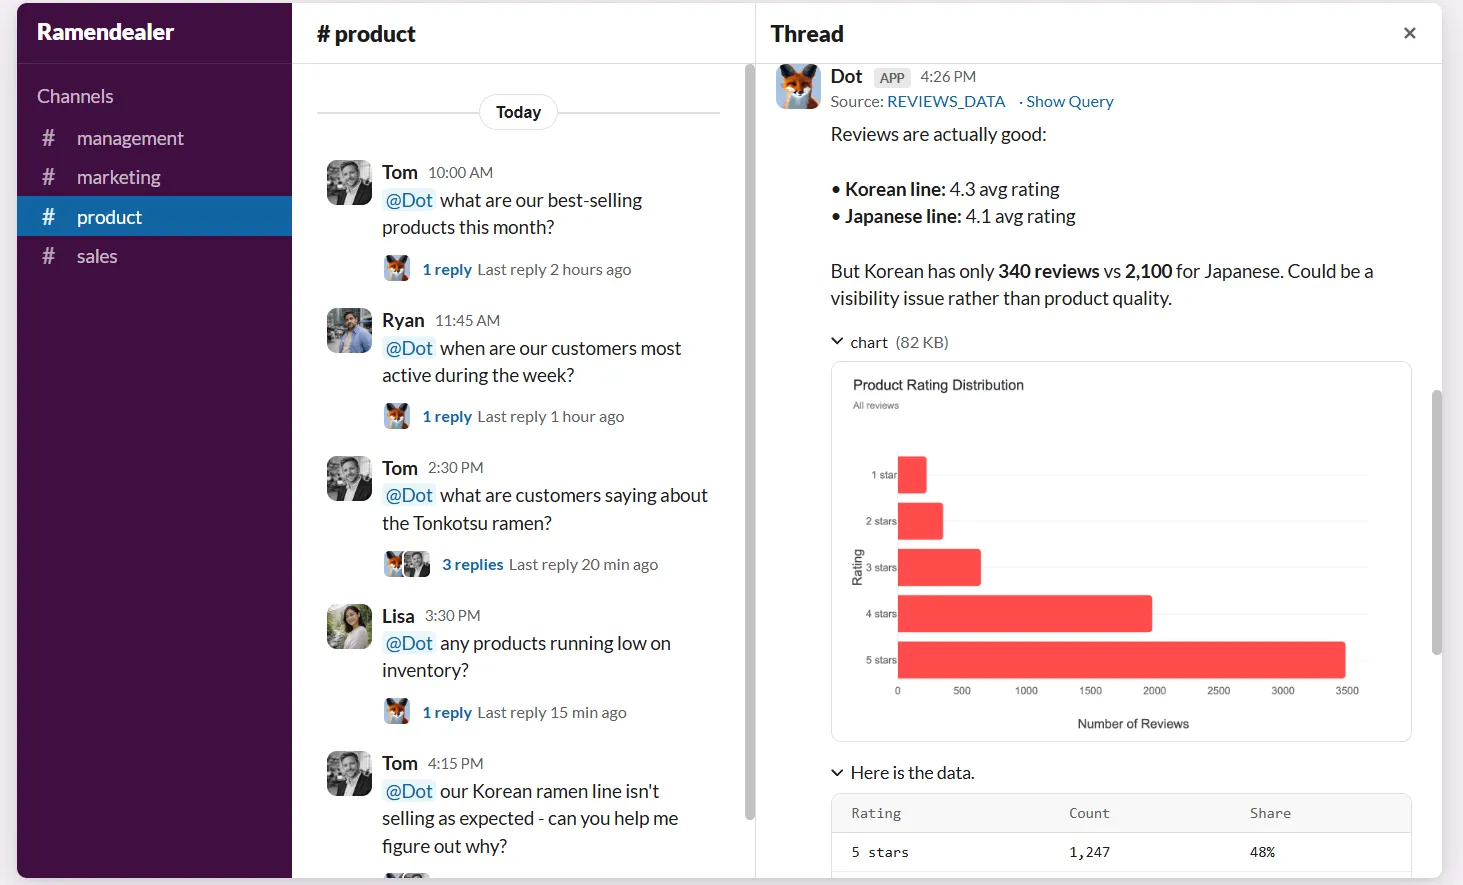
The data, the SQL queries, and the supporting tables all sit underneath the writeup, so anyone can verify the logic. But the headline is the kind of summary you'd otherwise pay an analyst to write at 11 PM the night before a board meeting.
Stakeholders ask their question in Slack or Teams, get a real answer in minutes, and move on. Analysts stop being a help desk for routine asks.
Scheduled business reviews that arrive already written
Recurring reports are where most data teams quietly lose entire days every month.
Pulling the same numbers, refreshing the same dashboards, exporting to slides, writing a few lines of commentary so leadership knows what to actually look at, sending it off, repeat.
Dot turns that whole loop into a scheduled deliverable.
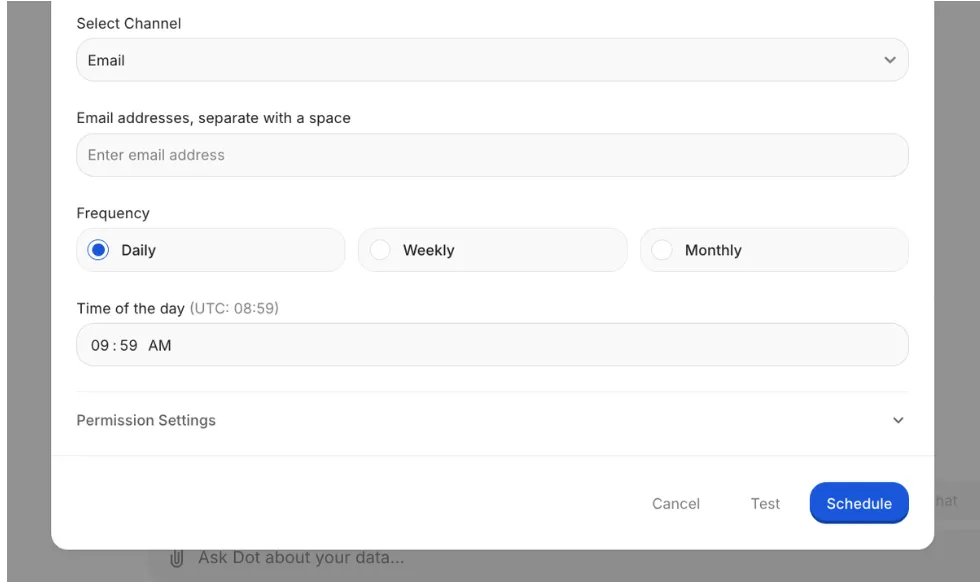
You define the scope once (weekly revenue review, monthly product KPIs, quarterly customer health, whatever fits) and Dot pulls fresh data from the warehouse on whatever cadence you set.
It produces a PowerPoint that includes the charts, but more importantly, it includes the actual narrative.
- What changed since the last period?
- Where is the trend heading?
- Which segments broke from the pattern?
- What should the team pay attention to?
The report lands in your inbox or Slack channel, ready to forward to leadership.
A Context Agent that builds the semantic layer for you
Most AI BI tools depend on a semantic layer you build and maintain inside the platform. Someone configures what tables mean, how metrics are calculated, and how business language maps to columns. Until that's done, the AI is guessing.
Dot takes a different angle.
The Context Agent crawls what you already have: dbt models, your Looker semantic layer, Confluence pages, existing Power BI logic, internal documentation, and stitches it into a unified business context.
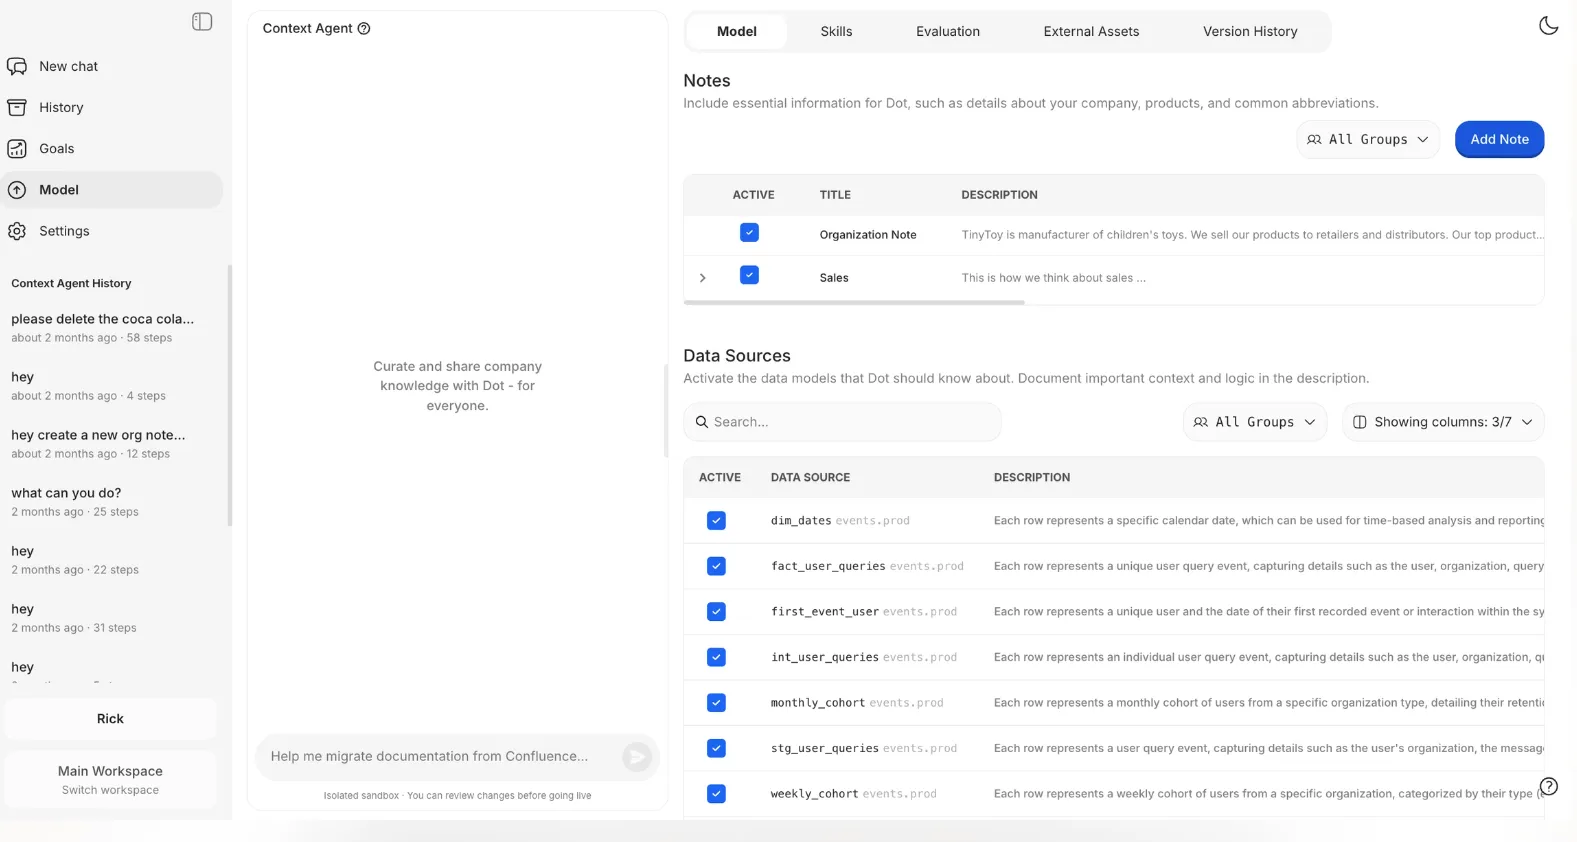
When a definition is missing, it generates one and asks for confirmation. When two sources disagree on what "active customer" means, it surfaces the conflict instead of silently picking one.
The result is a semantic layer that grows with your business and stays consistent across teams, without a six-month modeling project before the AI becomes useful.
Every answer comes with an audit trail
If your CFO asks where a number came from, "the dashboard says so" isn't good enough.
Every response Dot produces includes inline footnotes that link to the exact SQL query that ran, the Python code used for any calculations, and the specific datasets pulled.
You can click through, inspect the logic, and validate it without flagging an analyst.
That kind of transparency matters more in AI analytics than anywhere else, because AI is a black box by default.
Most teams adopting AI BI tools eventually run into the moment where leadership asks, "Are we sure about this number?" and nobody can give a confident answer. Dot handles that question by design.
Dot's integrations
Dot is built to slot into your existing data stack instead of asking you to rebuild it.
On the warehouse side, it connects directly to Snowflake, BigQuery, Redshift, Databricks, Postgres, MySQL, and SQL Server, so the AI runs analysis against the data you already trust.
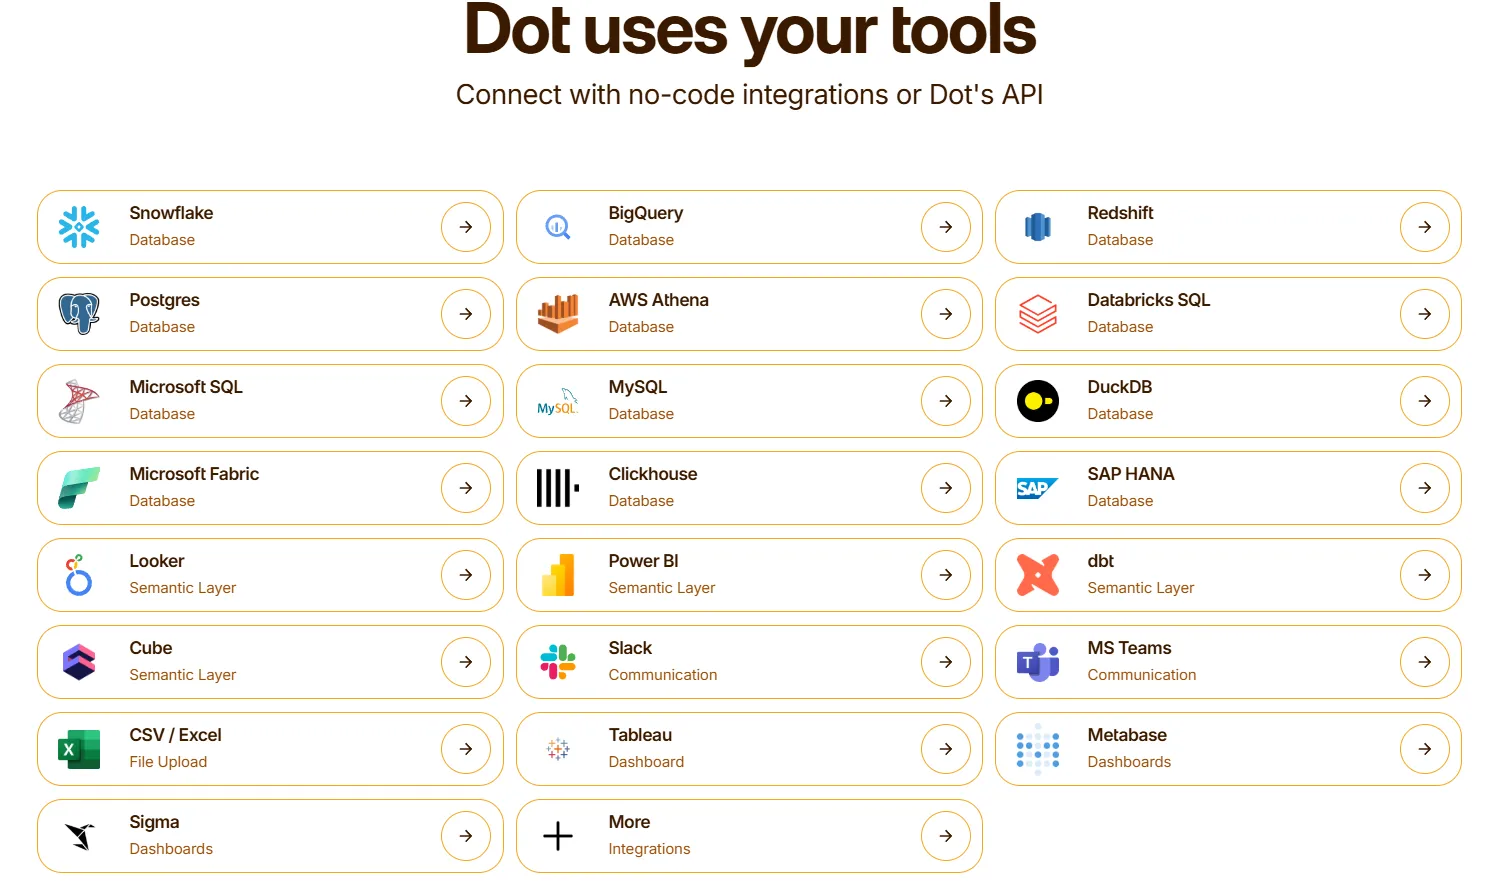
On the modeling side, it reads from dbt, Looker, Power BI semantic models, and Cube. Whatever metric definitions and business rules you've already invested in, Dot picks up and reuses instead of duplicating.
For delivery, insights show up wherever your team already works. Slack, Microsoft Teams, email, or the Dot web app, depending on the channel each stakeholder prefers.
And it works alongside whatever BI you already have.
If your team still wants Tableau for executive dashboards or Metabase for embedded reporting, Dot doesn't ask you to choose. It complements those tools rather than replacing them.
Dot pricing
Dot offers a free plan with 300 one-time credits and full access to Pro features, so teams can try the platform before spending anything.
There are three paid plans:
- Pro: $180/month, 150 credits per month, $1.80 per credit overage, unlimited users.
- Team: $720/month, 800 credits per month, $1.44 per credit overage, SSO, row-level security, embedded analytics, BI migration support, and dedicated support.
- Enterprise: Custom pricing, unlimited credits, volume discounts, self-hosted deployment, audit logs, SLA, and a dedicated account manager.
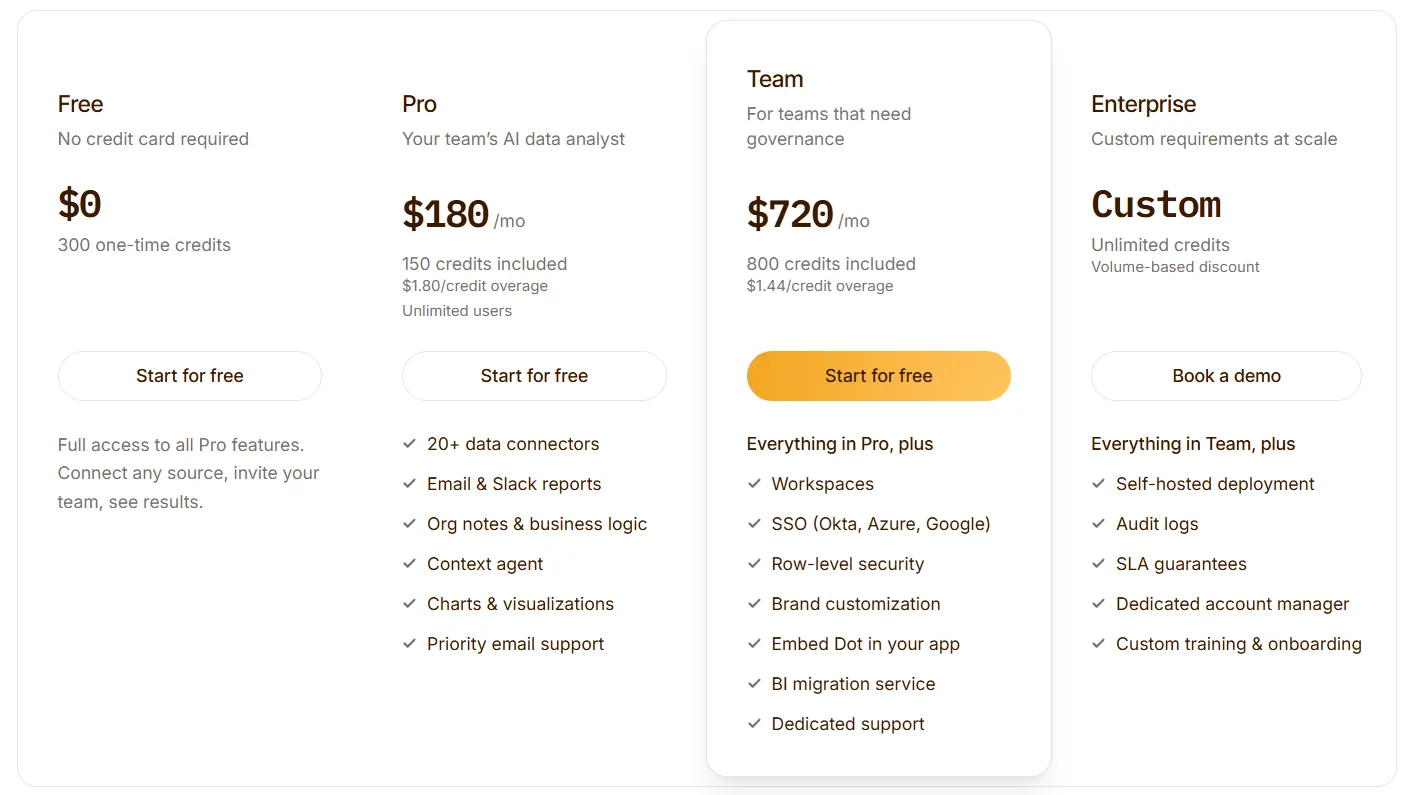
➡️ Annual billing saves 10% across all paid plans.
Dot pros and cons
✅ Returns written analysis with recommendations, not just dashboards or visualizations to interpret.
✅ Ships scheduled business reviews directly to Slack, Teams, or email with the narrative already written.
✅ Context Agent auto-discovers business definitions from existing docs and semantic layers, reducing modeling overhead.
✅ Footnoted audit trail on every insight, traceable down to the exact SQL and dataset.
✅ Unlimited users on every paid plan, so adoption doesn't get throttled by per-seat math.
❌ Requires a connected data warehouse, which means orgs without one need to set that up first before getting full value.
#2: Domo
Best for: Mid-market and enterprise teams looking for one platform that handles ingestion, dashboards, AI, and automation rather than stitching tools together.
Similar to: Power BI, Qlik Sense.
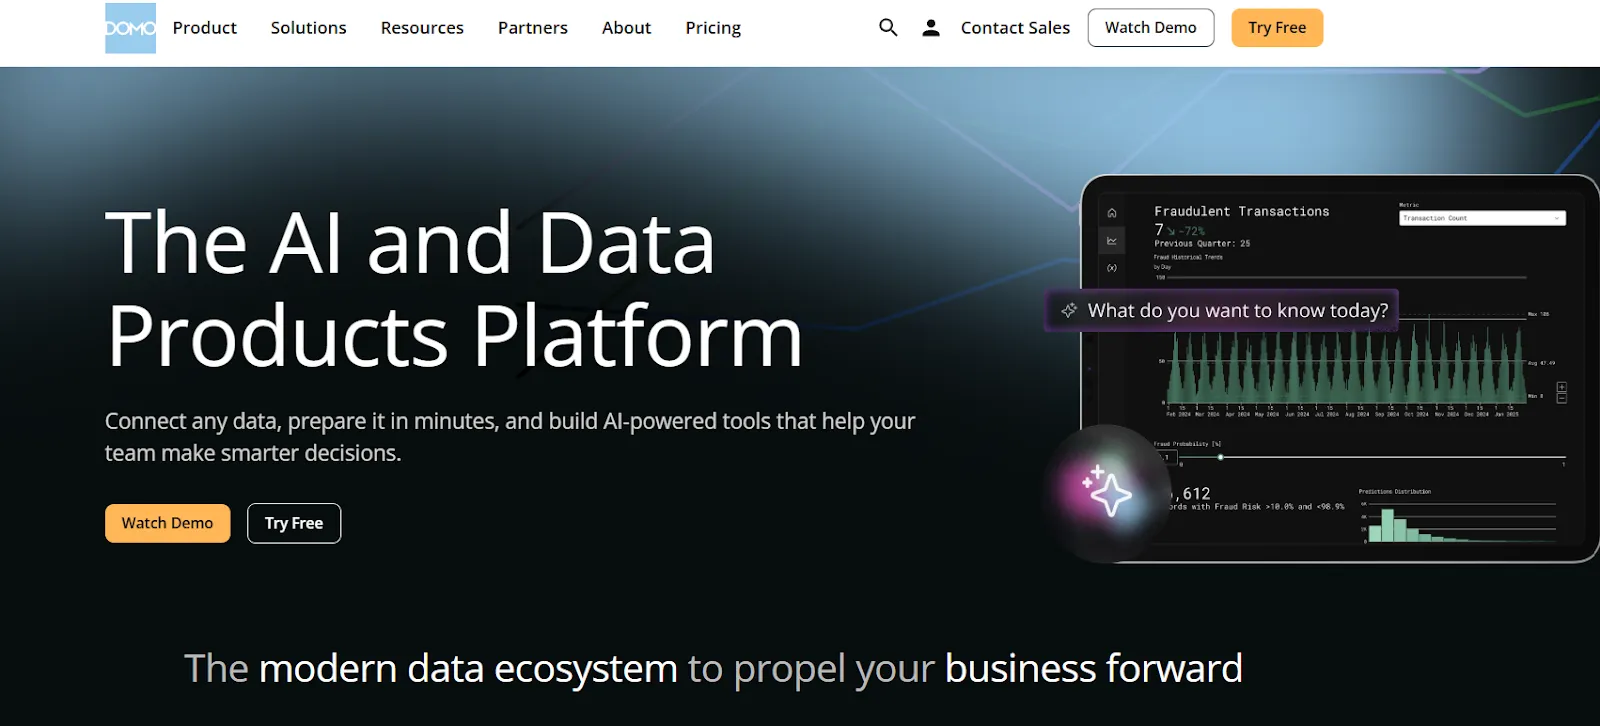
Domo is a cloud-native BI platform that combines ETL, dashboards, embedded analytics, and AI agents in one product.
It targets teams that would otherwise piece together a stack and gives a single environment for everything from raw data ingestion to AI-driven actions, which puts it in a different territory than narrower AI tools likeTextQL orMindsDB.
Domo's Top Features
- Real-time dashboards with native sharing: Build dashboards that update live and share or embed them across teams, customer apps, and external partners.
- Domo AI and agent workflows: Ask questions in natural language, generate visualizations, and trigger downstream actions through AI agents tied to specific business workflows.
- No-code data apps: Build custom internal apps on top of Domo data without writing code, useful for finance, ops, and revenue teams who want self-contained workflows.
- Massive connector library: Over 1,000 prebuilt connectors plus Magic ETL and SQL-based dataflows for prep and transformation directly in the platform.
Domo Pricing
Domo has one paid plan and a free trial:
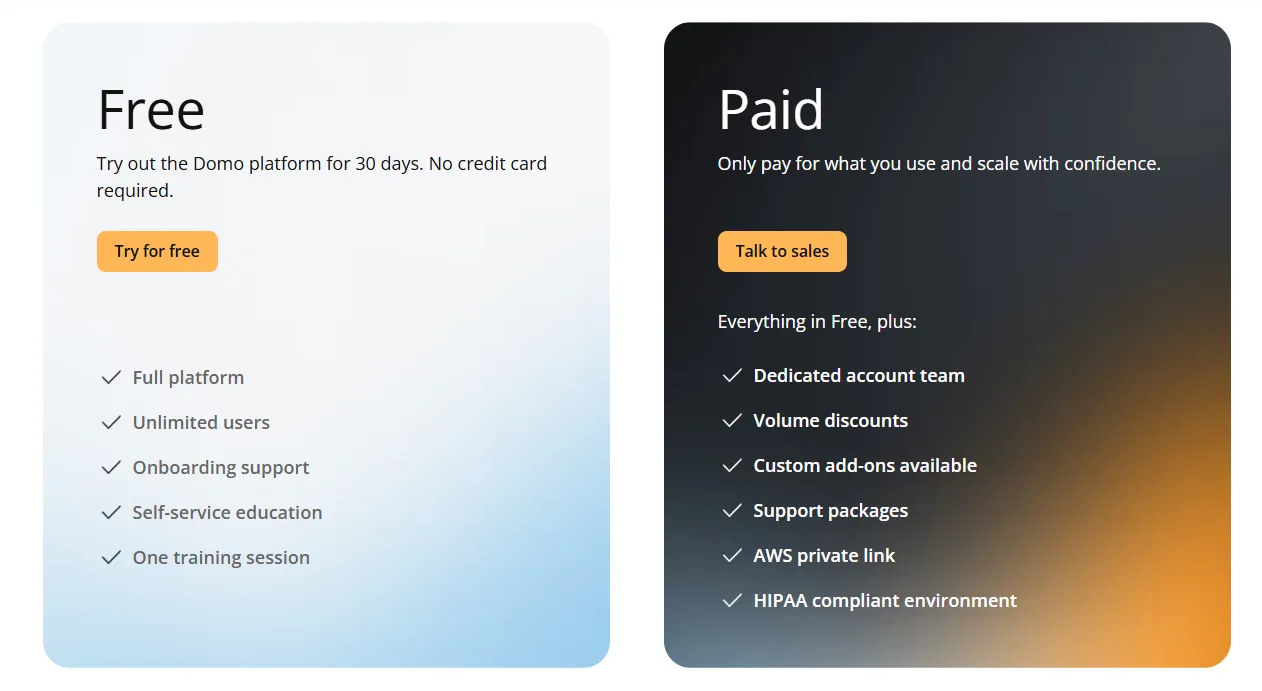
- Free trial: 30 days, no credit card required, includes unlimited users, full platform access, onboarding support, self-service education, and one guided training session.
- Paid plan: Usage-based pricing designed to scale as your analytics needs grow, includes everything in the trial and adds a dedicated account team, volume discounts, custom add-ons, and support packages.
Domo Pros and Cons
✅ Genuinely all-in-one. You don't need a separate ETL tool, BI tool, and embedded analytics tool.
✅ Connector library is genuinely deep, especially for ops and finance teams pulling from many SaaS apps.
❌ Pricing is not disclosed. We covered affordable options in our Domo alternatives breakdown.
#3: Hex
Best for: Data teams that want AI-powered notebooks combined with conversational self-serve and data apps in one workspace.
Similar to: Mode, Deepnote.
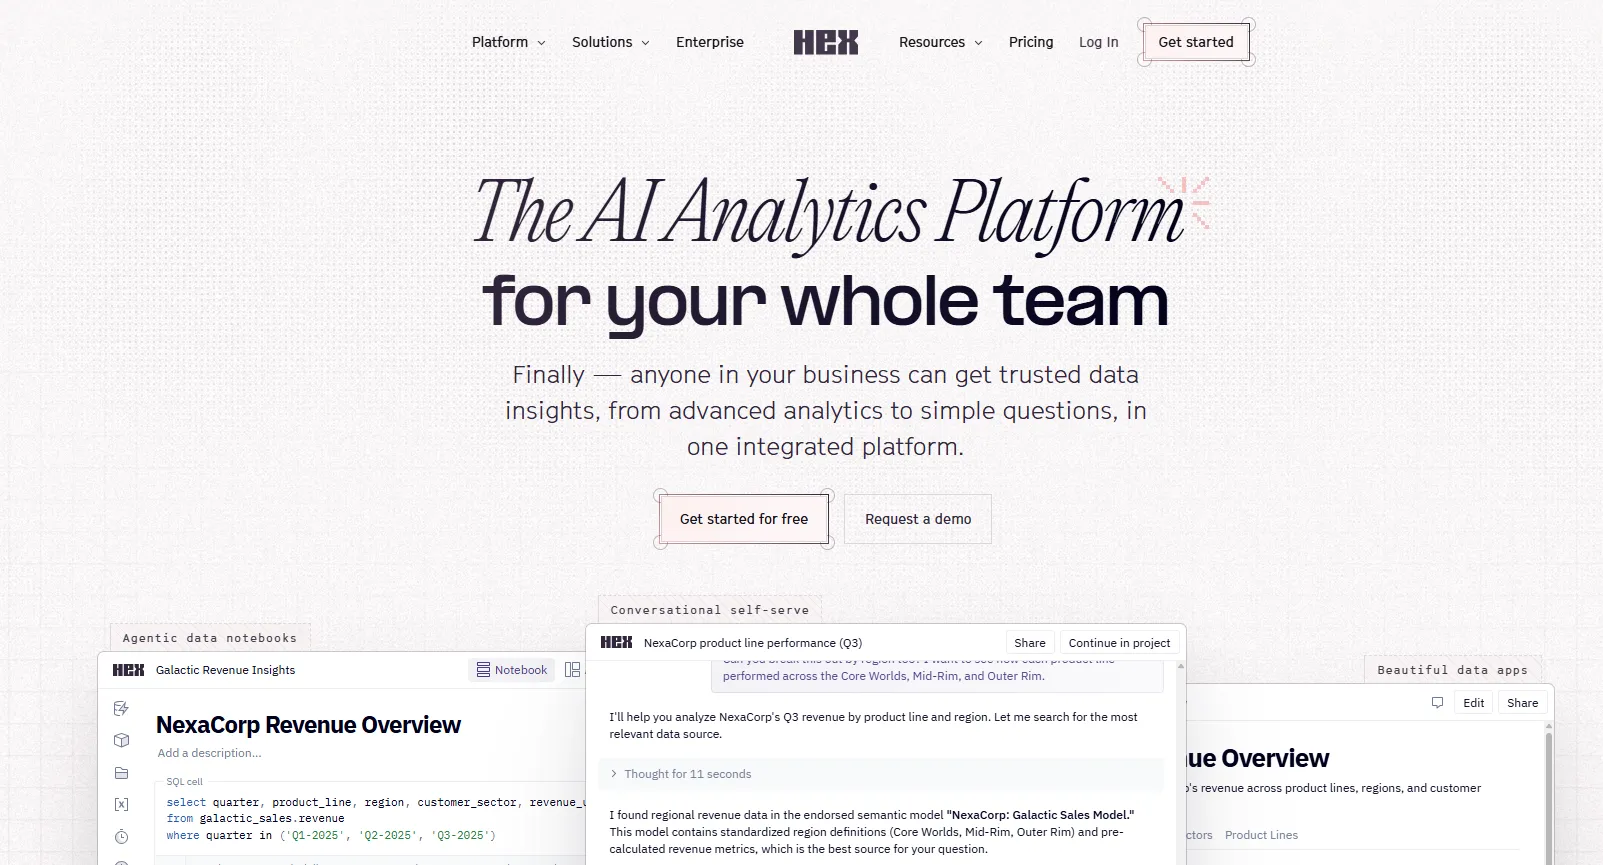
Hex is an AI Analytics Platform that combines agentic notebooks, conversational self-serve, and data apps into a single environment for technical and business users.
The DNA is the notebook, with AI agents layered on top, which makes it land differently than dashboard-first or search-first BI tools.
Hex's Top Features
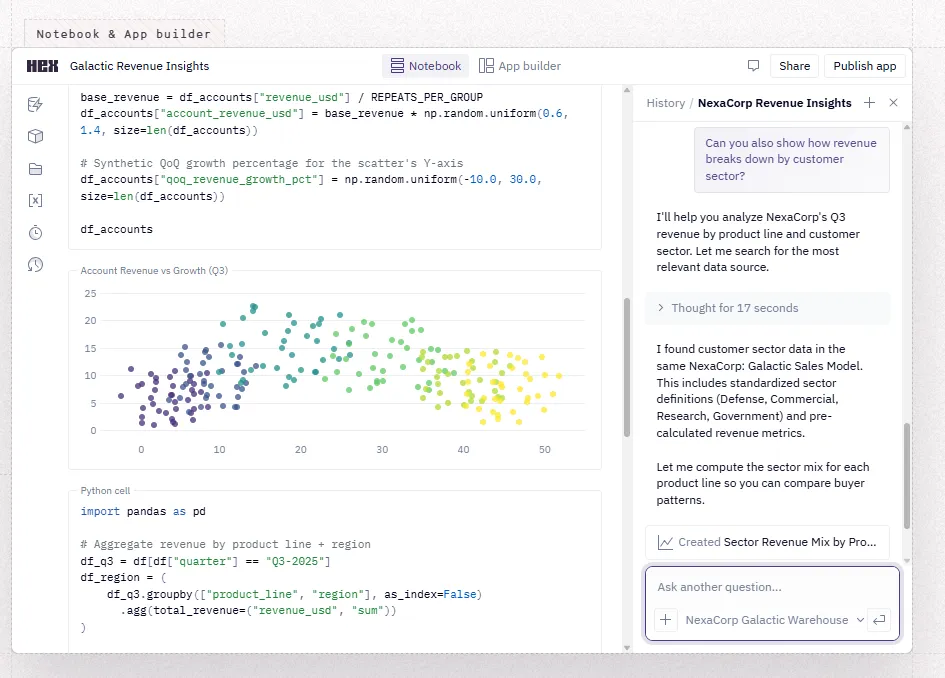
- Notebook Agent: An AI agent that writes SQL and Python, builds analyses end-to-end, and debugs code inside the notebook environment.
- Threads agent (conversational self-serve): Business users can ask questions in plain language and get answers grounded in the same context that powers the analyst notebooks.
- Context Studio: A semantic modeling layer that defines business terms, endorses trusted datasets, and grounds AI responses in governed business context.
- Data apps and embedded analytics: Turn notebooks into interactive apps for internal teams or embed them into customer-facing products.
Hex Pricing
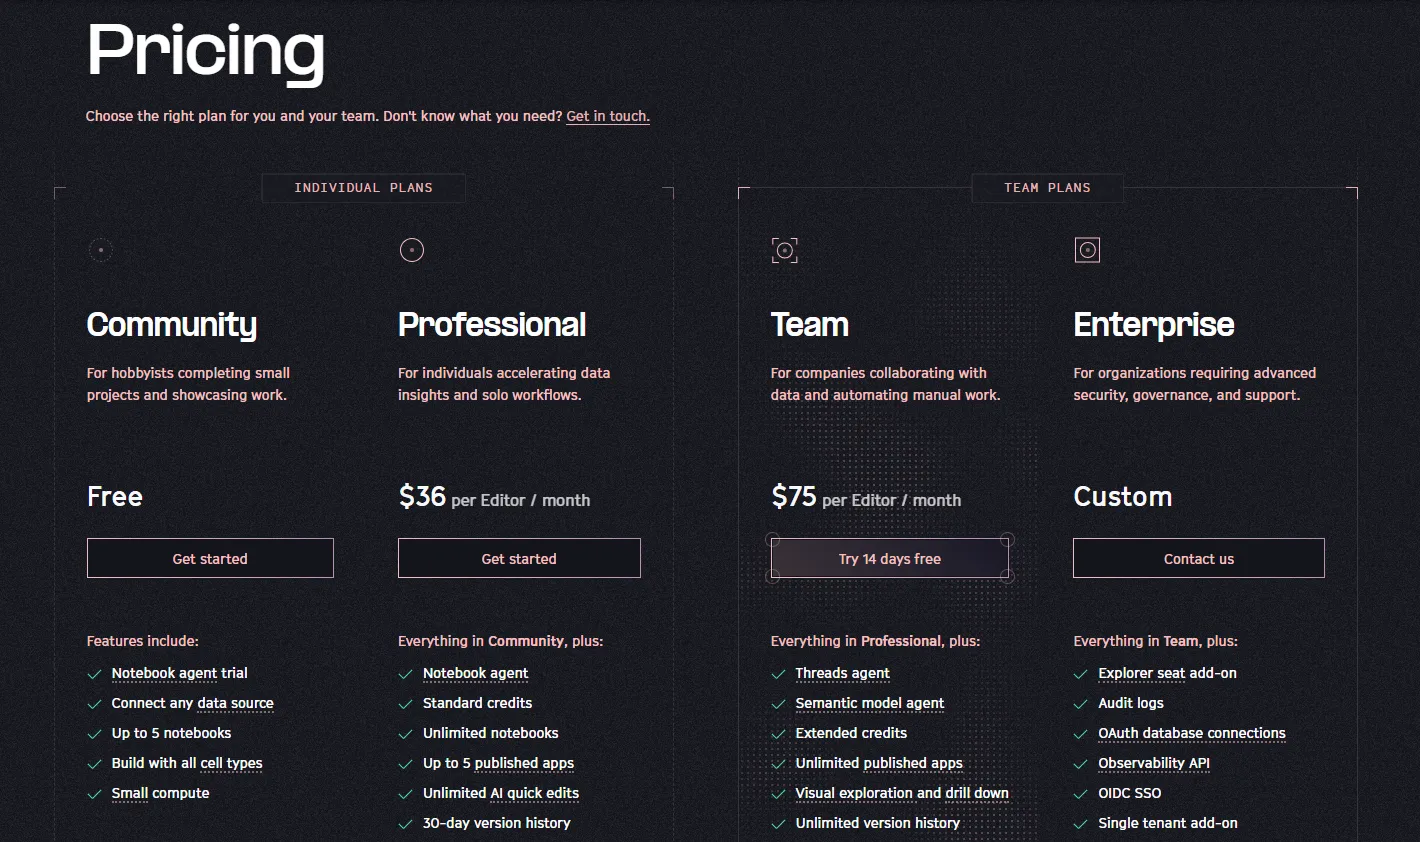
Hex has four pricing tiers:
- Community: Free, for individuals, includes up to 5 notebooks, small compute, and a Notebook Agent trial.
- Professional: $36 per Editor/month, for solo work, includes unlimited notebooks, up to 5 published apps, full Notebook Agent, medium compute, and 30-day version history.
- Team: $75 per Editor/month, adds the Threads agent, Semantic model agent, scheduled runs, alerts, unlimited published apps, and advanced compute add-ons. Comes with a 14-day free trial.
- Enterprise: Custom pricing, adds audit logs, OIDC SSO, dedicated support, embedded analytics add-ons, and single-tenant deployment.
Hex Pros and Cons
✅ AI agents work across both the notebook and conversational surfaces, not just one.
✅ Transparent per-editor pricing.
✅ Bridges technical analysts and business users in one workspace instead of two tools.
✅ Customer base skews tech-forward (Notion, Anthropic, Reddit, Ramp), which usually signals a product that holds up under serious data team usage.
❌ Notebook-first roots can mean teams without any technical users will get less out of it than teams with at least a few SQL or Python practitioners.
What are the best enterprise BI tools as ThoughtSpot alternatives?
Here are the best enterprise BI tools as ThoughtSpot alternatives in 2026:
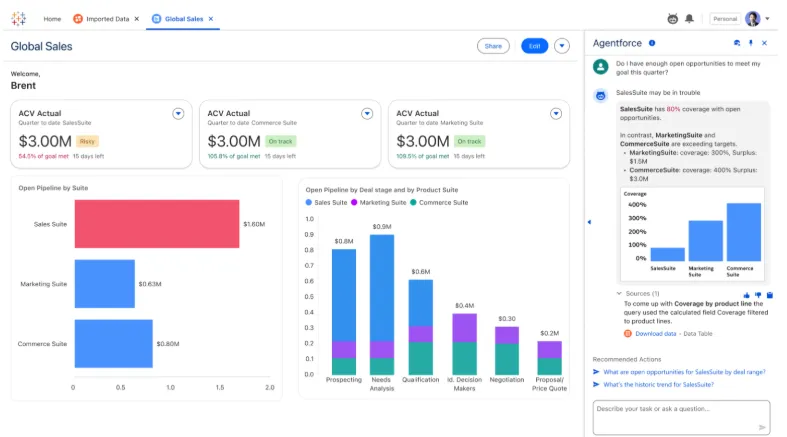
#1: Tableau
Best for: Data teams and enterprises that need deep visual analytics, exploratory dashboard work, and flexible deployment across cloud, self-hosted, and AI-augmented environments.
Similar to: Looker, Qlik Sense.

Tableau has been the reference point for serious data visualization for over a decade and now sits inside the Salesforce ecosystem.
The classic VizQL drag-and-drop experience is still the core of the product, with Tableau Next layering agentic analytics, Tableau Pulse, and Gemini-powered natural-language access on top.
Tableau's Top Features
- VizQL drag-and-drop analytics: Build interactive dashboards with rich visualizations, drill-downs, and exploratory analysis on large, complex datasets.
- Tableau Next and Tableau Agent: Agentic features that surface personalized insights, answer questions in natural language, and trigger actions inside Slack and Salesforce.
- Tableau Pulse: Metric tracking with AI-generated commentary delivered into Slack, email, or the workflow you're already in.
- Governance and deployment flexibility: Centralized governance, reusable metric definitions, and the option to deploy via Tableau Cloud, self-hosted Tableau Server, or the newer Tableau Next environment.
Tableau Pricing
Tableau uses per-user, per-month pricing, with separate plans depending on whether you deploy Tableau in the cloud, on your own servers, or as part of its newer AI-driven offering:
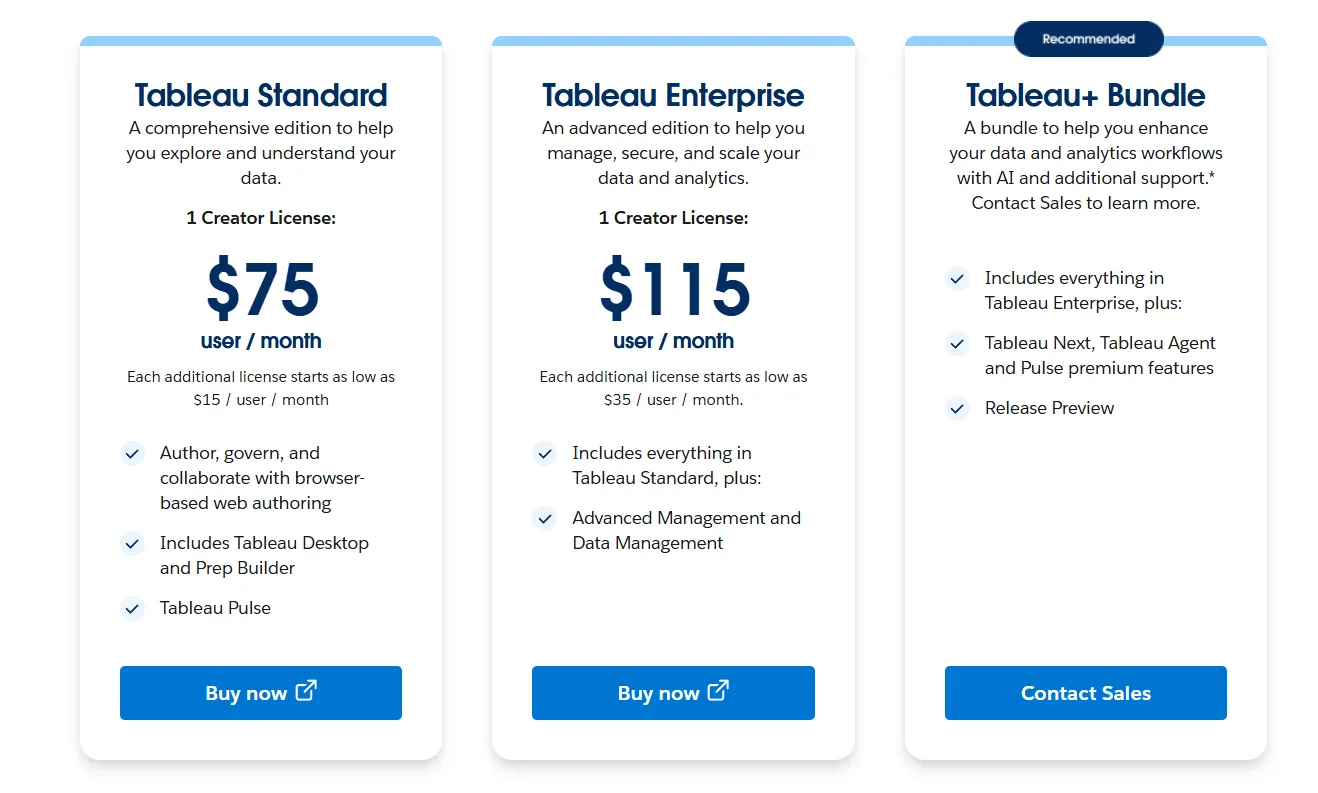
- Tableau Cloud has three pricing plans:
- Tableau Standard: $75 per 1 creator per month, with each additional license from $15 per user/month, includes browser-based authoring and collaboration, Tableau Desktop and Prep Builder, Tableau Pulse for metrics and insights.
- Tableau Enterprise: $115 per 1 creator per month, with each additional license from $35 per user/month, includes everything in Standard, plus Advanced Management and Data Management for governance and scale.
- Tableau+ Bundle (Cloud + AI): Custom pricing, includes everything in Tableau Enterprise, plus Tableau Next, Tableau Agent, and Pulse premium features, with access to release previews and early AI capabilities.
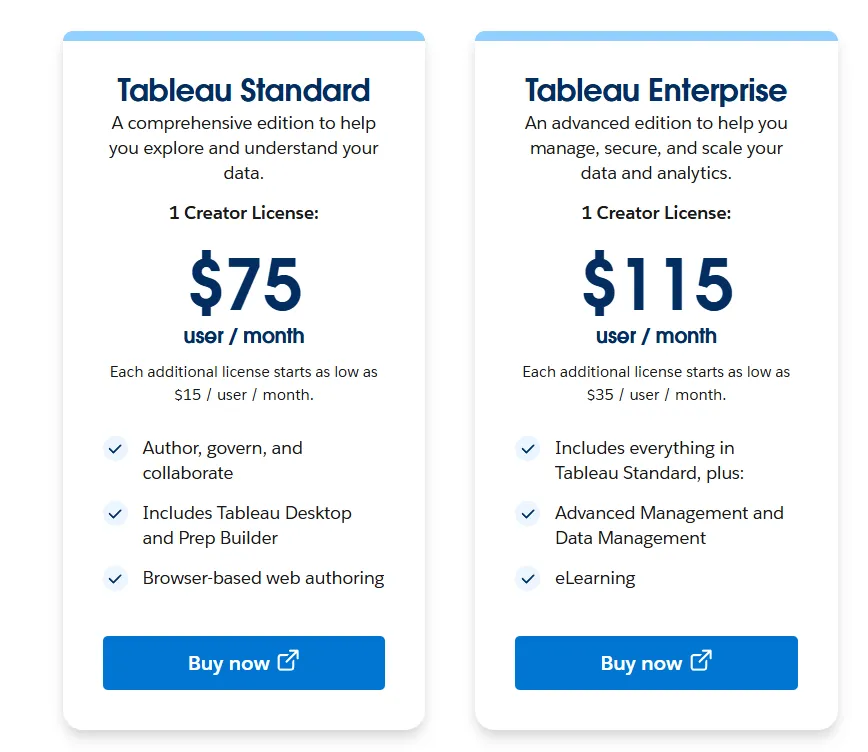
- Tableau Server has two pricing plans:
- Tableau Standard: $75 per 1 creator per month, with each additional license from $15 per user/month, includes authoring, governance, and collaboration and Tableau Desktop and Prep Builder.
- Tableau Enterprise: $115 per 1 creator per month, with each additional license from $35 per user/month, includes everything in Standard, plus Advanced Management, Data Management, and eLearning.
- Tableau Next (agentic analytics): Requires an annual contract, includes agentic analytics via Agentforce, Tableau Semantics, Tableau Pulse (including premium), and Data 360.
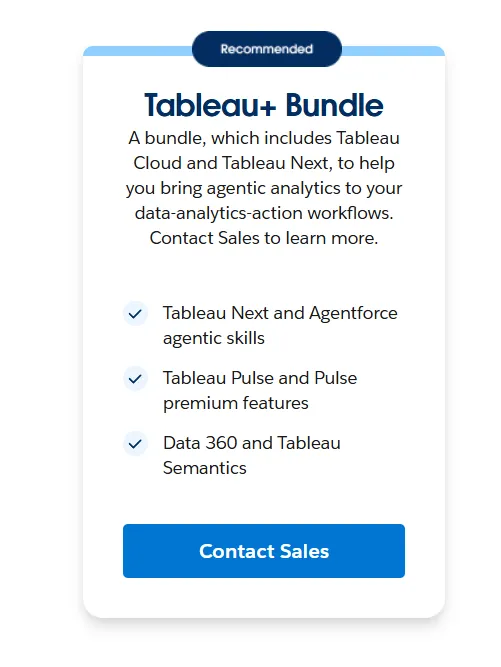
Tableau Pros and Cons
✅ Visualization quality and analytical depth are still benchmark-level in the BI space.
✅ Drag-and-drop authoring lets users iterate fast without heavy SQL or DAX.
✅ One of the largest BI communities, which means abundant learning resources and templates.
❌ Per-user pricing can scale fast for organizations rolling out broadly.
#2: Microsoft Power BI
Best for: Companies already standardized on Microsoft 365 that want widespread reporting access, Copilot AI, and tight ecosystem integration without buying a third-party BI tool.
Similar to: Tableau, Looker.
Power BI is Microsoft's BI platform for interactive reports, dashboards, and self-service analytics, deeply tied into Excel, Teams, SharePoint, and Microsoft Fabric.
It sits at the more affordable end of enterprise BI when you're already paying for Microsoft licensing, which is part of why so many teams default to it before evaluating anything else.
Power BI's Top Features
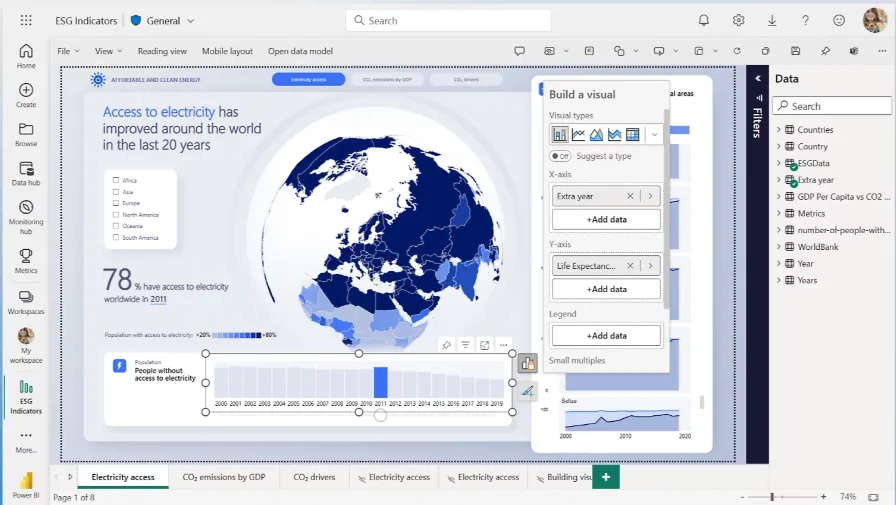
- Interactive reports and dashboards: Combine multiple visuals, slicers, and drill-downs to explore data across teams without separate tools.
- Copilot for Power BI: Generate report pages, summarize insights, and explain visuals in natural language inside the report editor.
- Enterprise governance: Row-level security, sensitivity labels, Microsoft Entra ID integration, and centralized admin controls for managing access at scale.
- Integration with Microsoft Fabric: Native ties into the wider Fabric platform for data engineering, lakehouses, and real-time analytics.
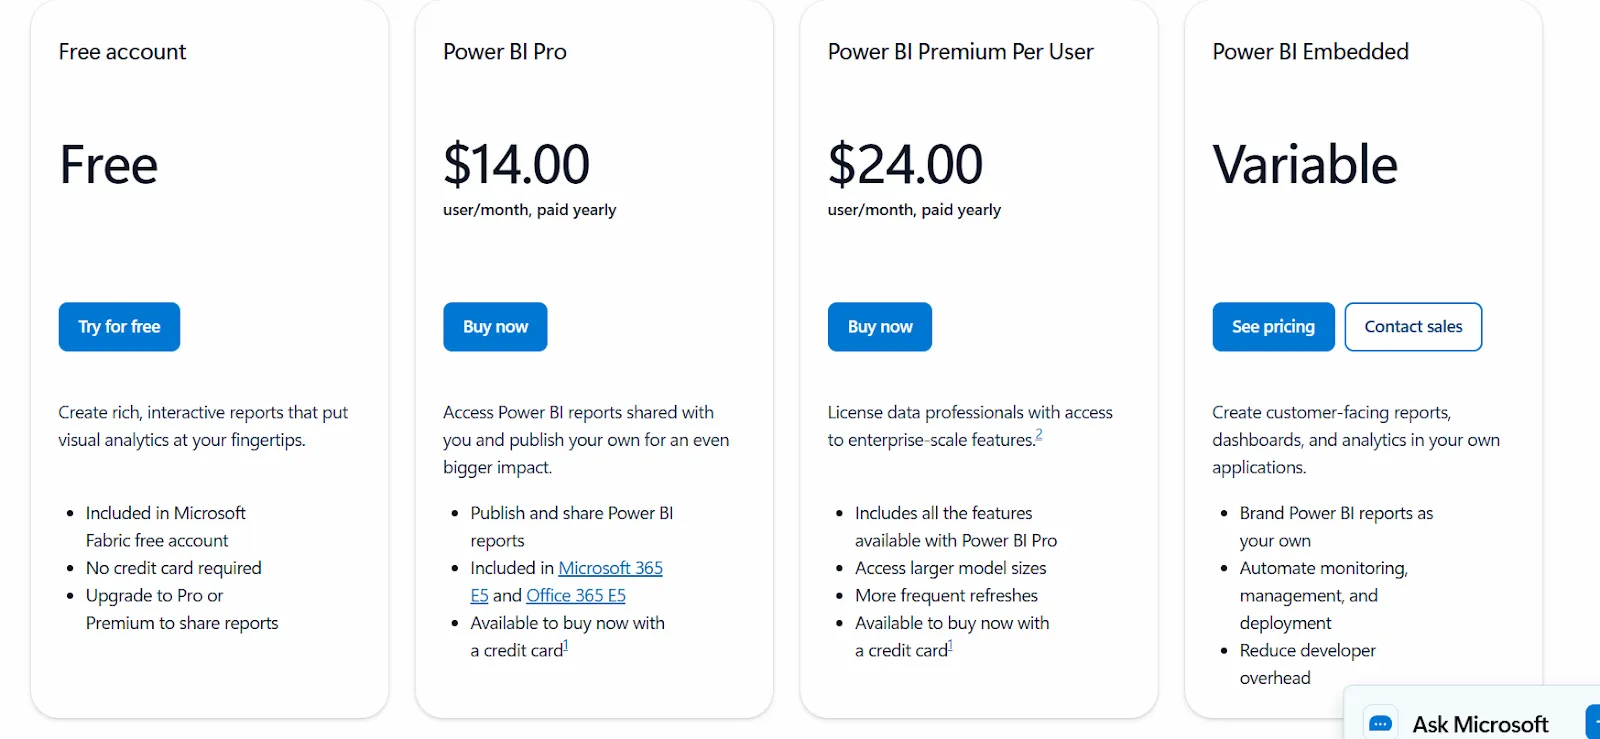
Power BI Pricing
Power BI uses a per-user and capacity-based model:
- Free: Build personal reports and dashboards, but no sharing or collaboration.
- Power BI Pro: $14/user/month, includes report publishing, workspace sharing, scheduled refresh, and Teams or SharePoint embedding.
- Power BI Premium Per User: $24/user/month, adds larger model sizes, more refreshes per day, paginated reports, and AI features.
- Microsoft Fabric capacity: Starts at $262.80/month for F2, with F64 ($5,068.80/month) commonly used to give viewers free read access at enterprise scale.
- Power BI Embedded: Custom pricing for customer-facing analytics inside your own apps.
Power BI Pros and Cons
✅ Capable dashboarding and visualization, especially for teams that already know Excel.
✅ Tight integration with the Microsoft 365 stack.
✅ One of the most affordable entry points among enterprise BI tools.
❌ For beginners, the learning curve can feel steep, particularly when you start working with data modeling and DAX formulas, according to a G2 review.
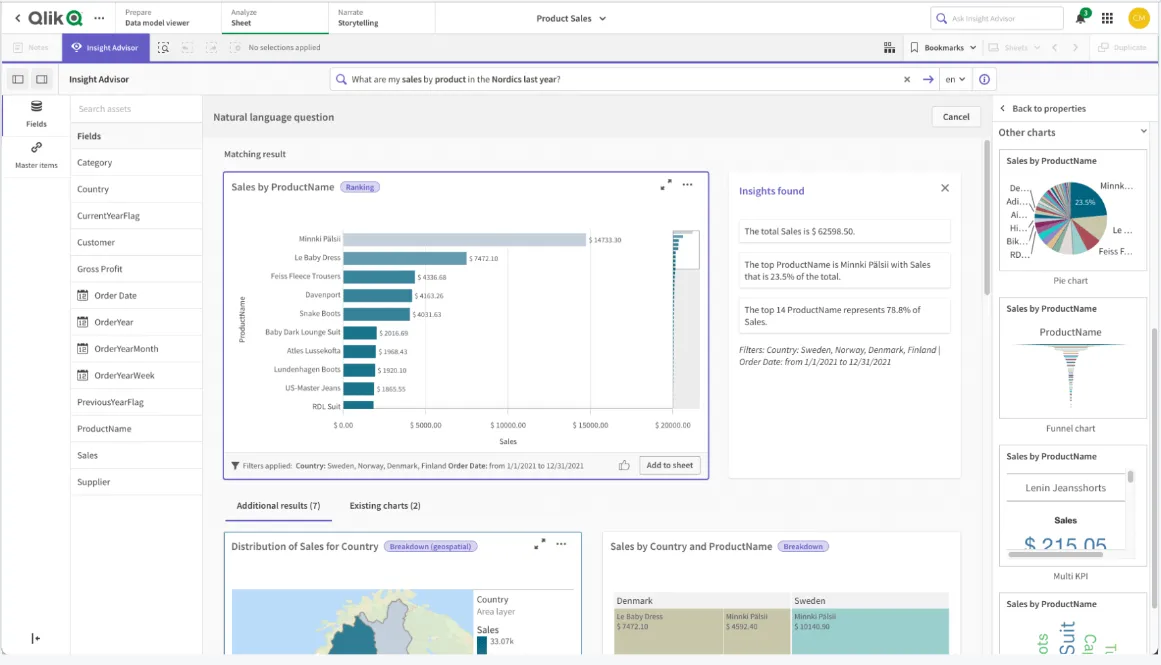
#3: Qlik Sense
Best for: Teams running unrestricted exploration across complex datasets, especially in regulated industries that require on-prem deployments and granular governance.
Similar to: Tableau, Power BI.
Qlik Sense uses a proprietary associative analytics engine that lets you select values across charts and tables without being locked into predefined queries or drill paths.
That makes it a strong pick for teams that hit walls with traditional BI tools when their analysis needs to go off-script.
Qlik Sense's Top Features
- Associative analytics engine: Click on any value in any chart, and the entire view recalculates in context, including data that's not directly related to your selection.
- Augmented analytics with Qlik AutoML: Built-in AI for natural-language queries, automated insight generation, and predictive analytics without a separate data science workflow.
- Real-time alerts and automation: Monitor data continuously and trigger automated workflows when thresholds get crossed.
- Flexible deployment: Cloud SaaS, client-managed, or on-prem options, which matters for organizations with strict data residency rules.
Qlik Sense Pricing
Qlik Sense doesn't publish public pricing. You contact their sales team for a custom quote, and contracts vary by user count, data volume, and deployment model.

Qlik Sense Pros and Cons
✅ Associative engine handles exploratory analysis better than most tools when relationships across data are messy or non-obvious.
✅ Scales well for enterprise data volumes and complex governance needs.
❌ One user on G2 mentions that sometimes there are loading issues, especially when business intelligence is running updates.
#4: Omni
Best for: Teams that want a flexible, modern semantic layer without the rigidity or the modeling overhead of older BI platforms.
Similar to: Looker, Lightdash.
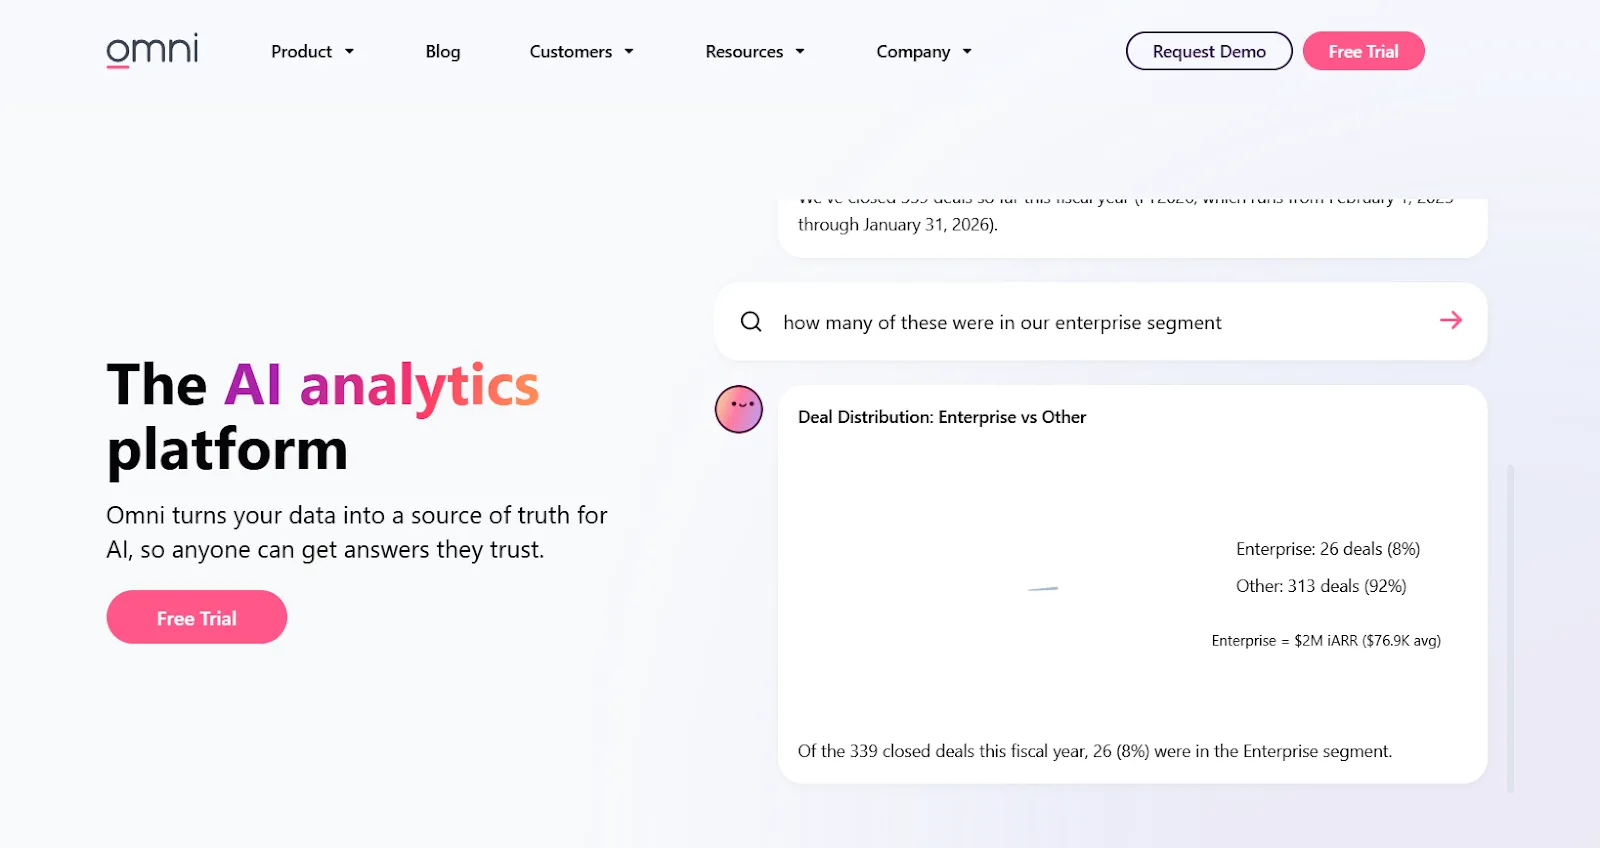
Omni has a clear thesis: keep the metrics-first semantic layer, drop the LookML rigor, and let business users explore freely without breaking governance.
The platform connects to cloud warehouses and aims at the sweet spot between governed and exploratory.
Omni's top features
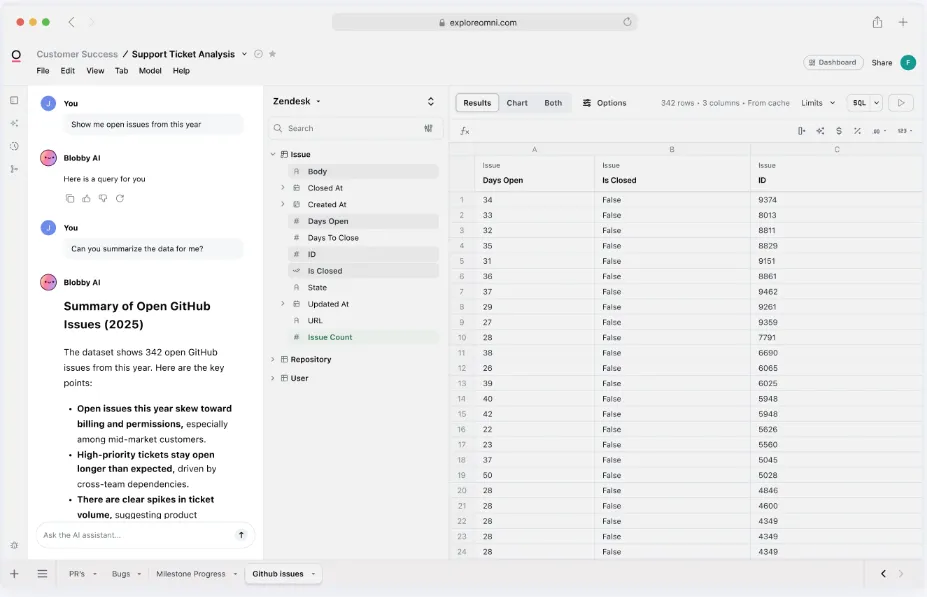
- Metrics-first modeling: Define metrics centrally with reusable, governed calculations that don't require LookML-level rigor to maintain.
- Spreadsheet-style exploration: Analyze live warehouse data through a familiar spreadsheet view while still pulling from governed metrics.
- AI-assisted dashboards: Use AI directly inside dashboards to generate queries, explain trends, and recommend follow-ups.
Omni pricing
Omni doesn't publish pricing on its website.
You can request a free trial and ask their team for a quote.
Omni pros and cons
✅ Drag-and-drop interface keeps non-technical users productive.
✅ Strong dbt integration and direct warehouse querying.
What are the best warehouse-native and open-source ThoughtSpot alternatives?
Here are the best warehouse-native and open-source ThoughtSpot alternatives in 2026:
#1: Looker
Best for: Data teams that want a governed, warehouse-native BI tool with a strong semantic layer and centrally defined metrics across the company.
Similar to: Omni, Holistics.
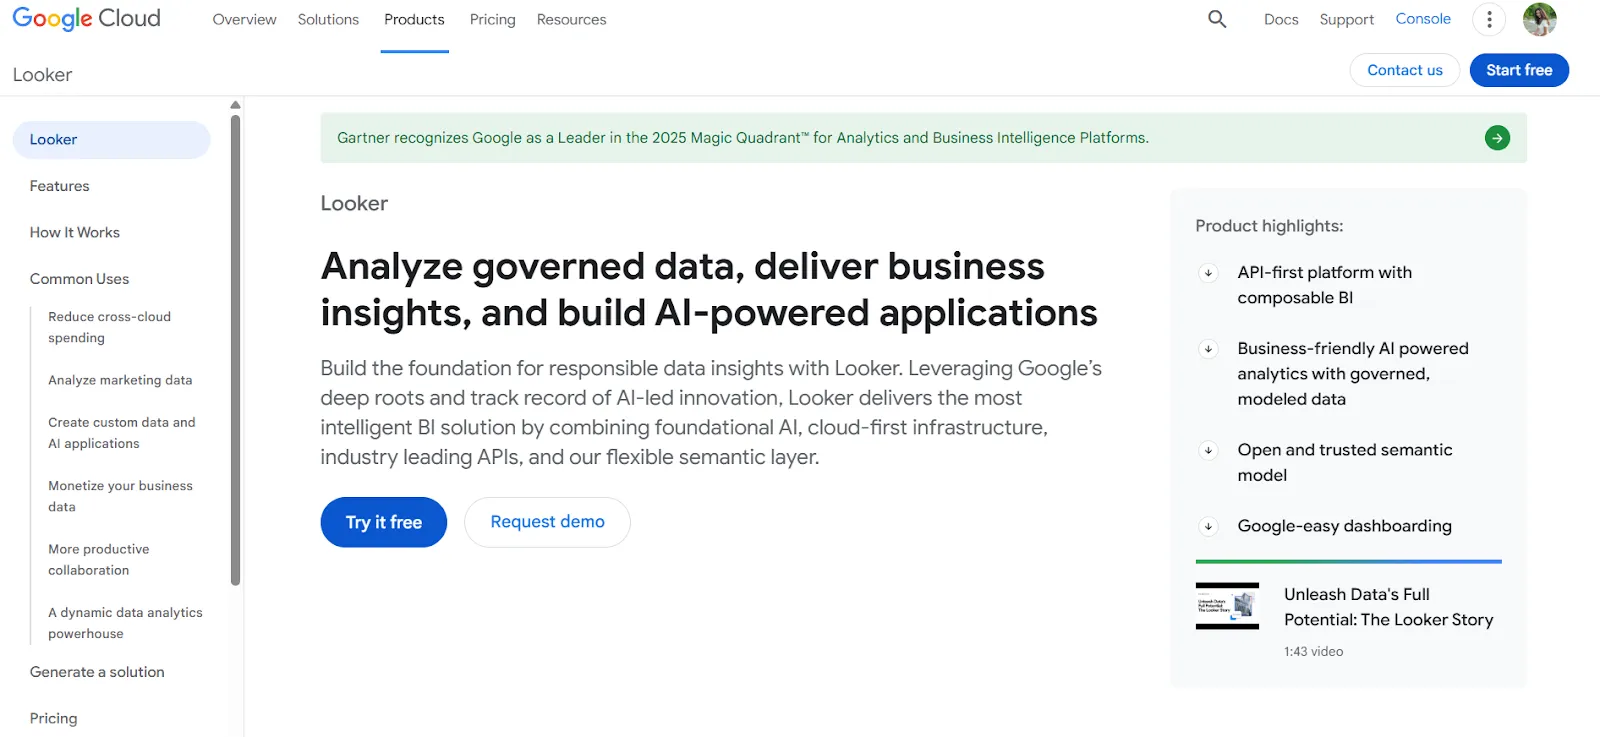
Looker is built around LookML, a modeling language that defines metrics and business rules once and reuses them across every dashboard, report, and embedded view.
Inside Google Cloud, Looker also includes Gemini-powered conversational analytics for natural-language access to those modeled metrics.
Looker's Top Features
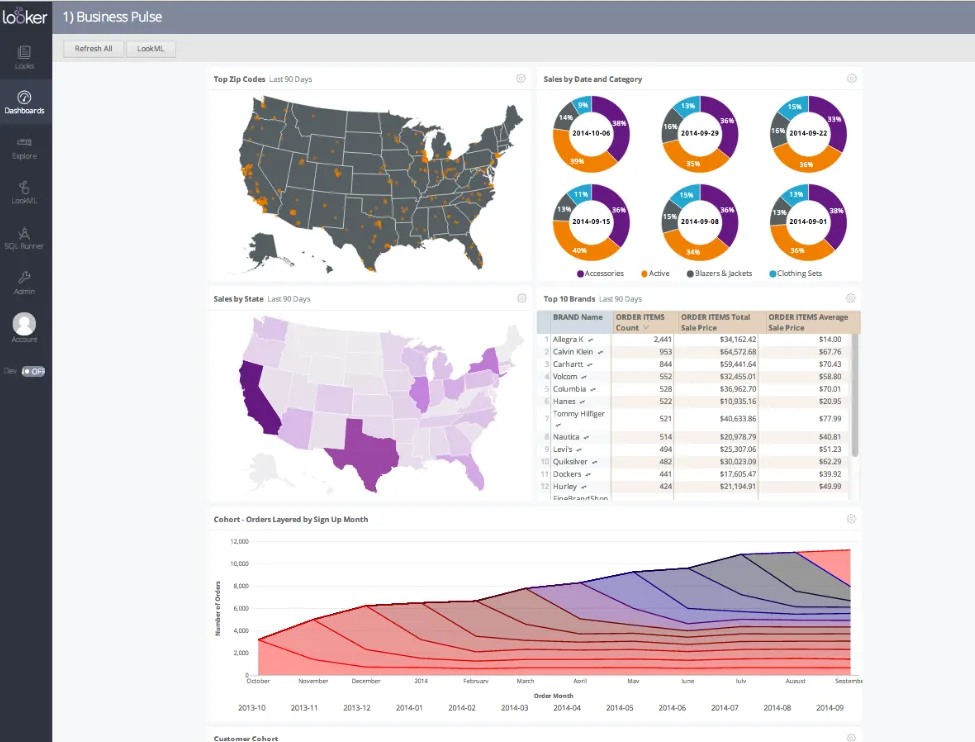
- LookML semantic modeling: Define metrics and dimensions in a centralized layer so every dashboard, report, and Explore pulls from the same definitions.
- Conversational analytics with Gemini: Ask questions in plain English on top of your governed model and get answers grounded in the same metric definitions.
- Real-time, warehouse-native dashboards: Dashboards query your warehouse live, so users always see fresh data without managing extracts.
- Embedded analytics: Built for embedding customer-facing or partner-facing analytics inside external applications, with governance controls intact.
Looker Pricing
Looker uses a custom, contract-based pricing model made up of two parts: platform pricing (the cost of running a Looker instance) and user licensing (the cost per user type).
Pricing is annual for all plans.
- Platform editions:
- Standard: Designed for small teams or organizations with fewer than 50 users, includes 1 production instance, 10 standard users + 2 developer users, up to 1,000 query-based API calls/month, and up to 1,000 admin API calls/month.
- Enterprise: Built for larger internal BI and analytics use cases, includes everything in Standard, plus enhanced security features, up to 100,000 query-based API calls/month, and up to 10,000 admin API calls/month.
- Embed: Designed for embedding analytics into external products or applications, includes everything in Standard, plus up to 500,000 query-based API calls/month and up to 100,000 admin API calls/month.
- User licensing:
- Developer users: Full access to Looker, including LookML development, administration, APIs, and advanced tooling.
- Standard users: Can explore data, build dashboards and reports, run SQL, and schedule content.
- Viewer users: Read-only access to dashboards and reports, with filtering and drill-down.
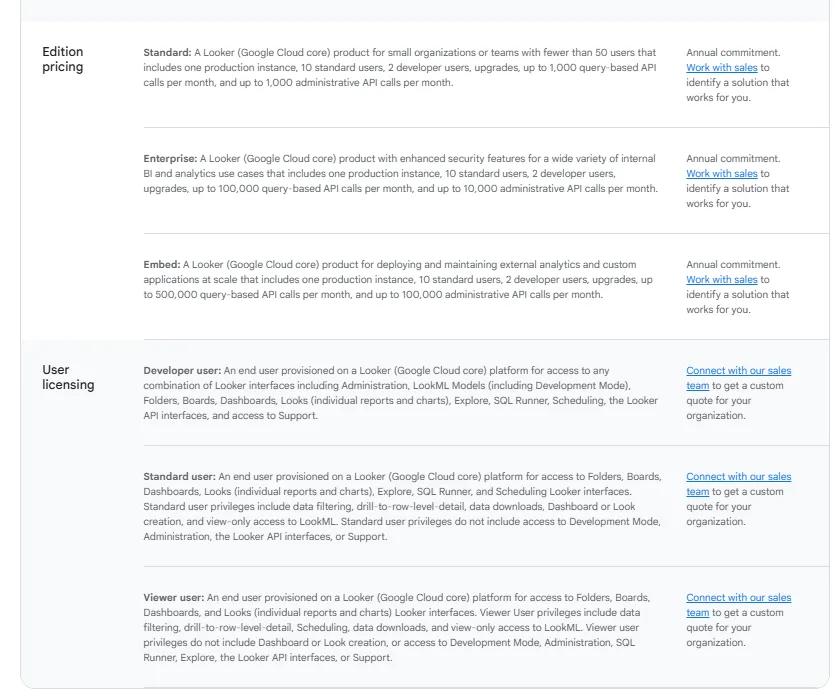
Pricing is custom on all plans and varies based on scale, permissions, and usage.
Looker Pros and Cons
✅ The LookML semantic layer is one of the most reliable ways to keep metric definitions consistent across an org.
✅ Good fit for teams already on Google Cloud and BigQuery.
❌ There's a bit of a learning curve at first, which can require a bit more education upfront to maximize all of its capabilities, according to a G2 review.
#2: Sigma
Best for: Finance, ops, and revenue teams who'd rather analyze warehouse data through a spreadsheet interface than learn a new BI tool.
Similar to: Omni, Metabase.
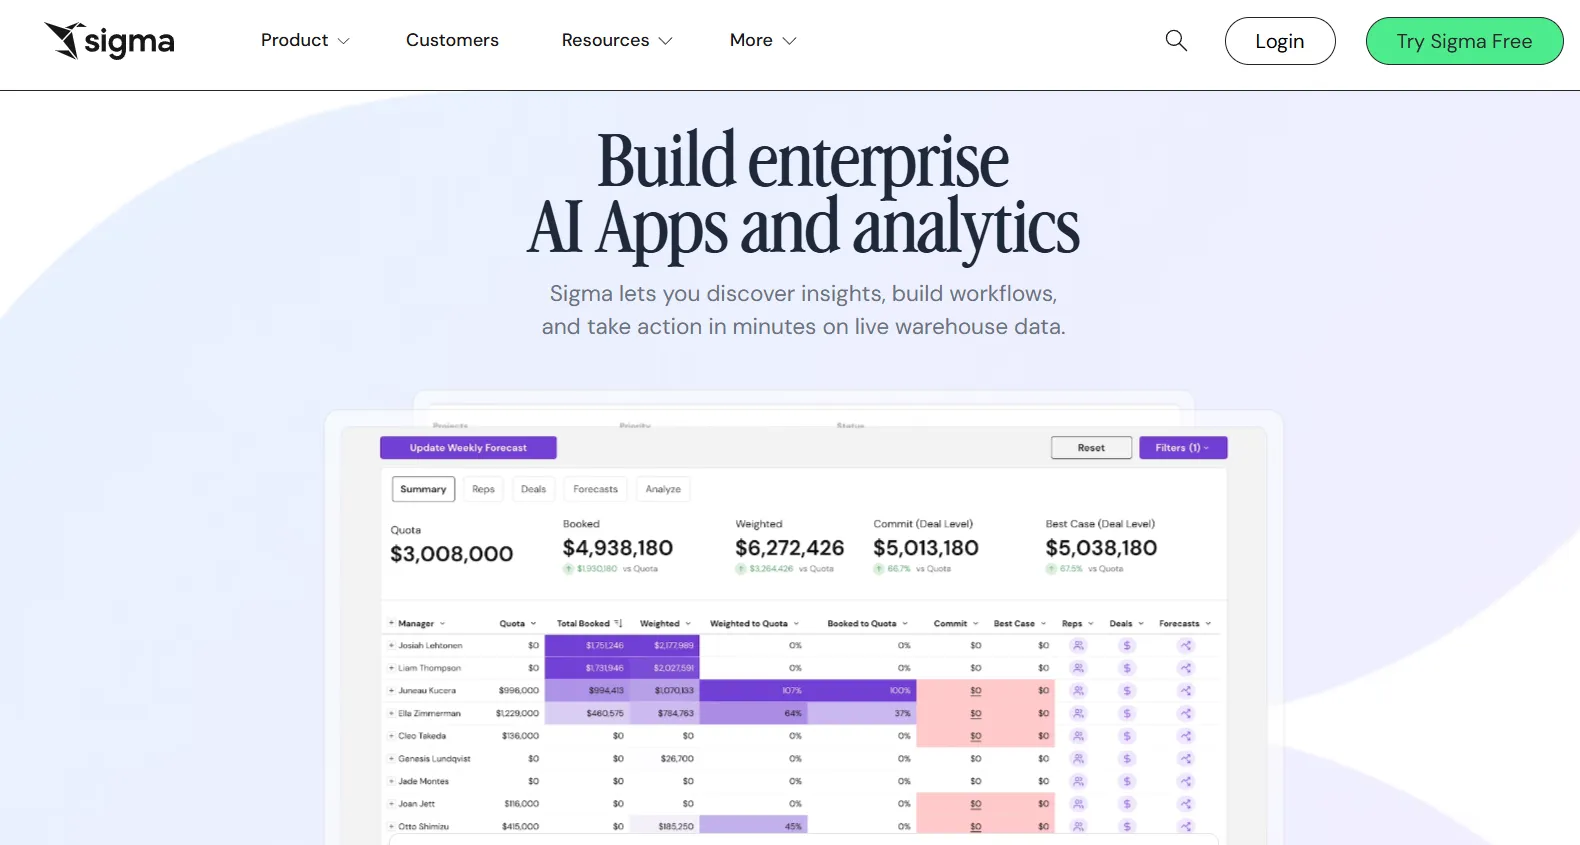
Sigma sits on top of Snowflake, BigQuery, and Databricks and gives users a familiar Excel-like interface for analyzing warehouse data without duplication or extracts.
It's a natural fit for teams who have outgrown lighter tools likeBasedash and want proper warehouse-native workflows without the overhead of an enterprise BI platform.
Sigma's Top Features
- Spreadsheet-style workbooks: Analyze billions of rows directly in your warehouse using formulas, pivots, and tables that mirror Excel.
- Ask Sigma and AI-powered apps: Generate dashboards and analyses through natural language, and build AI-driven data apps tied to real workflows.
- Live warehouse queries: All analysis runs against live warehouse data, so what you see is always what's actually in the source system.
- Collaborative workbooks: Comment, version, and iterate on dashboards together inside shared workbooks instead of trading screenshots.
Sigma Pricing
Sigma doesn't publish public pricing. You contact their sales team directly for a custom quote based on user count, warehouse usage, and feature scope.
Sigma Pros and Cons
✅ The spreadsheet interface lowers the barrier for finance and ops teams who don't want to learn SQL or BI tooling, unlike tools likeDomo that can feel more complex to get started with.
✅ Live warehouse queries mean no extract management or stale dashboards.
✅ Ask Sigma and AI features speed up routine analysis once the data is connected.
#3: Metabase
Best for: Startups, product teams, and lean data teams that need fast self-serve analytics and embedded dashboards without enterprise BI weight.
Similar to: Apache Superset, Lightdash.
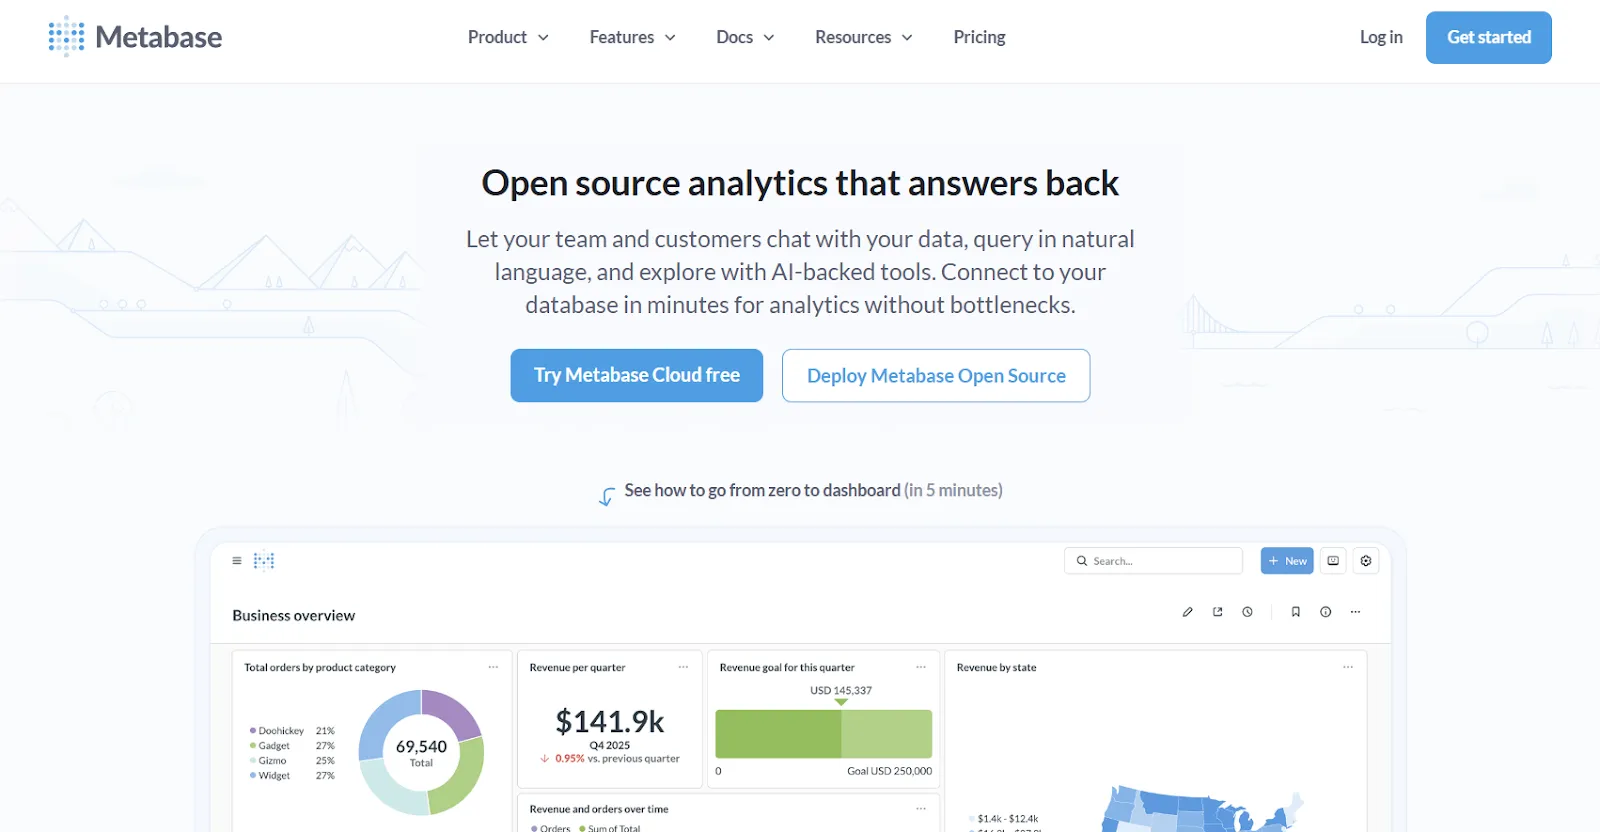
Metabase is an open-source BI tool that lets teams explore data, build dashboards, and ask questions in plain English without heavy setup.
It's especially common in SaaS companies that want production-grade embedded analytics quickly, and a sensible step up for teams evaluating simpler AI tools likeVanna AI orJulius AI.
Metabase's Top Features
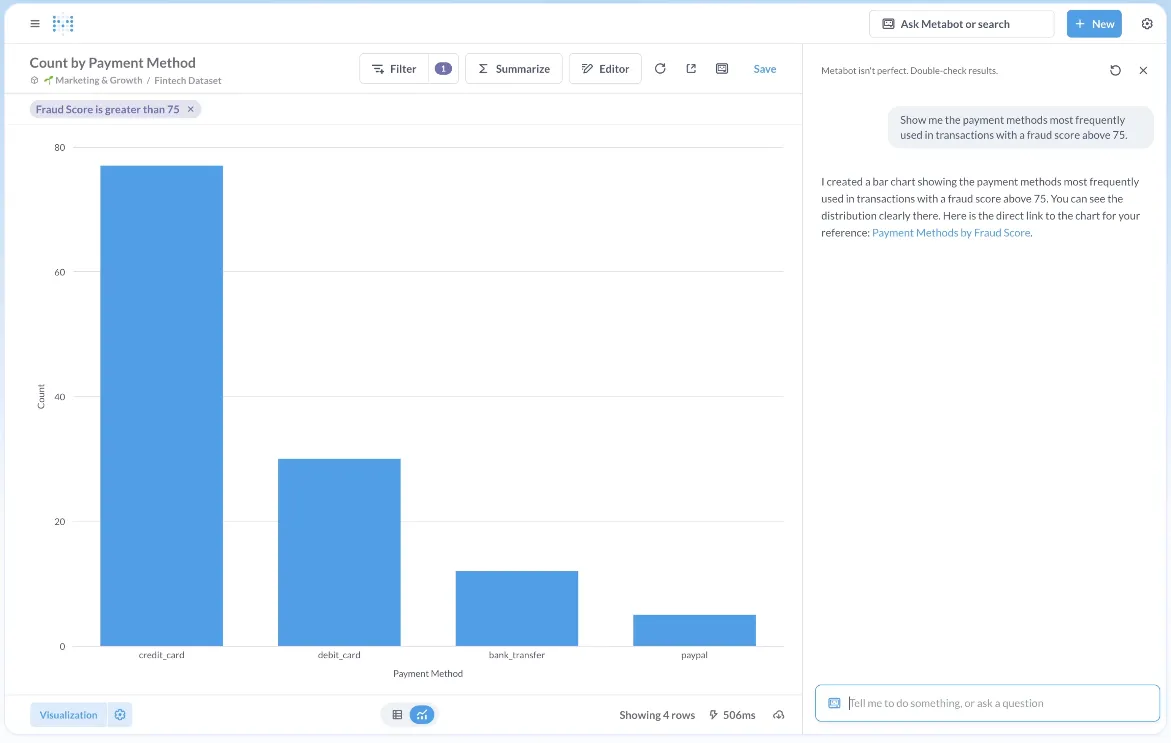
- Metabot AI: Ask questions in natural language and get back queries, charts, and follow-up suggestions on top of live database data.
- Visual query builder: Non-technical users can build queries step-by-step, while analysts can drop into raw SQL when they need precision.
- Drill-through exploration: Click into charts to filter, break out, or auto-generate follow-up reports without rebuilding from scratch.
- Embedded analytics: Built for embedding dashboards in customer-facing apps, especially in SaaS use cases.
Metabase Pricing
Metabase offers two pricing options depending on how you use the product: internal business intelligence or customer-facing embedded analytics.
- Business Intelligence:
- Open Source (Self-hosted): Free, self-hosted deployment, includes unlimited queries, charts, and dashboards, connects to all supported data sources, basic embedding with “Powered by Metabase” branding, community support only.
- Starter (Cloud-hosted): $100/month + $6/user/month, first 5 users included, includes everything in Open Source, plus option to include Metabot AI (charged extra), automatic upgrades, backups, and monitoring, support via Slack, Teams, and email (3-day SLA).
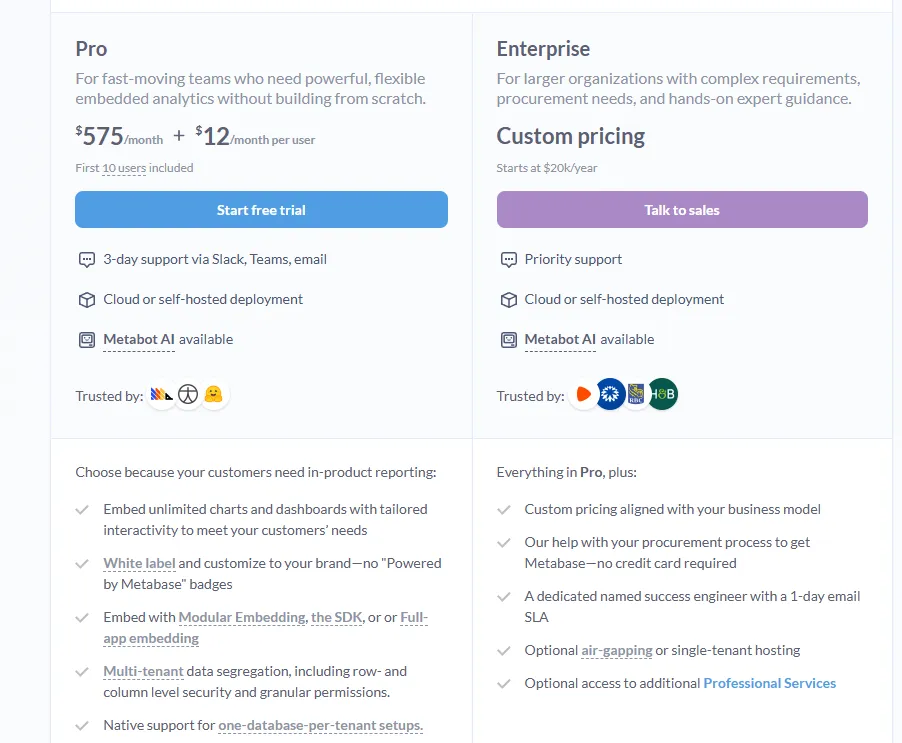
- Pro: $575/month + $12/user/month, first 10 users included, cloud or self-hosted deployment, includes everything in Starter, plus row- and column-level permissions, SSO and SCIM support, advanced caching and performance controls, staging + production environments, usage analytics and audit visibility, white-labeling, and embedded analytics capabilities.
- Enterprise: Custom pricing (starts at $20k/year), includes everything in Pro, plus priority support, dedicated success engineer (1-day email SLA), optional single-tenant or air-gapped deployment, and optional professional services.

- Embedded Analytics pricing:
- Pro: $575/month + $12/user/month, first 10 users included, includes unlimited embedded dashboards and charts, full white-labeling, modular embedding, SDK, or full-app embedding, multi-tenant security (row- and column-level), one-database-per-tenant support, staging + production environments, usage analytics, internal BI for your team, and option to include Metabot AI (charged extra).
- Enterprise: Custom pricing (starts at $20k/year), includes everything in Pro, plus a dedicated success engineer, priority support, optional single-tenant or air-gapped hosting, and optional professional services.
Metabase Pros and Cons
✅ Genuinely fast to set up, with a friendly UI for both technical and non-technical users.
✅ The open-source option is a serious cost-saver for early-stage teams.
✅ Embedded analytics holds up well for SaaS use cases.
❌ A user on G2 believes that Metabase could benefit from having an AI assistant that understands the databases and assists in building queries
Which ThoughtSpot alternative actually fits the way your team works?
That wraps up our list of the 10 best ThoughtSpot alternatives for teams looking for a different angle on AI analytics, dashboarding, or warehouse-native BI in 2026.
- Some of these tools focus on natural-language search.
- Others lean on classic dashboarding, semantic modeling, or spreadsheet-style exploration.
But most of them are still places you go. You open the BI tool, build a dashboard or run a search, interpret what comes back, and bring it to wherever the actual decision is being made.
Dot lives where the decisions happen.
You ask a business question in Slack or Teams, and the answer arrives in the same thread, written out, with the data attached and the reasoning shown. No detour through a separate analytics tool, no copy-paste into the deck, no "let me circle back with the analyst."
If your team's biggest bottleneck is the gap between data and decisions, that's the gap Dot is built to close.
Here's what you'll get by signing up for Dot:
- Ask any business question in Slack, Teams, email, or the web app and get a full written analysis in minutes.
- Scheduled executive-ready business reviews delivered automatically with live warehouse data and narrative commentary.
- A Context Agent that maintains shared business definitions and prevents metric drift across teams.
- Full audit trail on every insight, with traceable links back to the exact SQL, Python logic, and datasets used.
- Direct connections to Snowflake, BigQuery, Redshift, Databricks, Postgres, and 30-plus other sources.
- Reuses existing dbt, Looker, and Power BI metric definitions instead of asking you to rebuild semantics from scratch.
- SOC 2 Type II compliance and enterprise-grade security.
- Credit-based pricing with unlimited users, so adoption isn't gated by per-seat math.
➡️ Get started for free with Dot's Starter plan, or schedule a demo to see how it works with your data.
⚠️ Disclaimer: This article was last updated on 1st of May, 2026 and if there's any misinterpretation of the information, please contact us and we will fact check it.
Theo Tortorici
Theo writes about AI-powered analytics, data tools, and the future of business intelligence at Dot.