
10 Best Cloud Analytics Platforms In 2026
In this article, I'll go over the 10 best cloud analytics platforms in 2026, with their top features, pricing structure, and pros and cons.
TL;DR
- Dot is the best cloud analytics platform in 2026 for data teams that want written analysis delivered into Slack, Microsoft Teams and email, dashboards somebody has vouched for by name, a change-controlled metric layer, and no seat count anywhere on the bill.
- Tableau Cloud, Microsoft Power BI, and Domo are the broad hosted suites, usually bought from a vendor the company already holds a contract with.
- Looker, Sigma, and Holistics each query the warehouse your data is already in, with a governed model between the tables and the people asking questions.
- Qlik Cloud, Zoho Analytics, and Metabase Cloud all publish real numbers, and each meters something different: gigabytes loaded, rows stored against seat caps, and a base fee with per-user charges stacked on top.
What are the best cloud analytics platforms in 2026?
The best cloud analytics platform in 2026 is Dot, an AI data analyst that reads your cloud warehouse and writes up the answer in Slack, Microsoft Teams, email, or its own web app, followed by Tableau Cloud for hosted visual analysis and Looker for metrics defined in code.
Four things decided what made this shortlist:
- The vendor runs it, so you're buying a tenant, and somebody else patches the box. Anything sold purely as software you host yourself didn't qualify.
- It reads from a cloud data warehouse or cloud database, going beyond spreadsheets somebody uploads by hand.
- Its pricing model is knowable, either published outright or documented well enough that I can describe the meter honestly.
- It ships today. Nothing here is a waitlist or a roadmap item.
Below is the full shortlist, with the buyer each platform suits and the figure you would be quoted.
Tool | Use case | Price |
Dot | Asks your warehouse a question in everyday language and returns written analysis with a recommendation attached. | Free plan; Pro from $180/month. |
Tableau Cloud | Hosted visual analysis priced by role, so people who only read cost a fraction of people who build. | Standard from $15/user/month, annual. |
Microsoft Power BI | Standardized reporting for organizations already licensed through Microsoft 365. | Free tier; Pro at $14/user/month. |
Looker | Every metric defined once in LookML, version-controlled, then reused across every report downstream. | Quoted by sales, annual commitment. |
Domo | Ingestion, transformation, dashboards, and low-code apps bought from one vendor on one contract. | 30-day trial, then credits quoted by sales. |
Sigma | A spreadsheet grid over live warehouse data, with writeback for teams that need to type numbers in. | Pricing not published. |
Qlik Cloud | Free-form exploration where gigabytes loaded drive the bill and headcount doesn't. | Starter $300/month; Standard $825/month, annual. |
Zoho Analytics | Connector-led reporting for teams already inside the Zoho suite. | Free plan; Standard from $60/month. |
Holistics | Datasets and metrics written as code, reviewed in Git, then handed to business users to explore. | Entry $960/month, or $800/month on annual billing. |
Metabase Cloud | The open-source Metabase project, hosted and patched by Metabase so you don't have to. | Starter $100/month plus $6 per user each month. |
#1: Dot
Dot is the best cloud analytics platform in 2026 for data teams that want a written answer instead of a chart, dashboards carrying a named sign-off, metric definitions that can be branched and tested before they ship, and a bill that ignores how many people are reading.
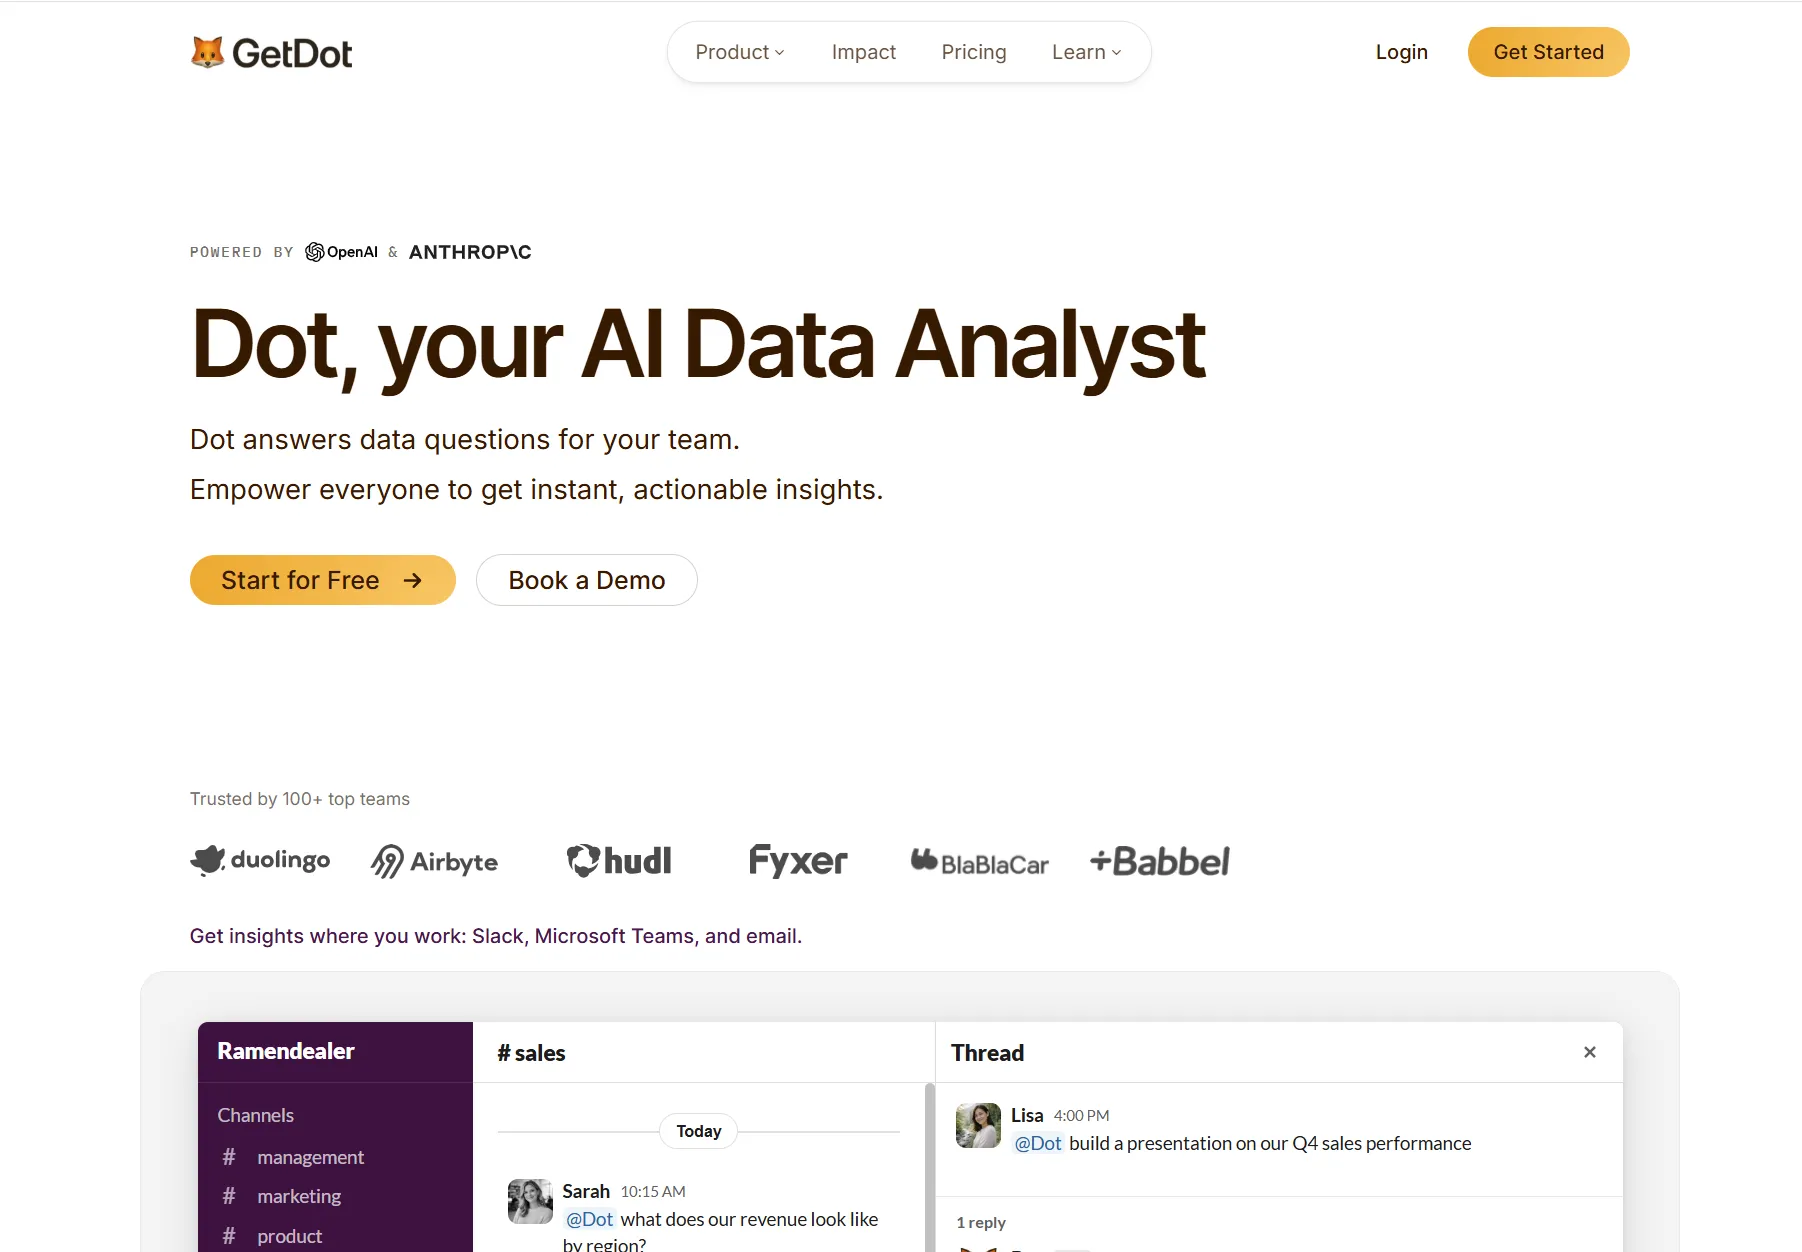
Disclaimer: Dot is our own product, so weigh this section accordingly. I'll still put the argument for our AI data analyst taking the top spot for the best cloud analytics platform.
We're not trying to add another dashboarding surface to a market with plenty of them.
Our aim is narrower: take the question that would otherwise have become a ticket, answer it against governed warehouse data, and show the working.
Here's what that means: 👇
Questions get answered in the channel where somebody asked them
Dot answers business questions in Slack, Microsoft Teams, email, and our own web app, and the reply arrives in that same thread with the figures and a suggested next step written out.
Nobody opens a dashboard, and nobody has to write SQL.
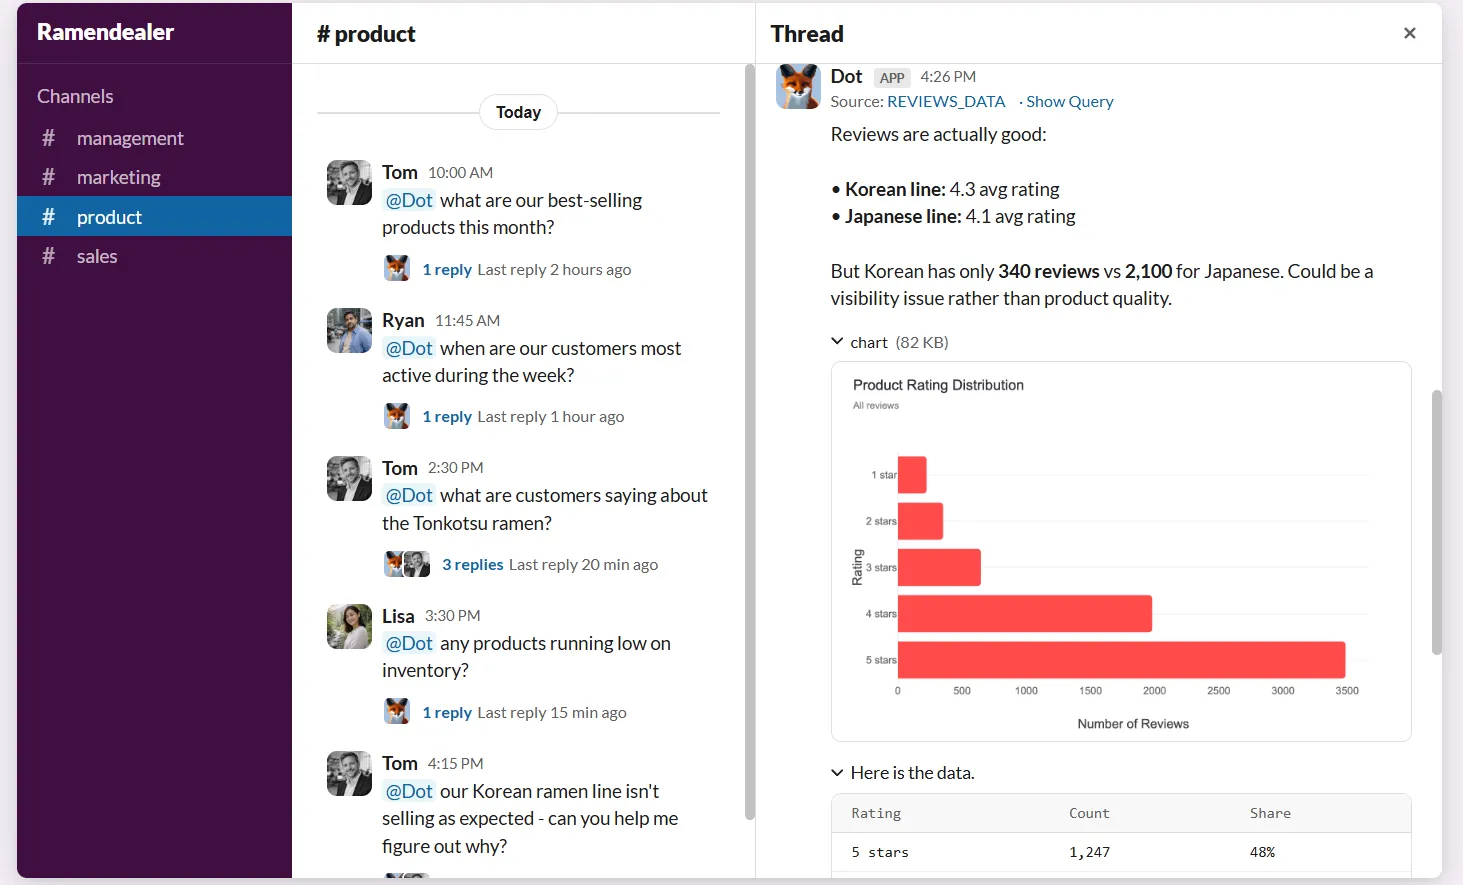
A support lead wondering why first-response time slipped last week asks in their own channel and reads the answer there.
Here are a few specifics:
- Energy Mode sets how hard Dot thinks: Economy handles everyday lookups, Balanced is the standing default, and Frontier takes the genuinely hard questions.
- The default is an admin setting: Your pick sticks for the thread, and one-off questions can be bumped either way with an !economy or !frontier prefix in Slack, Microsoft Teams, or email.
- Scheduled reports are a conversation: Report emails tell recipients to just hit reply with a follow-up, the answer comes back in the same thread, and Slack reports arrive as one message, not a wall of them.
- Dot remembers your preferences: A line like "remember I always look at EUR" in any chat becomes a personal memory, private to you and editable on your profile page.
Dot queries your cloud warehouse in place and stores no copy of your data
Dot connects to the warehouse or database you already run and executes its queries there.
That means your rows never move into a Dot-owned storage engine.
Connections cover Snowflake, BigQuery, Redshift, Databricks, Postgres, ClickHouse, Amazon Athena, and SAP HANA Cloud.
Where a modeling layer already exists, Dot reads it. dbt, Looker, Malloy, Cube, and Power BI models all connect as semantic layers, and the dbt repo re-syncs daily with nobody scheduling it.
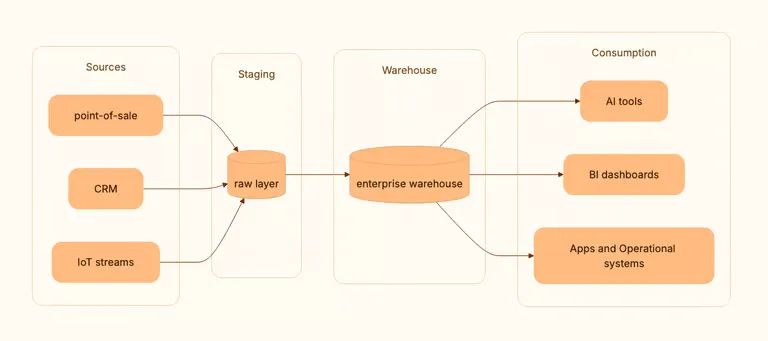
BI tools connect separately.
Dot reads Tableau, Metabase, and Sigma content through their APIs, so logic already built into a trusted dashboard isn't rebuilt.
What’s more, every query is signed. That means each SQL statement Dot executes carries an audit comment naming the person, the workspace, whatever set it off, and a link back to the exact conversation.
Deep Analysis works a question from several angles before answering
Deep Analysis is the mode Dot switches into when one query won't settle a question. What follows behaves like an investigation.
A question like "why did activation drop in the SMB segment last month" sends Dot digging properly.
Dot issues a sequence of queries, tests what each one returns, then hands back a structured report with charts and a recommendation. Most runs finish between two and ten minutes.
The report names the segments and dimensions that moved, sizes each against the period before, and puts a likeliest cause on the table with numbers attached.
That fills the gap between a dashboard telling you activation fell and an analyst investigation nobody has room for this week.
Published dashboards carry a certification badge naming who vouched for them
Dot turns a chat answer into a published dashboard that lands in a folder, gets a shareable link, and re-runs its queries on demand or on a schedule.
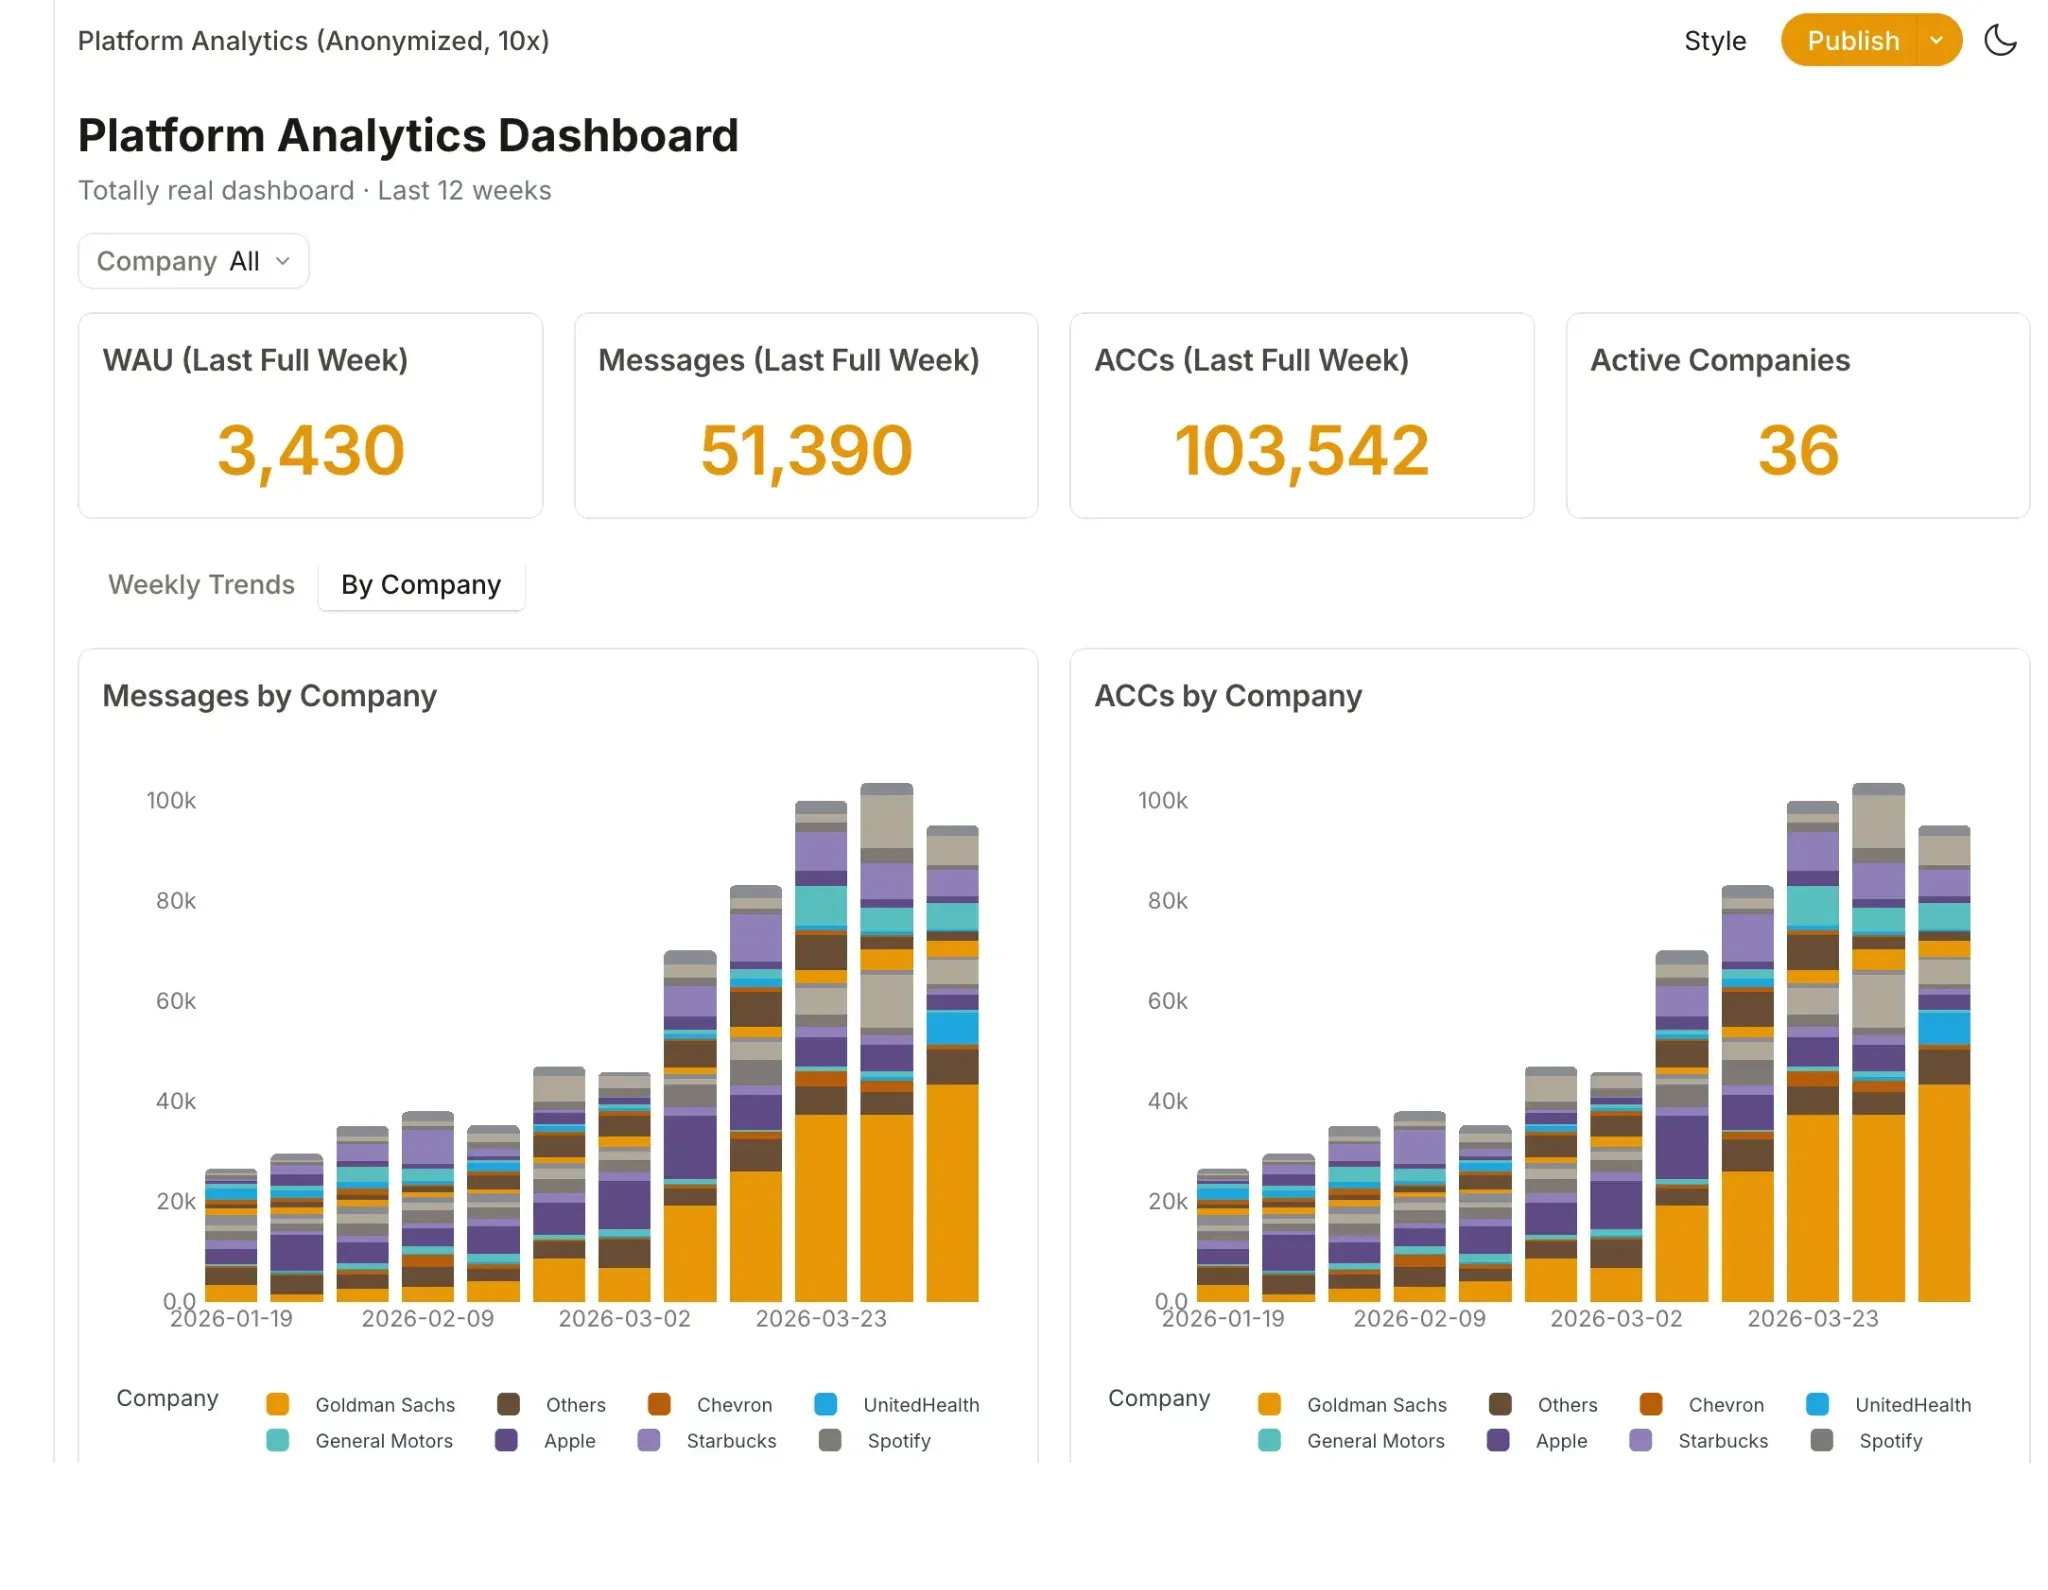
Anyone with access can hit Ask to question that dashboard directly.
And the best part? Numbers stay traceable.
Full logs beneath any answer hold a Lineage view drawing the route from warehouse tables through the exact SQL and any dbt models involved. Where a note from your team shaped the query, that note joins the graph too.
The Context Agent holds your definitions, and Environments let you test a change first
Dot's Context Agent keeps your metric definitions and calculation logic in one governed place, and every answer Dot produces is checked against them.
Where that context comes from: your dbt repo, the warehouse itself, your existing dashboards, past conversations, and your team wiki, with Slite connecting directly and Confluence content pulled across by the Context Agent.
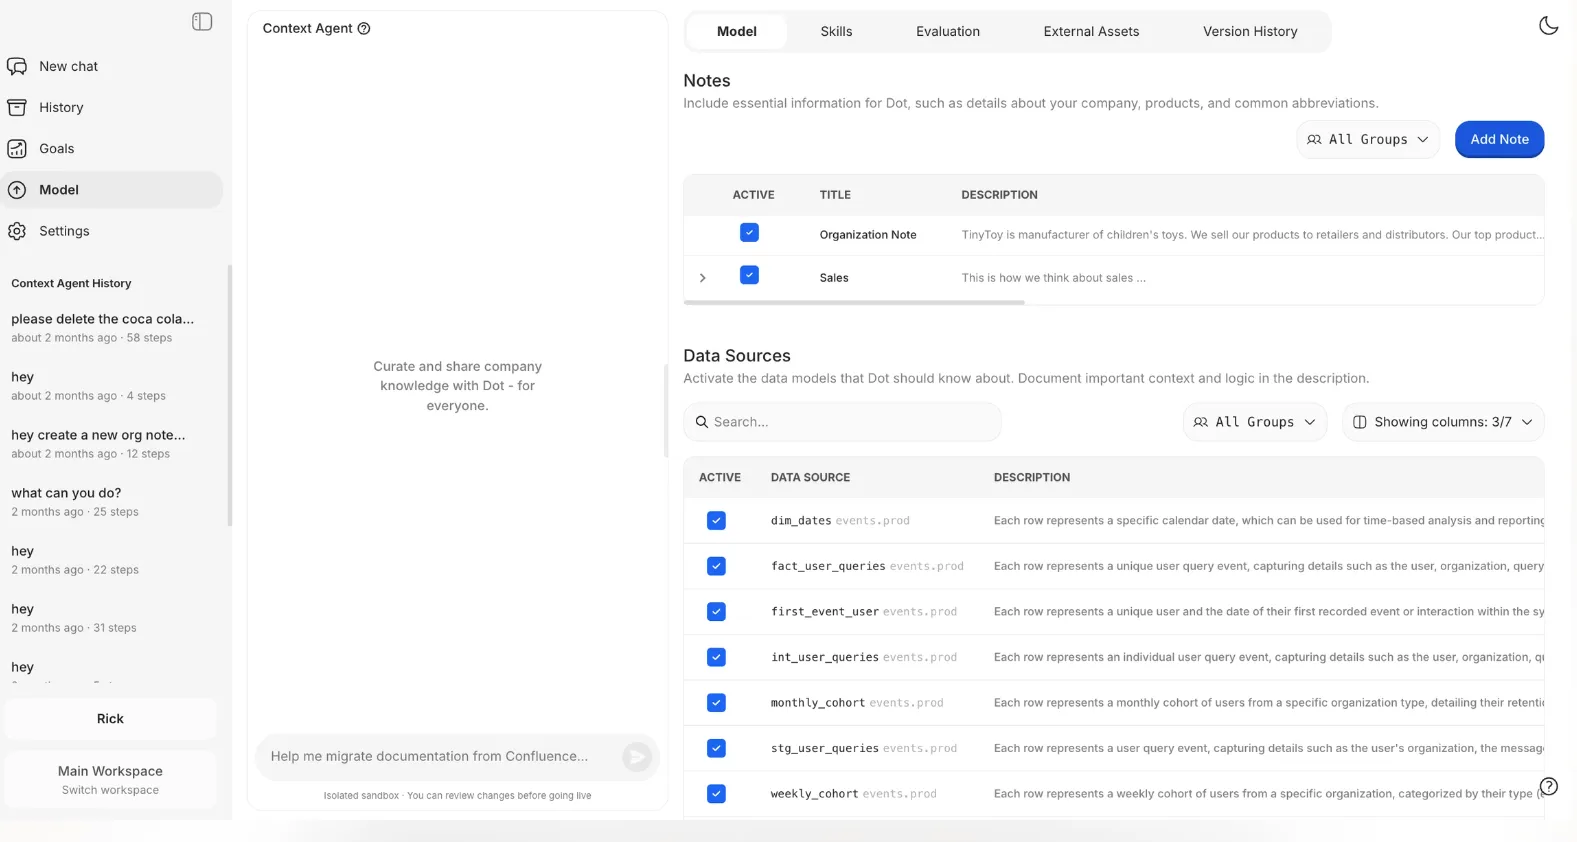
A correction typed mid-chat doesn't simply take effect. It becomes a proposal, and an admin decides whether it becomes company-wide truth.
Environments go further.
You fork production into an isolated copy of the model, the docs, the metrics, the notes and the relationships, though never the warehouse data itself.
Change a definition on that branch, put your real questions to it while production carries on untouched, then read the diff and merge, with conflict resolution if production shifted underneath you.
Teams who want code review mirror an environment to a Git remote and raise a pull request per change, and that mirroring runs in both directions by default.
What makes Dot different from the other cloud analytics platforms?
Nearly every platform on this list starts from a surface you build on, whether that's a canvas, a spreadsheet grid, a modeling language or a query editor, then puts AI on top.
Mostly that means the AI helps you assemble the thing you were already assembling.
Dot starts at the other end, from the finished answer.
What arrives is prose explaining the movement and a recommendation for what to do, in whatever channel the question came from, with the query and the lineage a single click below every number.
The commercial difference is sharper.
Every platform here that publishes a number bills against headcount somehow: a rate per seat, a ceiling on how many people the plan holds, or a per-user add-on stacked onto a base fee.
A few offer a way round it.
Tableau Cloud sells Viewer capacity blocks, Power BI drops the per-viewer licence at F64 and above, and Qlik Cloud swaps seats for gigabytes above Starter.
In each case you're still buying a meter, only one measured in compute or data volume.
Dot's paid tiers don't count people. They count analysis work, and the fiftieth stakeholder who wants a number never becomes a purchase order.
That trade has a downside, and I'd sooner name it than skate past it.
If you want a governed answer you can audit down to the query, that's the problem Dot was built around, and it runs against the dbt and warehouse layer your team already maintains.
Dot pricing
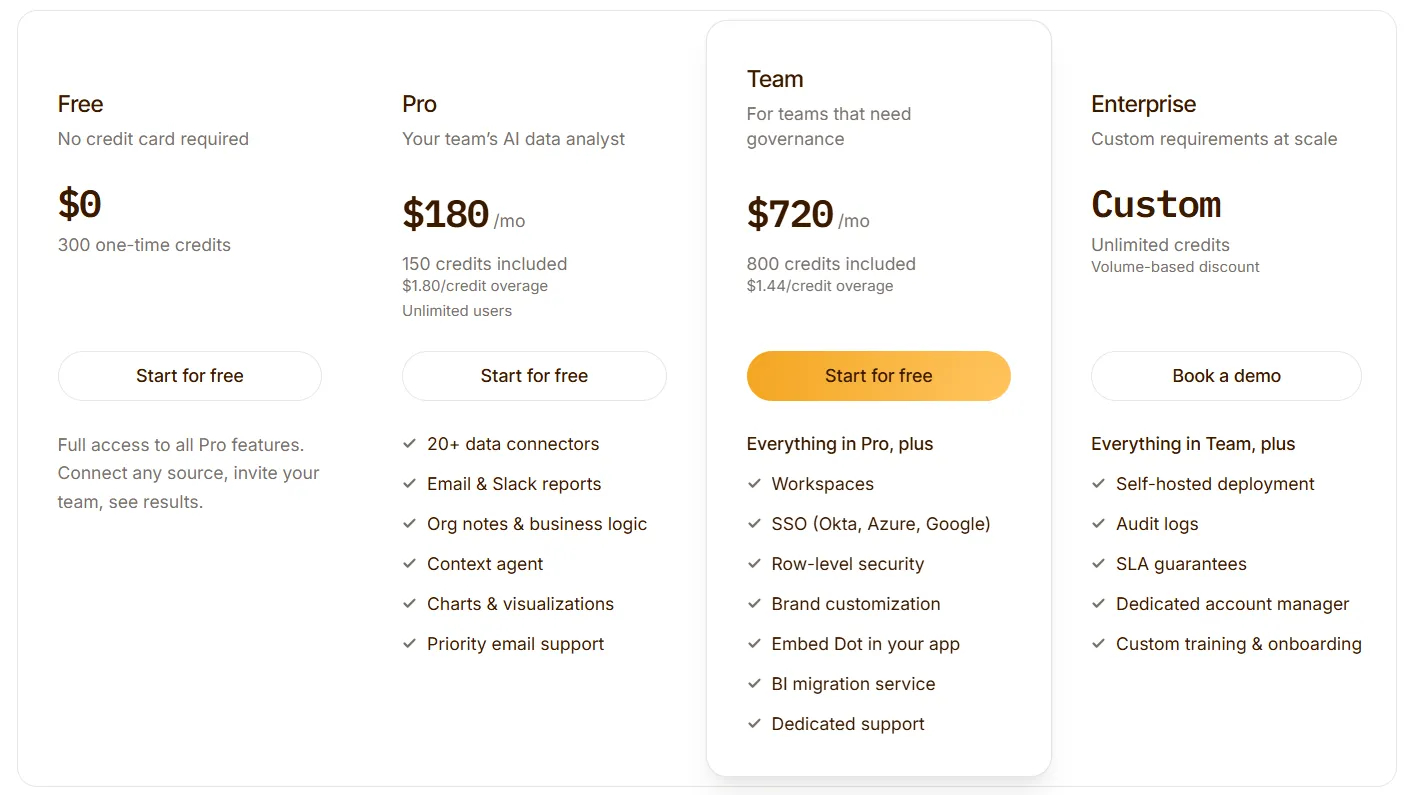
Dot bills by credit, not by seat. A credit gets consumed when Dot performs a piece of analysis work, and the number of people in your account never enters the calculation on a paid plan.
- Free: $0. Three hundred one-time credits and every Pro feature, enough to point it at your own warehouse and judge it honestly.
- Pro: $180 a month for 150 credits, with extra credits at $1.80. More than 35 connectors, email and Slack reports, the Context Agent, and priority email support.
- Team: $720 a month for 800 credits, and the overage rate falls to $1.44. This is the governance tier, bringing workspaces, single sign-on through Okta, Microsoft Entra ID or Google, row-level security, brand customization, embedding, dedicated support, and a service that migrates your existing BI reports across.
- Enterprise: priced individually. The credit ceiling disappears, volume rates apply, and you pick up self-hosted deployment, audit logging, an SLA, a named account manager, and custom onboarding.
Dot pros and cons
✅ Prose that explains what happened and recommends what to do, with no interpretation left to the reader.
✅ Any figure opens onto the SQL behind it, the dbt models upstream, and any note that steered the query.
✅ Dashboards carry a named, version-pinned certification, and stale ones archive themselves.
✅ No seat count on any paid tier, so read-only stakeholders never become line items.
✅ Metric changes can be branched, tested against real questions, and reviewed as a pull request before they reach production.
❌ There has to be a warehouse or database to point it at.
❌ Dashboards ship behind an admin feature flag.
#2: Tableau Cloud
Best for: Companies where a handful of people build dashboards, and hundreds of others only open them.
Similar to: Qlik Cloud, Domo.
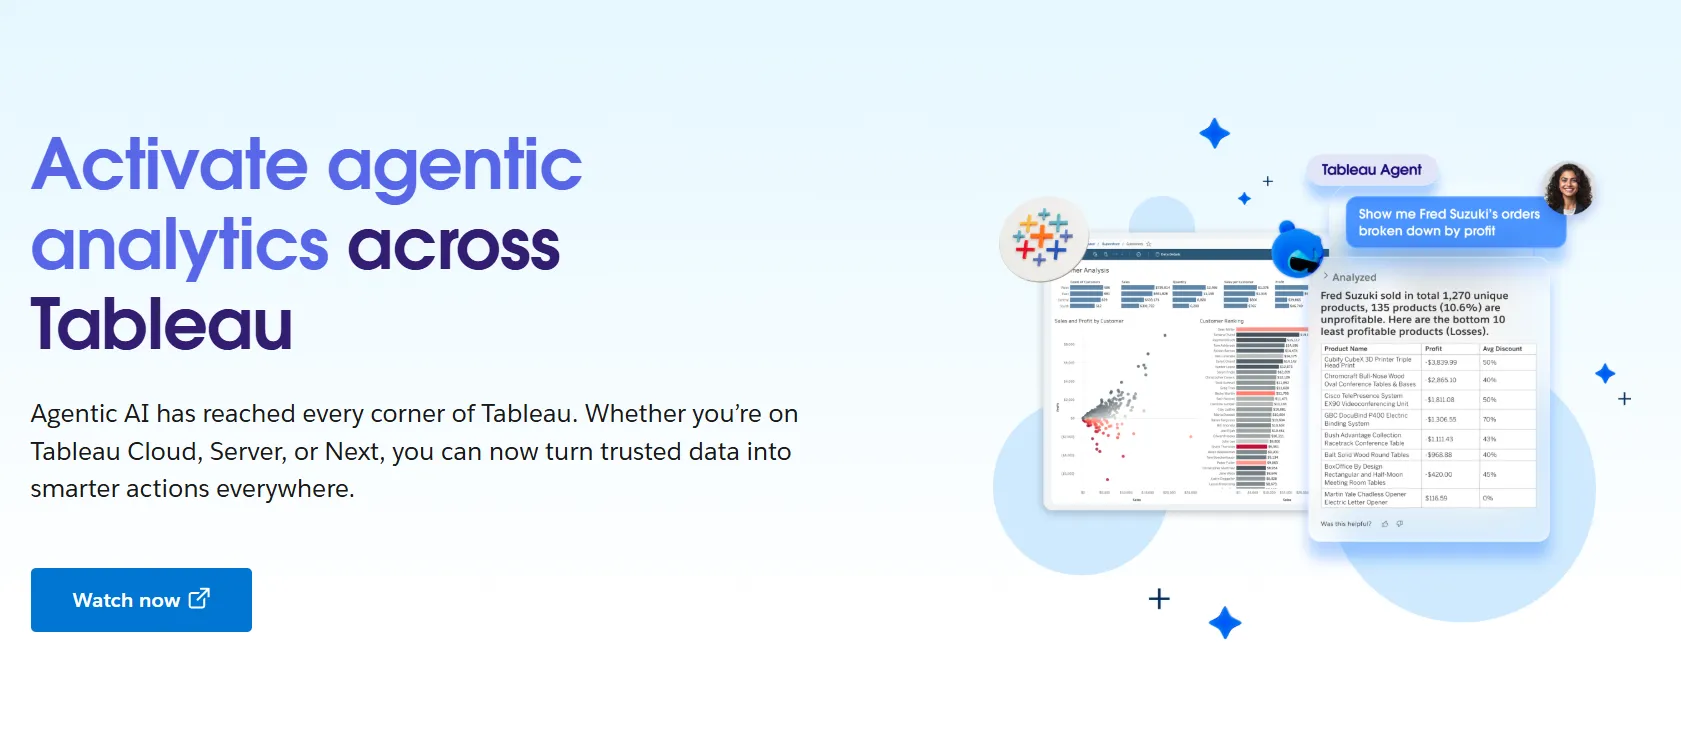
Tableau Cloud is Salesforce's hosted edition of Tableau. Salesforce carries the infrastructure, the upgrades and the scaling, and your team carries none of it.
It suits organizations wanting Tableau's visual depth without babysitting Tableau Server.
Tableau Cloud's top features
- Role-based licensing: Everyone is designated a Creator, an Explorer, or a Viewer, and the rates differ sharply between them. That gap decides the bill when most of your audience only reads.
- Capacity-based licensing: License your Creators and Explorers, then buy Viewer capacity blocks and open access broadly without a licence per viewer.
- Tableau Pulse: Metric definitions and change digests get pushed out to licensed users, including Viewers, so movement reaches people who rarely open a dashboard.
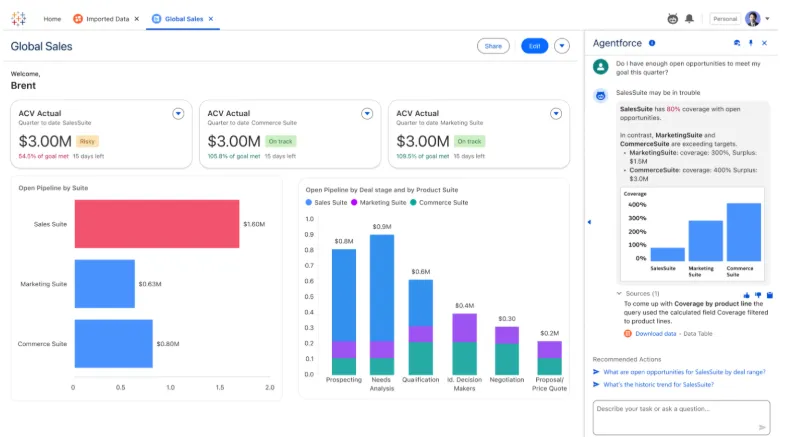
- Tableau Agent: The agentic layer works inside authoring, Prep, Catalog, and Pulse. It arrives with the Cloud Plus edition, two steps above the entry price.
Tableau Cloud pricing
Tableau Cloud has three pricing plans:
- Tableau Standard: Starts at $15/user/month, which includes browser-based authoring and collaboration, Tableau Desktop and Prep Builder, Tableau Pulse for metrics and insights.
- Tableau Enterprise: Starts at $35/user/month and includes everything in Standard, plus Advanced Management and Data Management for governance and scale.
- Tableau+ Bundle (Cloud + AI): Custom pricing, includes everything in Tableau Enterprise, plus Tableau Next, Tableau Agent, and Pulse premium features, with access to release previews and early AI capabilities.
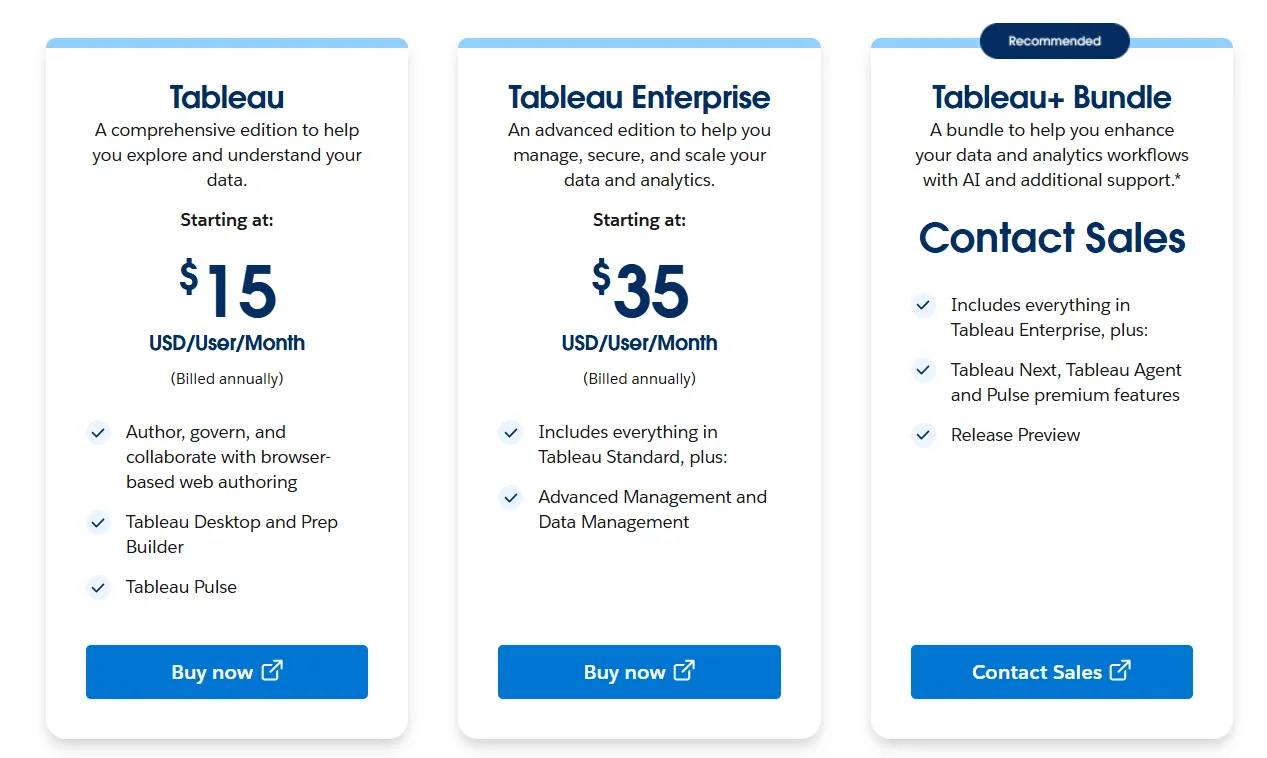
Tableau Cloud pros and cons
✅ Role-based licensing keeps a large read-only audience genuinely cheap.
✅ Visual depth few platforms match.
✅ Capacity licensing exists for organizations that want analytics in front of everyone.
❌ Per-user pricing can scale fast for organizations rolling out broadly.
#3: Microsoft Power BI
Best for: Organizations already licensed through Microsoft 365 that need standardized reporting without adding a vendor relationship.
Similar to: Tableau Cloud, Zoho Analytics.
Inside a Microsoft 365 tenant, Power BI is usually the analytics service that's already paid for, since a Pro licence comes bundled with Microsoft 365 E5 and Office 365 E5.
It fits teams who care more about working alongside Excel and Teams than about picking a best-of-breed tool.
Microsoft Power BI's top features
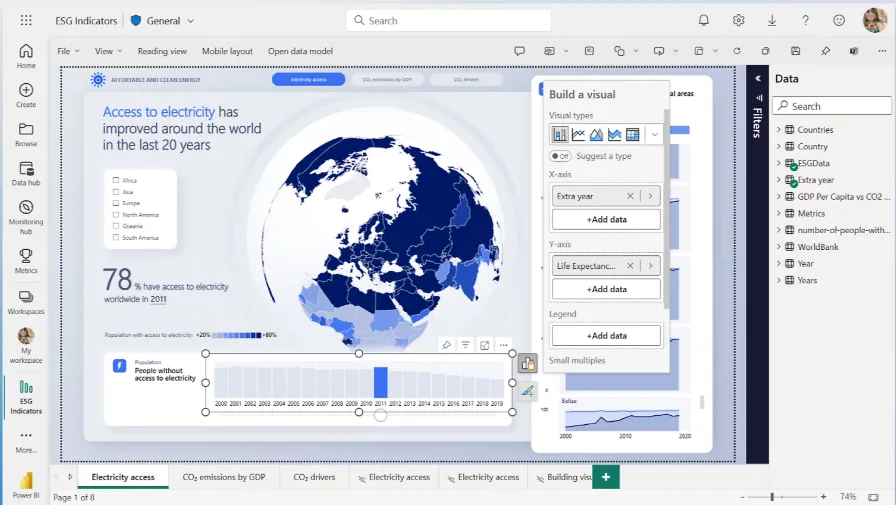
- Copilot: Works inside the authoring experience, writing DAX, summarizing a report in prose, and fielding questions against the semantic model behind it. Microsoft's plan comparison lists Copilot in Fabric under the capacity plans, not the per-user ones.
- DAX time intelligence: Prior-period, year-to-date, and year-on-year comparisons ship as functions, so nobody rebuilds that logic by hand.
- Excel connectivity: Analysts pull governed Power BI models straight into Excel and carry on in the tool they already know.
- Fabric capacity: At F64 and above, report consumers read Power BI content without each holding a paid per-user licence.
Microsoft Power BI pricing
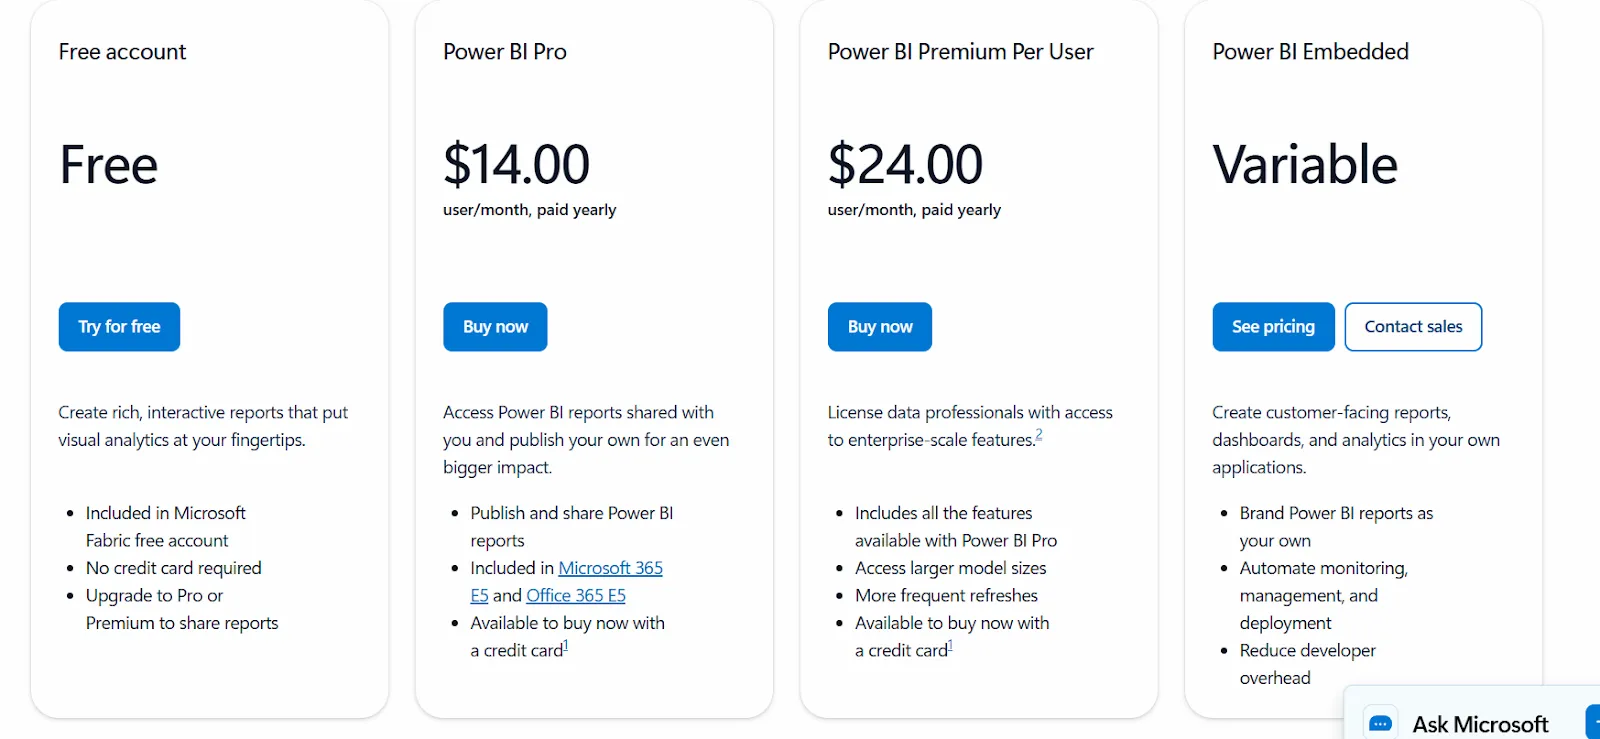
Power BI runs two meters side by side, one per user and one per capacity, alongside a free tier through the Microsoft Fabric free account where you can build but not share.
- Free: $0. One person, a personal workspace, nothing shared.
- Pro: $14 a user each month, paid yearly. Publishing, workspace sharing, a 1 GB model ceiling, and eight dataset refreshes a day.
- Premium Per User: $24 a user each month, paid yearly. Models go to 100 GB, refreshes to 48 a day, and XMLA read and write opens up.
- Microsoft Fabric capacity: variable. An annual reservation is priced 40.5% below the pay-as-you-go rate.
➡️ We work the licensing maths through properly in ourPower BI pricing guide.
Microsoft Power BI pros and cons
✅ Often licensed already, which removes the budget conversation entirely.
✅ Excel and Teams integration is hard to match for a Microsoft shop.
✅ Fabric capacity removes per-viewer licences once you clear F64.
❌ Each viewer needs a paid license unless the workspace is on Fabric capacity, a calculation we work through in our Power BI pricing guide.
#4: Looker
Best for: Organizations that want each metric definition written in code and put through review before it changes.
Similar to: Holistics, Metabase Cloud.
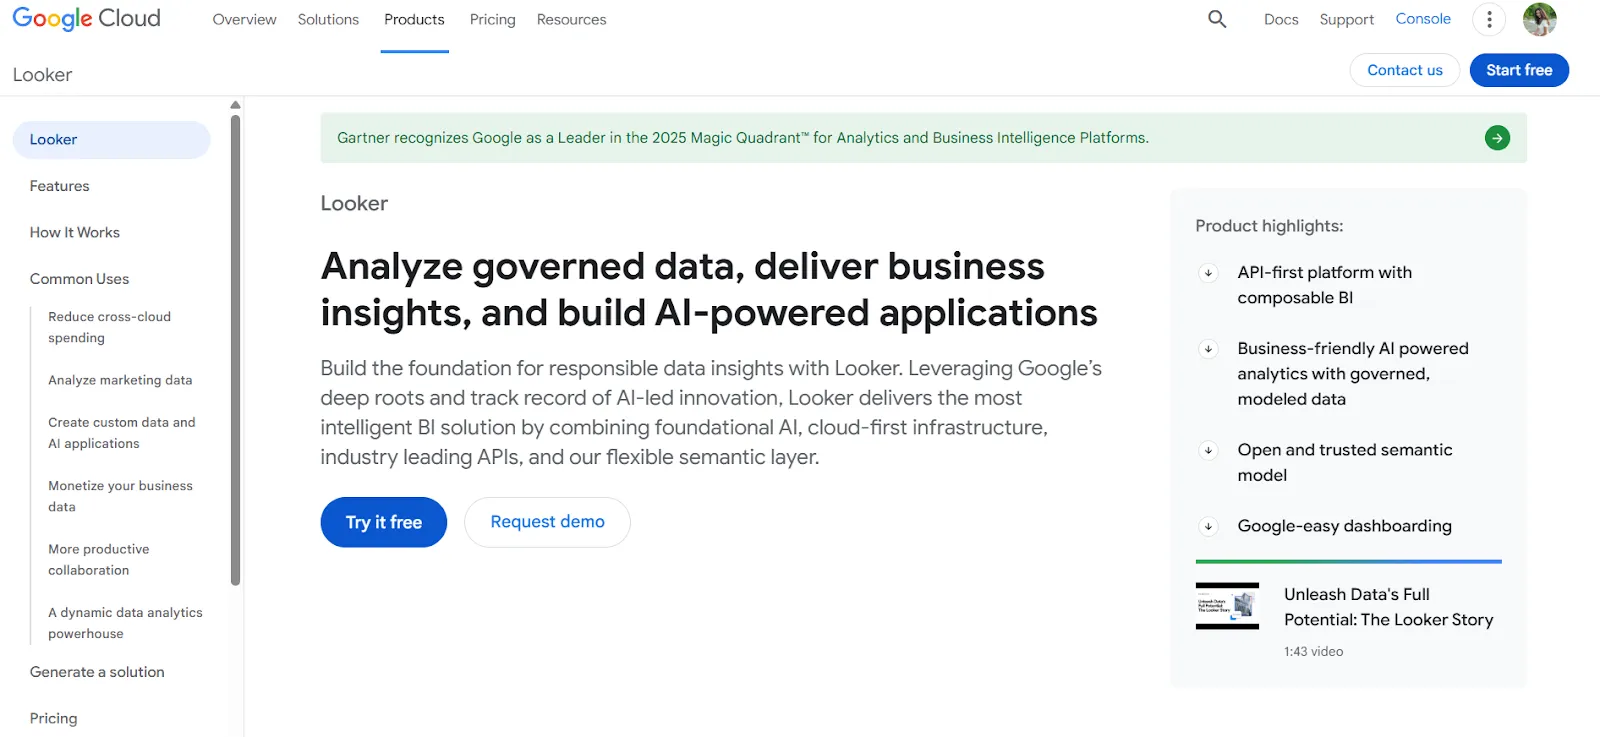
Google Cloud's Looker keeps business logic in LookML. Revenue gets defined once, and everything downstream reads from that one layer.
It tends to win at companies with a history of two departments quoting different numbers for the same metric.
Looker's top features
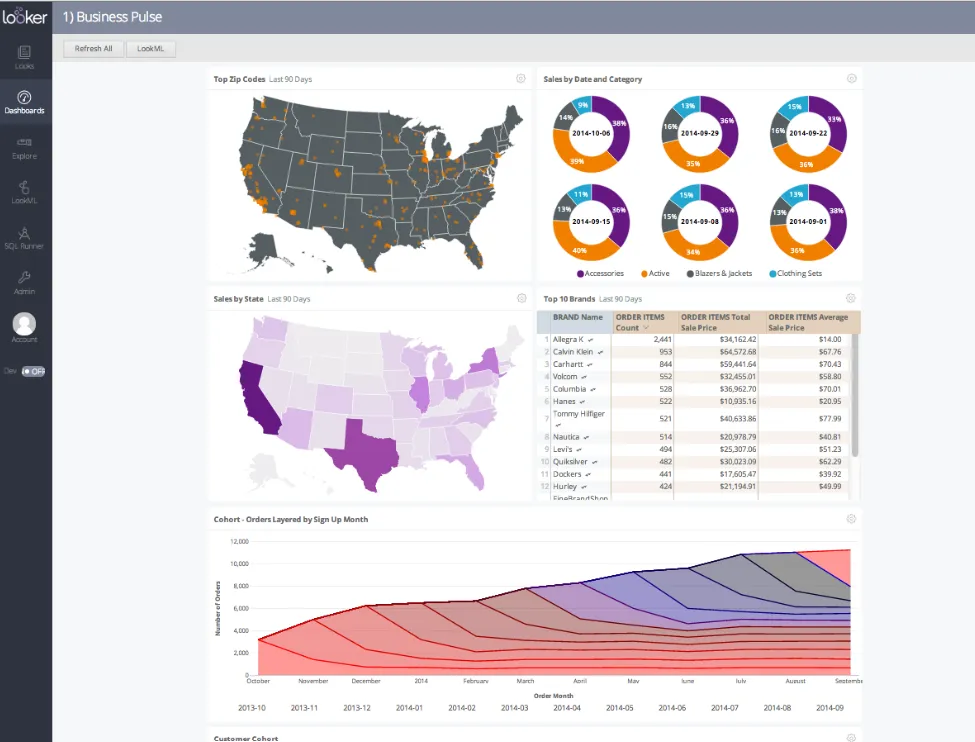
- LookML modeling: One modeling language holds each metric, kept under version control, and every dashboard and report downstream reads from it.
- Conversational Analytics: Natural-language questions get resolved against the governance already written into LookML, so an answer can't quietly disagree with the model underneath it.
- Live warehouse querying: Looker sends queries straight to BigQuery, Snowflake, or Redshift, with no nightly extract in between the report and the source table.
- Governed self-serve: People outside the data team build their own Explores within limits the modelers set, drilling from a summary figure to the rows behind it.
Looker pricing
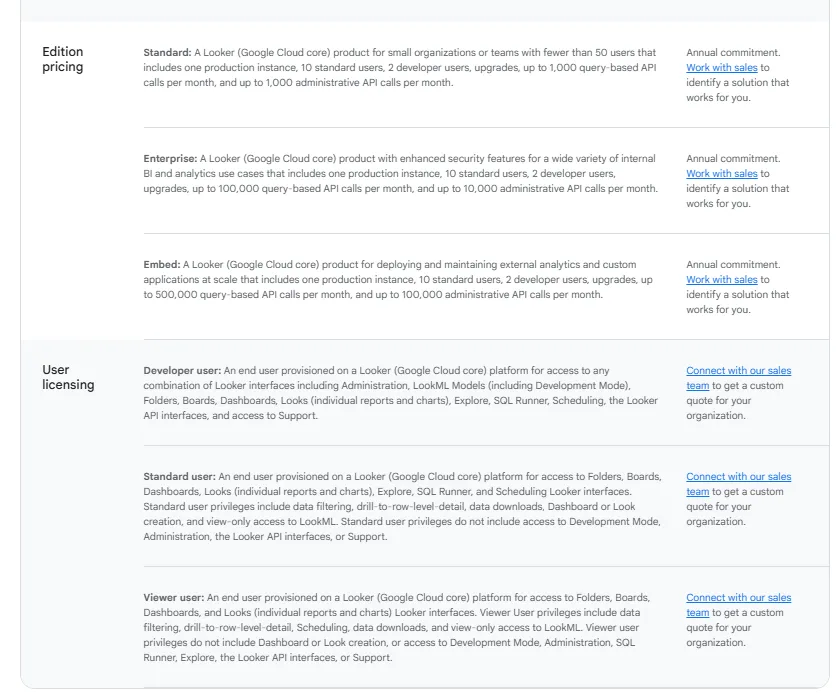
Looker splits the bill into platform pricing and user pricing, and all three platform editions read "Call sales" on an annual commitment across one, two, or three-year terms.
- Standard: built for teams under 50 users. You get a single production instance, ten Standard User seats, two Developer User seats, and a monthly ceiling of 1,000 query-based and 1,000 administrative API calls.
- Enterprise: identical instance and seat allowance, with extra security features, and the API ceiling jumps to 100,000 query-based and 10,000 administrative calls a month.
- Embed: aimed at external analytics and customer-facing applications, allowing 500,000 query-based and 100,000 administrative calls a month.
Seats come in three types, Developer, Standard, and Viewer, and every one beyond the included allowance is priced individually.
The part Google does publish is the meter on Conversational Analytics, counted in data tokens: 60M input and 1.2M output a month on Standard, 300M and 6M on Enterprise, 1.2B and 24M on Embed.
Use runs unlimited within fair use until 30 September 2026, and from 1 October 2026 overage bills at $3.00 per 1M input tokens and $20.00 per 1M output tokens.
➡️ There's more on this in ourLooker pricing guide.
Looker pros and cons
✅ Code-defined metrics give the business one number with a review process attached.
✅ The conversational layer answers through the same LookML everything else reads from.
✅ Token allowances and overage rates are published to the cent, which is rare at this end of the market.
❌ There's a bit of a learning curve at first, which can require a bit more education upfront to maximize all of its capabilities, according to a G2 review.
#5: Domo
Best for: Mid-market and enterprise buyers who would rather hold one analytics contract than five.
Similar to: Zoho Analytics, Qlik Cloud.
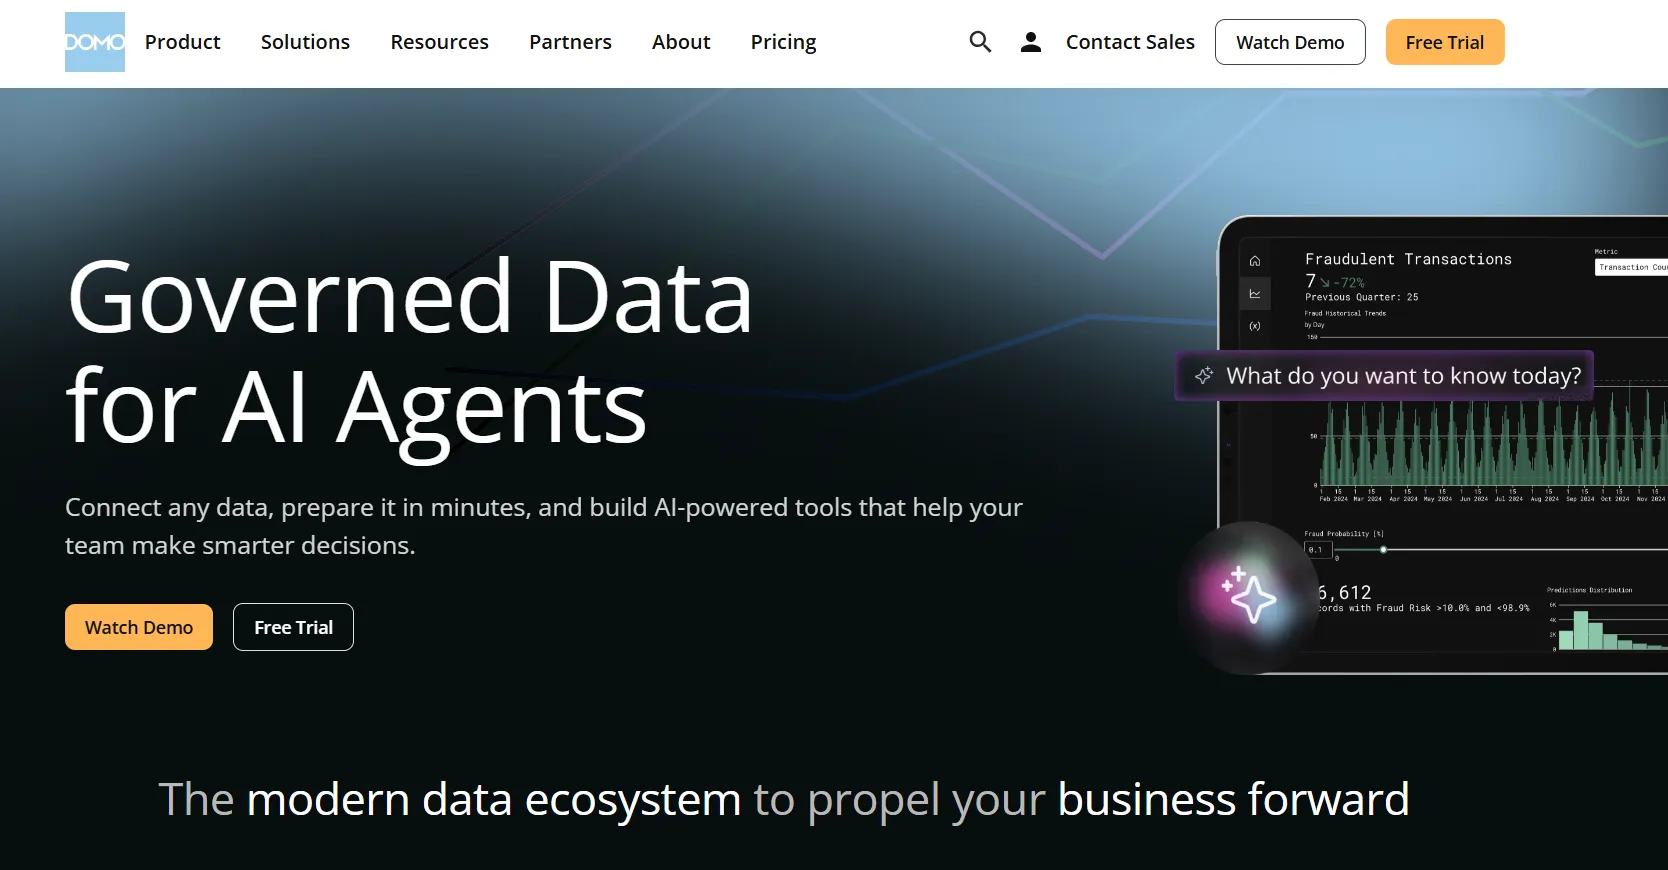
Domo bundles data ingestion, transformation, dashboards, and low-code apps into one hosted platform. The route from a source system to the app built on top of it never leaves the vendor.
It appeals to organizations that would sooner manage one relationship than assemble a stack.
Domo's top features
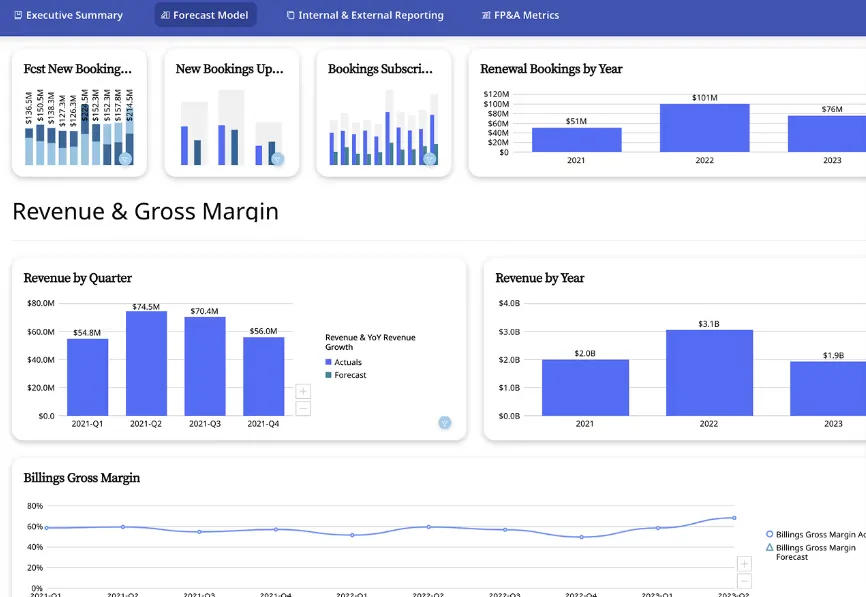
- Connector library: Over a thousand connectors across accounting, billing, CRM, and payment systems, most a few clicks to configure.
- Cards and dashboards: Domo builds reports out of modular Cards that refresh in real time and drop into portals or an intranet.
- Agents and chat: Ask questions of your data in everyday language, and assign an agent to watch a metric and shout when it crosses a line you set.
- App studio: Low-code tooling ships planning and forecasting apps, keeping the workflow on the same platform as the data feeding it.
Domo pricing
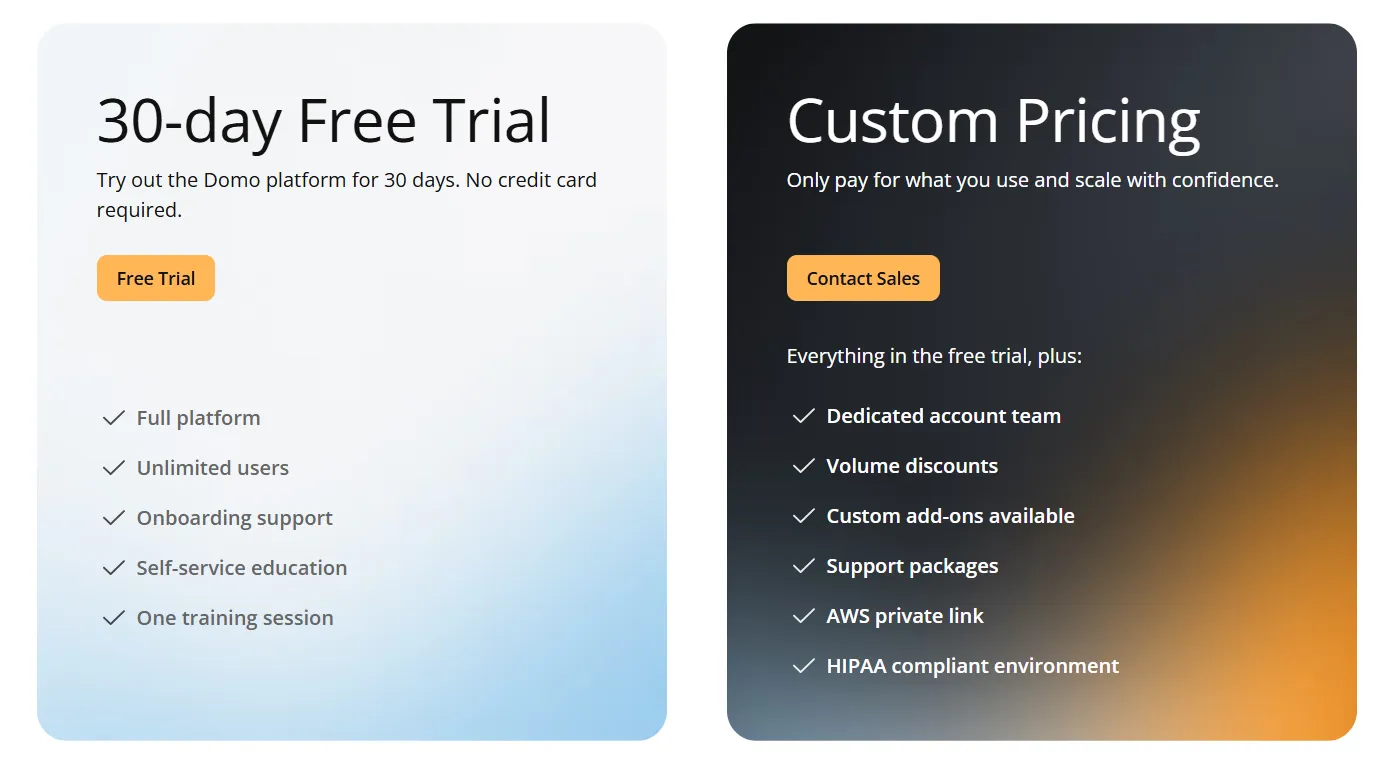
Domo runs a credit model and publishes no rates.
What burns credits is activity: storing data, updating tables, running workflows, and calling heavier capabilities such as ML inference inside the pipeline.
- Free trial: 30 days with no card. The whole platform, unlimited users, onboarding support, and one guided training session.
- Paid: a credit pool sized to your workload. Volume discounts, purchasable support packages, a named account team, AWS PrivateLink, and a HIPAA-ready environment are all included once you're paying.
Domo pros and cons
✅ Raw source system through to automated action, all from one vendor.
✅ With that many connectors, getting data in is rarely what holds up a rollout.
✅ The trial is unusually generous, covering everything with no user cap.
❌ Pricing is not disclosed.
#6: Sigma
Best for: Analysts and operators who would rather work in a spreadsheet, but need the numbers governed and the data current.
Similar to: Metabase Cloud, Holistics.
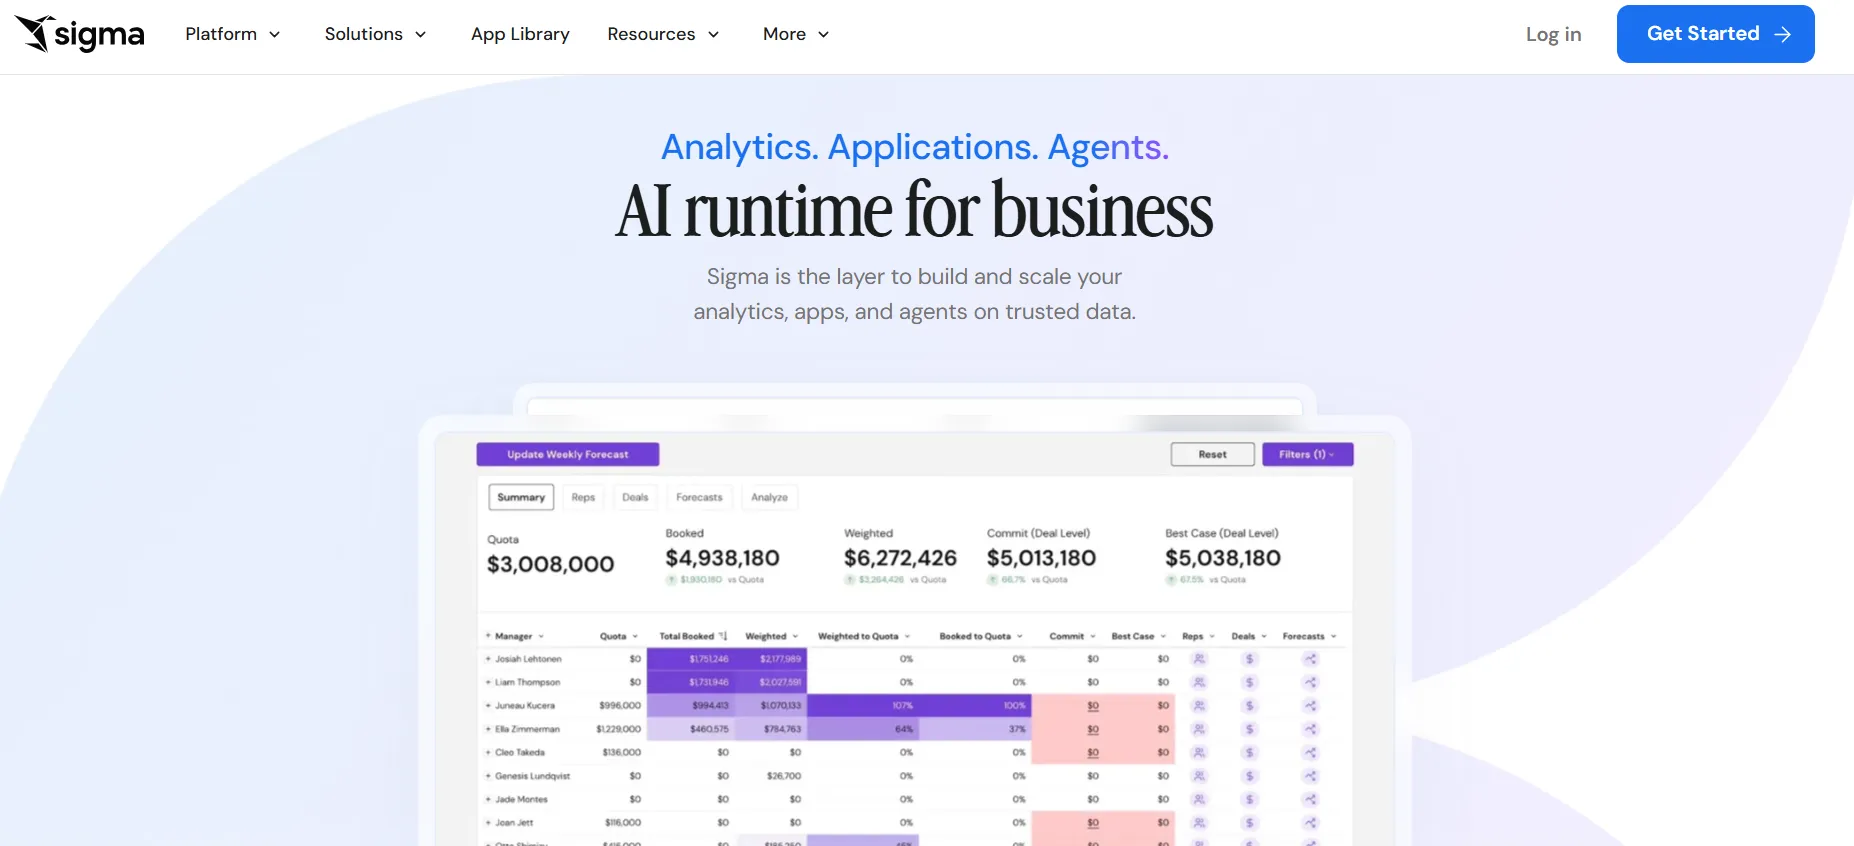
The interface Sigma puts in front of warehouse data is a spreadsheet grid, with pivots and formulas running against billions of rows in Snowflake, Databricks, BigQuery, Redshift, or Postgres.
It's aimed at teams whose real analytical skill is Excel and whose SQL runs out early.
Sigma's top features
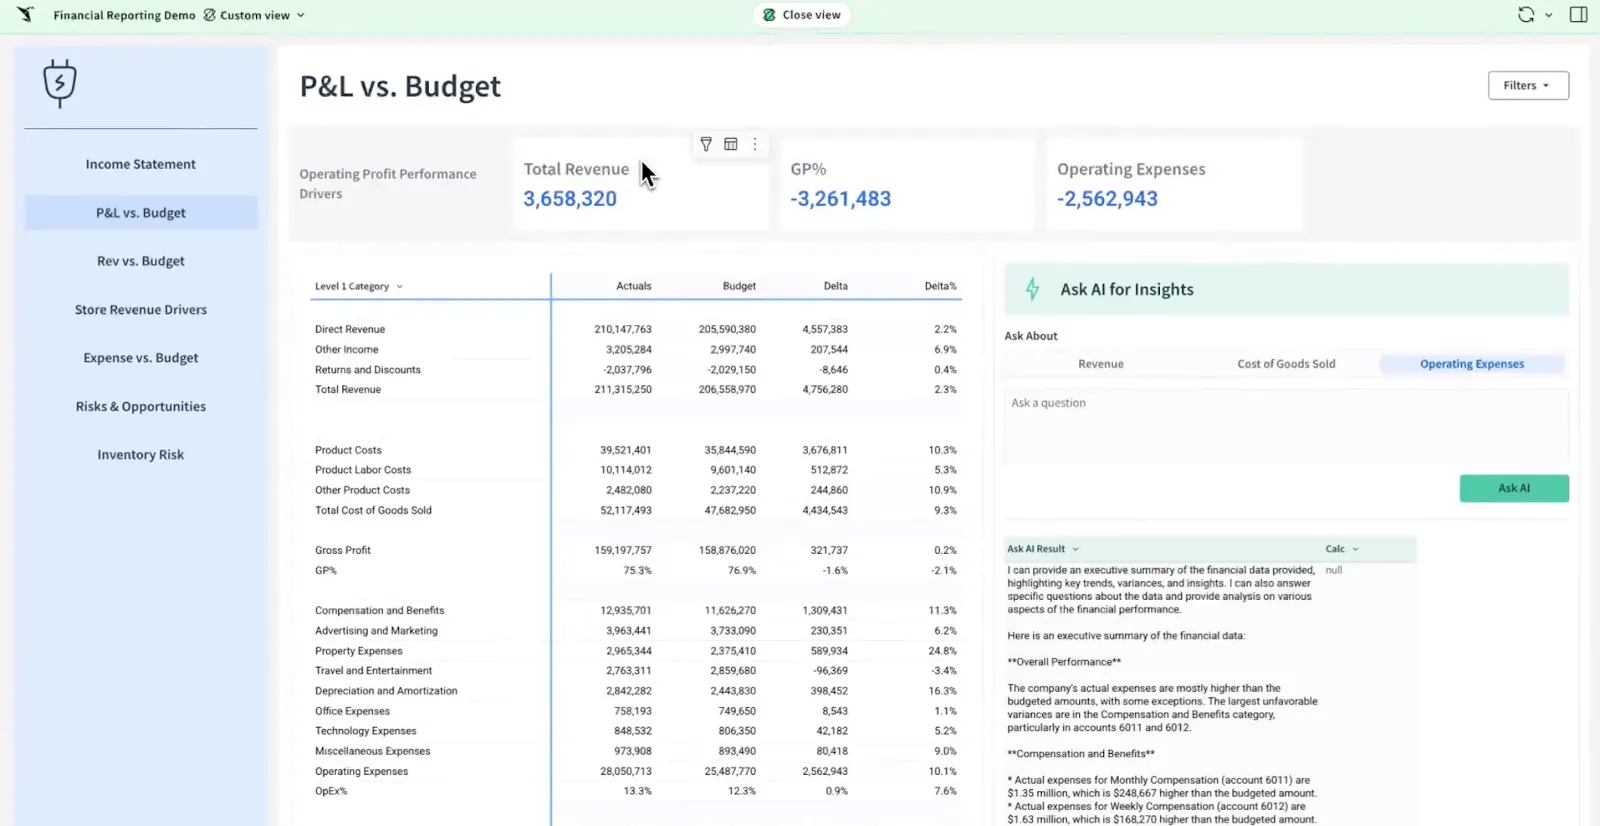
- Spreadsheet interface on live data: Familiar formulas and pivots run against the warehouse directly. Nothing needs refreshing and no stale copy floats about.
- Input Tables with warehouse writeback: A number typed into a Sigma workbook gets written into the warehouse itself under inherited permissions, and Sigma keeps a sequential edit log of every change made to that table.
- No-code modeling: Joins, calculations, and reusable datasets get built visually, or in SQL when somebody needs the control.
- Collaborative workbooks: Teams comment on and version their work together, closer to a shared spreadsheet than a published dashboard.
Sigma pricing
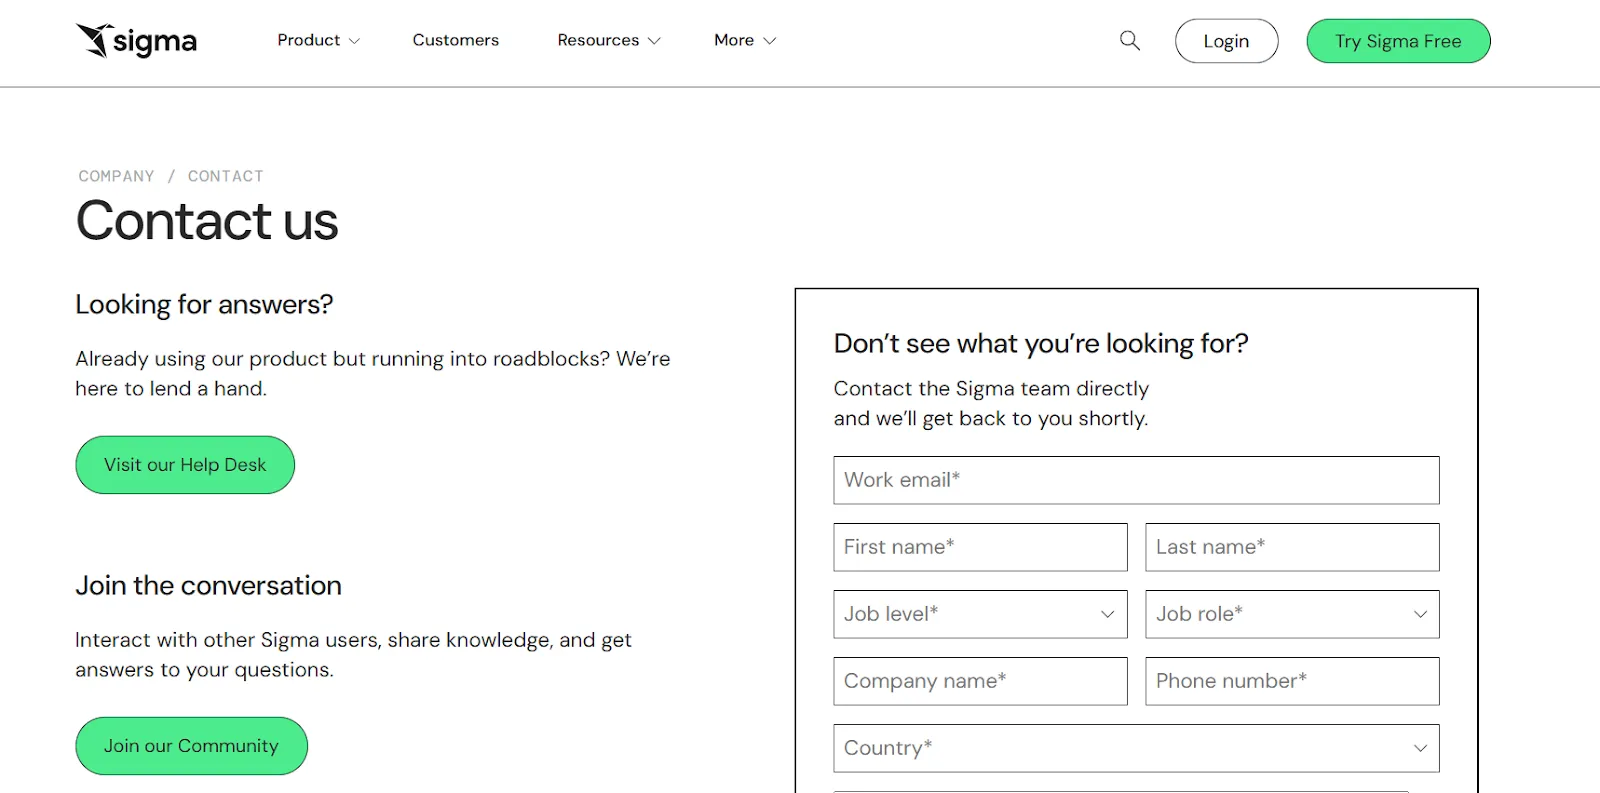
Sigma doesn't publish pricing.
The pricing page carries a contact form where a rate card would be, and every quote gets scoped by sales.
A free trial is available without talking to anyone first.
Sigma pros and cons
✅ Writeback keeps budgets and actuals under the same governance as everything else.
✅ People who already know Excel are productive on day one.
✅ Live queries, so what people read is current.
✅ Every entered value lands in the warehouse with an edit log behind it.
❌ Nothing published on price.
#7: Qlik Cloud
Best for: Organizations that want everybody reading analytics without a seat count deciding the bill.
Similar to: Domo, Microsoft Power BI.
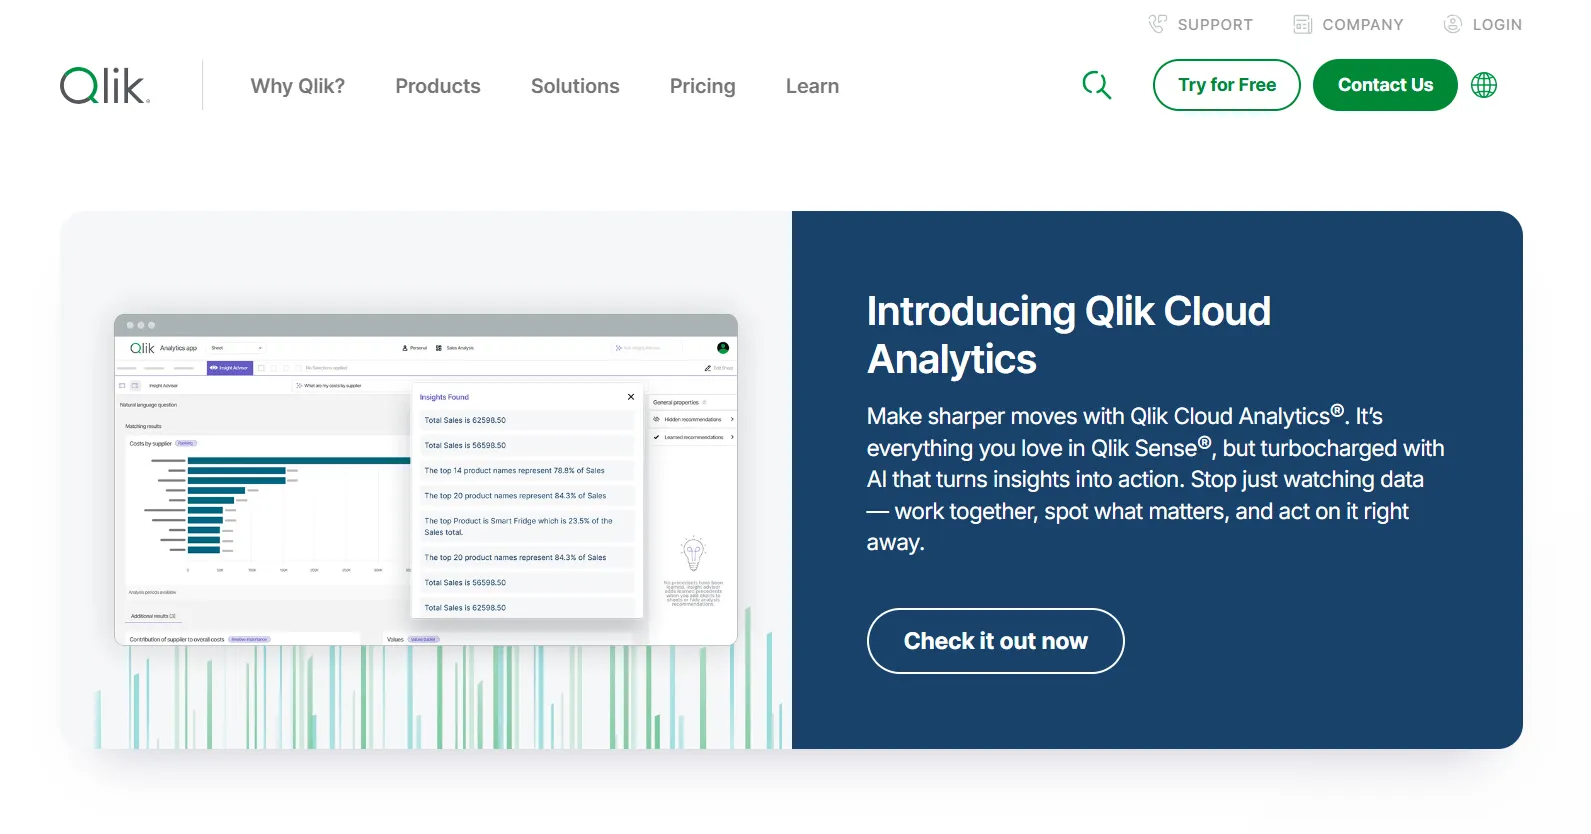
Qlik Cloud is the SaaS edition of Qlik's analytics platform, and above its entry tier the meter counts gigabytes of data loaded while headcount stops mattering.
That structure suits companies rolling analytics out widely across a workforce that mostly reads.
Qlik Cloud's top features
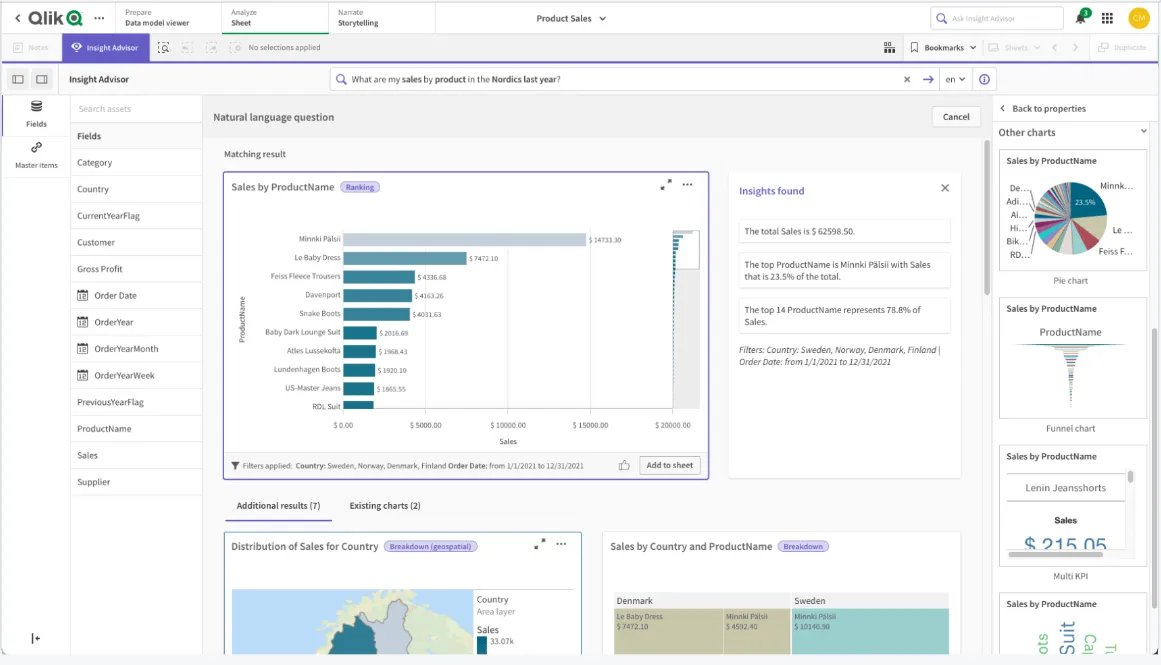
- Associative engine: Choosing a value reshapes every other chart on the page at once, marking what connects to that choice and what falls outside it, without a predefined query path.
- Qlik Answers: An agentic assistant taking natural-language questions, reaching into unstructured documents alongside modeled data.
- Qlik Predict: AutoML-driven forecasting, switched on from Premium upward.
- Data lineage connectors: Available on Premium, for tracing a reported figure back to where it came from.
Qlik Cloud pricing
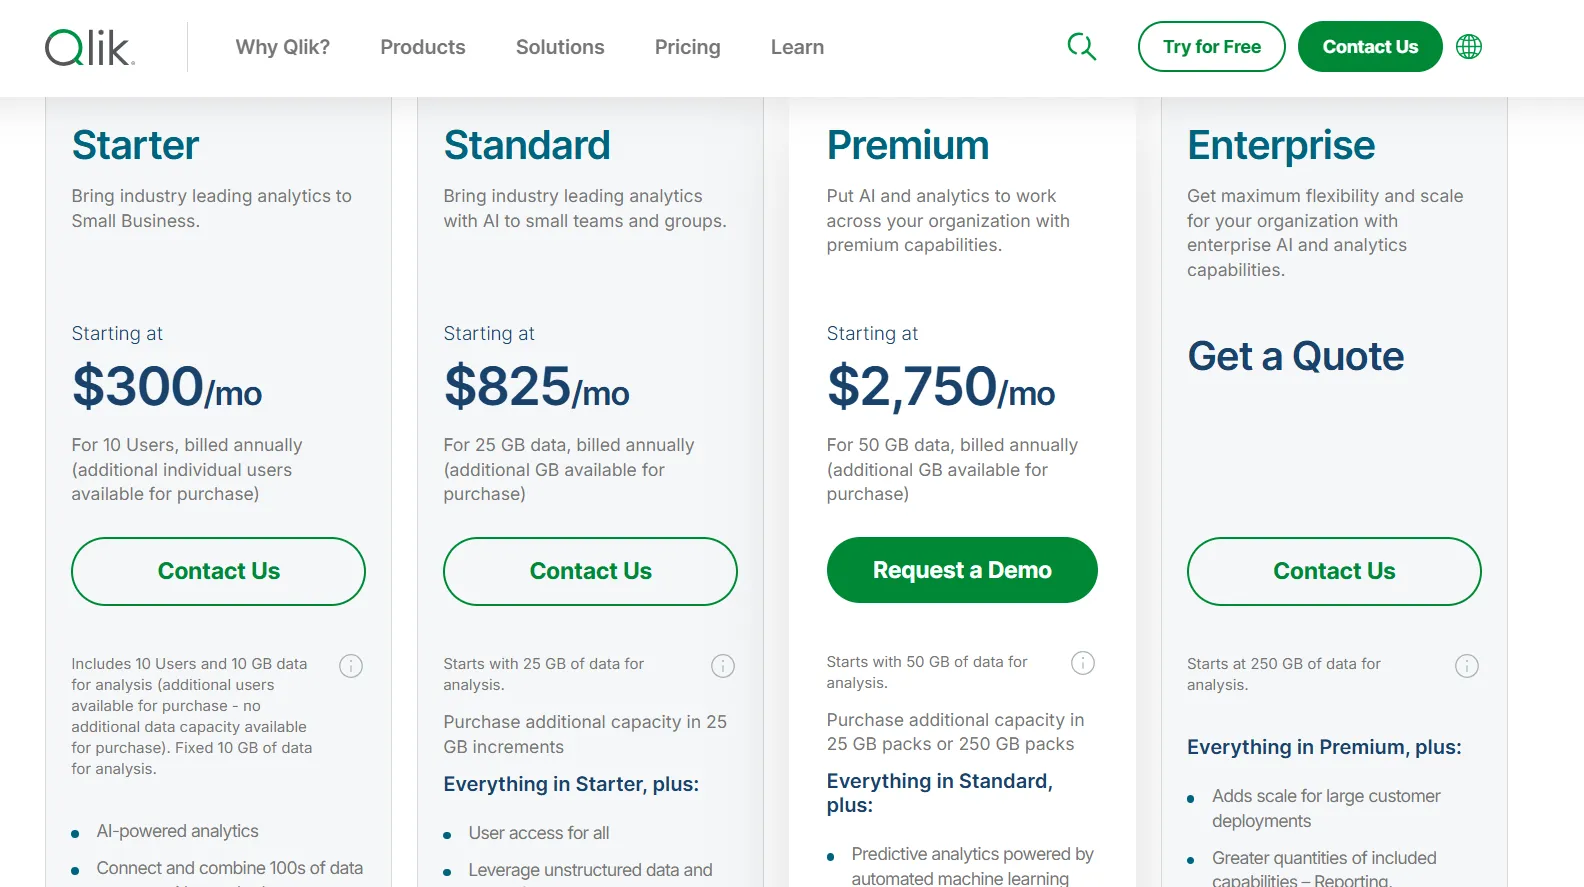
Qlik Cloud Analytics runs four tiers, all billed annually, and only the entry tier counts users. Above it, "Data for Analysis" is the value meter.
- Starter: $300 a month. Ten users, 10 GB of data for analysis, and that gigabyte figure is fixed.
- Standard: $825 a month. Starts at 25 GB and drops the user ceiling altogether.
- Premium: $2,750 a month. Starts at 50 GB, and predictive analytics plus extra generative AI capacity switch on here.
- Enterprise: quoted by sales. Starts at 250 GB, with higher ceilings on reporting, automations, and model sizes.
Qlik Cloud pros and cons
✅ Unlimited users above the Starter tier, which is unusual at this price point.
✅ The associative engine suits exploring when the question isn't fully formed yet.
✅ Lineage connectors trace a figure back to its origin.
❌ One user on G2 mentions that sometimes there are loading issues, especially when business intelligence is running updates.
#8: Zoho Analytics
Best for: Teams already inside the Zoho suite who want reporting that connects to their business apps with little technical work.
Similar to: Domo, Microsoft Power BI.
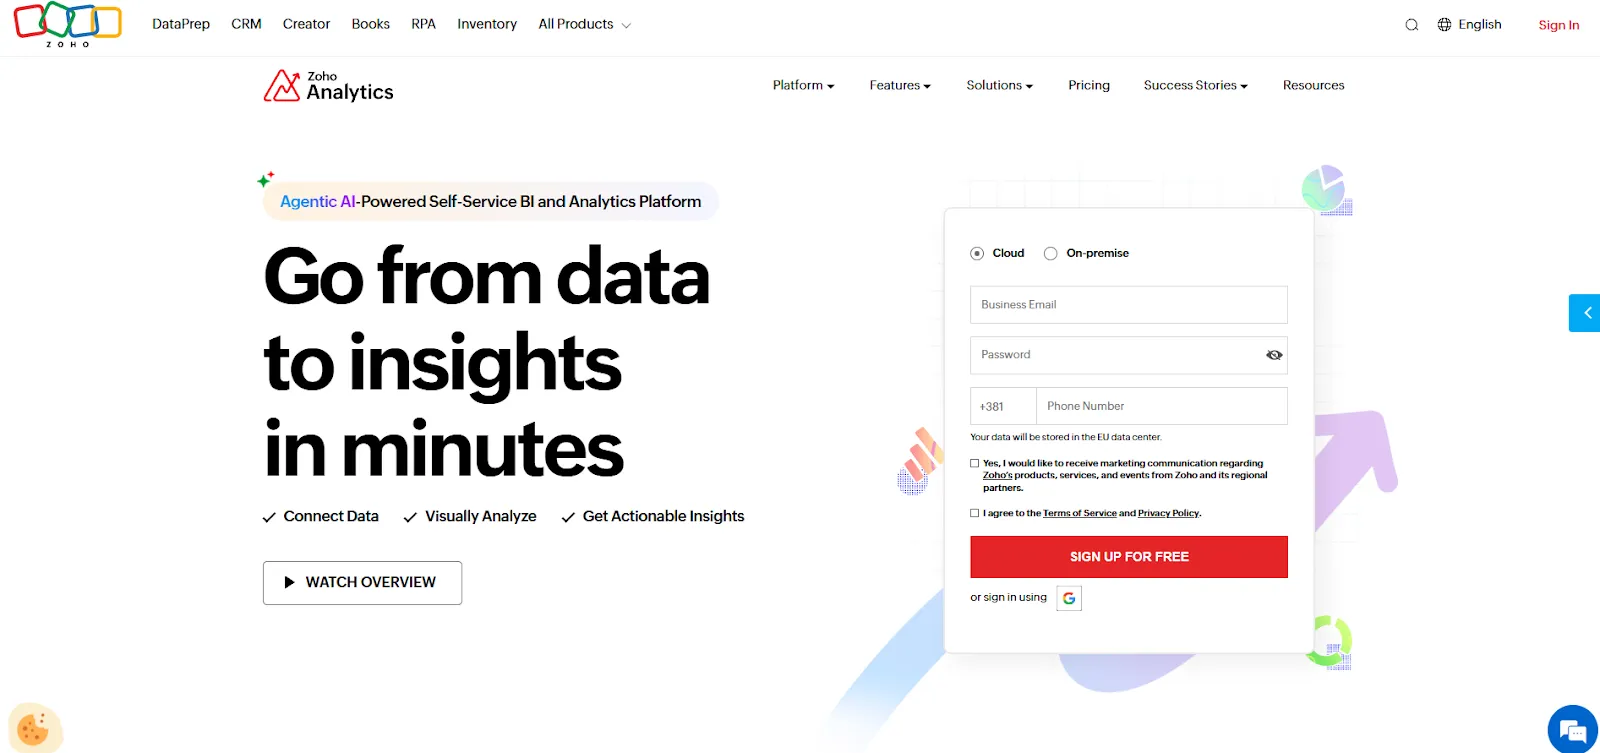
Built on the Zoho platform, Zoho Analytics handles data integration, preparation, dashboards, and predictive work in one place.
It targets small and mid-sized teams wanting a working dashboard this week, with no appetite for a modeling project.
Zoho Analytics' top features
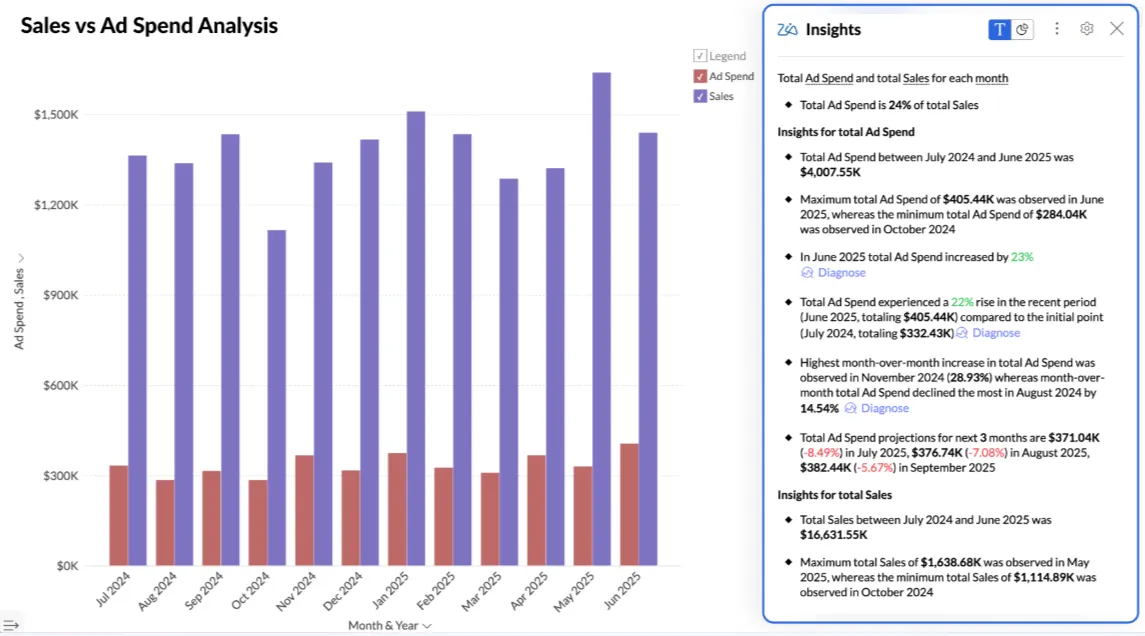
- Ask Zia: Zoho's conversational AI agent builds reports, returns insights, makes predictions, and lets data engineers construct pipelines by describing them.
- Data preparation: More than 250 no-code transformations clean, enrich, and model data, with business metrics managed centrally.
- Connector breadth: Business app connectors span sales, marketing, finance, ecommerce, help desk, and HR, each arriving with pre-built reports.
- MCP server: AI models, agents, and MCP clients interact with Zoho Analytics tools directly for analysis and actions.
Zoho Analytics pricing
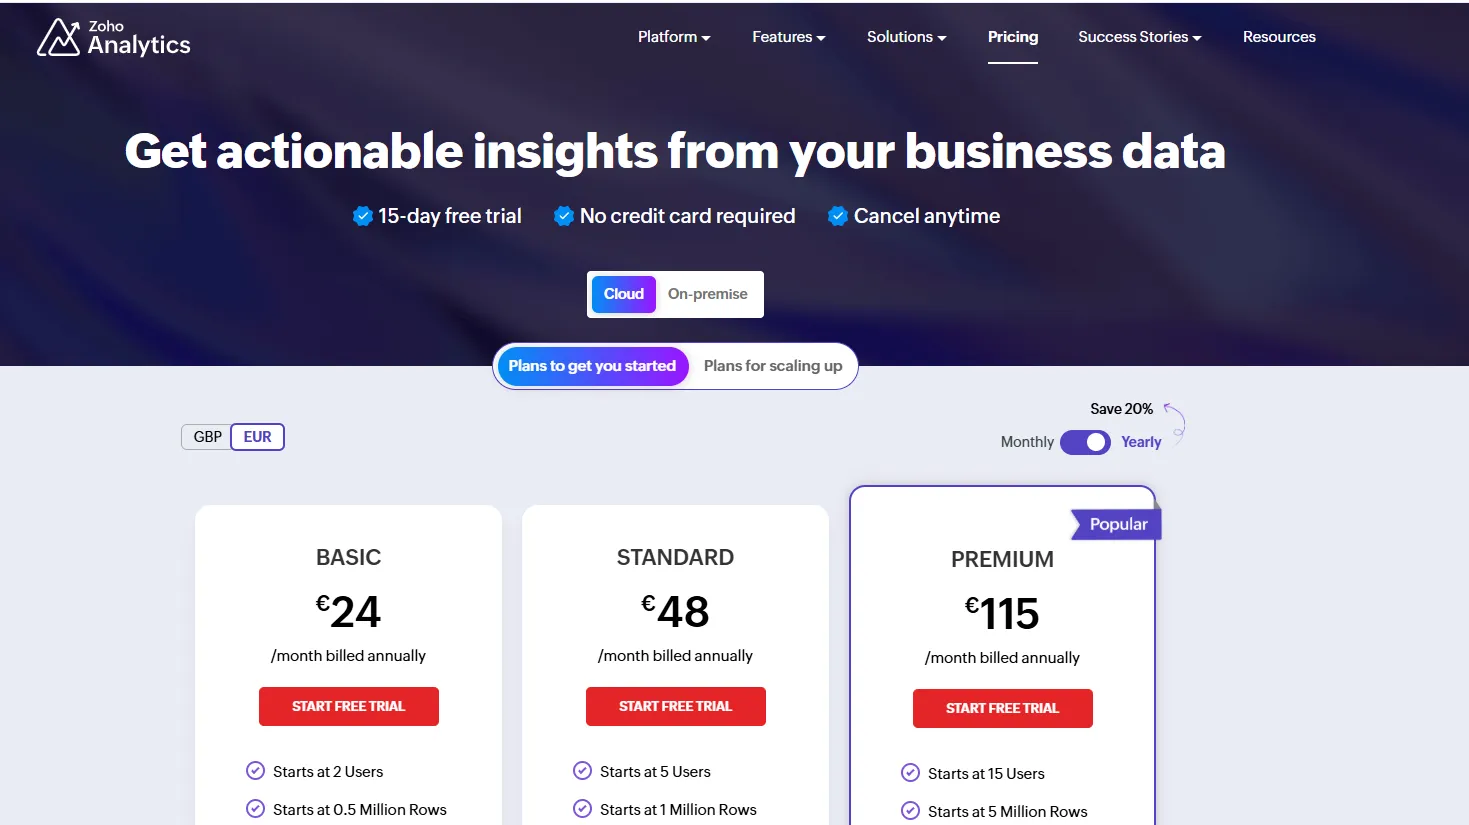
Zoho Analytics sells four paid cloud plans plus a permanently free one, and each plan caps both users and stored rows. Yearly billing takes 20% off, and the trial runs 15 days with no card.
- Free: $0, permanently. Two users, 10,000 rows, five workspaces, and unlimited reports and dashboards.
- Basic: two users and 0.5 million rows. Two business app connectors and a daily sync.
- Standard: from $60 a month. Five users, 1 million rows, and the full connector library opens up.
- Premium: from $145 a month. Fifteen users, 5 million rows, and the tier where Ask Zia, diagnostic insights, and smart recommendations switch on.
- Enterprise: from $575 a month. Fifty users, 50 million rows, plus governance controls, activity logs, and AI Studio.
Zoho Analytics pros and cons
✅ The price attaches to the organization, so it reads very differently from the per-user platforms here.
✅ Connectors to Zoho apps and popular third-party tools make setup fast.
✅ A free plan that stays free.
❌ The user interface is not top-notch, according to a G2 review.
#9: Holistics
Best for: Data teams that want their semantic layer version-controlled in Git and their business users self-serving on top of it.
Similar to: Looker, Sigma.
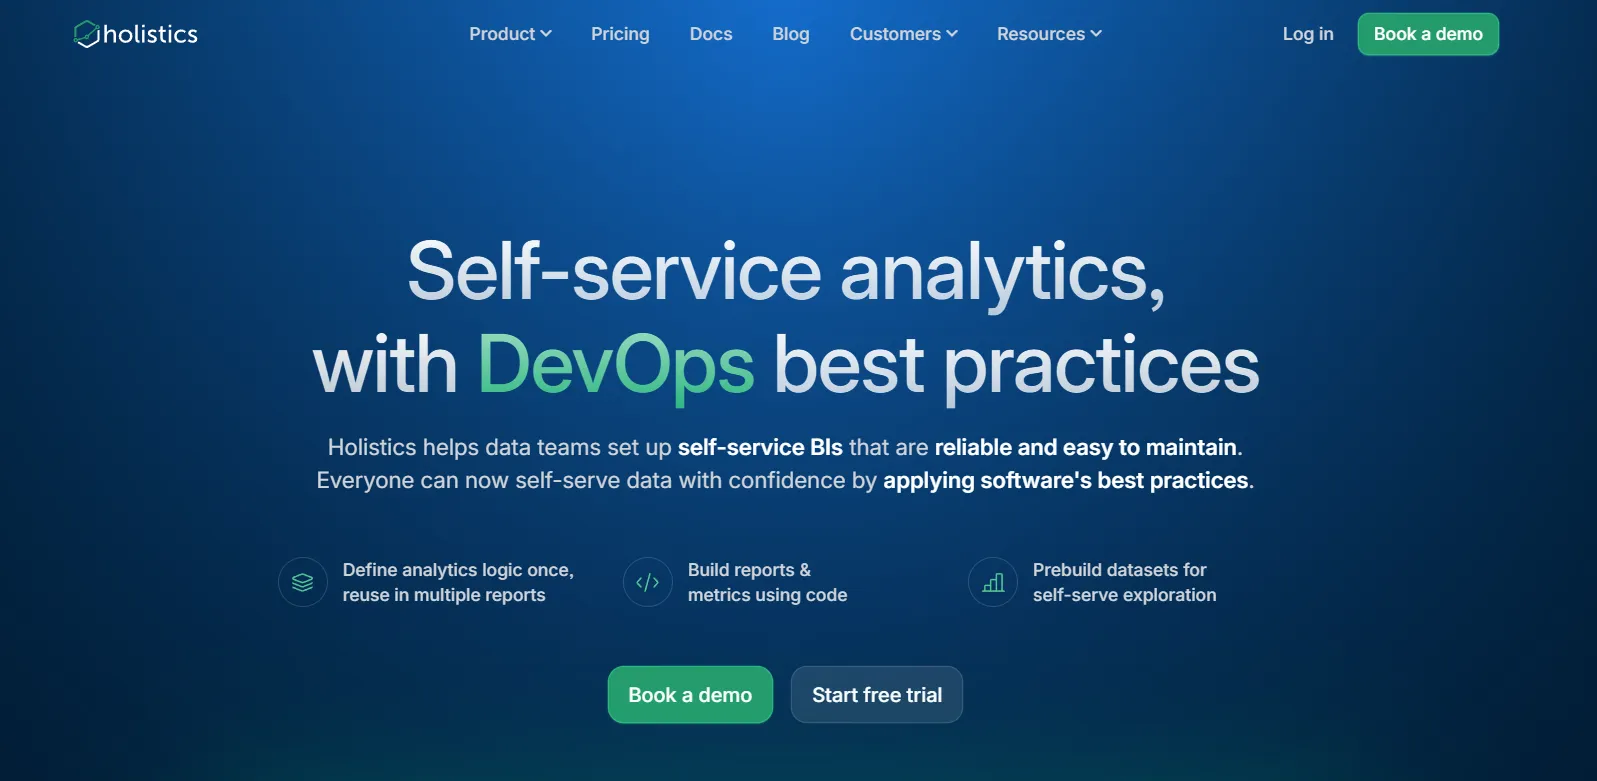
Holistics, a Singapore-based platform founded in 2015, defines datasets, metrics, and business logic as code in its own markup language, then hands non-technical users a drag-and-drop surface built on those definitions.
It's built for teams wanting software engineering discipline in BI without hiring a LookML specialist.
Holistics' top features
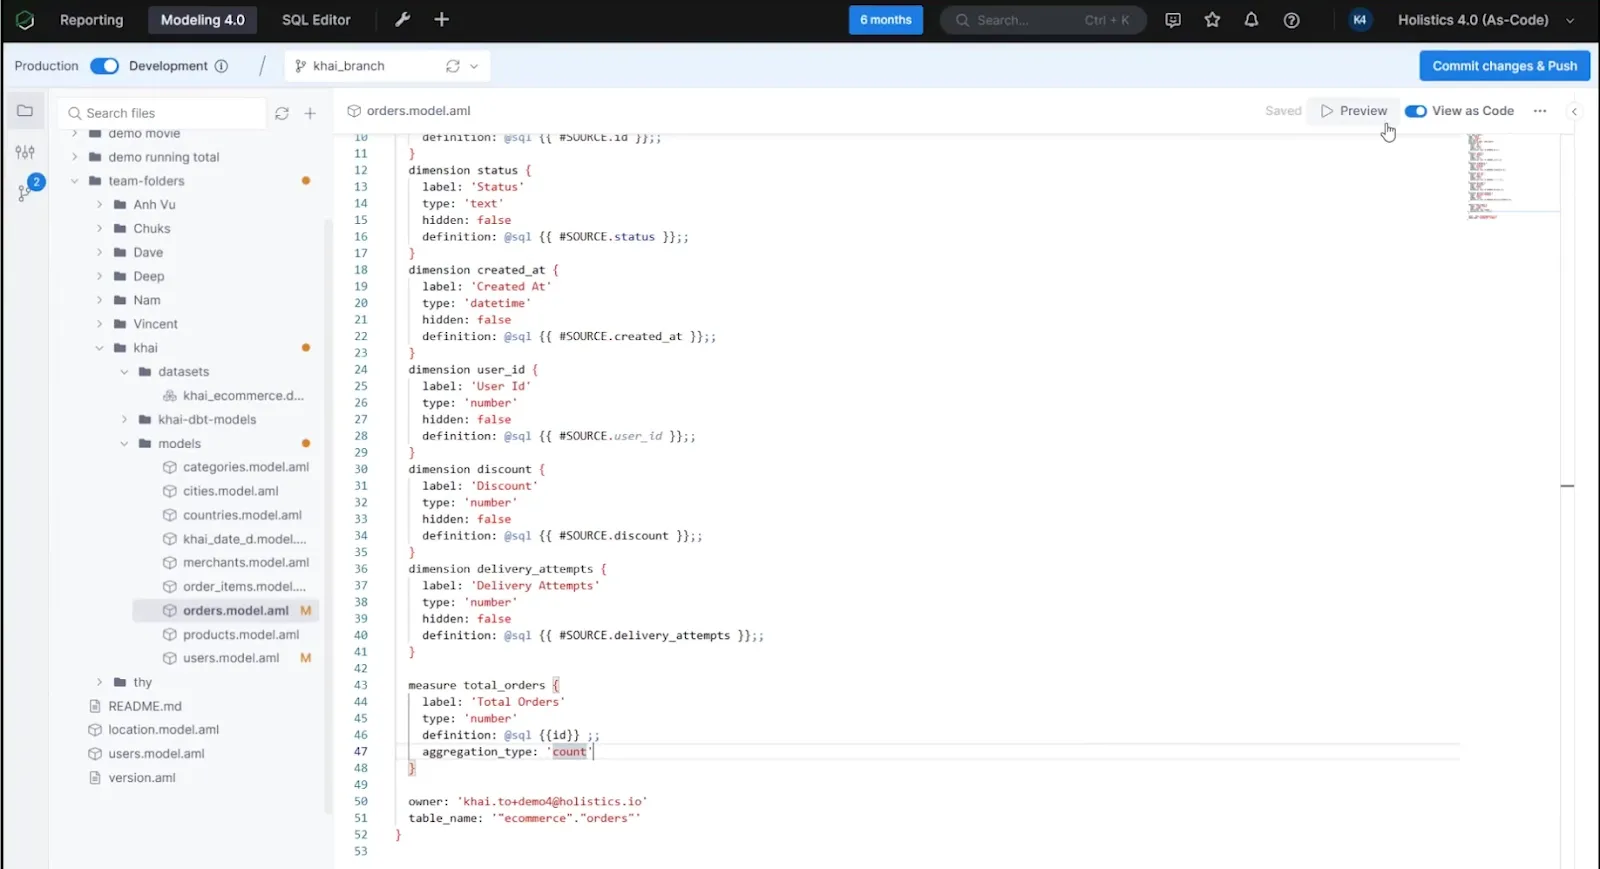
- Analytics as code: The model gets written in Holistics' declarative language or SQL, then committed to Git with branching and code review behind it.
- Centralized modeling: Metrics, joins, and derived tables get defined once and enforced across every dashboard and report.
- Self-service exploration: Non-technical teams build their own reports through a visual interface using pre-defined metrics, and the data team stops being in the middle of every request.
- Data delivery: Reports go out to email, Slack, and other destinations on a schedule, included from the entry plan.
Holistics pricing
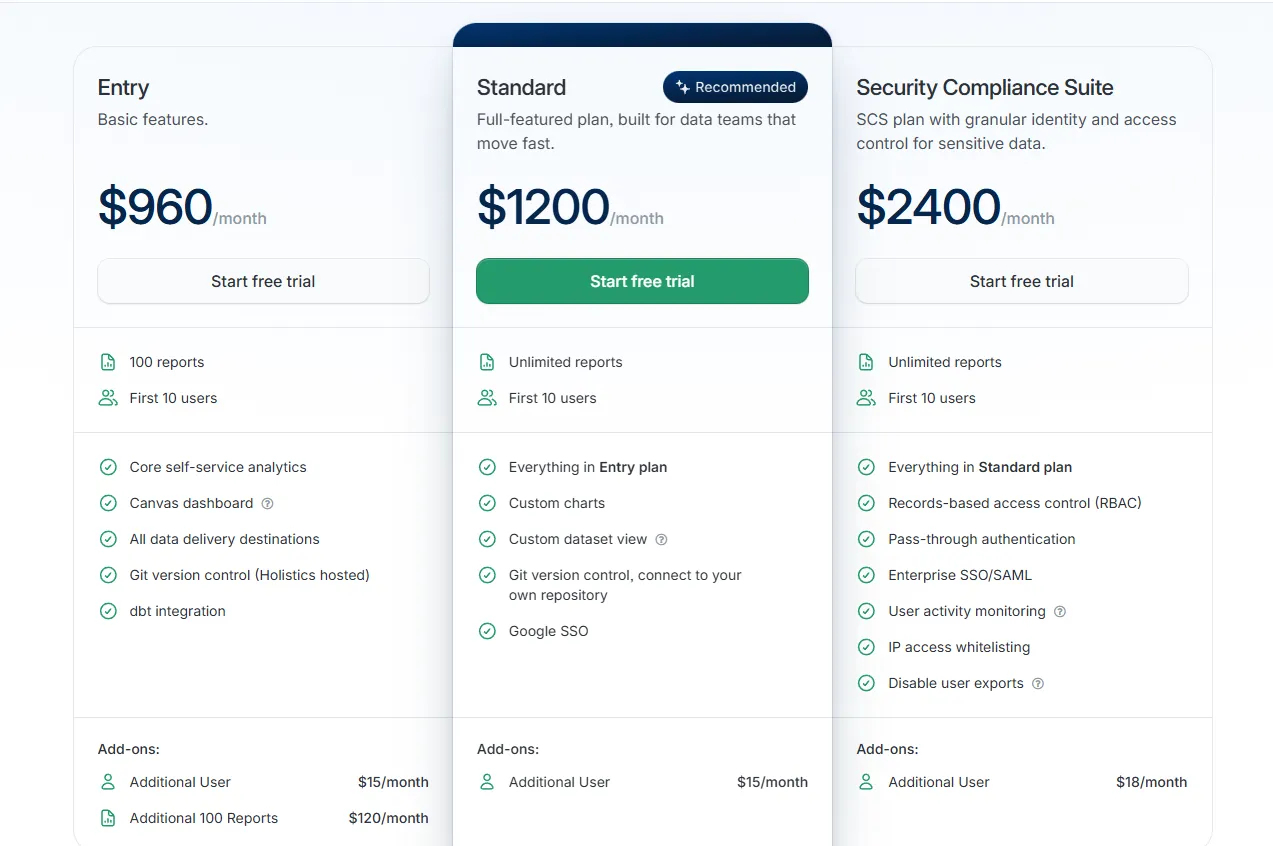
Holistics prices on reports and users, holds its security features in a separate suite, and publishes both monthly and annual rates. Paying annually saves roughly 17%.
- Entry: $960 a month, or $800 if you pay annually. One hundred reports, the first 10 users, Holistics-hosted Git version control, and dbt integration.
- Standard: $1,200 a month, $1,000 annually. Reports go unlimited, and you add custom charts, custom dataset views, your own Git repository, and Google SSO.
- Security Compliance Suite: $2,400 a month, $2,000 annually. Role-based access control, enterprise SSO and SAML, SCIM provisioning, user activity monitoring, and IP whitelisting.
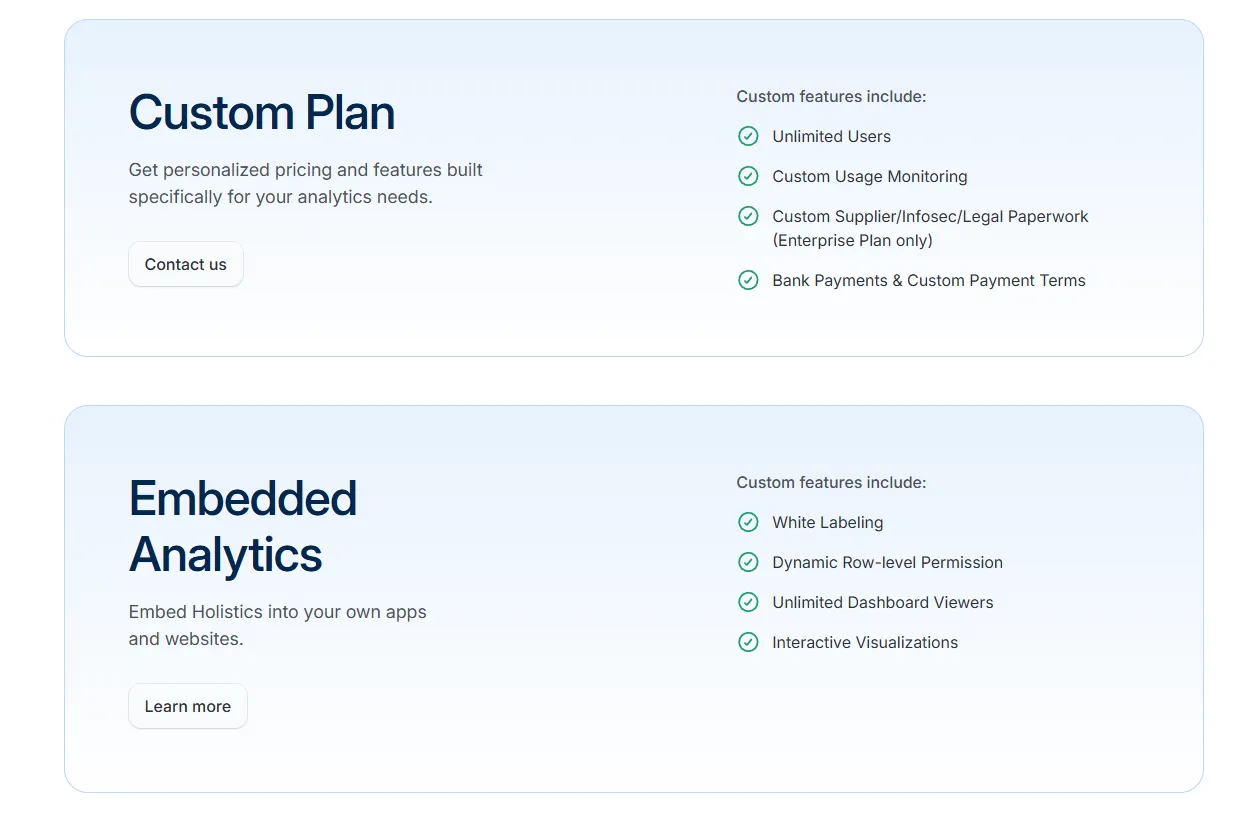
- Custom and embedded plans are quoted separately: Extra users cost $15 a month, or $12.50 annually.
Holistics pros and cons
✅ Analytics as code with Git version control, without the LookML hiring problem.
✅ Both monthly and annual rates are published, tier by tier.
✅ Downgrades get pro-rated and credited back to you.
❌ Starts from $960/month, which can be expensive for SMEs.
#10: Metabase Cloud
Best for: Startups and product teams that want the open-source Metabase experience without running the servers.
Similar to: Holistics, Zoho Analytics.
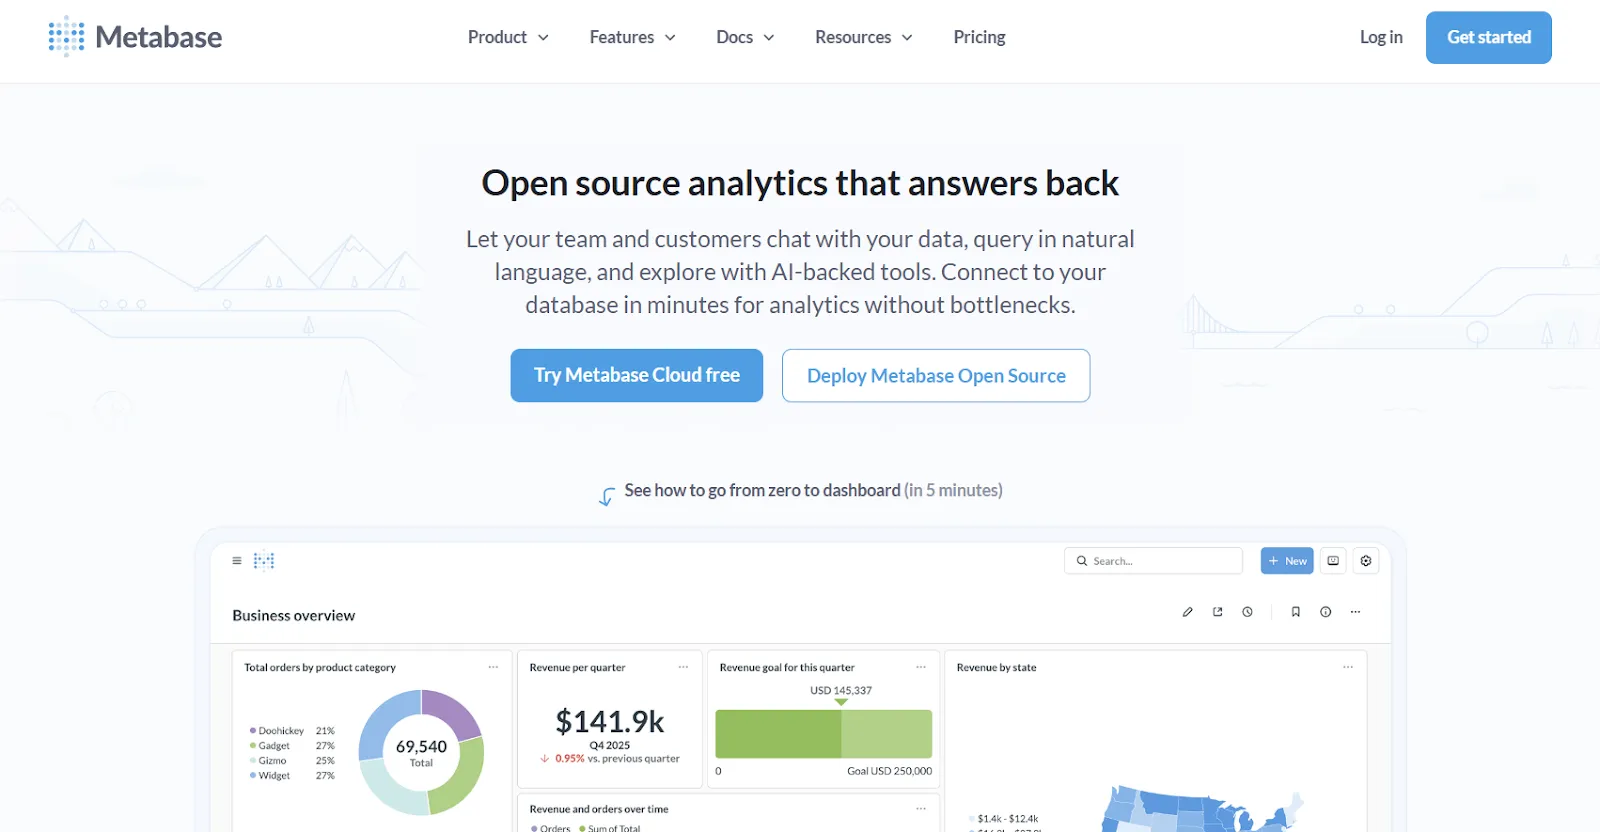
Metabase Cloud takes the open-source Metabase project and operates it for you, patching and monitoring the instance, with a choice of hosting region.
It suits teams wanting dashboards working this week without staffing a BI platform.
Metabase Cloud's top features
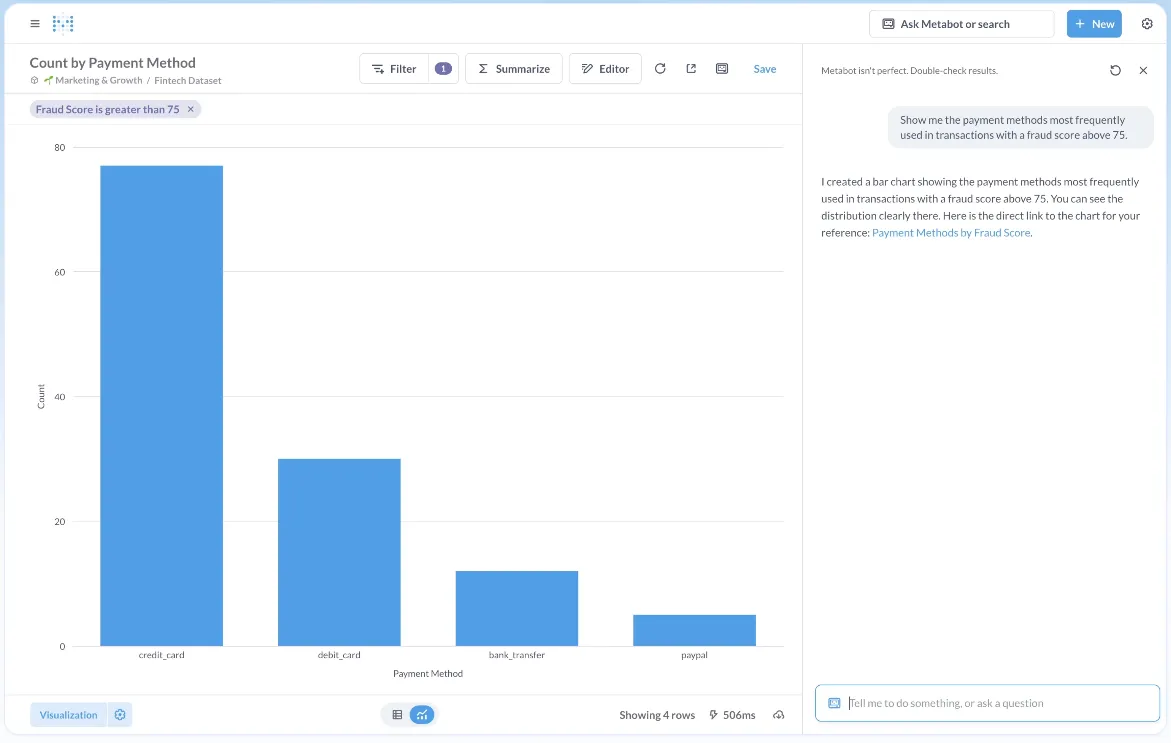
- Visual query builder: Non-technical users assemble queries step by step through a no-code interface, while analysts drop into raw SQL when they need it.
- Data Studio: Metabase's semantic layer workbench, where teams curate trusted tables, define reusable metrics and segments, and keep dependencies visible.
- Metabot AI: The AI analyst takes natural-language questions and reaches every edition, the free open-source one included, drawing on whatever's defined in Data Studio.
- Bring your own model: Anthropic, OpenAI, AWS Bedrock, and Azure OpenAI can all be wired in, keeping prompts inside infrastructure you control, with per-group usage limits and a total monthly cap.
Metabase Cloud pricing
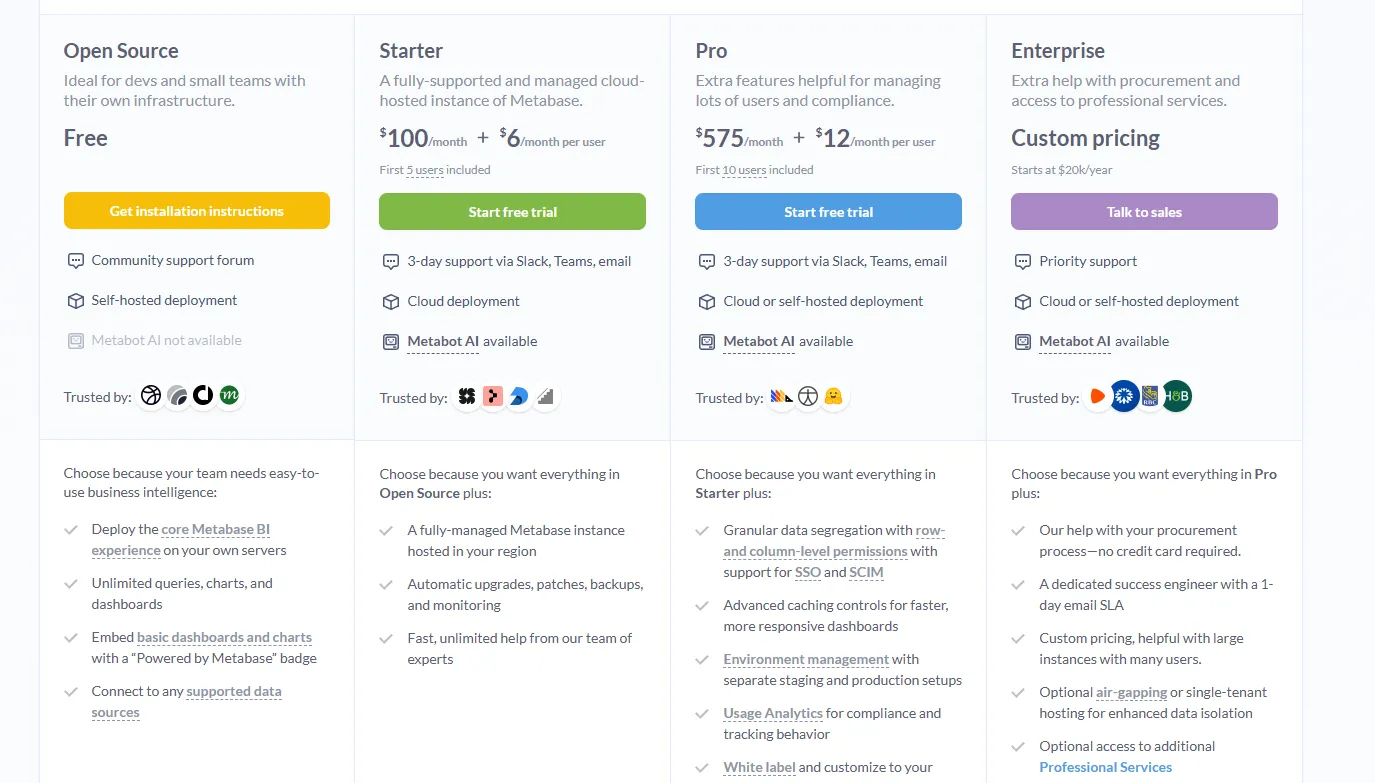
Metabase offers two pricing options depending on how you use the product: internal business intelligence or customer-facing embedded analytics.
- Business Intelligence:
- Open Source (Self-hosted): Free, self-hosted deployment, includes unlimited queries, charts, and dashboards, connects to all supported data sources, basic embedding with “Powered by Metabase” branding, community support only.
- Starter (Cloud-hosted): $100/month + $6/user/month, first 5 users included, includes everything in Open Source, plus option to include Metabot AI (charged extra), automatic upgrades, backups, and monitoring, support via Slack, Teams, and email (3-day SLA).
- Pro: $575/month + $12/user/month, first 10 users included, cloud or self-hosted deployment, includes everything in Starter, plus row- and column-level permissions, SSO and SCIM support, advanced caching and performance controls, staging + production environments, usage analytics and audit visibility, white-labeling, and embedded analytics capabilities.
- Enterprise: Custom pricing (starts at $20k/year), includes everything in Pro, plus priority support, dedicated success engineer (1-day email SLA), optional single-tenant or air-gapped deployment, and optional professional services.
- Embedded Analytics pricing:
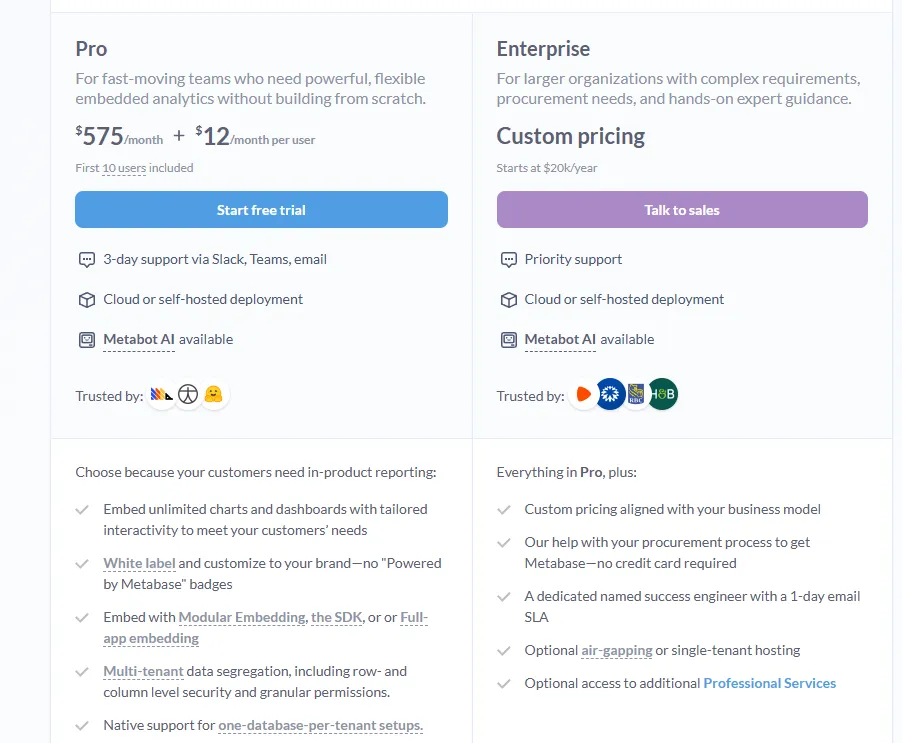
- Pro: $575/month + $12/user/month, first 10 users included, includes unlimited embedded dashboards and charts, full white-labeling, modular embedding, SDK, or full-app embedding, multi-tenant security (row- and column-level), one-database-per-tenant support, staging + production environments, usage analytics, internal BI for your team, and option to include Metabot AI (charged extra).
- Enterprise: Custom pricing (starts at $20k/year), includes everything in Pro, plus a dedicated success engineer, priority support, optional single-tenant or air-gapped hosting, and optional professional services.
Metabase Cloud pros and cons
✅ AI features reach every edition, including the free one, which almost nobody else on this list does.
✅ Bringing your own model keeps prompts inside infrastructure you already trust.
✅ A genuinely low entry point at $100 a month for five people.
❌ A user on G2 believes that Metabase could benefit from having an AI assistant that understands the databases and assists in building queries
Get started with Dot for free
So those are the 10 cloud analytics platforms worth shortlisting in 2026, spanning hosted suites most companies already own and warehouse-native tools that never copy a row.
Plenty of them will serve a data team well, and some do things Dot has deliberately chosen not to.
Dot comes at it from the opposite end. The analysis turns up already written, in whatever channel your team already works in, built on the models your data team already maintains.
What your team gets:
- Answers landing in the same Slack channel, Teams chat, inbox, or browser tab where the question started.
- Deep Analysis picking up a "why did this move" question and running a real investigation before it reports back.
- Dashboards you can publish, certify by name, and let archive themselves when nobody opens them.
- Every figure backed by a lineage map and an audit-stamped query, so the number holds up when somebody checks it.
- Definitions held in one place by the Context Agent, with edits reviewed by an admin and testable on a branch first.
- Connections across Snowflake, BigQuery, Redshift, Databricks, Postgres, ClickHouse, dbt, Looker, and Power BI, all under SOC 2 Type II, and no tier caps how many people can use it.
➡️ Get started for free with Dot's free plan, or schedule a demo to see how it works with your data.
⚠️ Disclaimer: This article was last updated on August 26 2026. If you spot any inaccuracies, please do contact us, and we'll fact-check it.
Theo Tortorici
Theo writes about AI-powered analytics, data tools, and the future of business intelligence at Dot.