
10 Best Zoho Analytics Alternatives & Competitors In 2026
In this article, I'll walk through the 10 best Zoho Analytics alternatives and competitors in 2026 across three groups: AI-native analytics platforms, warehouse-native self-service BI, and enterprise BI platforms to fit your use case.
TL;DR
- Dot is the best Zoho Analytics alternative in 2026 for lean data and operations teams that would rather have the analysis delivered to them than maintain another set of dashboards, thanks to our Slack and Teams answers, self-building executive reports, a Context Agent for shared metric definitions, and an audit trail on every number.
- If you want AI-first analytics with strong natural language search and broad workflow coverage, ThoughtSpot and Domo are mature platforms with deep feature sets.
- For self-service analytics that runs straight on your warehouse, Sigma, Omni, Looker, and Metabase give business and data teams governed access to live data without piling on modeling work.
- For dashboarding at enterprise scale, Microsoft Power BI, Tableau, and Qlik Sense are the names most large organizations already run on.
What are the best Zoho Analytics alternatives in 2026?
The best Zoho Analytics alternatives are Dot, ThoughtSpot, and Domo.
Here's the full shortlist, sorted by the kind of job each tool is built for:
Tool | Use case | Price |
Dot | An AI data analyst that returns written analysis, recommendations, and scheduled executive reports. No dashboard-building. | Free plan; paid from $180/month. |
ThoughtSpot | Agentic analytics with natural-language search for fast, self-service exploration. | From $25/user/month (annual). |
Domo | All-in-one cloud BI spanning ingestion, dashboards, automation, and AI actions. | Custom pricing (30-day free trial). |
Sigma | Spreadsheet-style analysis directly on live warehouse data, popular with finance and ops. | Custom pricing. |
Omni | A flexible semantic layer with self-service exploration on warehouse data. | Custom pricing (free trial). |
Looker | Governed, warehouse-native BI with a centralized LookML modeling layer. | Custom pricing. |
Metabase | Open-source BI for quick dashboards and lightweight self-service. | Free (open source); Cloud from $100/month. |
Microsoft Power BI | Standardized reporting and self-service analytics inside the Microsoft stack. | Free plan; Pro from $14/user/month. |
Tableau | Deep visual analytics and data storytelling for large, complex datasets. | From $15/creator/month. |
Qlik Sense | An associative engine for exploring data relationships in any direction. | From $300/month (Starter). |
What are the best AI-native analytics platforms that hand you the answer and not the chart?
The tools in this first group all start from the same frustration: too much of the work between a question and an answer is still done by hand:
#1: Dot
Dot is the best Zoho Analytics alternative in 2026 for data and operations teams that want their analytics tool to do the analysis itself right where they work: in Slack and/or Microsoft Teams.
Many BI suites hand you a finished visualization and leave the interpretation to you.
You ask a question, a chart appears, and then you sit with it and work out what it means.
This is normal (and expected) for data analysts, however, executives can find these platforms hard to use, and analysts can spend hours on adhoc requests deciphering the dashboards.
We built Dot on the reverse premise: a question shouldn't end at a chart. It should end with a written explanation, the math that supports it, and a clear read on what to do next.
Here are some of the key features that make Dot a powerful AI-native Zoho Analytics alternative:
Ask a question in Slack and get the reasoning back
Take a question that comes up in most companies every quarter: ‘’Why did net revenue retention slip for our mid-market accounts this quarter?’’
Normally that lands in the analyst queue, where someone opens the warehouse, writes the SQL to tie expansion and contraction events back to account segments, checks it against finance's ARR numbers, and gets back to you once their other work clears (so, optimistically, Thursday).
With Dot, the same question goes into Slack and a structured answer comes back in minutes.
It walks through which account cohorts contracted and which segment dragged the number down.
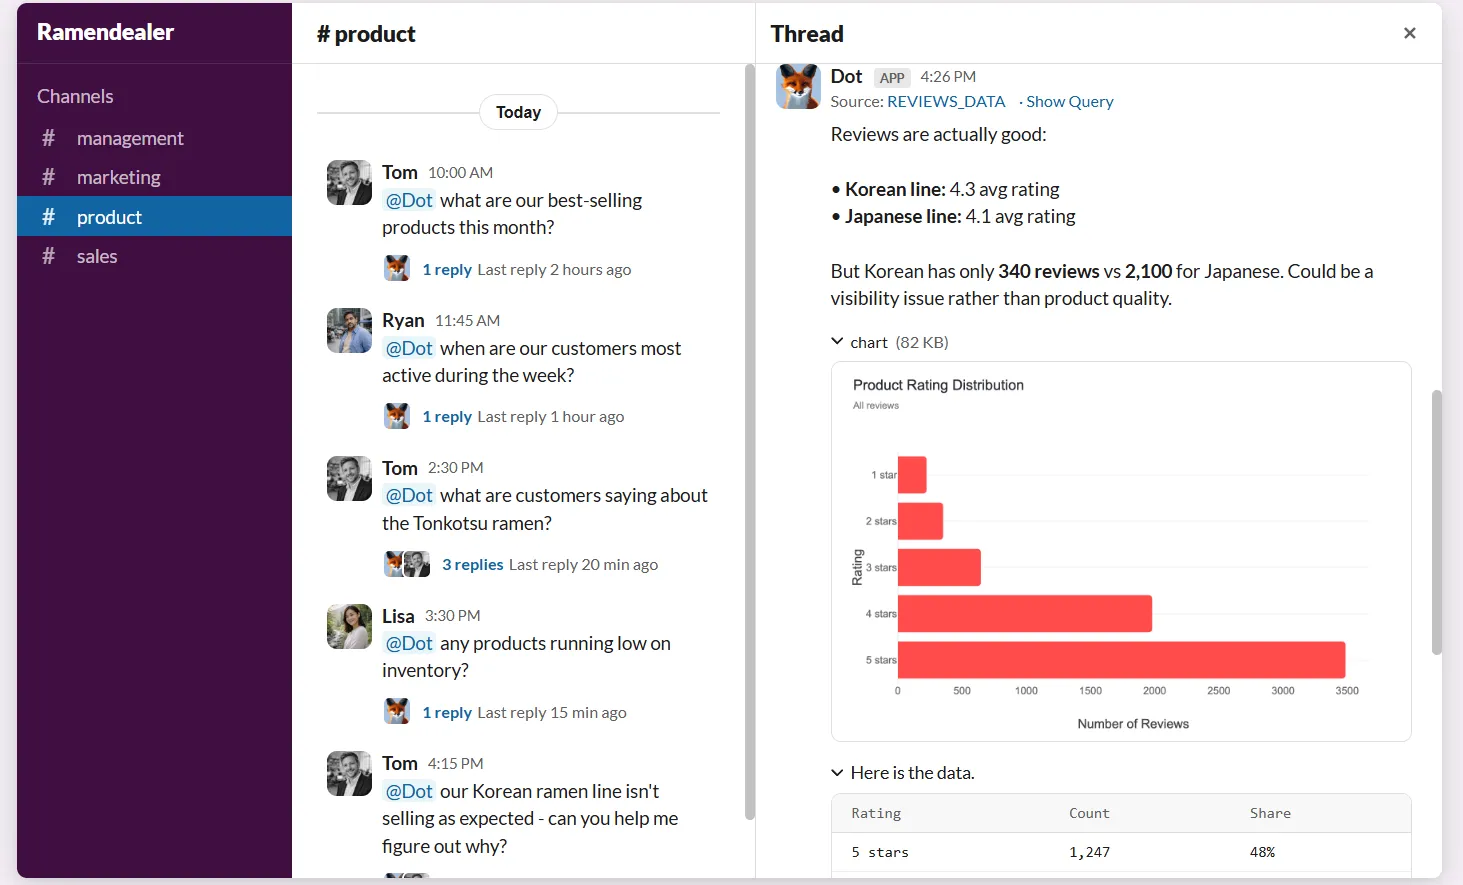
The chart is there if it sharpens the explanation, not as the finish line.
Our customers find it useful because it absorbs a large volume of ad-hoc requests that would normally interrupt planned data analytics work.
Recurring reports that assemble themselves
Recurring reporting is the quiet overhead almost every data team carries.
Weekly business reviews, monthly board decks, quarterly readouts, the surprise ad-hoc ask from a VP at 4 PM on a Friday, all roughly the same shape each time, all eating hours of someone's week to assemble and annotate.
Dot turns that work into documents that produce themselves. You define the schedule once and aim it at the warehouse.
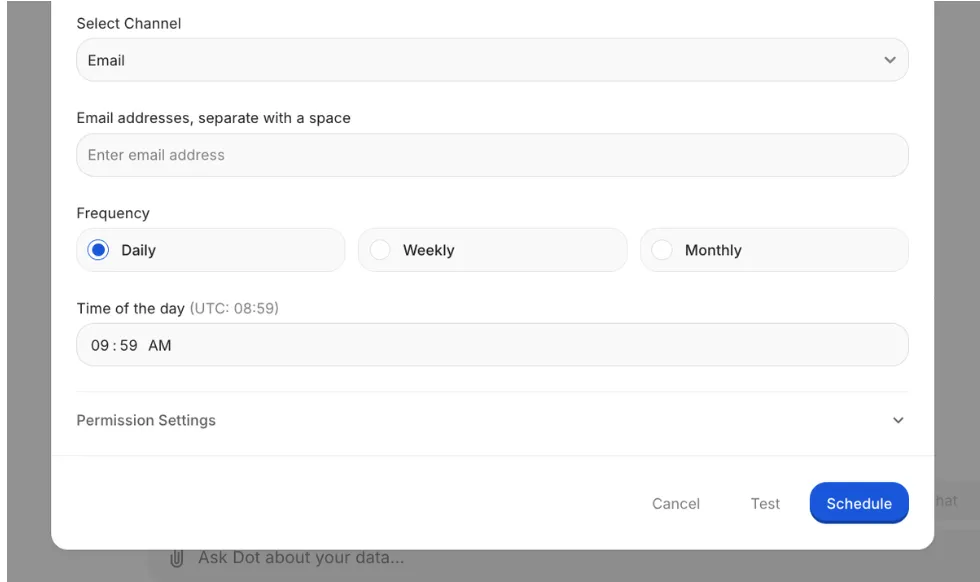
From there, each run pulls live data, runs the analysis, and delivers an executive-ready PowerPoint to the people who need it, with period-over-period figures, anomaly callouts, and a written narrative explaining the movement.
Shared definitions through the Context Agent
Most companies eventually run into the same friction.
"Active customer" is defined one way by the product team, another by marketing when it reports on the funnel, and a third by finance when the board asks.
Each definition has a sensible reason behind it, and none is strictly wrong, which is exactly why reconciling them quietly costs hours before the numbers go anywhere important.
Dot's Context Agent is built to settle exactly this.
It reads your dbt models, your data catalog, Confluence, and any documentation it can reach, then assembles one definition layer that every Dot answer pulls from.
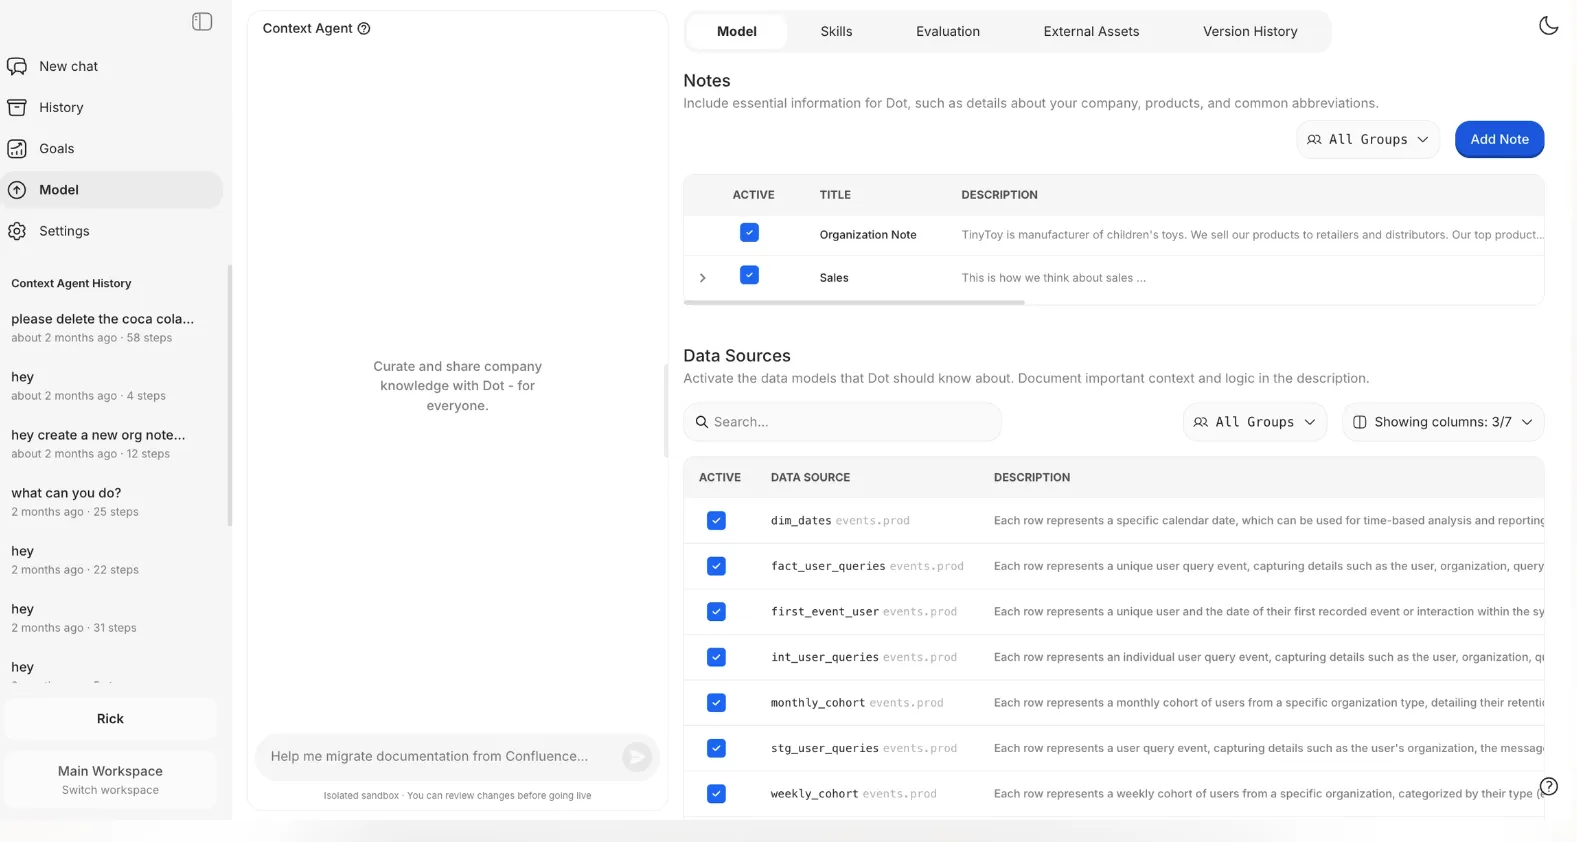
If a metric has no documentation, the agent writes it. If two systems disagree, it flags the conflict and won't quietly pick a winner for you.
The payoff is that the same question asked by product and by finance returns the same number.
A traceable audit trail on every output
Every Dot output carries footnotes linking to the exact SQL that ran, any Python in the calculation, and the specific tables and fields behind it.
You can click through, read the query, and check the math for yourself.
For a finance lead defending a figure to the audit committee, or an analyst whose name is attached to the report, that traceability is what turns the output from something trusted on faith into something you can stand behind.
Dot reads from Snowflake, BigQuery, Redshift, Databricks, Postgres, MySQL, and SQL Server, and it reuses the logic you already built in dbt, Looker, Power BI models, and Cube, so nobody has to rebuild it.
Answers and reports land in Slack, Microsoft Teams, email, or the Dot web app, and it runs alongside whatever dashboards you already keep in Tableau, Metabase, or Looker.
What makes Dot different from Zoho Analytics?
The answer isn't a feature checklist; it's a difference in what the two tools are built to produce.
Zoho Analytics is a full self-service BI suite.
You connect or import data, prep it with its no-code transforms, model your metrics, and build dashboards across 50 or more visualization types, with Ask Zia and predictive AI layered on to help you query and forecast.
It honestly offers a lot of capability for the price, and teams inside the Zoho ecosystem get real mileage out of it.
Dot starts from a different output.
Rather than producing a dashboard for you to read, it returns a written analysis with the supporting math and a recommendation, delivered into the channel where the decision is already being discussed.
There's also a difference in where the data lives.
- Zoho Analytics typically works by importing or syncing data into its own engine, though it can live-connect to some databases and warehouses too.
- Dot stays warehouse-native by default, querying Snowflake or BigQuery in place and reusing the dbt or Looker models your team has already built, so there's nothing to migrate and no second copy of the metrics to keep in sync.
I also understand that neither approach is the right one for everybody.
If your priority is having the analysis done and explained for you, with a single definition layer and a query you can audit, that's the lane Dot was built for.
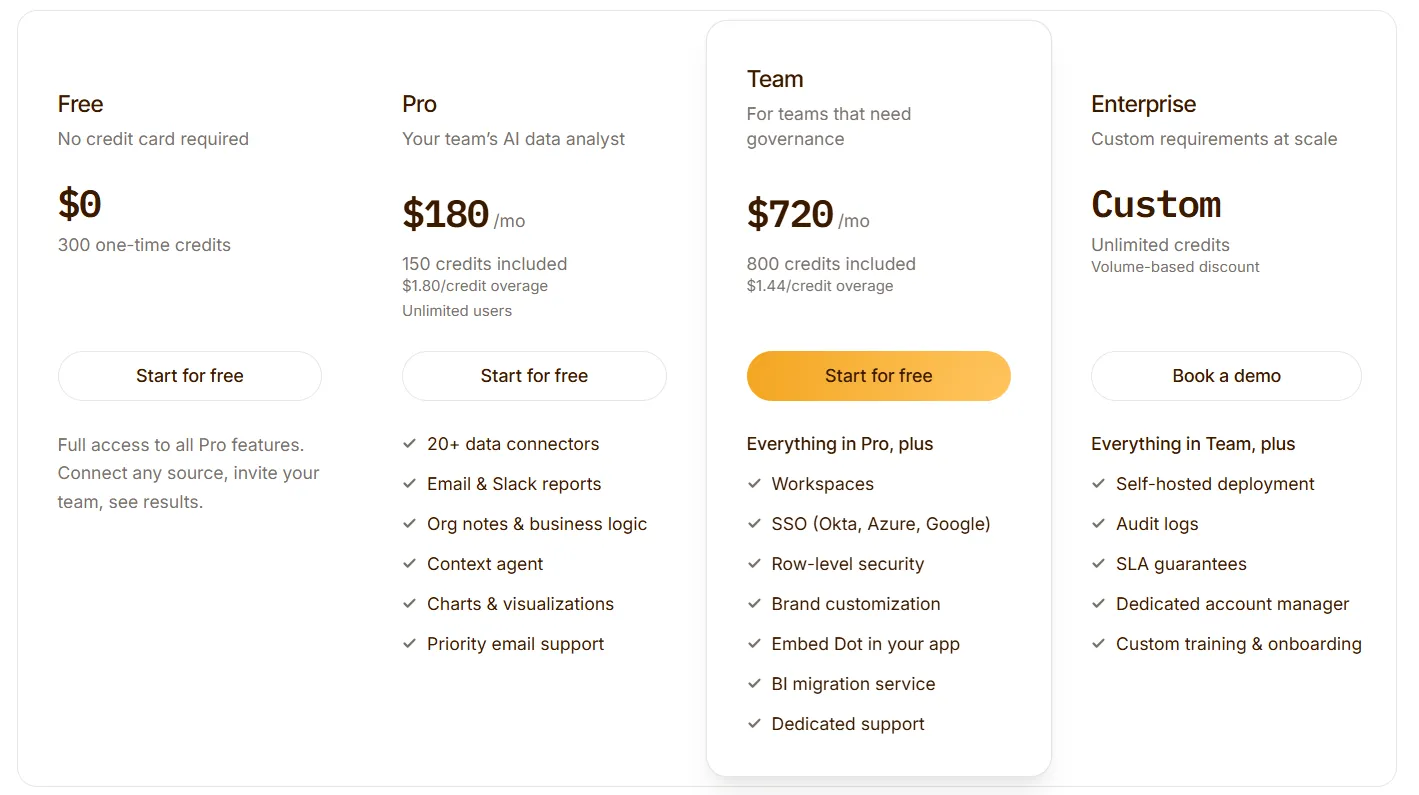
Dot pricing
Dot starts with a free plan that includes 300 one-time credits and full access to Pro features, so a team can run real analyses before committing to anything.
There are three paid plans:
- Pro: $180/month, with 150 credits per month, $1.80 per credit in overage, and unlimited users.
- Team: $720/month, with 800 credits per month, $1.44 per credit in overage, SSO, row-level security, embedded analytics, BI migration help, and dedicated support.
- Enterprise: custom pricing, with unlimited credits, volume discounts, self-hosted deployment, audit logs, an SLA, and a dedicated account manager.
Dot pros and cons
✅ You get written analysis with a recommendation, not a chart to decode.
✅ Recurring business reviews build and deliver themselves as scheduled PowerPoints.
✅ Every answer links straight back to its SQL, Python, and source tables.
✅ The Context Agent holds one set of metric definitions across teams.
✅ It plugs into your existing warehouse and models, so there's nothing to migrate.
✅ Credit-based pricing tracks usage, not headcount.
❌ It isn't a dashboarding tool, so heavy custom-visual work still wants a dedicated BI layer.
❌ You need a connected warehouse.
#2: ThoughtSpot
Best for: Business teams that want to type a question in plain English and get a governed answer without waiting on an analyst.
Similar to: Dot, Looker.
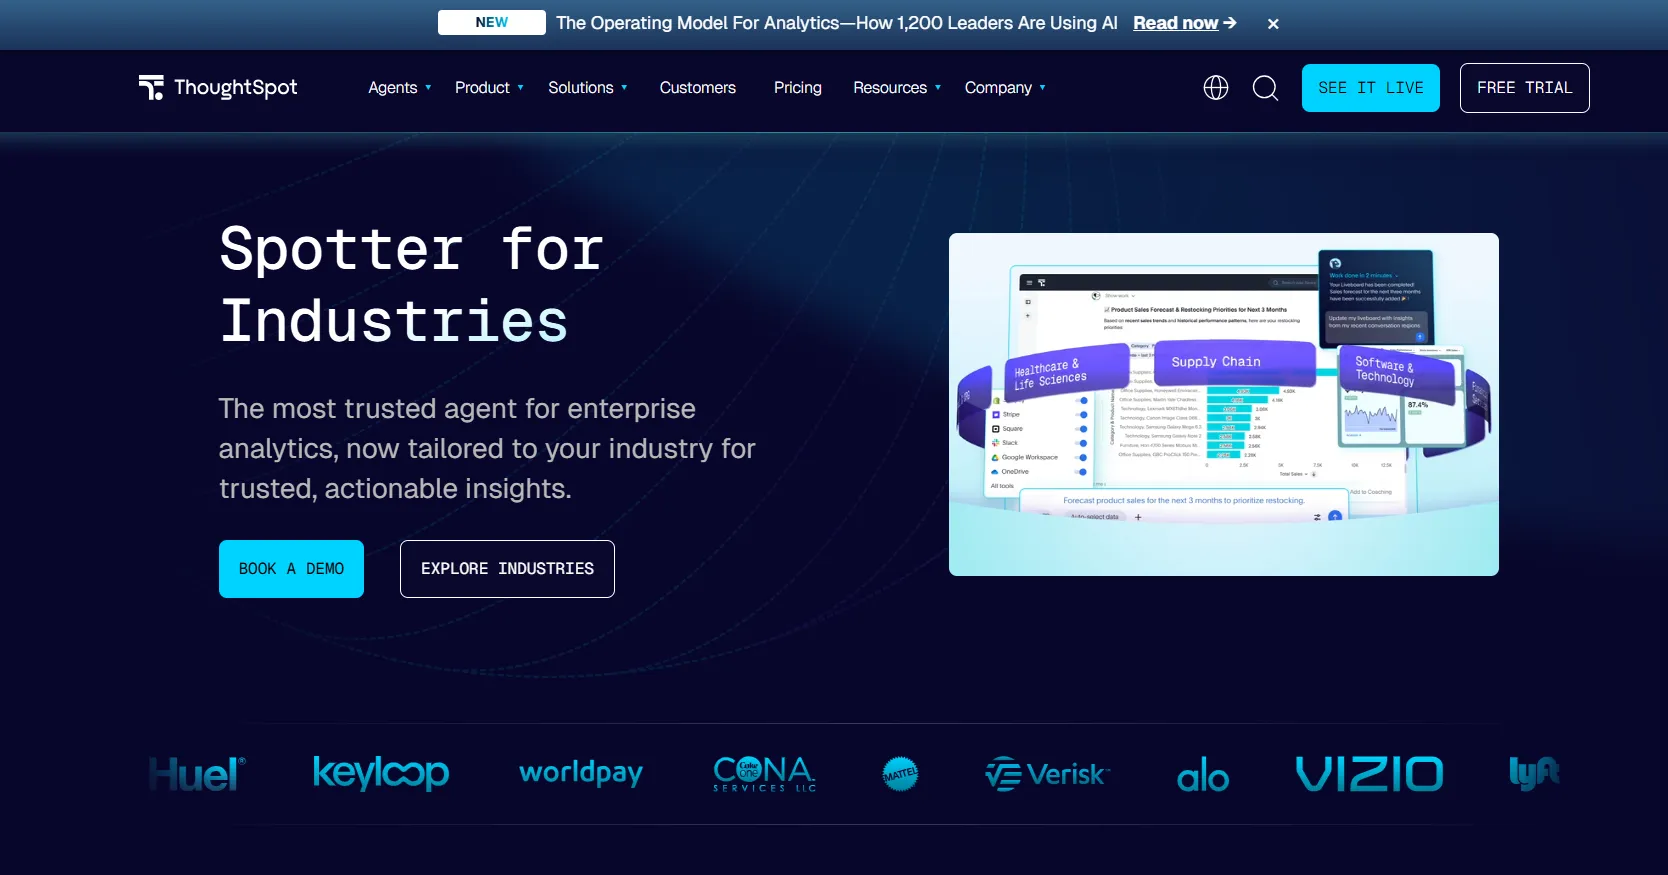
ThoughtSpot has reframed itself as an agentic analytics platform, with Spotter and a group of coordinated AI agents that take a plain-language question and return analyses, written explanations, and fully built dashboards.
Its search-first foundation predates the current AI wave by a good few years, which is part of why so many large analytics teams already trust it to soak up routine, repetitive questions.
ThoughtSpot's Top Features
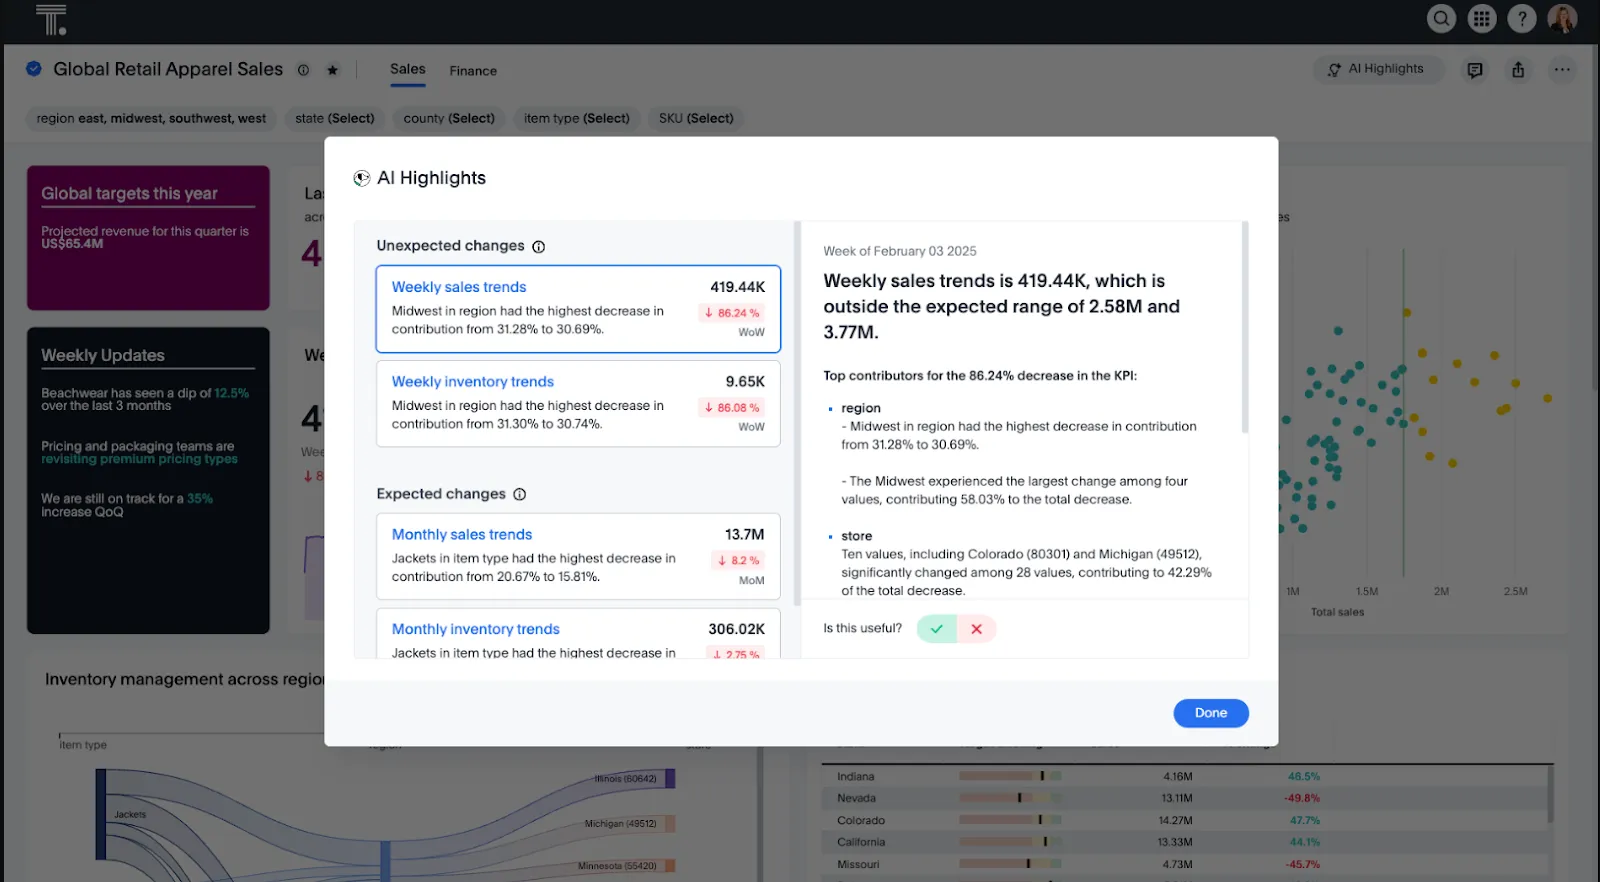
- Type-and-answer search: pose a question in the search bar and get a governed chart you can keep drilling into, no SQL required.
- Spotter agents: the agent layer runs an analysis end to end and pulls signal out of messier, less structured data, doing the legwork a manual exploration would normally demand.
- SpotterViz: hand it a dataset, and it returns a finished, styled dashboard, layout and formatting included.
ThoughtSpot Pricing
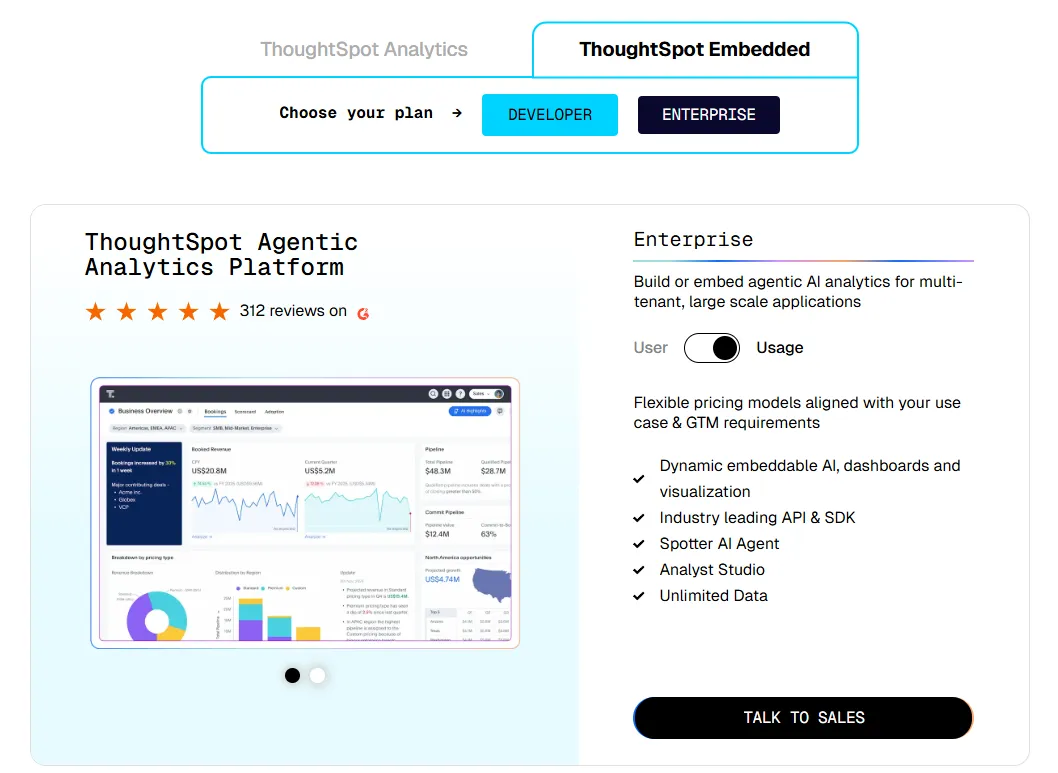
ThoughtSpot offers two separate products: ThoughtSpot Analytics for internal BI and ThoughtSpot Embedded for building analytics into applications - each with flexible pricing depending on scale and usage:
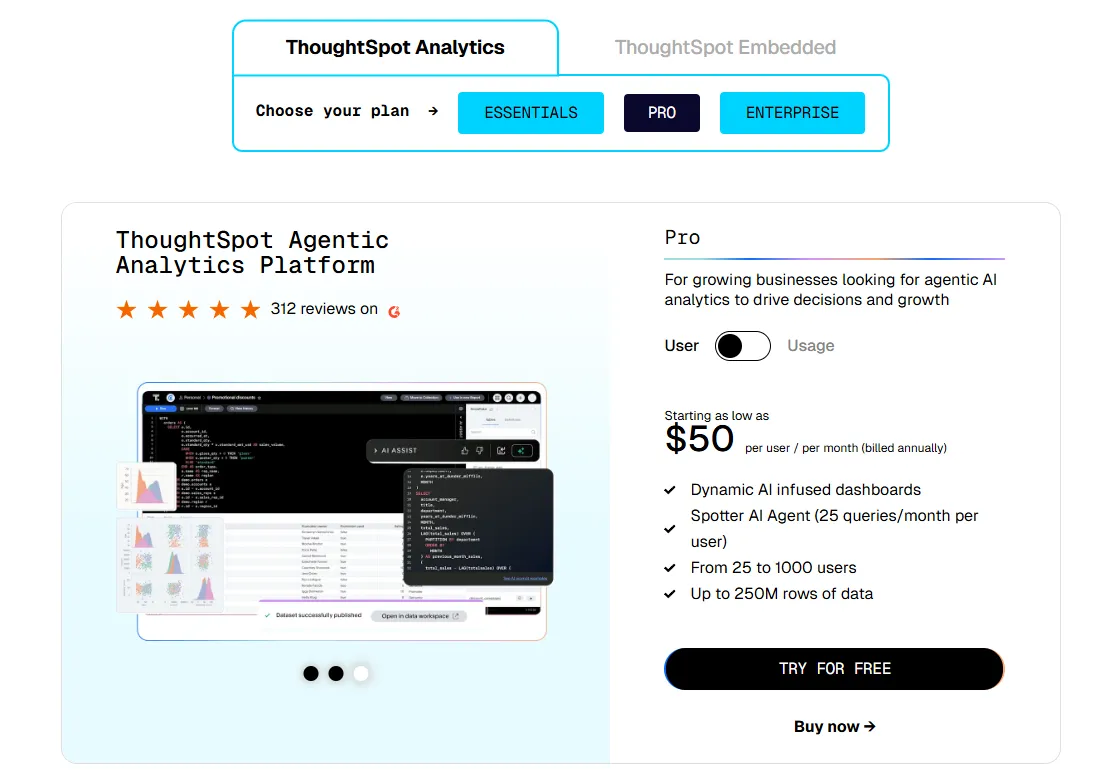
- ThoughtSpot Analytics:
- Essentials: From $25 per user per month (billed annually), for teams of 5-50 users, includes dynamic interactive dashboards and AI-powered insights and supports up to 25M rows of data.
- Pro (per user pricing): From $50 per user per month (billed annually), for 25–1,000 users, includes everything in Essentials, plus AI-infused dashboards and Spotter AI Agent (25 queries per user/month), and supports up to 250M rows of data.
- Pro (usage-based): From $0.10 per query, includes everything in Pro per user, and adds Analyst Studio.
- Enterprise (user or usage-based): Custom pricing, includes everything in Pro, plus unlimited users and data.
- ThoughtSpot Embedded:
- Developer: Free for 1 year, includes embeddable AI analytics, dashboards, and visualizations, APIs and SDKs, up to 10 users and 25M rows of data.
- Enterprise (user-based): Custom pricing, includes everything in Developer, plus unlimited data.
- Enterprise (usage-based): Custom pricing, everything in Enterprise, plus Spotter AI Agent and Analyst Studio.
ThoughtSpot Pros and Cons
✅ Business users take to the search box quickly.
✅ Governance scales cleanly across big rollouts.
❌ Two pricing structures (per user vs. usage-based) can get confusing at scale.
#3: Domo
Best for: Mid-to-large teams that want ingestion, modeling, dashboards, automation, and AI actions living in one product, not spread across a stack of them.
Similar to: Power BI, Tableau.
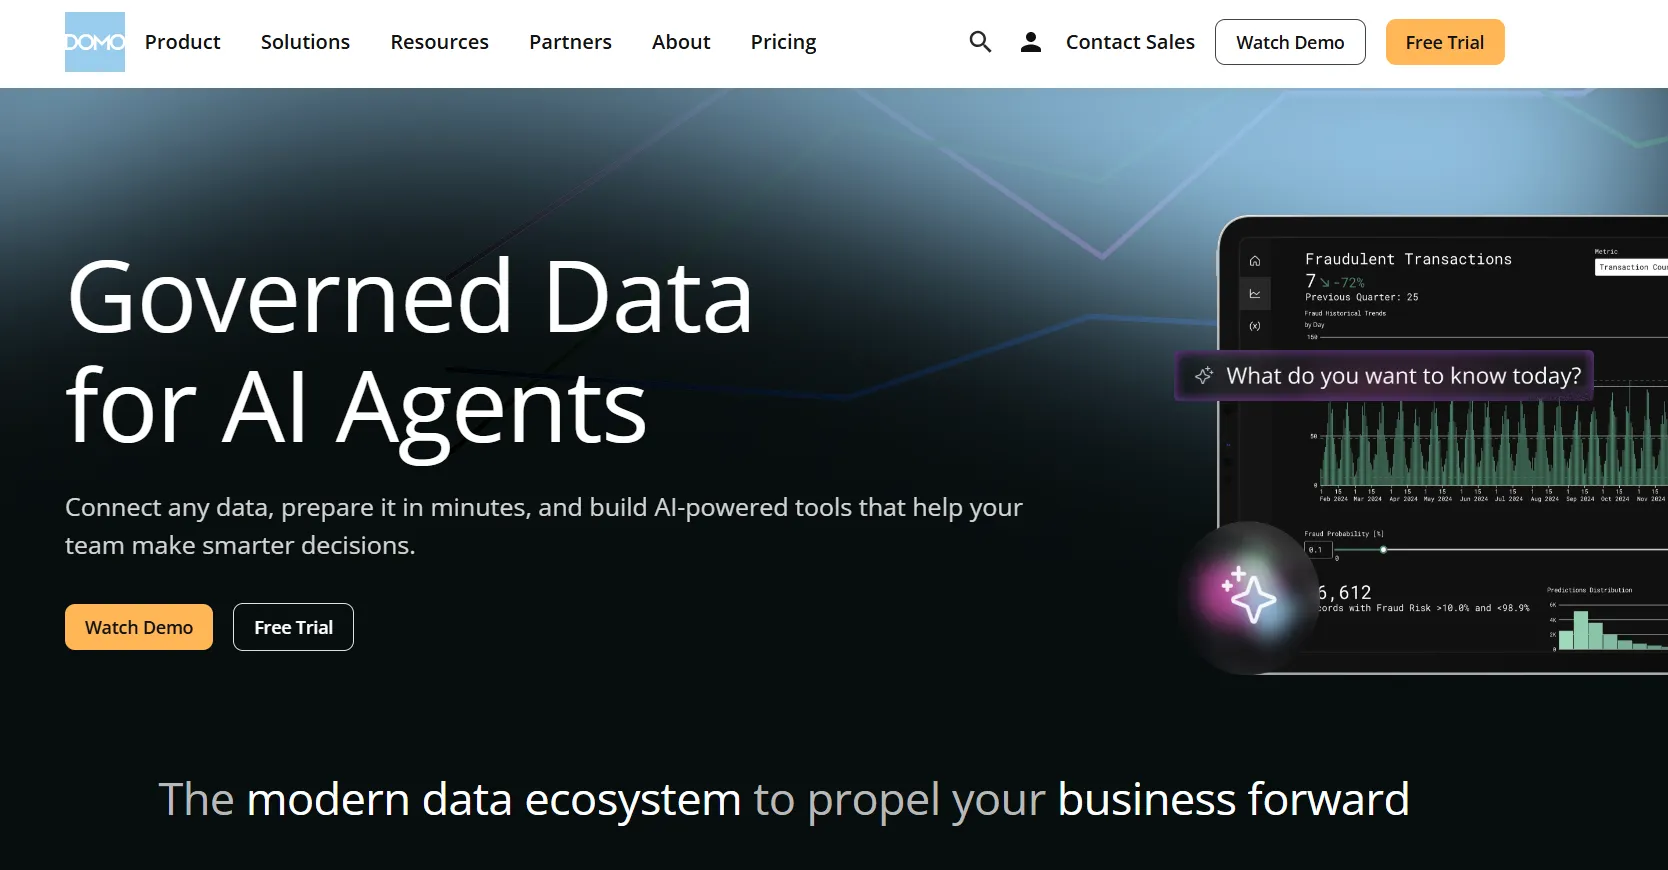
Where most tools in this group focus on one slice of the workflow, Domo tries to hold the whole thing, from pulling data in to triggering a downstream action once an insight lands.
That breadth is why you mostly find it at mid-market and enterprise teams who would rather buy one platform than wire five together.
Domo's Top Features
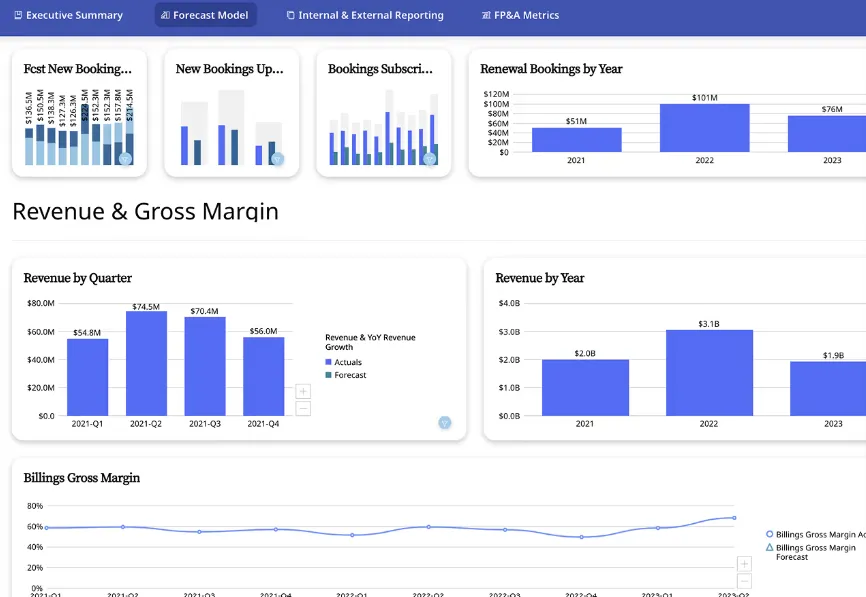
- Modular Cards: every report is a Card you can drop into a dashboard, embed in an app, or pass to another department.
- Low-code app studio: build planning, forecasting, or monitoring apps with little to no engineering time.
- Conversational AI and agents: ask in plain language, get trends explained back, and set agents loose to fire alerts or push updates into connected systems.
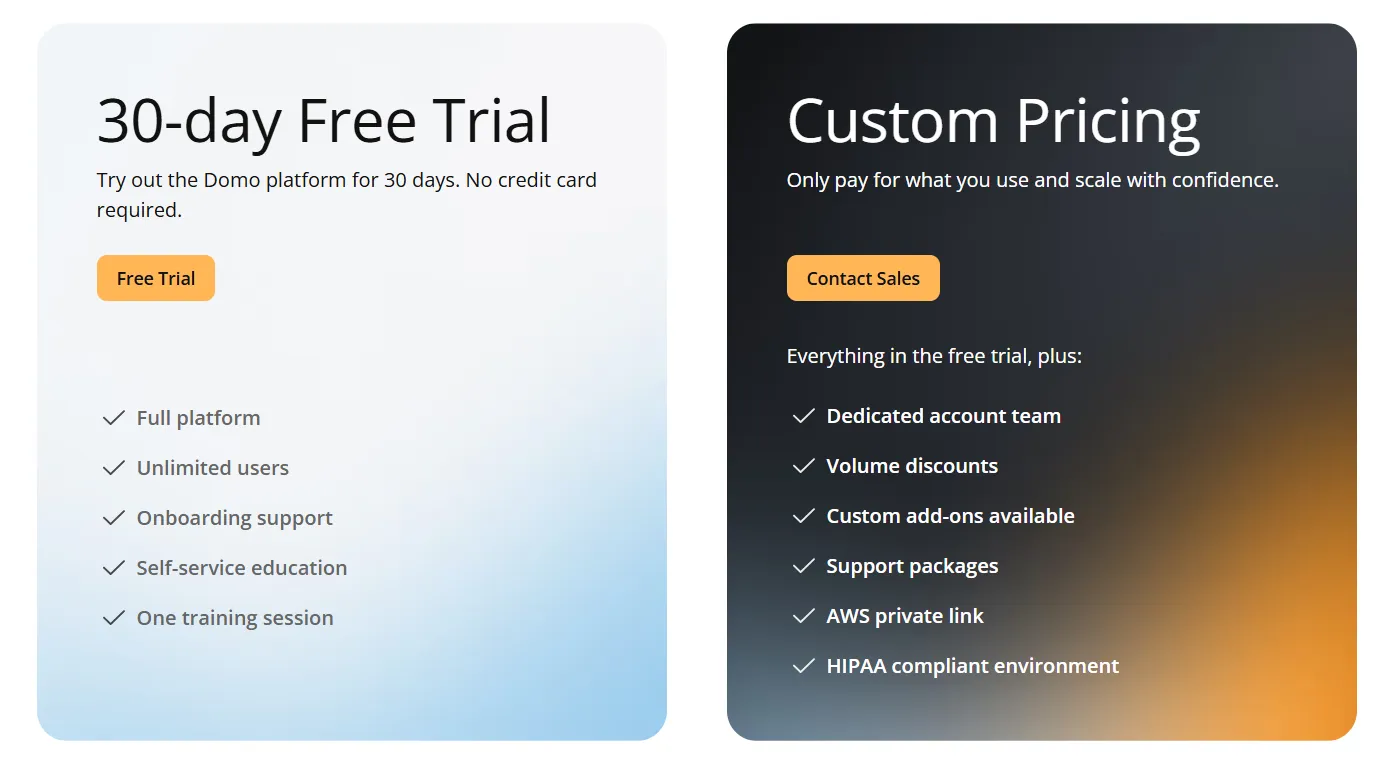
Domo Pricing
Domo has one paid plan and a free trial:
- Free trial: 30 days, no credit card required, includes unlimited users, full platform access, onboarding support, self-service education, and one guided training session.
- Paid plan: Usage-based pricing that scales with analytics needs, adds a dedicated account team, volume discounts, custom add-ons, and support packages.
Domo Pros and Cons
✅ Covers ingestion through to automation in one product.
✅ The connector catalog is broad.
What are the best warehouse-native BI for teams that want governed self-service?
This next group is less about autonomous agents and more about giving people direct, trustworthy access to live data:
#1: Sigma
Best for: Finance and ops teams that think in spreadsheets and want to work on live warehouse data without exporting to Excel.
Similar to: Omni, Metabase.
Sigma's whole pitch is that you shouldn't have to leave a spreadsheet to work with serious data.
The interface behaves like a grid of formulas and pivots, except the tables underneath are warehouse-scale, queried live from Snowflake, BigQuery, Databricks, or Redshift, so there's no second copy of the data floating around.
Sigma's Top Features
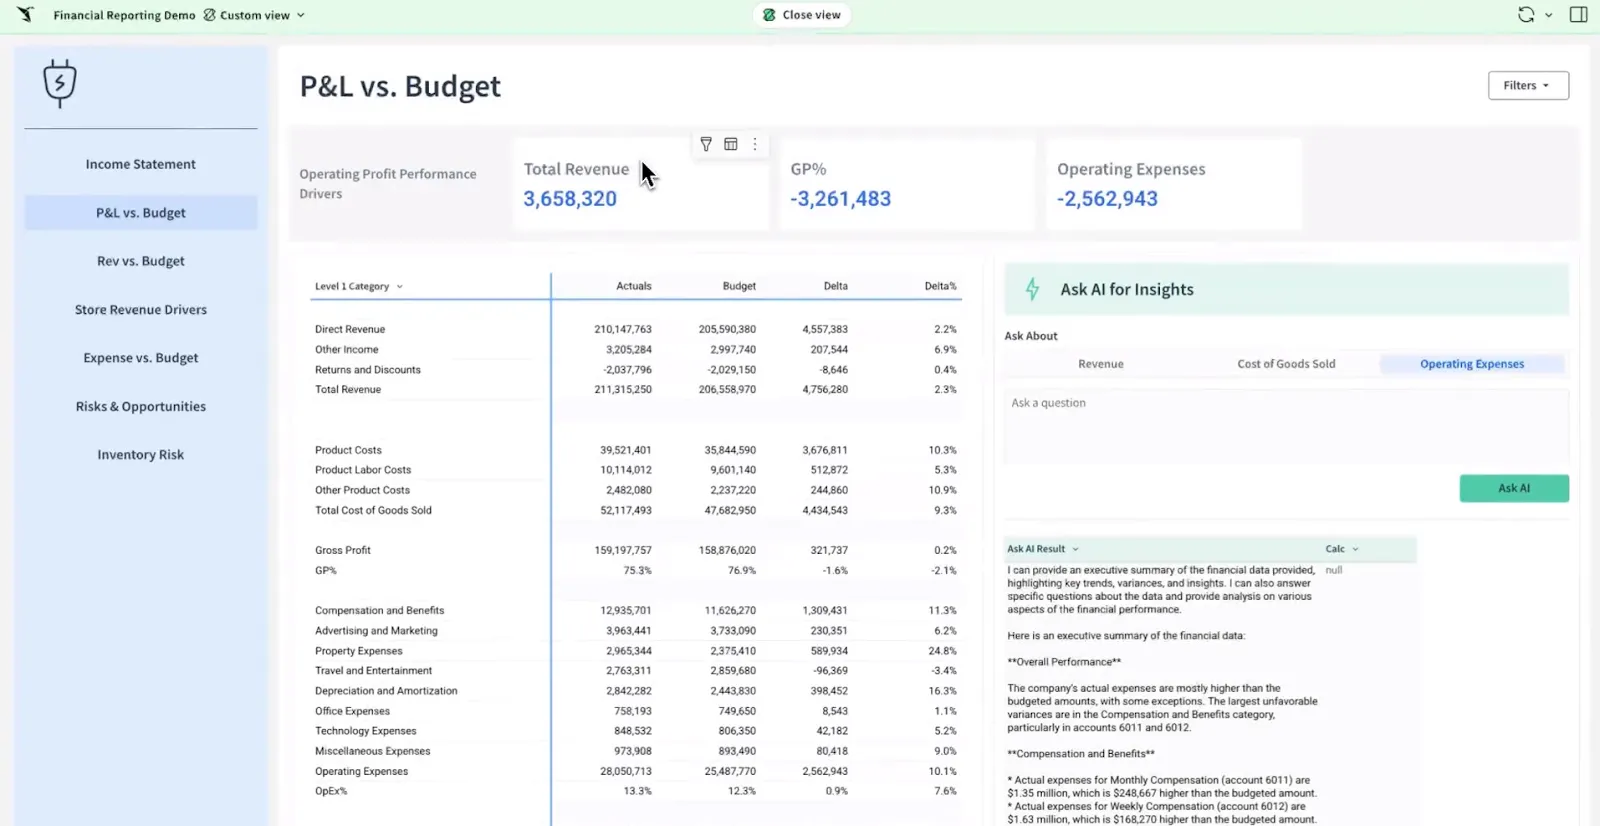
- Spreadsheet workbooks: pivots, formulas, and grouped tables that behave like Excel but run on warehouse-scale data.
- Ask Sigma: prompt your way to a dashboard, summary, or analytics app inside a workbook, then collaborate and version it as a shared file, with no CSV email threads.
- Team workbooks: You can build, comment on, and version analyses in a shared file without emailing CSVs around.
Sigma Pricing
Sigma doesn't publish its pricing. You'll need to contact their sales team for a quote based on your usage.
Sigma Pros and Cons
✅ Because queries hit the warehouse, the figures stay current and governed.
✅ The familiar grid wins over finance and ops fast.
#2: Omni
Best for: Data teams that want a modern semantic layer with self-service exploration and AI assistance on top of live warehouse data.
Similar to: Looker, Sigma.
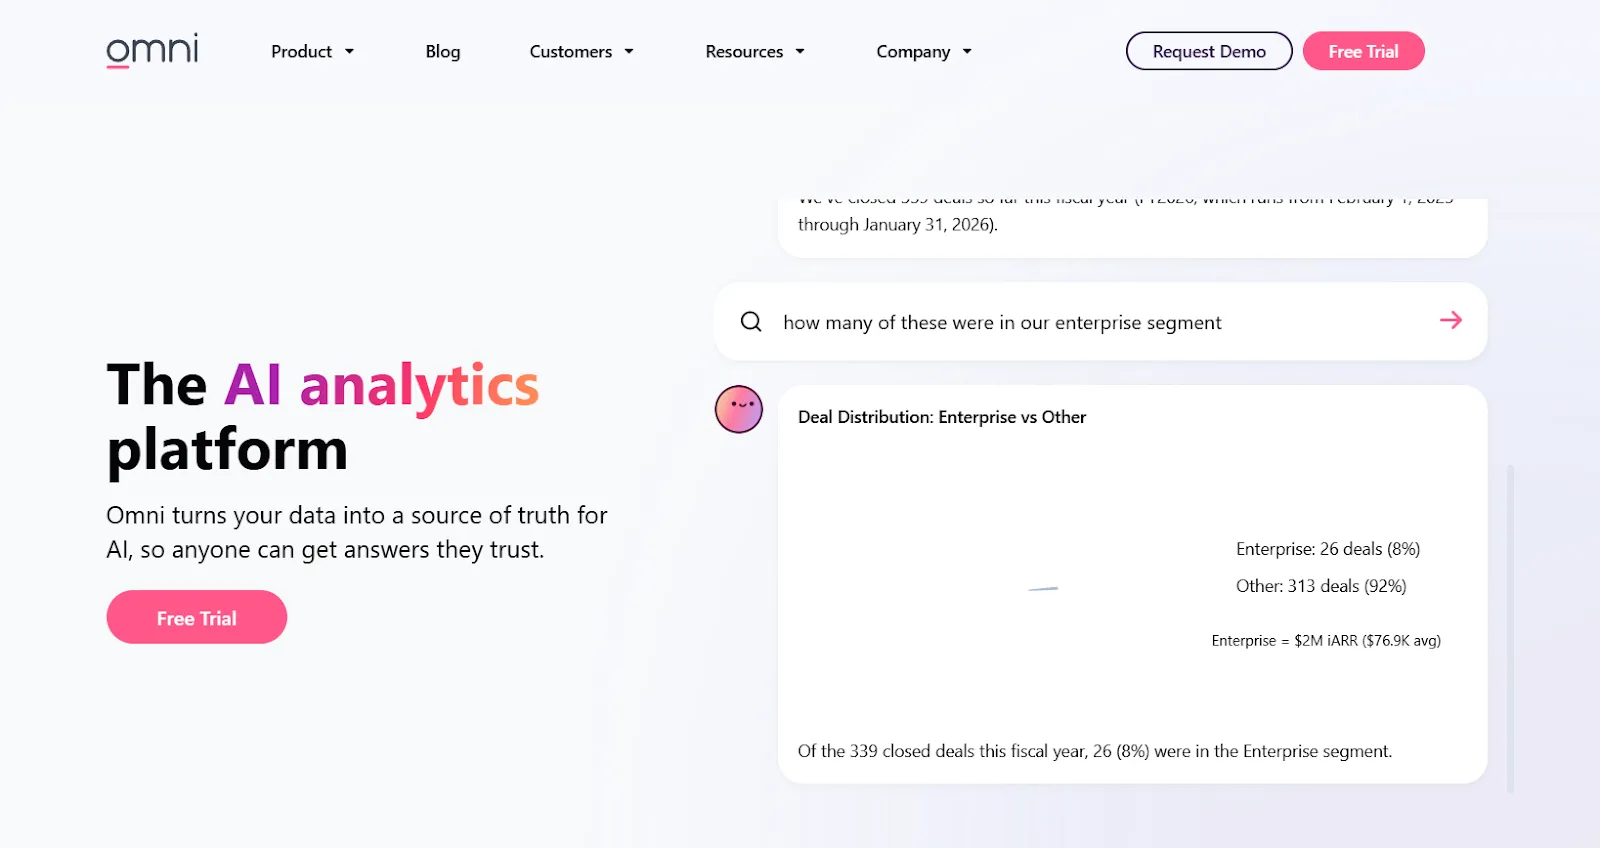
Omni is built around a semantic model that keeps metrics consistent while letting technical and business users move quickly, and its take on modeling is noticeably more flexible than the older platforms it competes with.
Founded by people who knew the rigid side of legacy BI well, it leans governed-but-fast, and skips most of the heaviness that comes with it.
Omni's Top Features
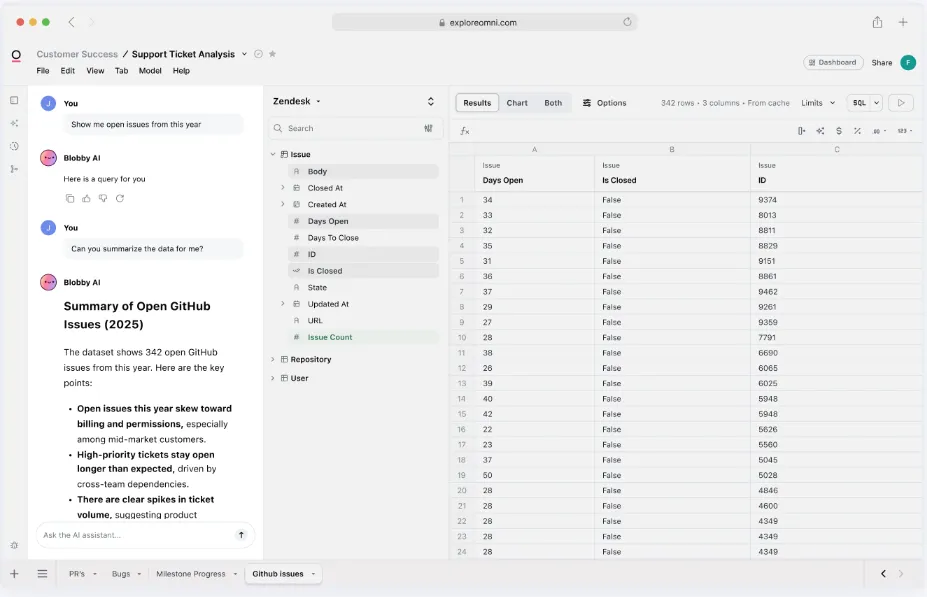
- Reusable metric model: encode a metric once in a central model and reuse it everywhere, without the rigid LookML-style ceremony.
- AI woven into exploration: get charts summarized, queries drafted, trends explained, and next steps suggested while you work.
- Grid-style analysis: dig through live warehouse data in a familiar spreadsheet view while the governed metrics hold.
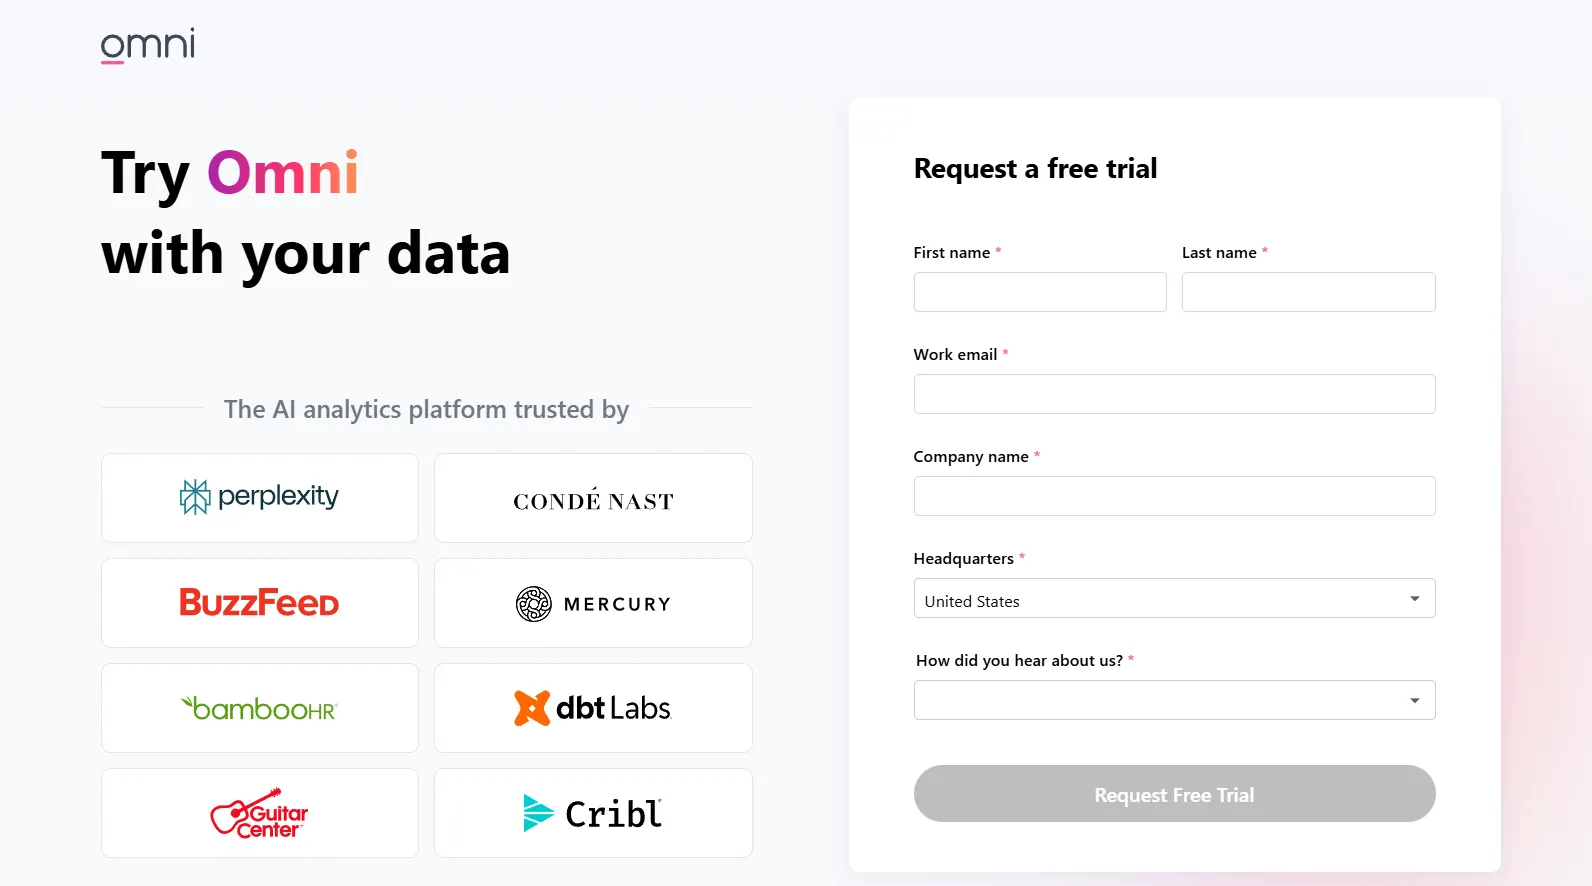
Omni Pricing
Omni doesn't list subscription prices either. You can request a free trial on their site and get a quote from the team.
Omni Pros and Cons
✅ The exploration UI is easy to pick up.
✅ Deep dbt support, with the warehouse queried directly.
#3: Looker
Best for: Data teams that want one governed, modeled definition of every metric, queried straight from the warehouse, with a natural fit for Google Cloud shops.
Similar to: Omni, Power BI.
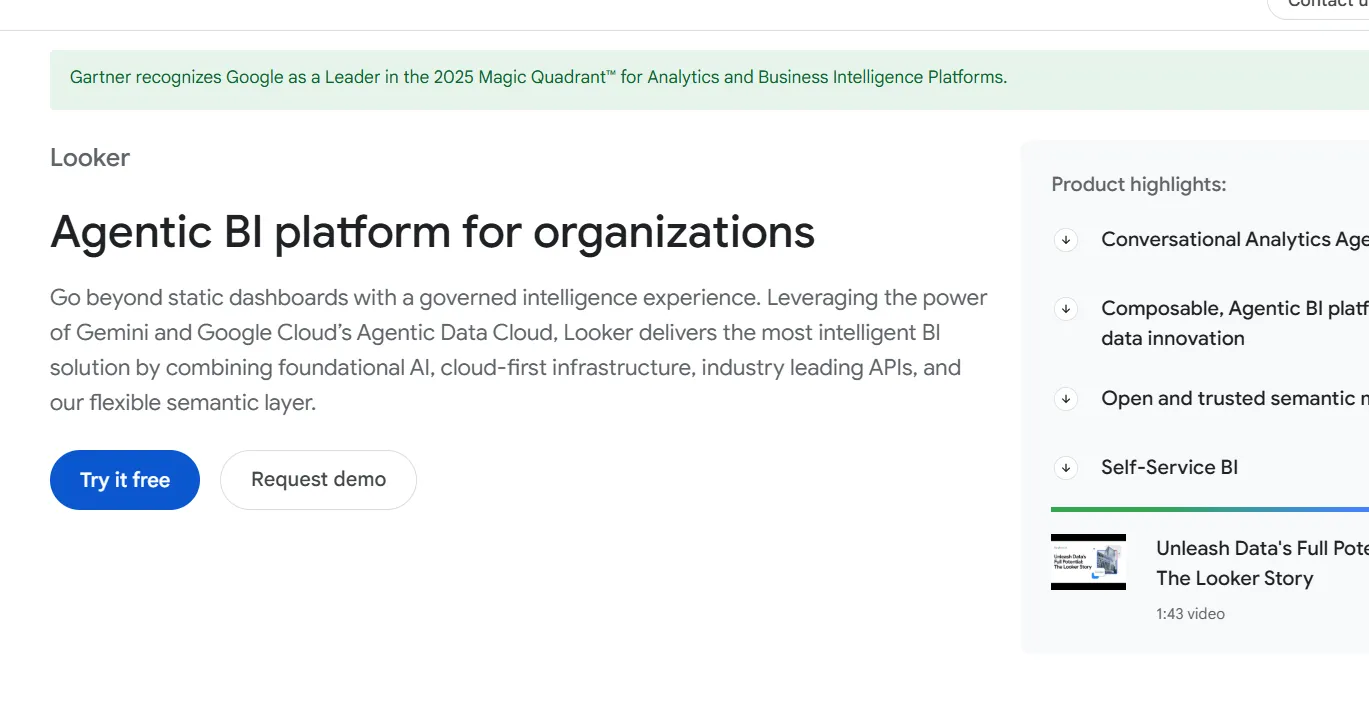
With Looker, you define metrics and business rules once in LookML, and everything downstream inherits that single source of truth, so standalone dashboards never become the place where definitions quietly fork.
Looker's Top Features
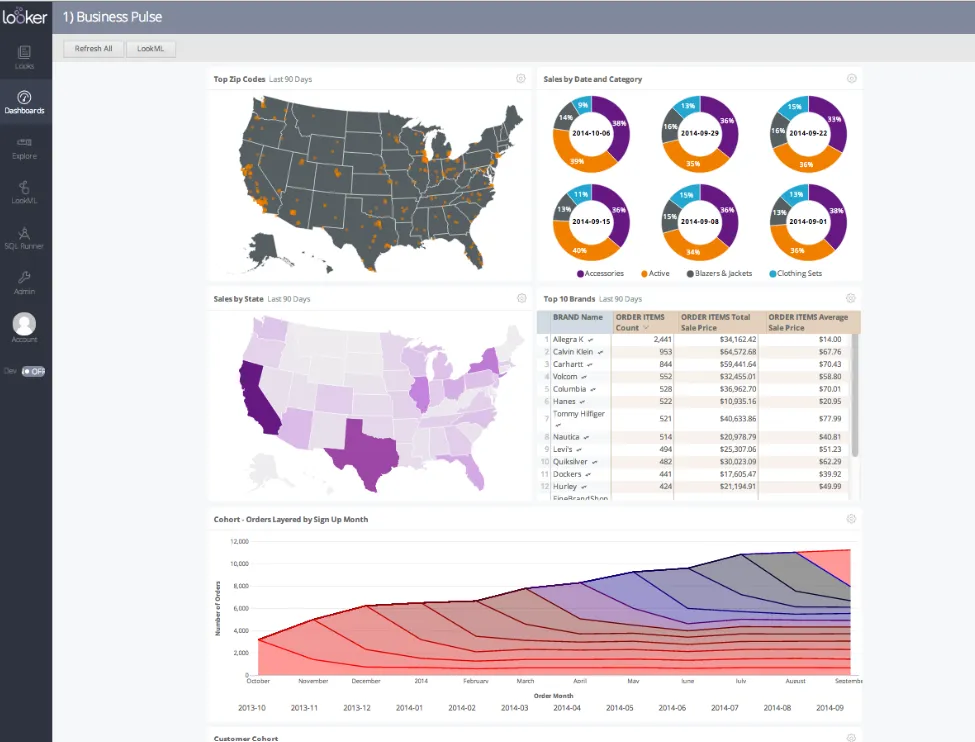
- LookML modeling layer: your team encodes each metric and business rule a single time, and every report downstream inherits it, which is how a 200-person company avoids three competing definitions of revenue.
- Gemini-powered questions and answers: type a question and Looker answers straight from the modeled data.
- Explores and dashboards: Business users self-serve from governed models without breaking the underlying definitions.
Looker Pricing
Looker uses a custom, contract-based pricing model made up of two parts: platform pricing (the cost of running a Looker instance) and user licensing (the cost per user type).
Pricing is annual for all plans.
- Platform editions:
- Standard: Designed for small teams or organizations with fewer than 50 users, includes 1 production instance, 10 standard users + 2 developer users, up to 1,000 query-based API calls/month, and up to 1,000 admin API calls/month.
- Enterprise: Built for larger internal BI and analytics use cases, includes everything in Standard, plus enhanced security features, up to 100,000 query-based API calls/month, and up to 10,000 admin API calls/month.
- Embed: Designed for embedding analytics into external products or applications, includes everything in Standard, plus up to 500,000 query-based API calls/month and up to 100,000 admin API calls/month.
- User licensing:
- Developer users: Full access to Looker, including LookML development, administration, APIs, and advanced tooling.
- Standard users: Can explore data, build dashboards and reports, run SQL, and schedule content.
- Viewer users: Read-only access to dashboards and reports, with filtering and drill-down.
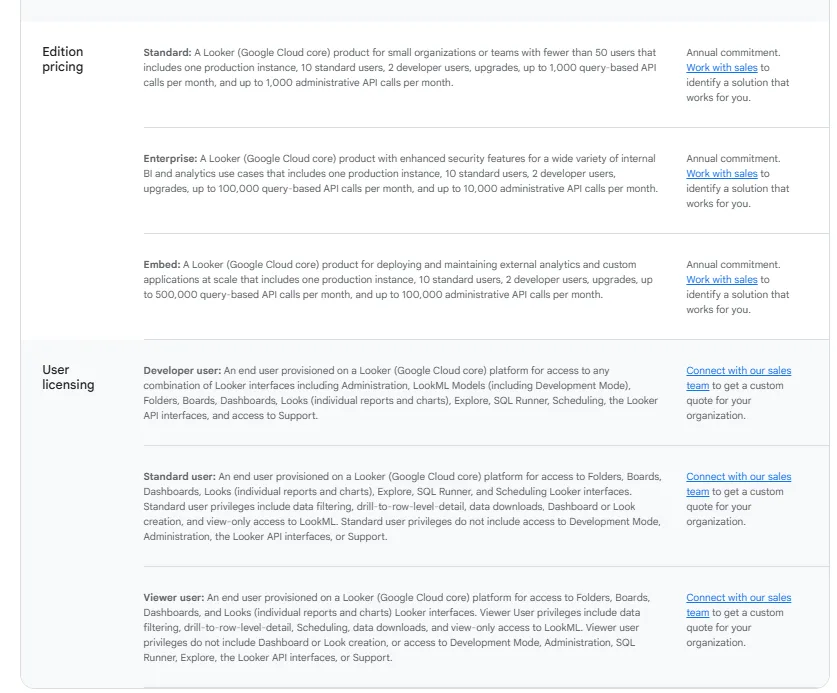
Pricing is custom on all plans and varies based on scale, permissions, and usage.
Looker Pros and Cons
✅ A single modeled layer keeps every report on the same numbers.
✅ Pushing reports into internal or customer-facing apps is painless.
❌ There's a bit of a learning curve at first, which can require a bit more education upfront to maximize all of its capabilities, according to a G2 review.
#4: Metabase
Best for: Startups and product teams that want quick, self-serve analytics and flexible embedding without enterprise-grade weight or cost.
Similar to: Sigma, Looker.
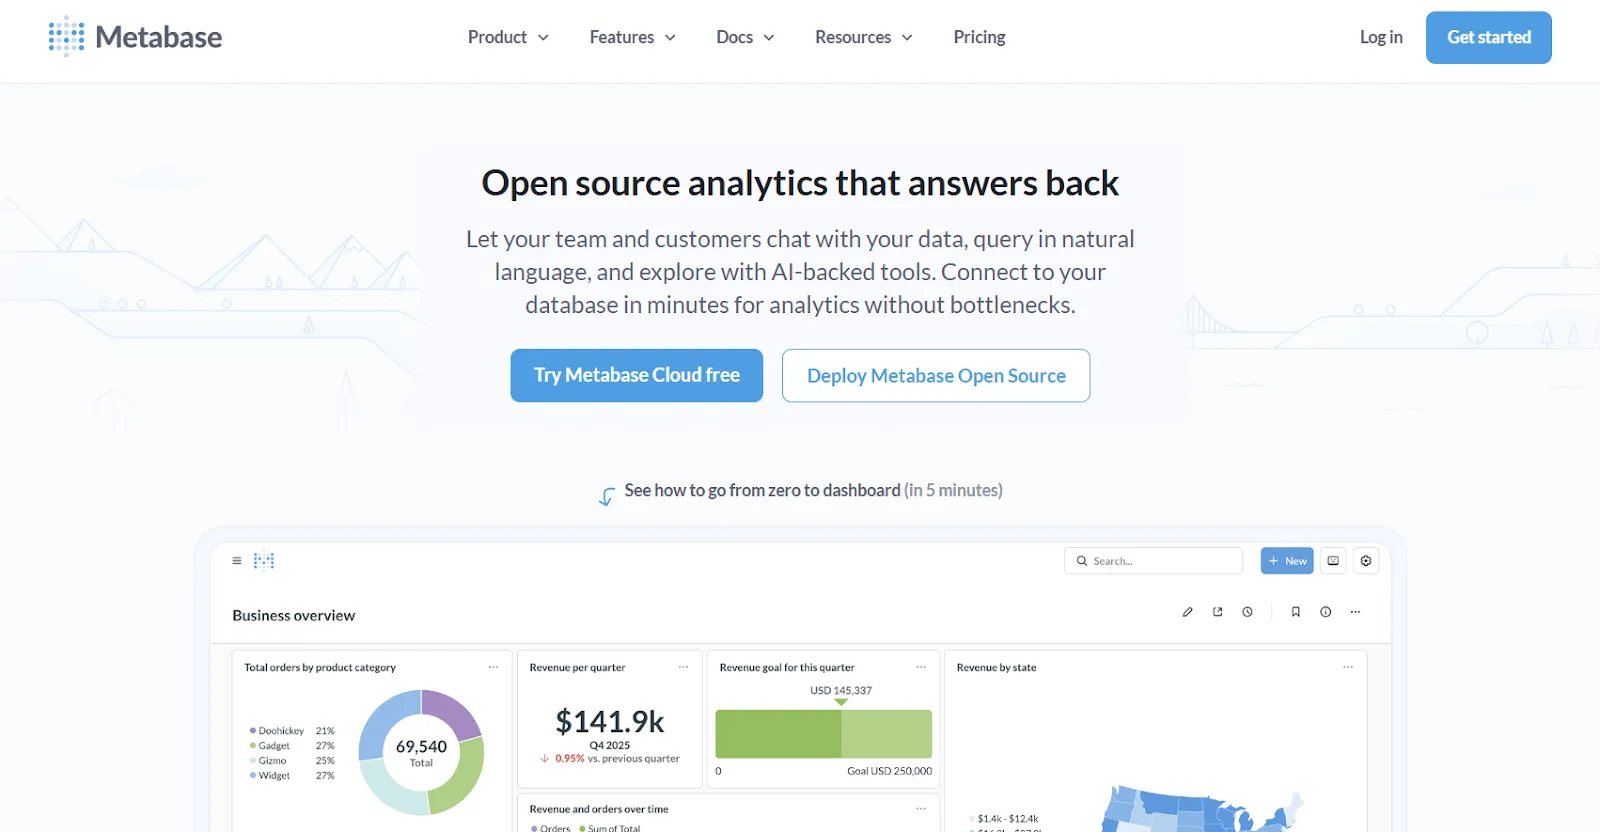
Metabase is often the first analytics tool a growing software company installs, mostly because it's quick to stand up and doesn't carry an enterprise price tag.
The core is open source, and it covers both raw SQL and a guided, no-code question builder, with Metabot AI handling plain-language queries on top.
Metabase's Top Features
- Guided query builder: click through joins, filters, and aggregations in a visual flow, and drop to raw SQL the moment you want more control.
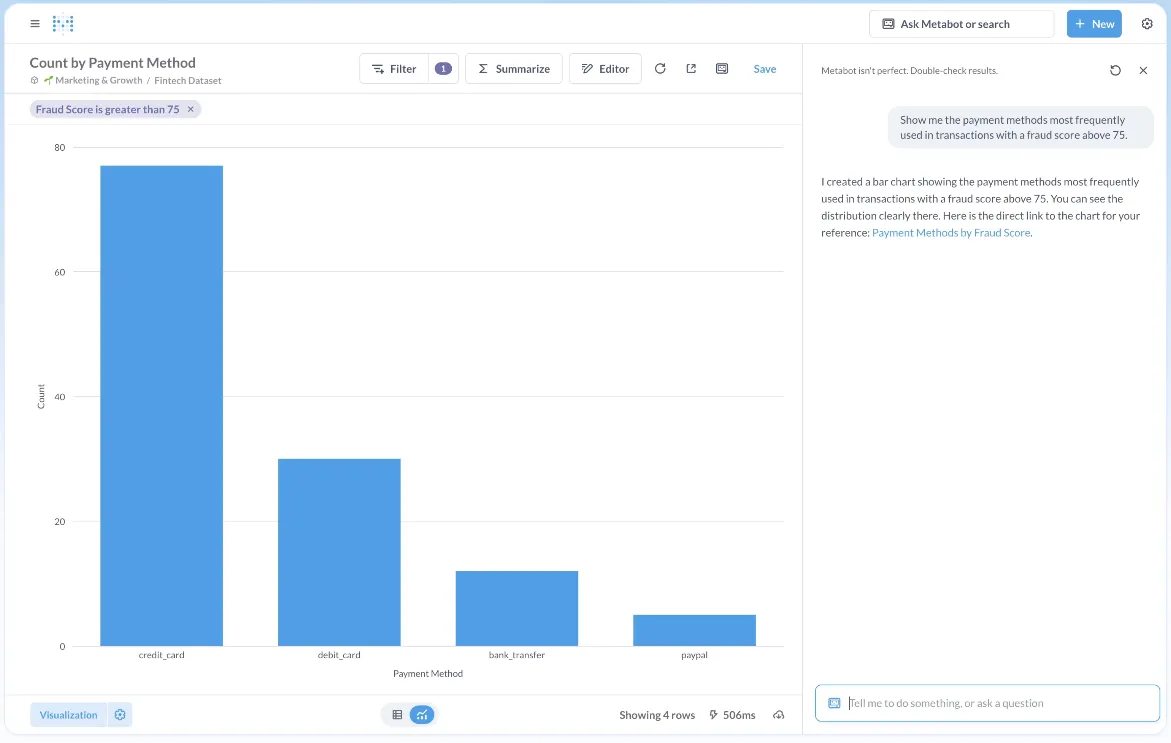
- Metabot AI: describe what you want in plain language and let Metabot draft the query and the chart.
- Drill-anywhere charts: click into any chart to filter, segment, or pivot without starting the question over.
Metabase Pricing
Metabase offers two pricing options depending on how you use the product: internal business intelligence or customer-facing embedded analytics.
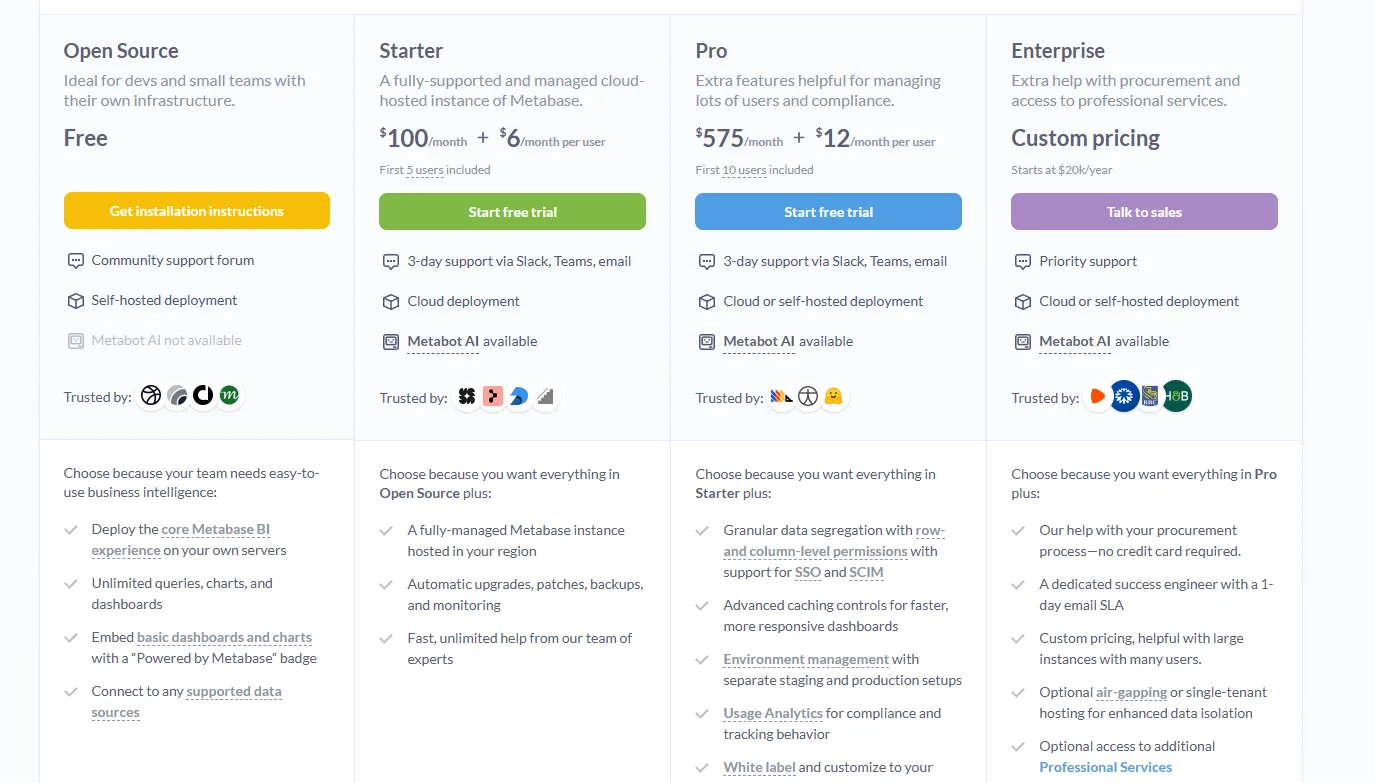
- Business Intelligence:
- Open Source (Self-hosted): Free, self-hosted deployment, includes unlimited queries, charts, and dashboards, connects to all supported data sources, basic embedding with “Powered by Metabase” branding, community support only.
- Starter (Cloud-hosted): $100/month + $6/user/month, first 5 users included, includes everything in Open Source, plus option to include Metabot AI (charged extra), automatic upgrades, backups, and monitoring, support via Slack, Teams, and email (3-day SLA).
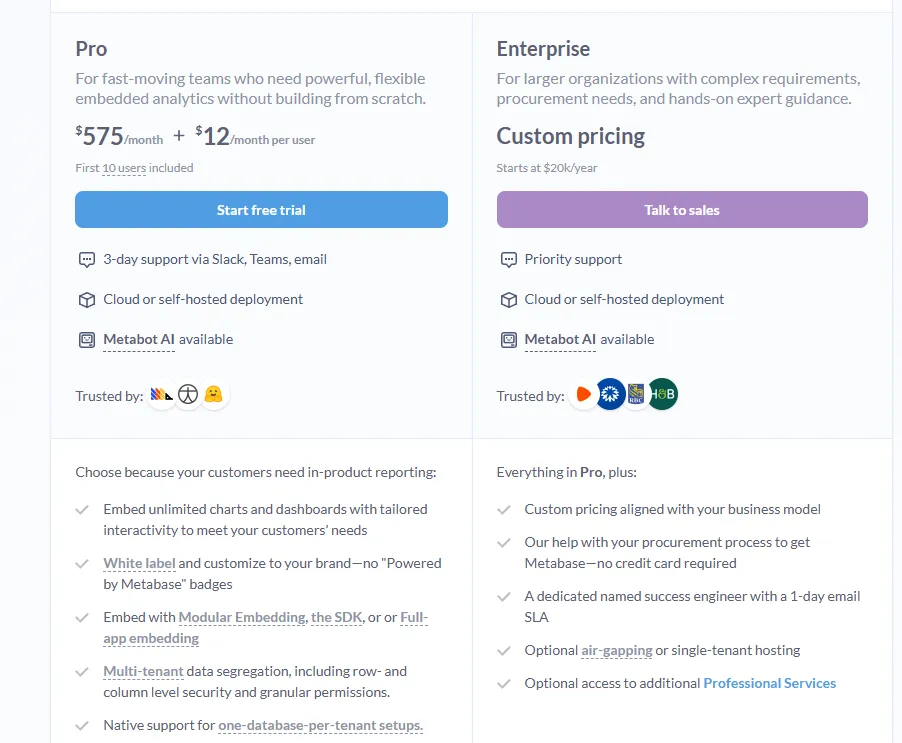
- Pro: $575/month + $12/user/month, first 10 users included, cloud or self-hosted deployment, includes everything in Starter, plus row- and column-level permissions, SSO and SCIM support, advanced caching and performance controls, staging + production environments, usage analytics and audit visibility, white-labeling, and embedded analytics capabilities.
- Enterprise: Custom pricing (starts at $20k/year), includes everything in Pro, plus priority support, dedicated success engineer (1-day email SLA), optional single-tenant or air-gapped deployment, and optional professional services.
- Embedded Analytics pricing:
- Pro: $575/month + $12/user/month, first 10 users included, includes unlimited embedded dashboards and charts, full white-labeling, modular embedding, SDK, or full-app embedding, multi-tenant security (row- and column-level), one-database-per-tenant support, staging + production environments, usage analytics, internal BI for your team, and option to include Metabot AI (charged extra).
- Enterprise: Custom pricing (starts at $20k/year), includes everything in Pro, plus a dedicated success engineer, priority support, optional single-tenant or air-gapped hosting, and optional professional services.
Metabase Pros and Cons
✅ The open-source edition costs nothing to self-host.
✅ Connects to a new database in minutes.
❌ The platform has limited advanced analytics and some dashboard customization constraints, according to a G2 review.
What are the best enterprise BI platforms built to scale across the org?
If your organization needs proven dashboarding and reporting that holds up across many departments, this is the group most teams already recognize:
#1: Microsoft Power BI
Best for: Organizations already on Microsoft 365 that want standardized dashboards, reporting, and self-service analytics at scale.
Similar to: Tableau, Qlik Sense.
If your company already runs on Excel, Teams, and SharePoint, Power BI is usually the easy yes, since it folds modeling, interactive dashboards, paginated reports, and Copilot insights into tooling those teams already license.
Power BI's Top Features
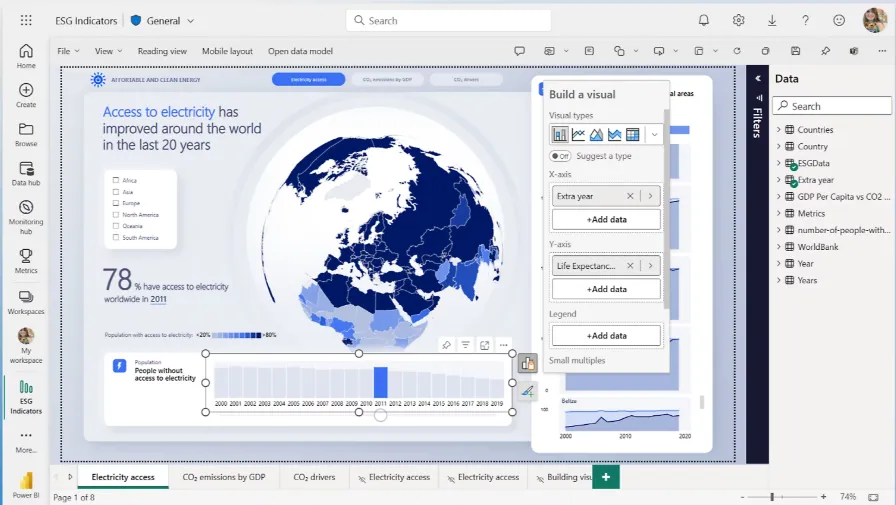
- Publishable reports: layer visuals, filters, and drill-throughs, then push the result out to the whole org.
- Enterprise governance: You can apply row-level security, sensitivity labels, and Microsoft Entra ID controls.
- Copilot assists: it drafts forecasts, flags the odd anomaly, and writes the summary commentary so you don't have to.
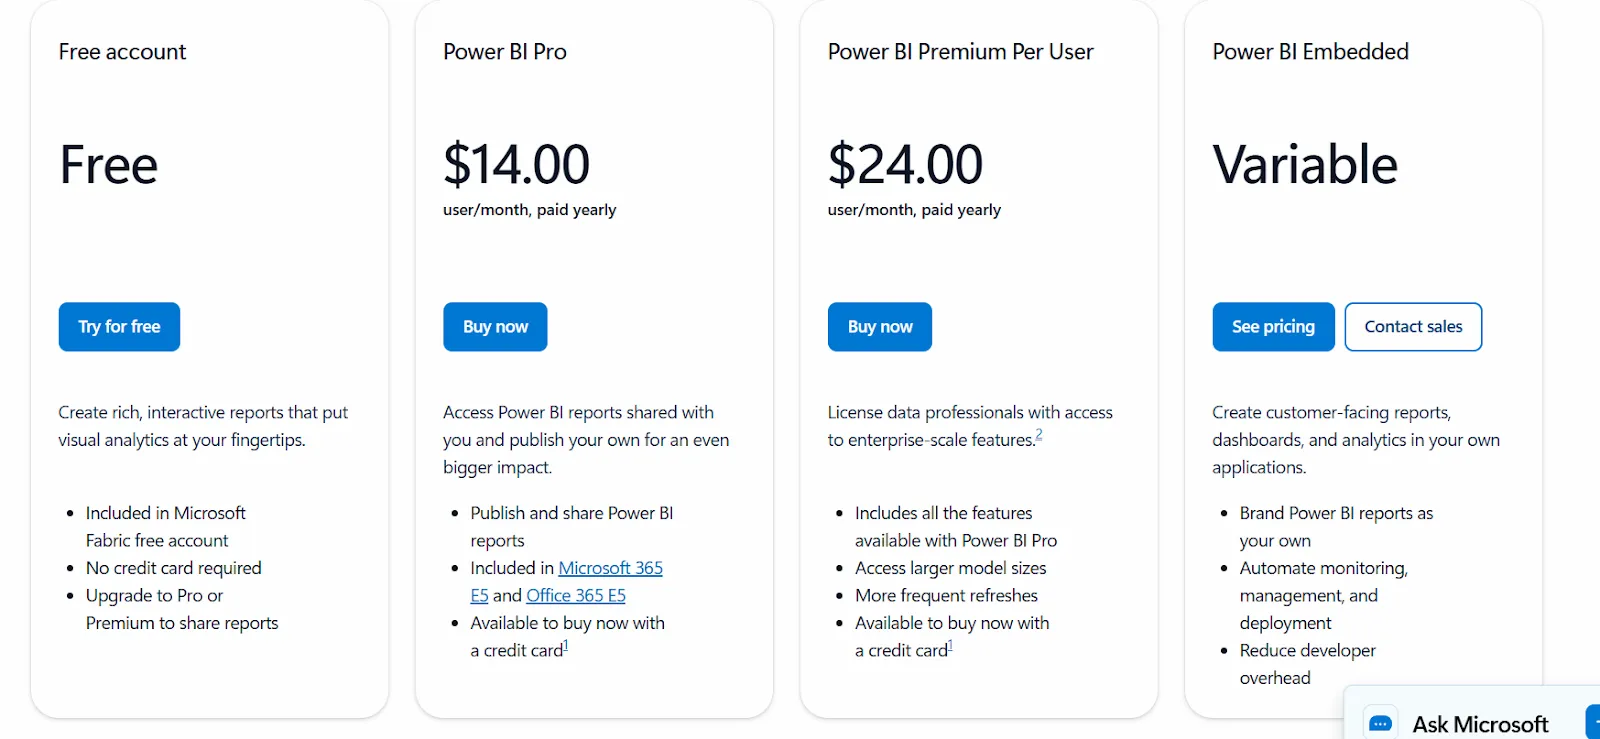
Power BI Pricing
Power BI uses a per-user and capacity-based model:
- Free: Build personal reports and dashboards, but no sharing or collaboration.
- Power BI Pro: $14/user/month, includes report publishing, workspace sharing, scheduled refresh, and Teams or SharePoint embedding.
- Power BI Premium Per User: $24/user/month, adds larger model sizes, more refreshes per day, paginated reports, and AI features.
- Power BI Embedded: Custom pricing for customer-facing analytics inside your own apps.
Power BI Pros and Cons
✅ Entry pricing is among the cheapest in BI, at $14/user/month.
✅ Talks to Excel and Teams out of the box.
❌ The learning curve can feel steep (for beginners), particularly when you start working with data modeling and DAX formulas, according to a G2 review.
#2: Tableau
Best for: Data teams and enterprises that need deep visual analytics, exploratory analysis, and deployment flexibility across cloud and self-hosted setups.
Similar to: Power BI, Qlik Sense.
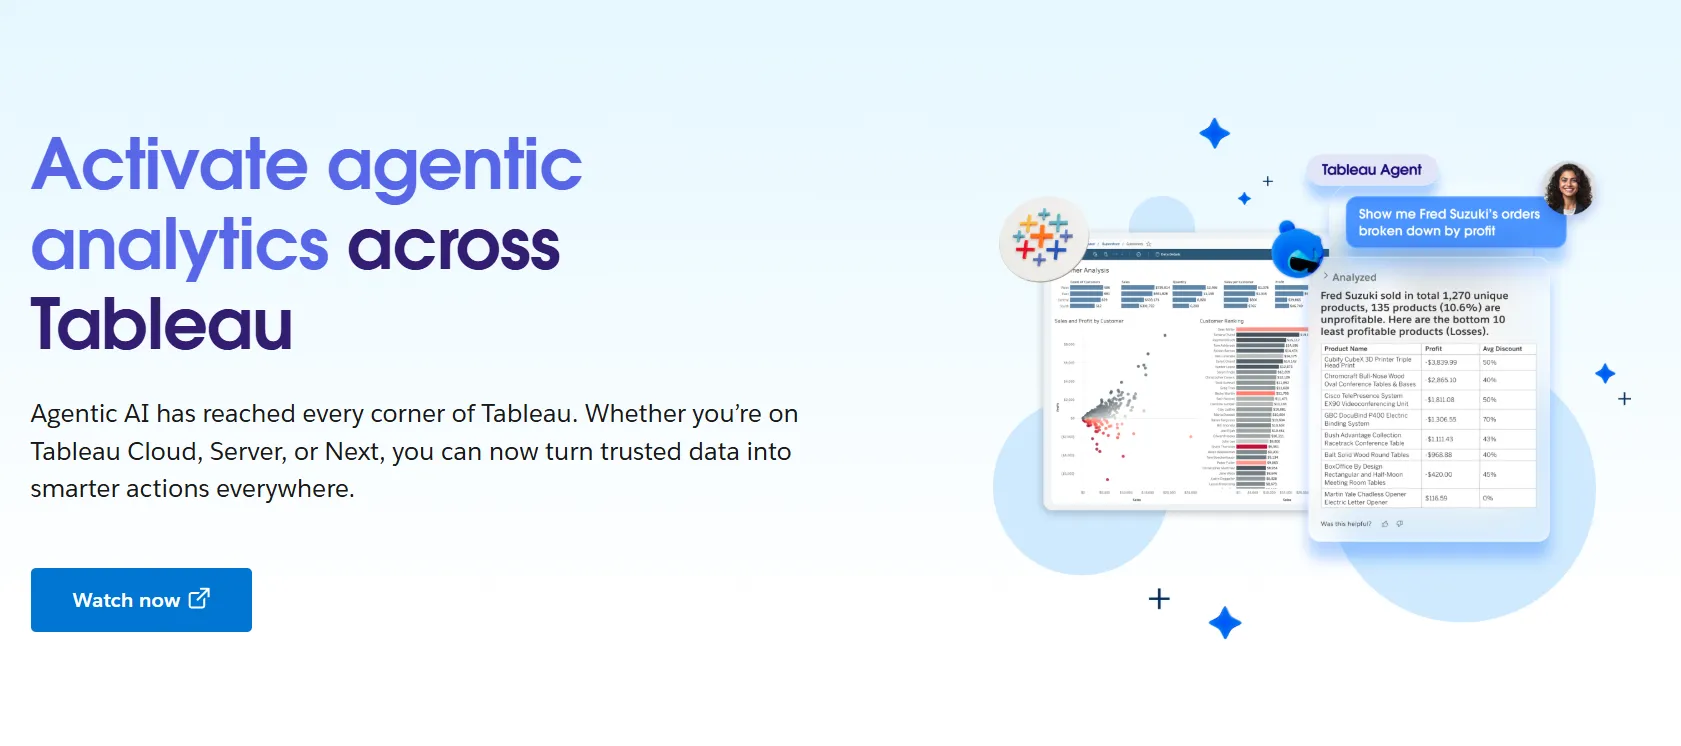
On sheer visual depth, Tableau is hard to beat, and that's the reputation it built over years of drag-and-drop analysis and dashboards made for storytelling.
Tableau's Top Features
- Canvas-based building: drag fields onto a sheet to assemble interactive dashboards from a deep library of chart types.
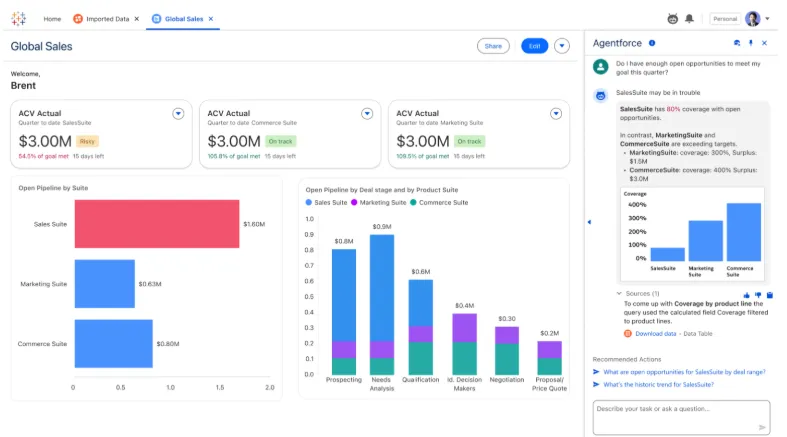
- Tableau Next agents: pose a natural-language question and get an AI answer with suggested next moves, surfaced in Slack or Salesforce.
- Pulse and governed metrics: define metrics centrally, set role-based access, and manage data sensitivity as usage scales.
Tableau Pricing
Tableau uses per-user, per-month pricing, with separate plans depending on whether you deploy Tableau in the cloud, on your own servers, or as part of its newer AI-driven offering:
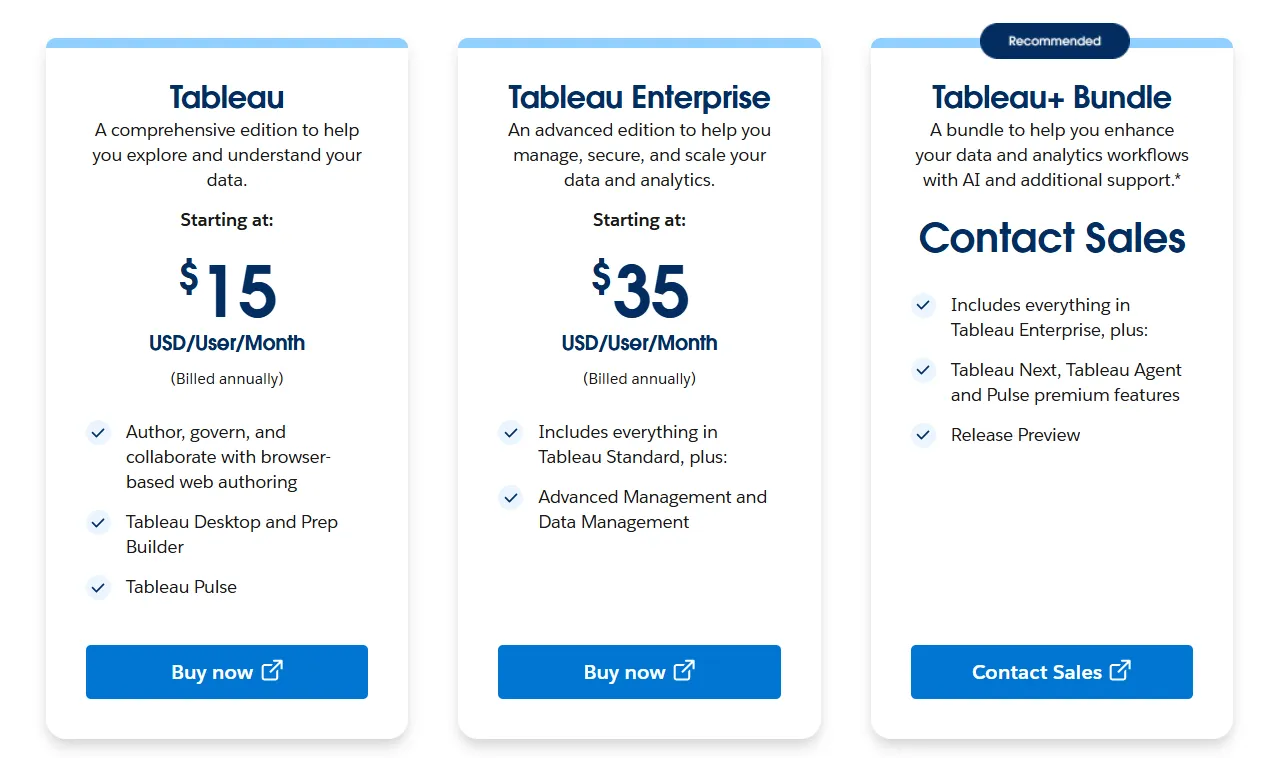
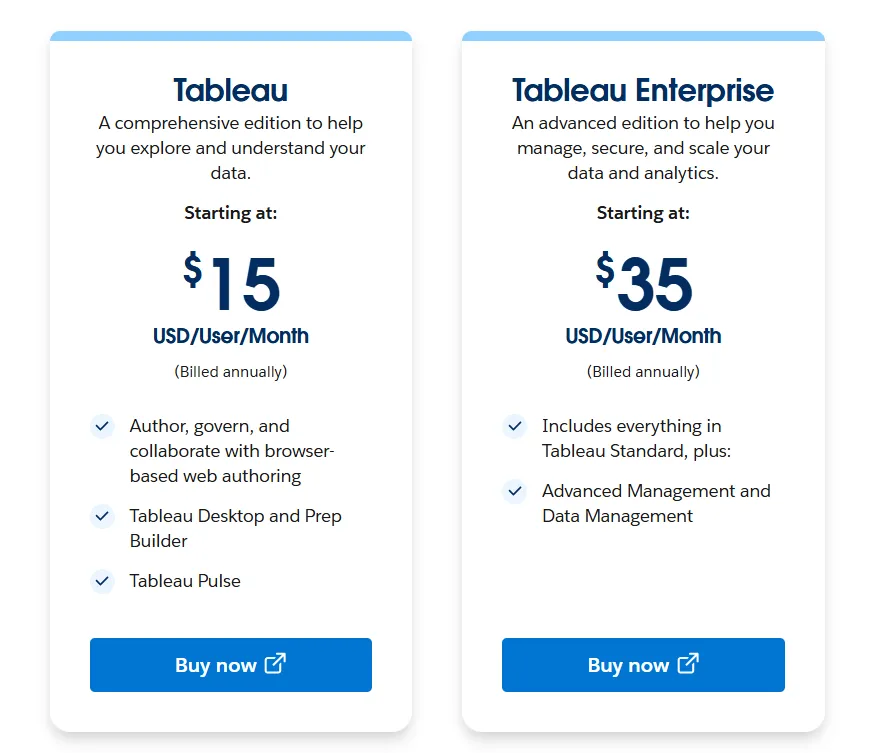
- Tableau Cloud has three pricing plans:
- Tableau Standard: Starts at $15/user/month, which includes browser-based authoring and collaboration, Tableau Desktop and Prep Builder, Tableau Pulse for metrics and insights.
- Tableau Enterprise: Starts at $35/user/month and includes everything in Standard, plus Advanced Management and Data Management for governance and scale.
- Tableau+ Bundle (Cloud + AI): Custom pricing, includes everything in Tableau Enterprise, plus Tableau Next, Tableau Agent, and Pulse premium features, with access to release previews and early AI capabilities.
- Tableau Server has two pricing plans:
- Tableau Standard: Starts from $15 per user/month, which includes authoring, governance, and collaboration and Tableau Desktop and Prep Builder.
- Tableau Enterprise: Starts from $35 per user/month, which includes everything in Standard, plus Advanced Management, Data Management, and eLearning.
- Tableau Next (agentic analytics) has 2 plans:
- Tableau Next: Starts from $40/month/seat, and includes Agentforce Tableau, Tableau Semantics, and its Native Slack integration.
- Tableau + Bundle: Custom pricing, which includes everything in Tableau Enterprise, plus Tableau Next, Tableau Agent and Pulse premium features.
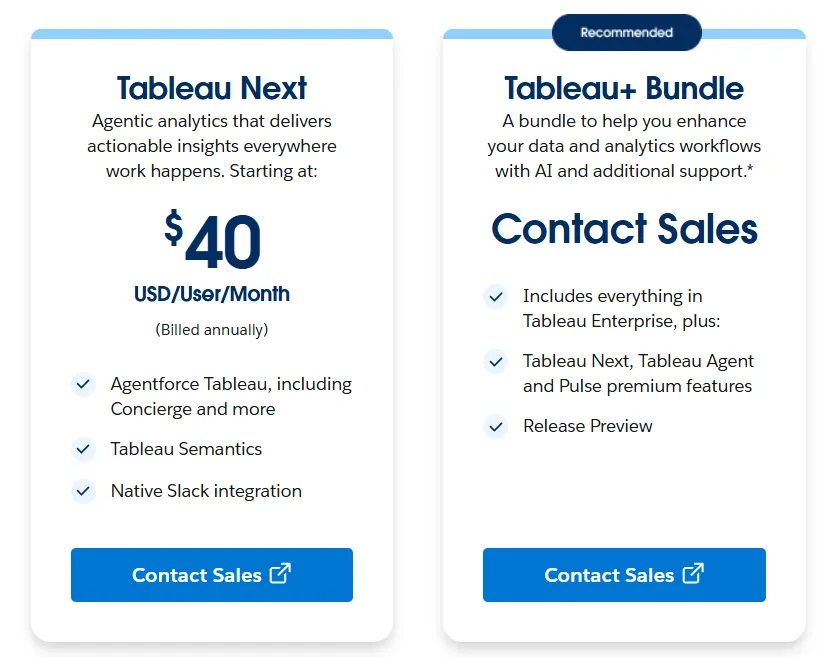
Tableau Pros and Cons
✅ Visualization depth is about as good as it gets.
✅ The community, training material, and certifications are enormous.
❌ Per-user pricing can scale fast for organizations rolling out broadly.
#3: Qlik Sense
Best for: Organizations exploring complex, interconnected data, especially regulated industries that favor on-prem deployments.
Similar to: Tableau, Power BI.
Qlik Sense’s associative engine is the headline: you can select any value and the entire model recomputes around it, surfacing connections a predefined drill path would keep hidden.
Add on-prem deployment to that, and it's easy to see why governed and regulated teams keep choosing it.
Qlik Sense's Top Features
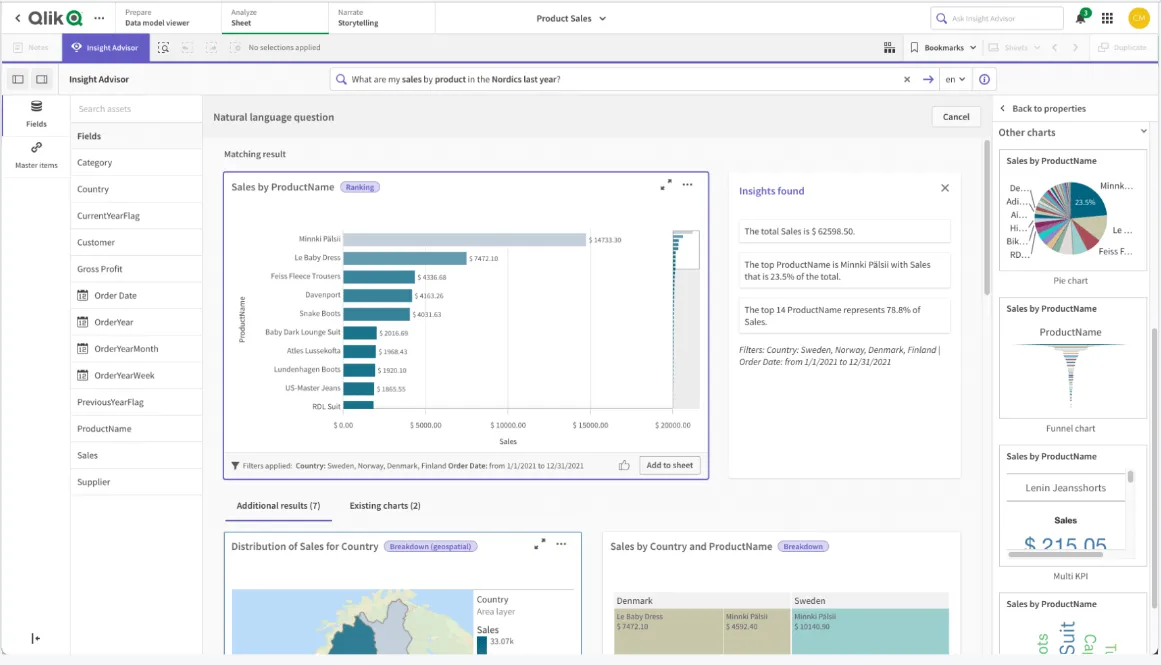
- Associative exploration: every selection recalculates the whole view in context, so you can wander the data in any direction.
- Insight Advisor: machine-generated insights, plain-language search, forecasting, and threshold alerts, all without a data-science team.
- Real-time alerts: Trigger notifications or downstream actions when monitored metrics cross defined thresholds.
Qlik Sense Pricing
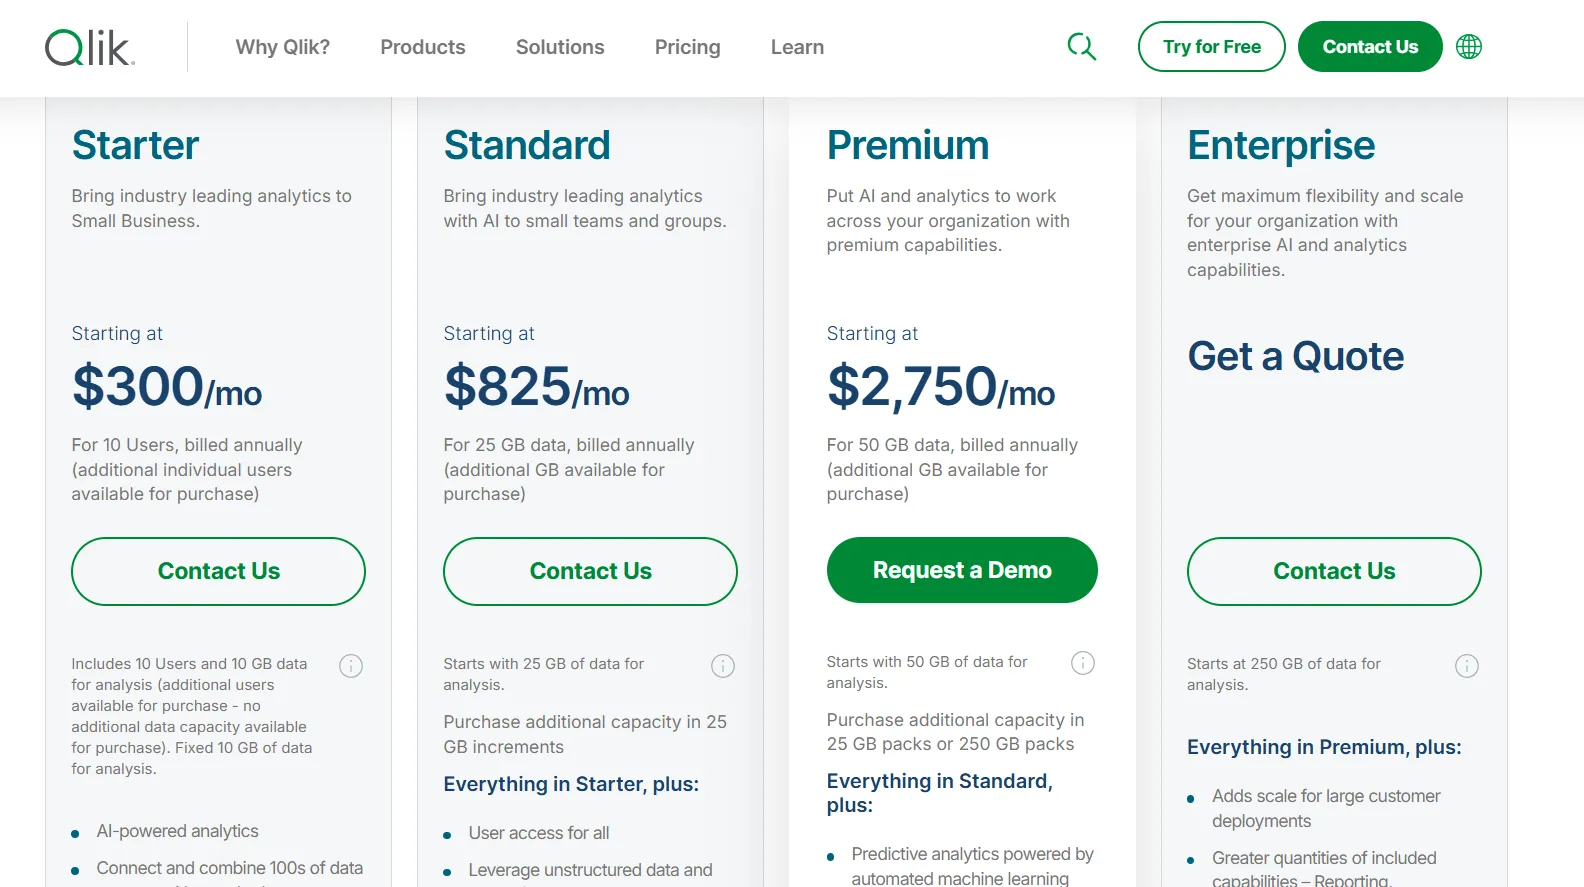
Qlik Cloud Analytics (the SaaS version of Qlik Sense) has four pricing tiers, all billed annually:
- Starter: $300/month, includes 10 users, 10 GB of data for analysis (fixed), AI-powered analytics, 100s of standard data source connectors, interactive dashboards, 5 GB max app size, and Qlik Community Support.
- Standard: $825/month, starts with 25 GB of data for analysis (additional capacity available in 25 GB increments), includes everything in Starter, plus user access for all, GenAI for unstructured data, managed and shared spaces, 1 GB of Personal Space, augmented advanced analytics, and 24x7 critical support.
- Premium: $2,750/month, starts with 50 GB of data for analysis (additional capacity in 25 GB or 250 GB packs), includes everything in Standard, plus predictive analytics powered by automated machine learning, additional GenAI capacity, anonymous access, SAP and Mainframe connectors, data lineage, 10 GB max app size, and guided customer success onboarding.
- Enterprise: Custom pricing, starts at 250 GB of data for analysis, includes everything in Premium, plus greater capacity for reporting, automations, machine learning models, and dataset size, 15 GB apps as standard (up to 50 GB per app available), 3 GB of Personal Space, multi-region tenants, and a personalized customer success plan.
Qlik Sense Pros and Cons
✅ Multi-dimensional exploration is where it shines.
✅ Well-suited to governed and on-prem environments.
❌ Its capacity-based pricing can scale up quickly as your data volume grows.
Get started with Dot for free
If you've reached the point where one more dashboard won't help, Dot starts somewhere different: with the analysis itself, not the chart that's supposed to imply it.
Here’s what you get with Dot:
- Questions asked in Slack or Teams, with answers and scheduled reports coming back in the same place, by email, or in the web app.
- Recurring reviews produced start to finish and sent on a schedule as PowerPoints.
- A Context Agent holding one set of metric definitions across the company.
- Footnotes on every answer that link back to the query and the underlying data.
- Direct connections to Snowflake, BigQuery, Redshift, Databricks, and other warehouses and databases.
- Reuse of your current dbt, Looker, and Power BI models, with nothing to migrate.
- SOC 2 Type II compliance and enterprise-grade access controls.
- Usage-based credit pricing, not per-seat licensing.
➡️ Get started for free with Dot's Starter plan, or schedule a demo to see how it works with your data.
⚠️ Disclaimer: This article was last updated on the 4th of June, 2026. If anything here has been misinterpreted, reach out, and we'll fact-check it.
Theo Tortorici
Theo writes about AI-powered analytics, data tools, and the future of business intelligence at Dot.