
10 Best Metabase AI Alternatives & Competitors In 2026
Are you looking for the best Metabase AI alternatives in 2026?
I'll walk you through the 10 best Metabase alternatives on the market, including what each one does well, and which one fits depending on how your team actually works with data.
TL;DR
- The best alternative to Metabase on the market is Dot, because it replaces the manual dashboard-and-interpret cycle with AI-driven analysis that delivers narrative insights, automated executive reports, and ad-hoc answers directly in Slack or Teams.
- If you need enterprise-grade visualization and exploration, Tableau and Looker are the strongest options, though both come with steeper learning curves and higher costs than Metabase.
- For teams that want to stay close to Metabase's simplicity but need better governance or AI, ThoughtSpot, Sigma, and Mode each fill a specific gap, while Domo and Zoho Analytics work well as all-in-one or budget-friendly alternatives.
Why do some teams switch away from Metabase?
Metabase does a lot right, and I want to be upfront about that.
It's one of the easiest BI tools to get running, the open-source version is genuinely free, and the visual query builder makes it accessible for people who don't write SQL.
But once you move past basic dashboards and light reporting, the same issues keep coming up.
1. AI capabilities that don't go far enough
Metabase's AI assistant, Metabot, is limited to basic query builder operations and single-level aggregation.
It can't handle complex expressions, multi-step analysis, or anything that requires real analytical reasoning.
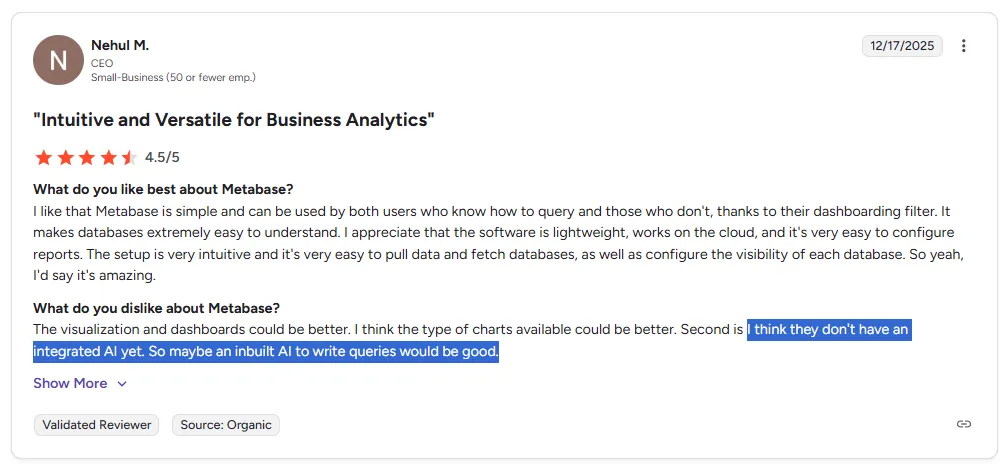
"I think they don't have an integrated AI yet. So maybe an inbuilt AI to write queries would be good." - G2 Review
And Metabot isn't even included by default.
It's a paid add-on that only works on cloud-hosted plans, meaning self-hosted users don't get AI assistance at all.
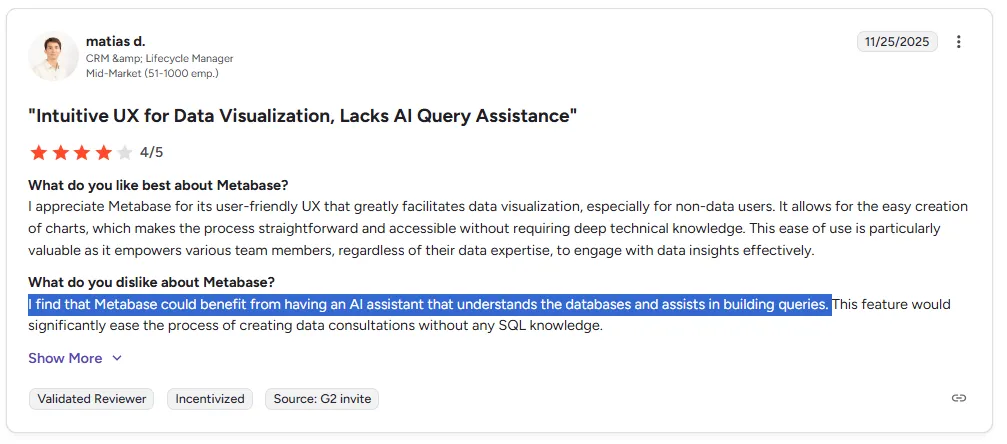
"I find that Metabase could benefit from having an AI assistant that understands the databases and assists in building queries." - G2 Review
For teams that expected Metabase's AI to handle real analytical questions, the gap between marketing and reality can be frustrating.
2. Analytics and visualization gaps
Metabase keeps things simple by design, but that simplicity comes at the cost of features that growing data teams need.
There's no predictive analytics, no benchmarking, and limited support for calculated fields and complex data models.
On the visualization side, users consistently call out the lack of customization.
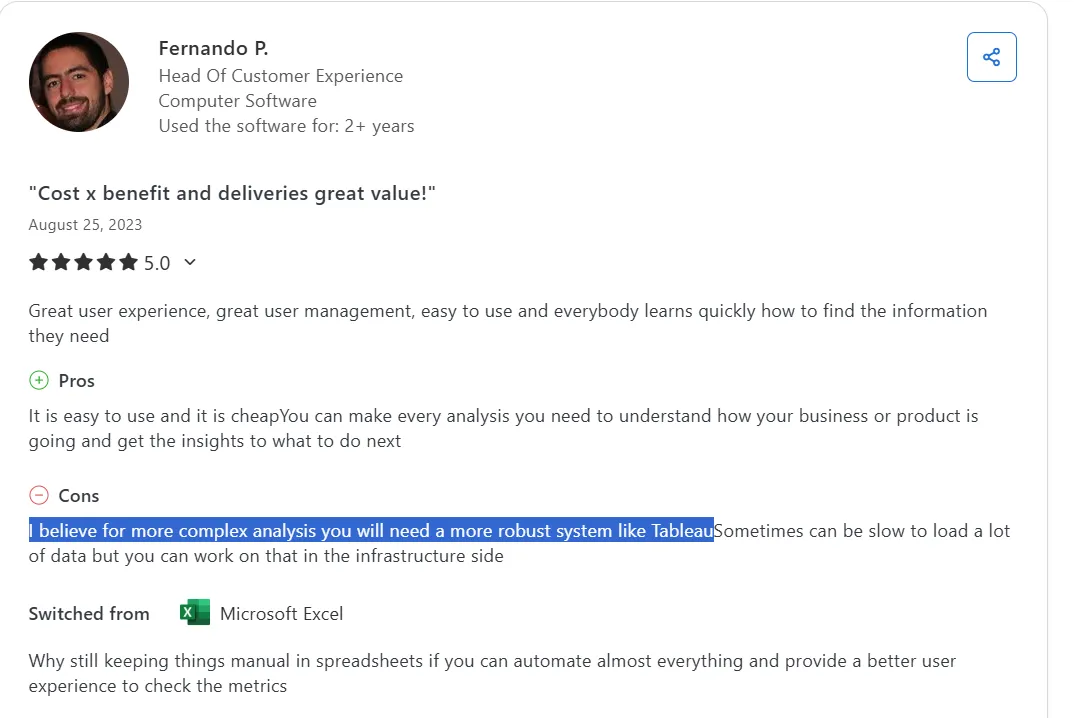
"I believe for more complex analysis you will need a more robust system like Tableau." - Capterra Review
3. Performance slows down as usage grows
This is the most common complaint across every review platform I checked.
Metabase runs on Java, which means it can get resource-heavy when complex queries or multiple users hit it at the same time.
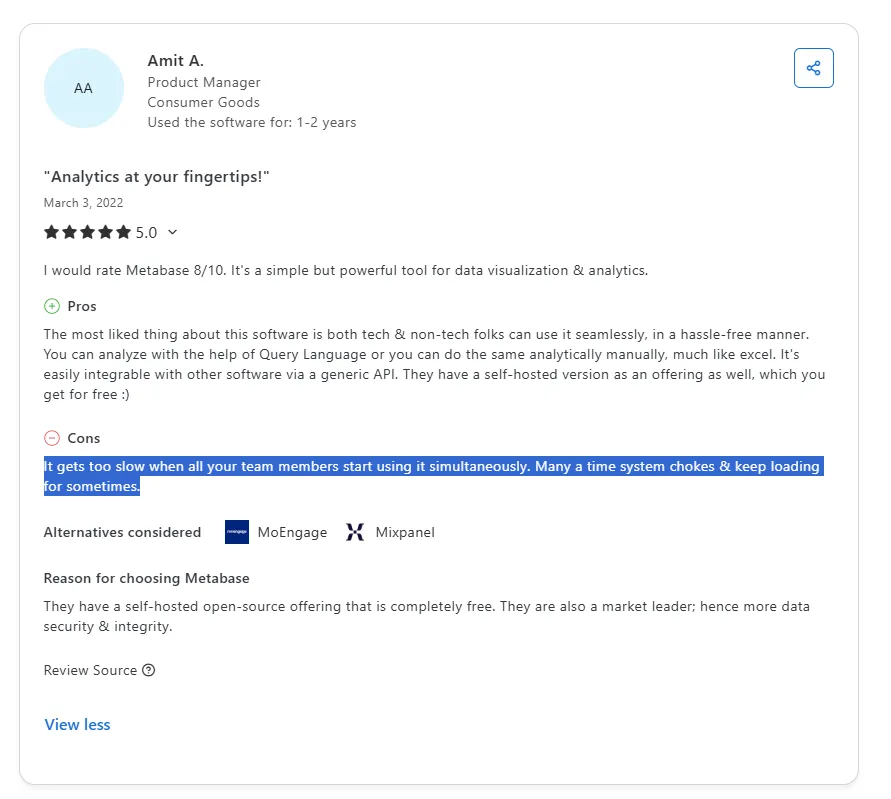
"It gets too slow when all your team members start using it simultaneously. Many a time system chokes and keeps loading." - Capterra Review
For teams that started small with Metabase and then scaled, the performance cliff hits hard.
Dashboards that used to load in seconds start taking 30 seconds or more when five people are querying at once.
What are the 10 best Metabase alternatives and competitors in 2026?
The best Metabase alternatives in 2026 are Dot, Tableau, and Looker.
The rest are as follows:
Tool | What it's best at | Pricing |
Dot | AI data analyst that delivers narrative insights, automated executive reports, and ad-hoc analysis from your warehouse | Free plan, paid from $699/mo |
Tableau | Advanced visual analytics and interactive dashboards for large, complex datasets | From $75/user/month |
Looker | Governed, warehouse-native BI with centralized semantic modeling for consistent metrics | Custom pricing (annual) |
ThoughtSpot | AI-powered self-service analytics with natural language search and automated dashboards | From $25/user/month |
Sigma | Spreadsheet-style analytics on live warehouse data for finance and ops teams | Custom pricing |
Mode | SQL-first analytics combining queries, Python and R notebooks, and reporting in one workflow | Free plan, paid at custom price |
Domo | All-in-one cloud BI with data integration, dashboards, and AI-driven automation | Custom pricing (30-day trial) |
Zoho Analytics | Budget-friendly BI with dashboards, AI features, and strong Zoho ecosystem integration | From $60/month |
Omni | Modern BI with a flexible semantic layer, governed metrics, and self-service exploration | Custom pricing |
Qlik Sense | Associative analytics engine for exploring complex data relationships beyond predefined queries | Custom pricing |
#1: Dot
Dot (that’s us!) is the best alternative to Metabase in 2026 for data teams and business leaders who need actual analysis from their data, not just another dashboard to interpret.
Unlike Metabase, which requires you to build dashboards and manually figure out what the numbers mean, Dot connects to your warehouse and thinks for you, delivering written explanations, recommendations, and automated reports.
Let's look at the features that make Dot a strong Metabase alternative. 👇
Ad-hoc data analysis via Slack or Teams
Metabase works fine when you already know which dashboard to check and which filters to apply.
But most real business questions aren't that simple.
Someone asks "Why did conversion drop last week?" and the answer usually means opening three dashboards, adjusting filters, and then asking an analyst to explain what they're seeing.
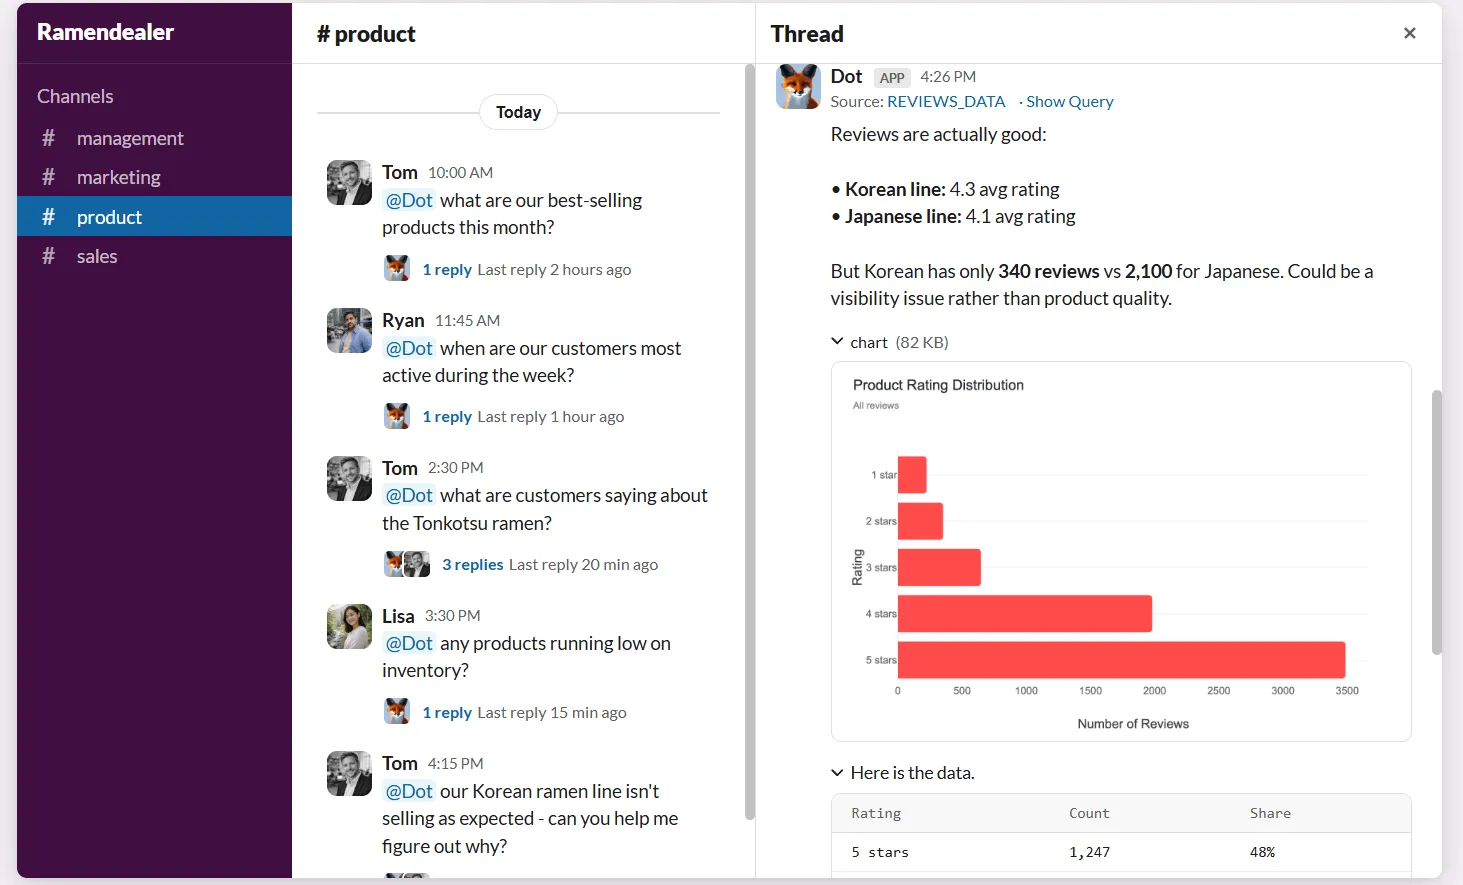
Dot cuts that loop entirely.
Unlike Metabase, where non-technical users still depend on pre-built dashboards or SQL-writing colleagues, any stakeholder can ask a plain-English question in Slack or Microsoft Teams and get a full analysis back in minutes.
The response goes beyond raw numbers.
It explains what happened, why it likely happened, and which segments or regions are driving the change.
For data teams, this absorbs the flood of ad-hoc requests that normally interrupt deeper work, while business users stop waiting in the queue.
Persistent business context and shared definitions
Even when everyone is using the same tool, there’s no guarantee they’re using the same logic.
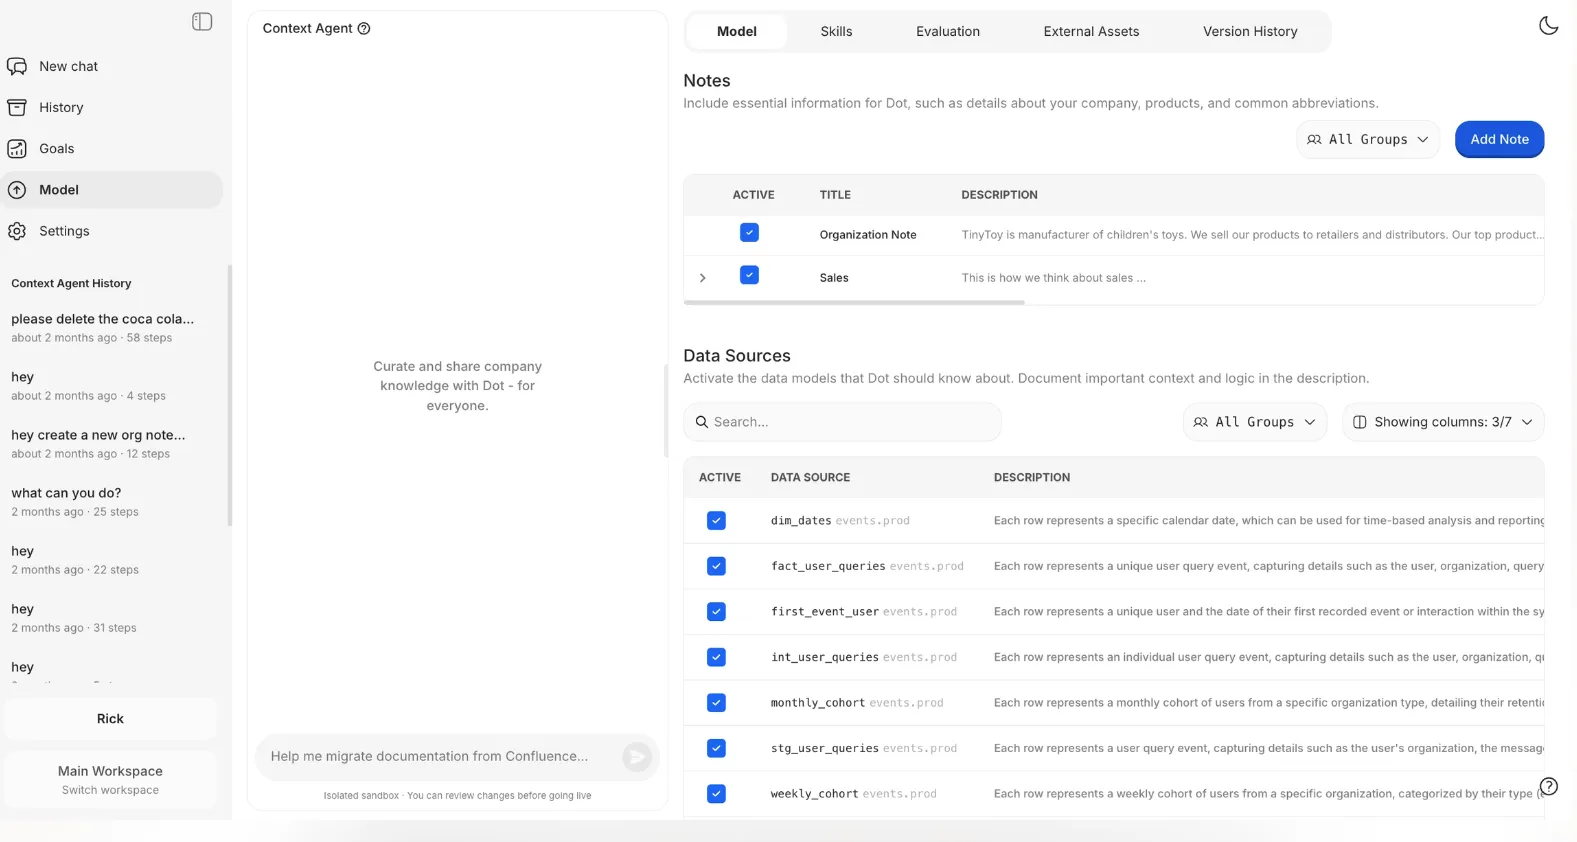
Dot addresses this with a Context Agent that learns and maintains business definitions, metric logic, and documentation across your data environment.
Dot solves this with a Context Agent that learns and maintains business definitions, metric logic, and documentation across your entire data environment.
It tracks how key metrics are calculated, which tables should be used, and how different teams describe the same concepts, then applies that context every time it generates an insight.
In practice, people stop arguing about "Which number is right?" because every answer is grounded in the same shared understanding of the business.
Automated business review reports
Many teams use Metabase to prepare weekly or monthly reports for leadership.
In reality, that means analysts spend hours refreshing dashboards, screenshot-exporting charts into slides, and then manually explaining what changed.
The dashboard shows numbers, but the actual analysis still lives in someone's head.
Dot automates the full business review, not just the visuals.
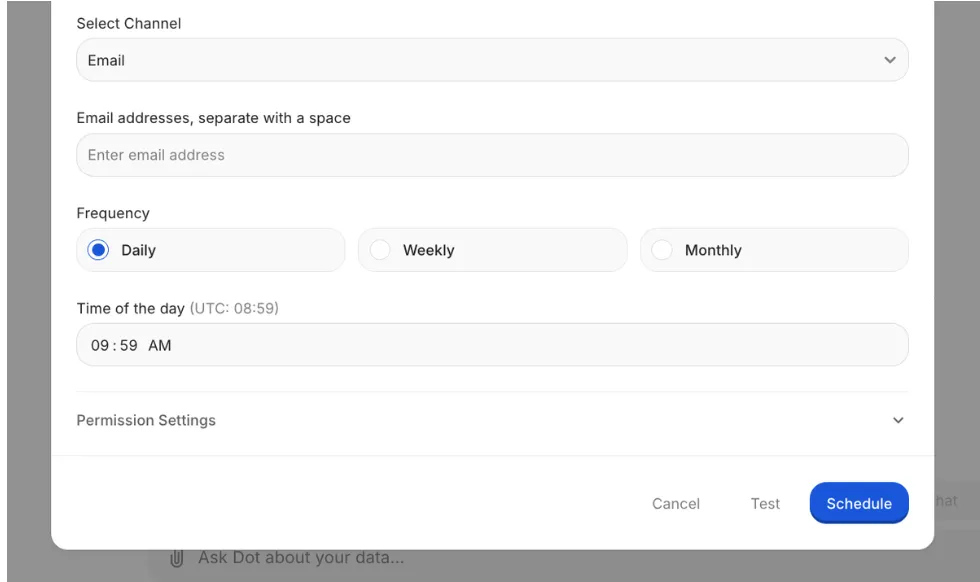
It generates executive-ready reports on a schedule (daily, weekly, or monthly) directly from your warehouse and turns raw data into a written narrative that covers what happened, what shifted from previous periods, and where action is needed.
Leadership gets a clear, easy-to-read business update without interpreting dashboards, and data teams reclaim hours every week.
Full audit trail for every insight
Metabase dashboards show you the numbers, but they don't always show you how those numbers were produced.
If something looks off, teams end up digging through SQL queries, asking the person who built the report, or just guessing.
Dot takes the opposite approach.
Every insight links back to the exact SQL queries, Python logic, and datasets used to produce it.
There's no black box.
This matters for data leaders who need to stand behind the numbers and for analysts who want to verify results before they reach the executive team.
How does Dot compare to Metabase?
Metabase is built to help teams explore data and build dashboards quickly, especially smaller teams that want something lightweight and open-source.
However, Dot isn't a dashboarding tool at all.
It's an AI analyst that sits on top of your data warehouse and handles the analysis work that Metabase leaves to humans.
The key difference: Metabase shows data, Dot explains it.
Where Metabase requires someone to build and interpret dashboards, Dot answers questions in natural language, generates written narratives, and delivers recommendations, all without anyone touching a query builder.
Where Metabase's Metabot handles only basic single-level aggregation, Dot runs deep multi-step analysis, compares segments, identifies root causes, and surfaces anomalies across your data.
And where Metabase has no governance layer, Dot's Context Agent keeps metric definitions consistent across every team and every insight.
Dot’s integrations
Dot is designed to work on top of the tools teams already use, rather than forcing data into a new BI-specific model.
It connects directly to modern data warehouses like Snowflake, BigQuery, Redshift, Databricks, and even operational databases such as Postgres, MySQL, and SQL Server, so analysis happens where the data already lives.
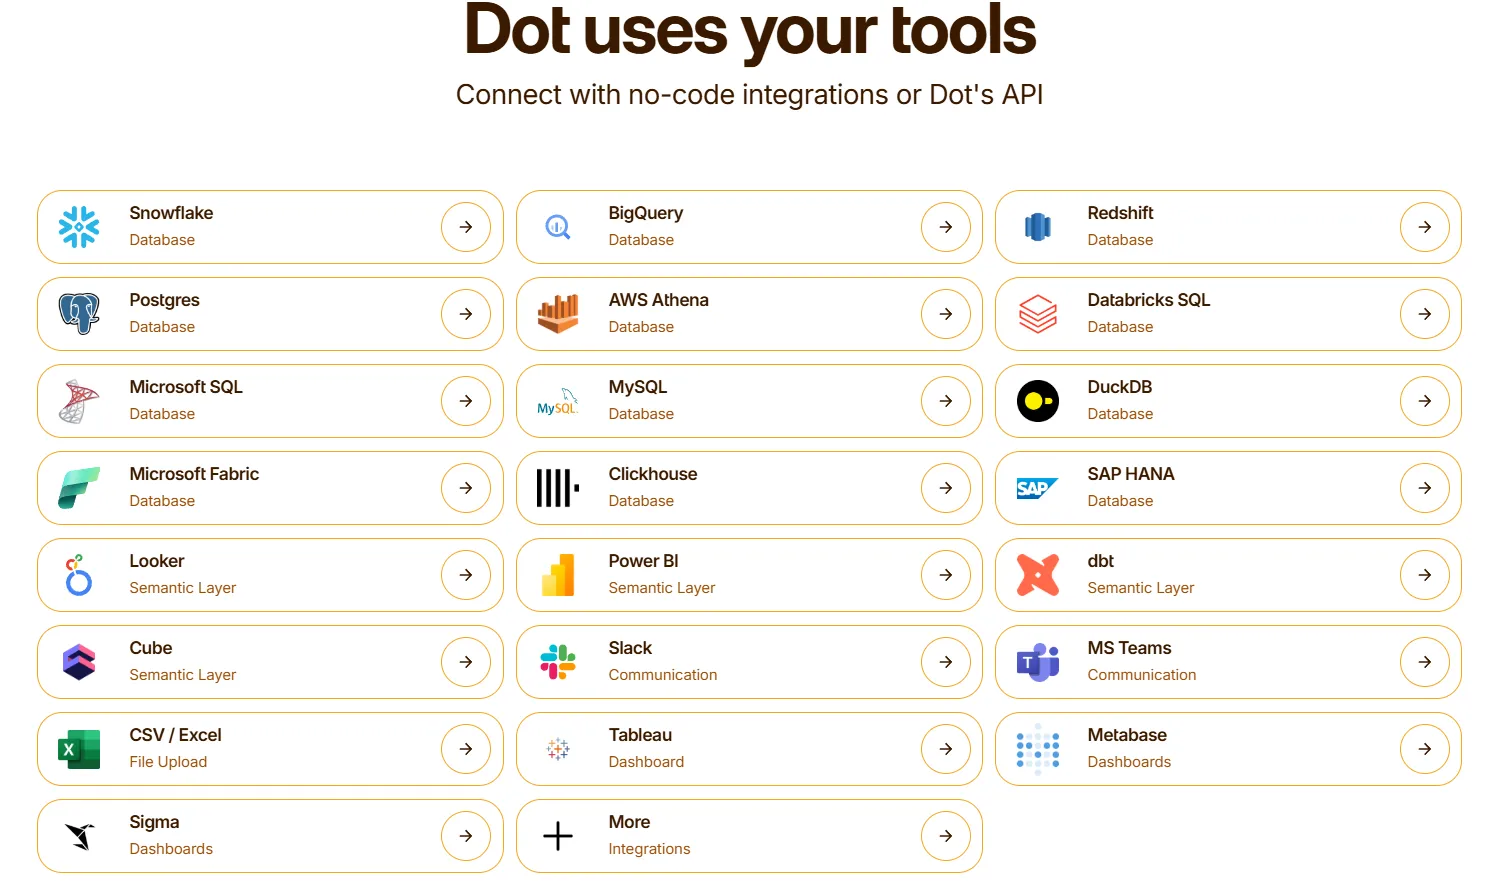
Beyond raw data access, Dot also integrates with semantic layers and transformation tools like dbt, Looker, Power BI models, and Cube.
That means it can reuse existing business logic and metric definitions instead of recreating them inside yet another analytics tool, which is a common pain point with traditional BI setups.
Dot also fits naturally into day-to-day workflows by delivering insights through Slack, Microsoft Teams, email, and the web app, rather than asking users to log into dashboards.
Moreover, it can sit alongside existing BI tools like Tableau, Metabase, or Sigma, complementing them rather than replacing everything overnight.
The end result is analytics that stay connected to the warehouse, respect existing data work, and show up where decisions actually happen.
Pricing
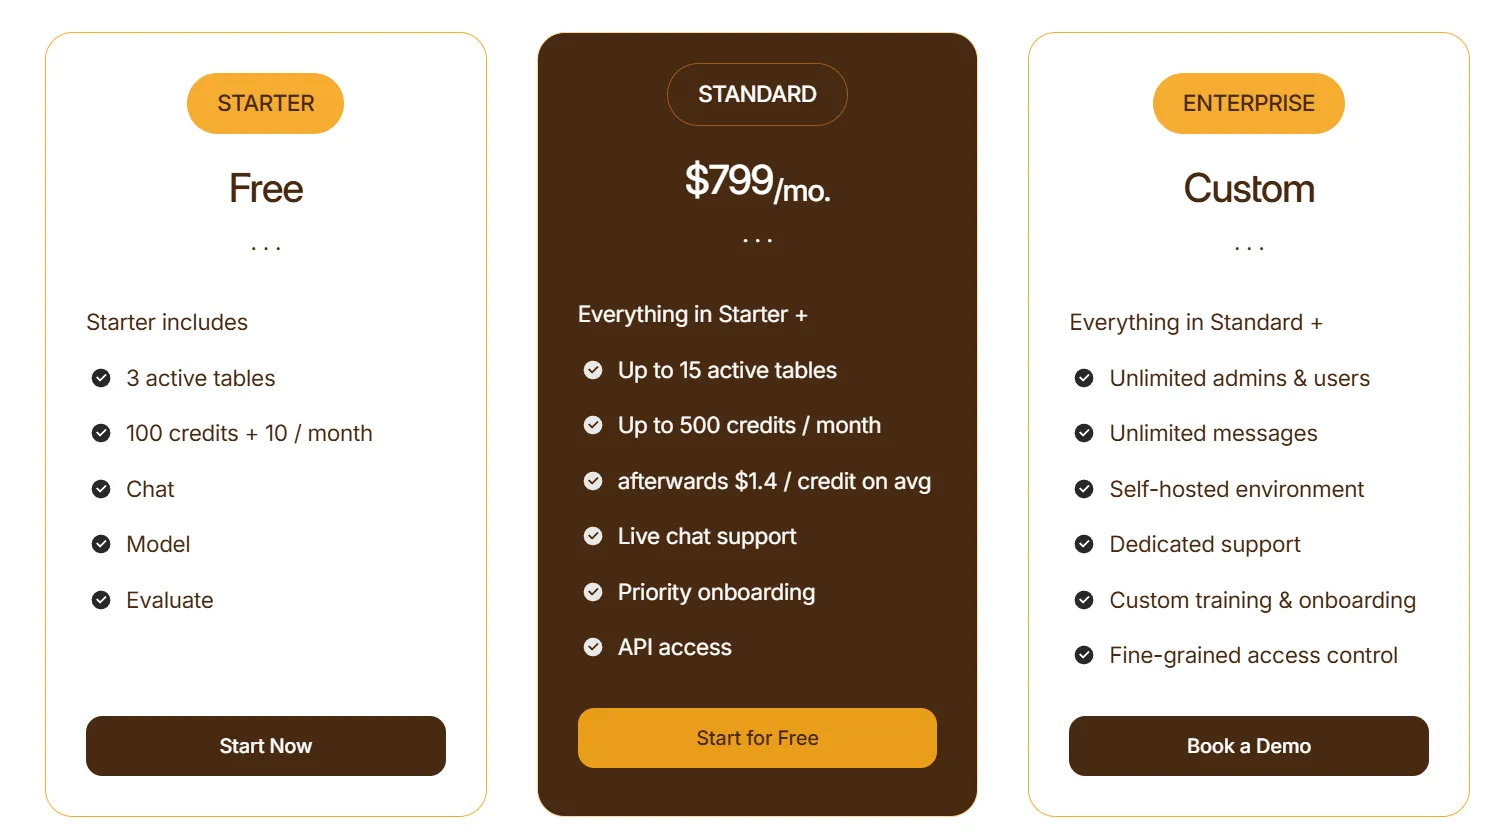
Dot uses a credit-based pricing model, with plans designed to scale from early experimentation to enterprise-wide usage:
- Starter: Free plan that lets you get started without committing, includes 3 active tables, 100 credits and 10 credits per month, chat-based analysis, and model and evaluation access.
- Standard: $699/month when billed annually, includes everything in Starter, up to 15 active tables, up to 500 credits per month, additional credits at $1.40 per credit, live chat support, priority onboarding, and API access.
- Enterprise: Custom pricing, includes everything in Standard, unlimited users and admins, unlimited messages, self-hosted environment, dedicated support, custom onboarding and training, and fine-grained access controls.
Pros & Cons
✅ Delivers clear explanations and recommendations in minutes via Slack or Teams.
✅ Shared business context and definitions reduce metric drift and “which number is right?” debates across teams.
✅ Full audit trail on every insight, with transparent links to underlying SQL, logic, and datasets.
✅ Architecture that works directly on modern data stacks without copying or reshaping data.
✅ Flexible pricing structure based on usage rather than per-seat licensing.
❌ Not a traditional BI or dashboarding tool, which may be a drawback for teams that rely heavily on custom visuals.
#2: Tableau
Best for: Data teams that need advanced visualization, exploratory analysis, and flexible deployment across cloud and on-prem environments.
Similar to: Looker, Qlik Sense.
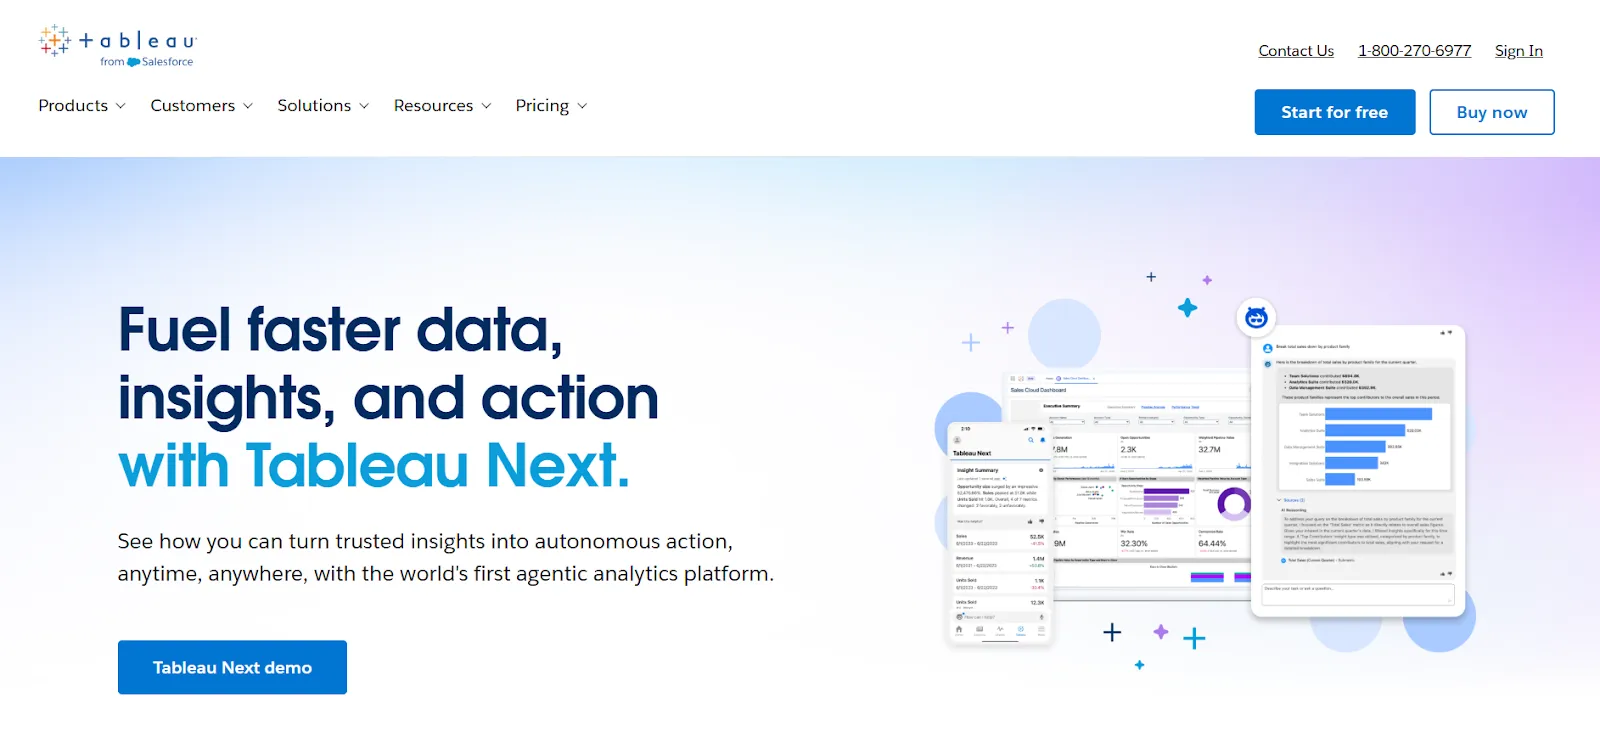
Tableau is the industry standard for visual analytics, known for its drag-and-drop exploration and rich charting capabilities.
Where Metabase keeps things minimal, Tableau gives analysts deep control over how data is presented and explored.
Tableau's Top Features
- Advanced visual analytics and exploration: Build highly interactive dashboards using VizQL, rich chart types, and drill-downs to find patterns in large datasets.
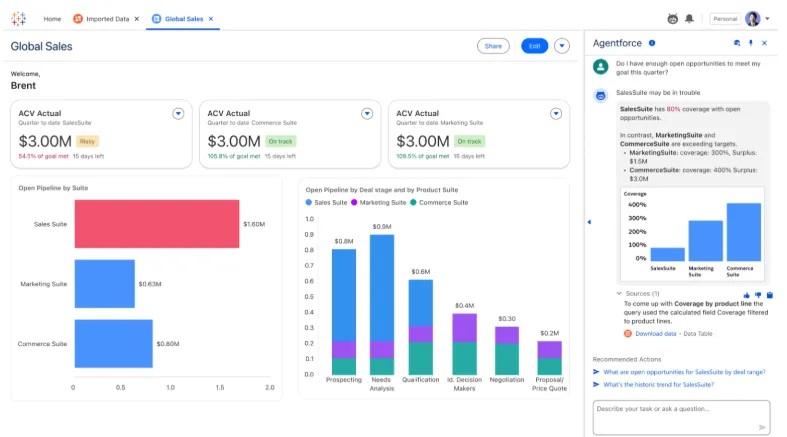
- Agentic analytics with Tableau Next: AI-powered agents that surface insights, answer natural-language questions, and trigger actions inside Slack and Salesforce workflows.
- Centralized governance and security: Supports data governance, security controls, and reusable metrics through Tableau Pulse and Data Management for large-scale deployments.
Tableau Pricing
Tableau uses per-user, per-month pricing, with separate plans depending on whether you deploy Tableau in the cloud, on your own servers, or as part of its newer AI-driven offering:
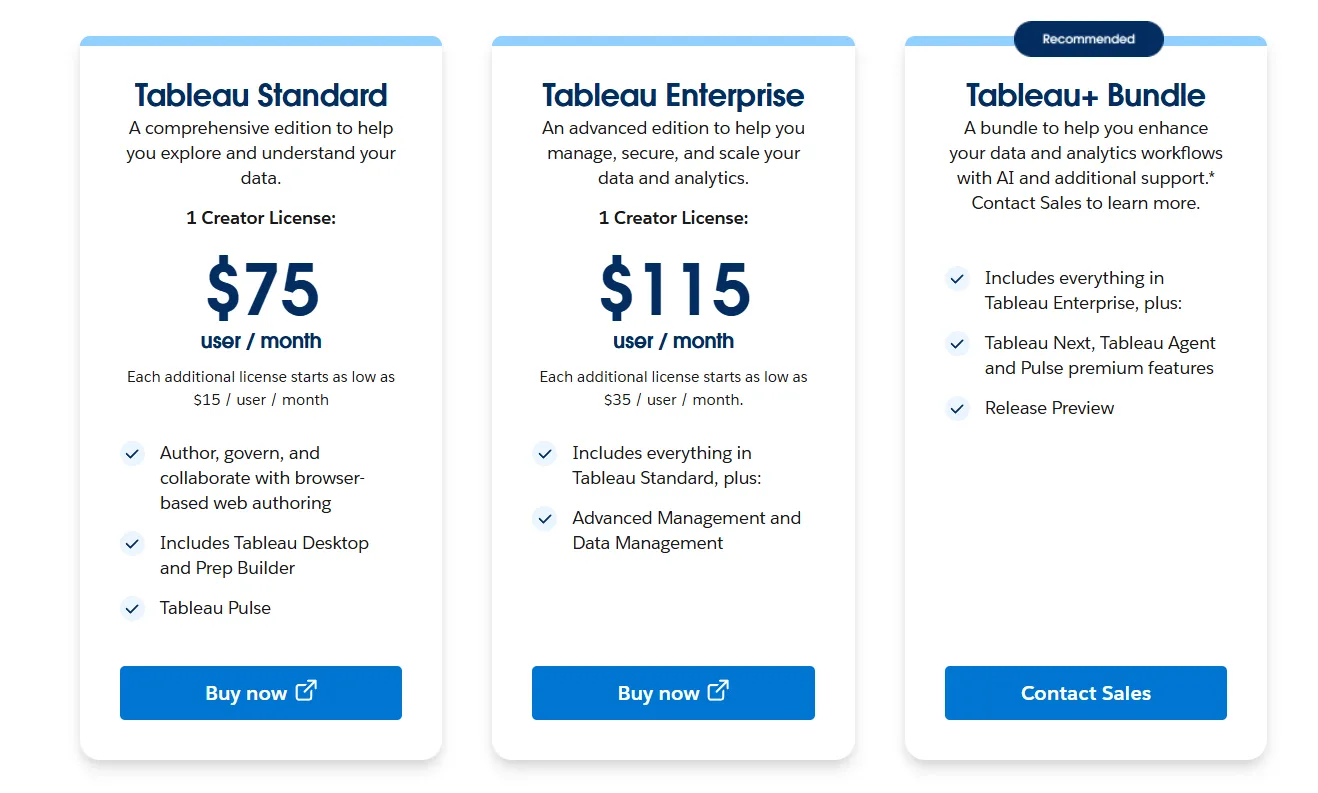
- Tableau Cloud has three pricing plans:
- Tableau Standard: $75 per 1 creator per month, with each additional license from $15 per user/month, includes browser-based authoring and collaboration, Tableau Desktop and Prep Builder, Tableau Pulse for metrics and insights.
- Tableau Enterprise: $115 per 1 creator per month, with each additional license from $35 per user/month, includes everything in Standard, plus Advanced Management and Data Management for governance and scale.
- Tableau+ Bundle (Cloud + AI): Custom pricing, includes everything in Tableau Enterprise, plus Tableau Next, Tableau Agent, and Pulse premium features, with access to release previews and early AI capabilities.
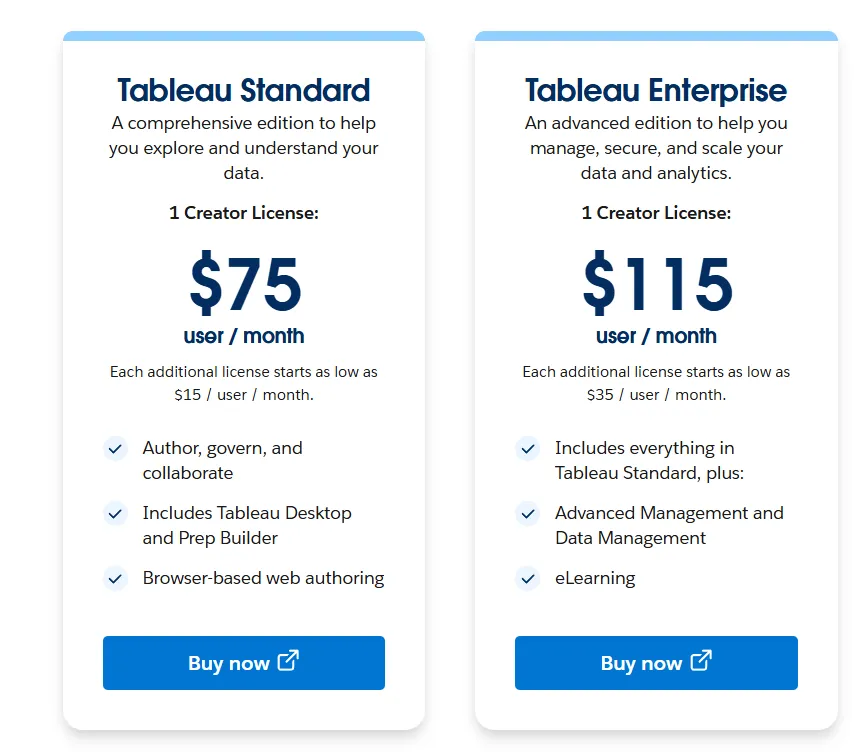
- Tableau Server has two pricing plans:
- Tableau Standard: $75 per 1 creator per month, with each additional license from $15 per user/month, includes authoring, governance, and collaboration and Tableau Desktop and Prep Builder.
- Tableau Enterprise: $115 per 1 creator per month, with each additional license from $35 per user/month, includes everything in Standard, plus Advanced Management, Data Management, and eLearning.
- Tableau Next (agentic analytics): Requires an annual contract, includes agentic analytics via Agentforce, Tableau Semantics, Tableau Pulse (including premium), and Data 360.
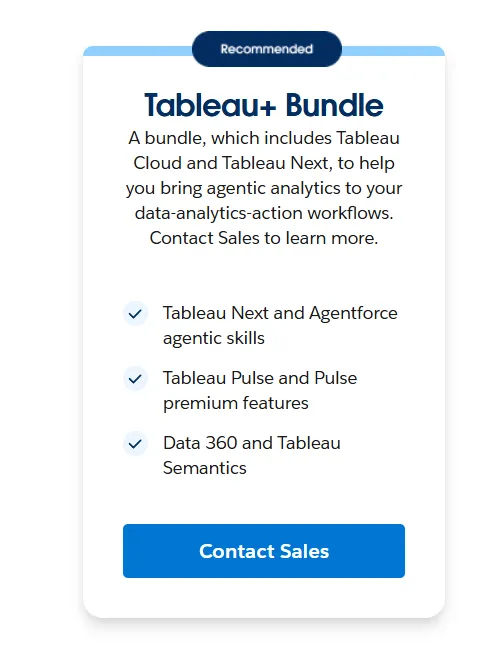
Tableau Pros and Cons
✅ Best-in-class data visualization and storytelling capabilities, unlike tools likeMicrosoft Power BI that lock advanced features behind premium licensing tiers.
✅ Drag-and-drop analysis that lets users explore data and iterate quickly without writing code.
❌ Per-user pricing adds up fast for larger teams.
#3: Looker
Best for: Data teams looking to get governed, warehouse-native BI with consistent metrics across every dashboard and report.
Similar to: Sigma, Omni.
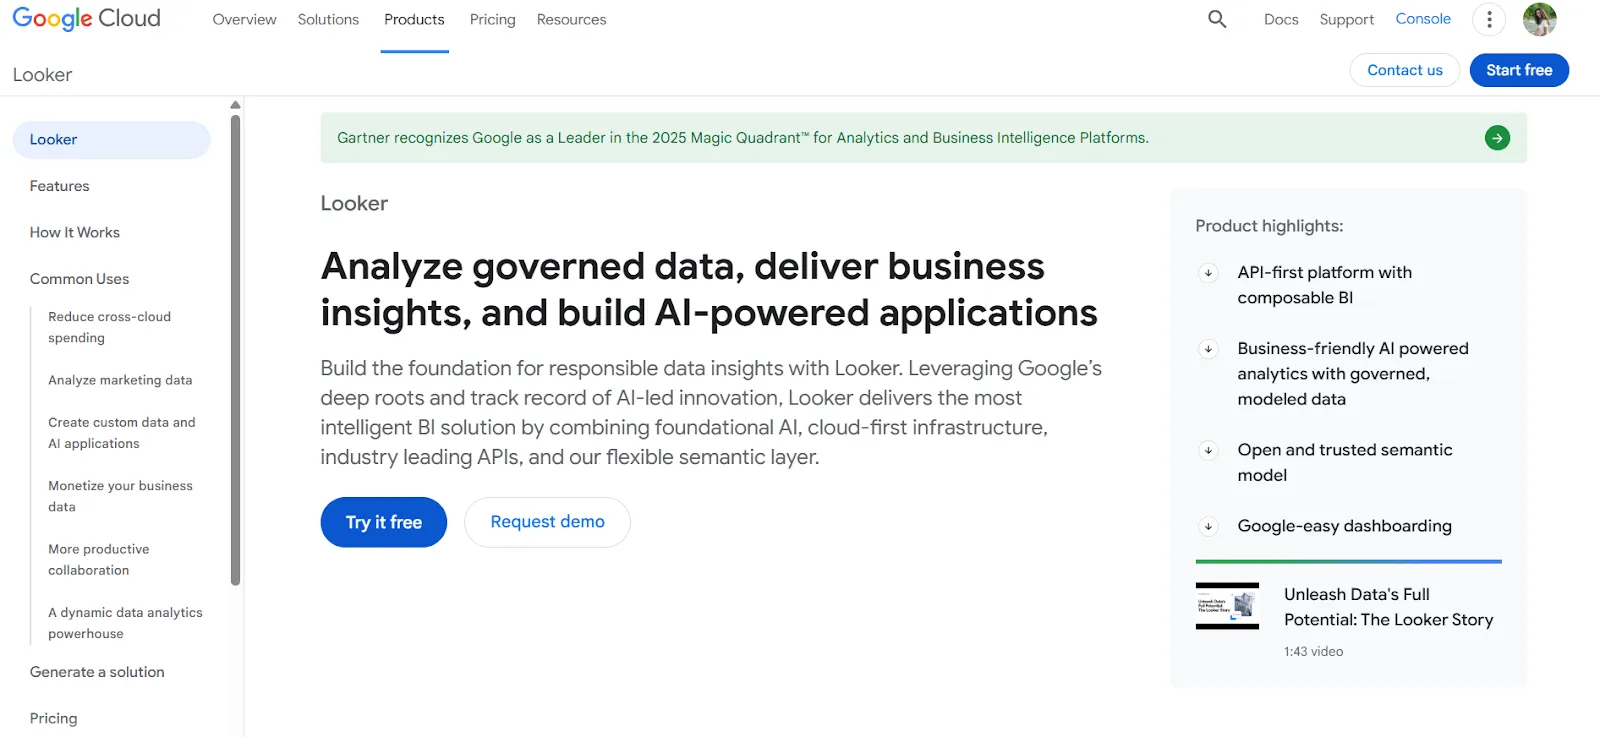
Looker is built around LookML, a semantic modeling language that defines business metrics in one place and applies them everywhere.
It's the opposite of Metabase's "quick and easy" approach, prioritizing consistency and governance over speed of setup.
Looker's Top Features
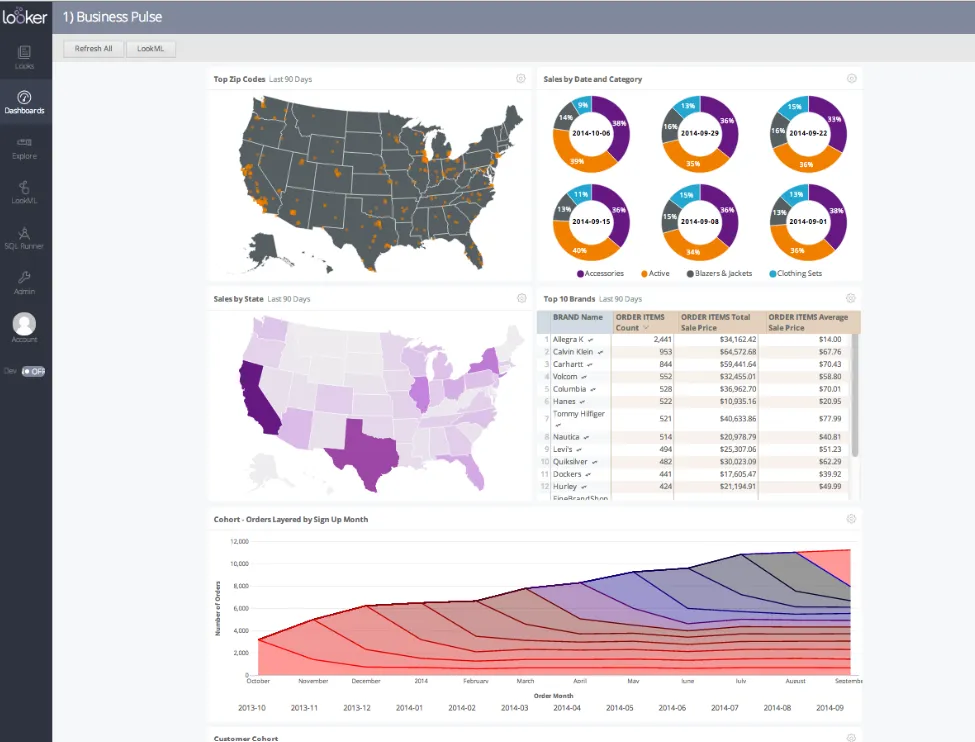
- Centralized semantic modeling with LookML: Define metrics and business rules once, so everyone across the company sees the same numbers in every report.
- Conversational analytics powered by Gemini: Users can ask natural-language questions and get answers without navigating dashboards.
- Real-time, governed dashboards: Dashboards pull live from the warehouse, with no stale extracts or manual refreshes.
Looker Pricing
Looker uses a custom, contract-based pricing model made up of two parts: platform pricing (the cost of running a Looker instance) and user licensing (the cost per user type).
Pricing is annual for all plans.
- Platform editions:
- Standard: Designed for small teams or organizations with fewer than 50 users, includes 1 production instance, 10 standard users + 2 developer users, up to 1,000 query-based API calls/month, and up to 1,000 admin API calls/month.
- Enterprise: Built for larger internal BI and analytics use cases, includes everything in Standard, plus enhanced security features, up to 100,000 query-based API calls/month, and up to 10,000 admin API calls/month.
- Embed: Designed for embedding analytics into external products or applications, includes everything in Standard, plus up to 500,000 query-based API calls/month and up to 100,000 admin API calls/month.
- User licensing:
- Developer users: Full access to Looker, including LookML development, administration, APIs, and advanced tooling.
- Standard users: Can explore data, build dashboards and reports, run SQL, and schedule content.
- Viewer users: Read-only access to dashboards and reports, with filtering and drill-down.
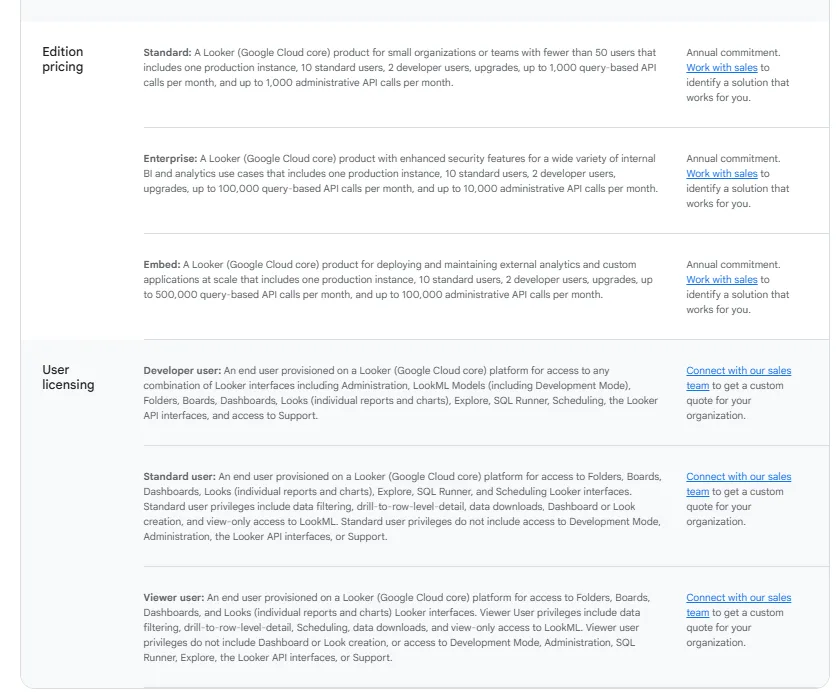
Pricing is custom on all plans and varies based on scale, permissions, and usage.
Looker Pros and Cons
✅ Keeps metrics consistent across every team and dashboard.
✅ Strong embedding capabilities for internal tools and customer-facing products.
❌ Steep learning curve, especially for teams without LookML experience, which is why some data teams have been looking forLooker alternatives.
❌ Custom pricing with annual contracts makes it hard to evaluate costs upfront.
#4: ThoughtSpot
Best for: Enterprises looking to get AI-driven, self-service analytics where anyone can search data in plain language and get instant answers.
Similar to: Dot, Sigma.
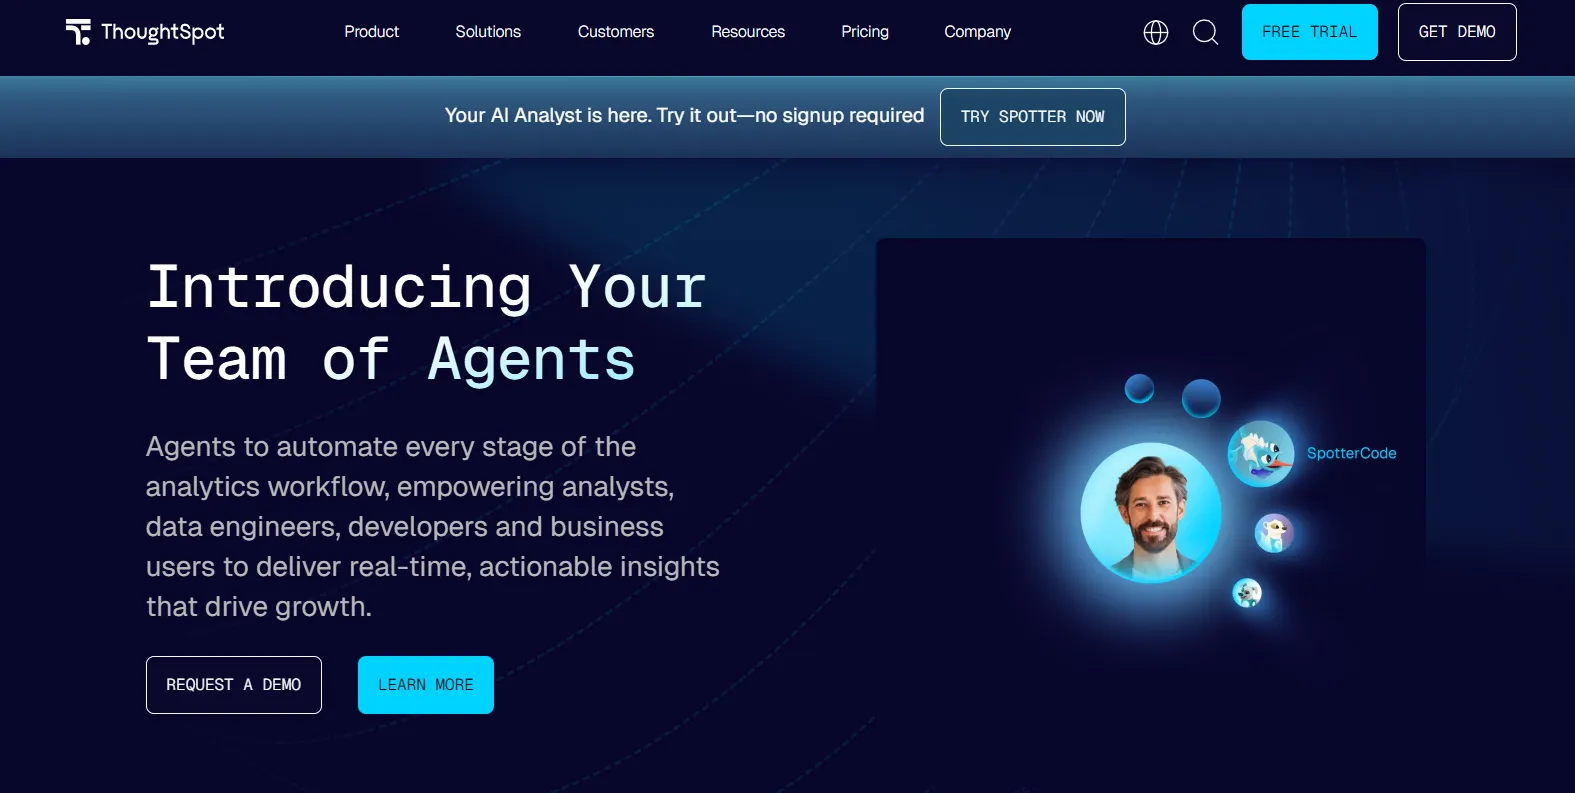
ThoughtSpot is built around a search-first experience, letting users type questions and get AI-generated charts and explanations in seconds.
It's a strong pick for teams that want to move beyond Metabase's basic Metabot without switching to a full dashboard-building platform.
ThoughtSpot's Top Features
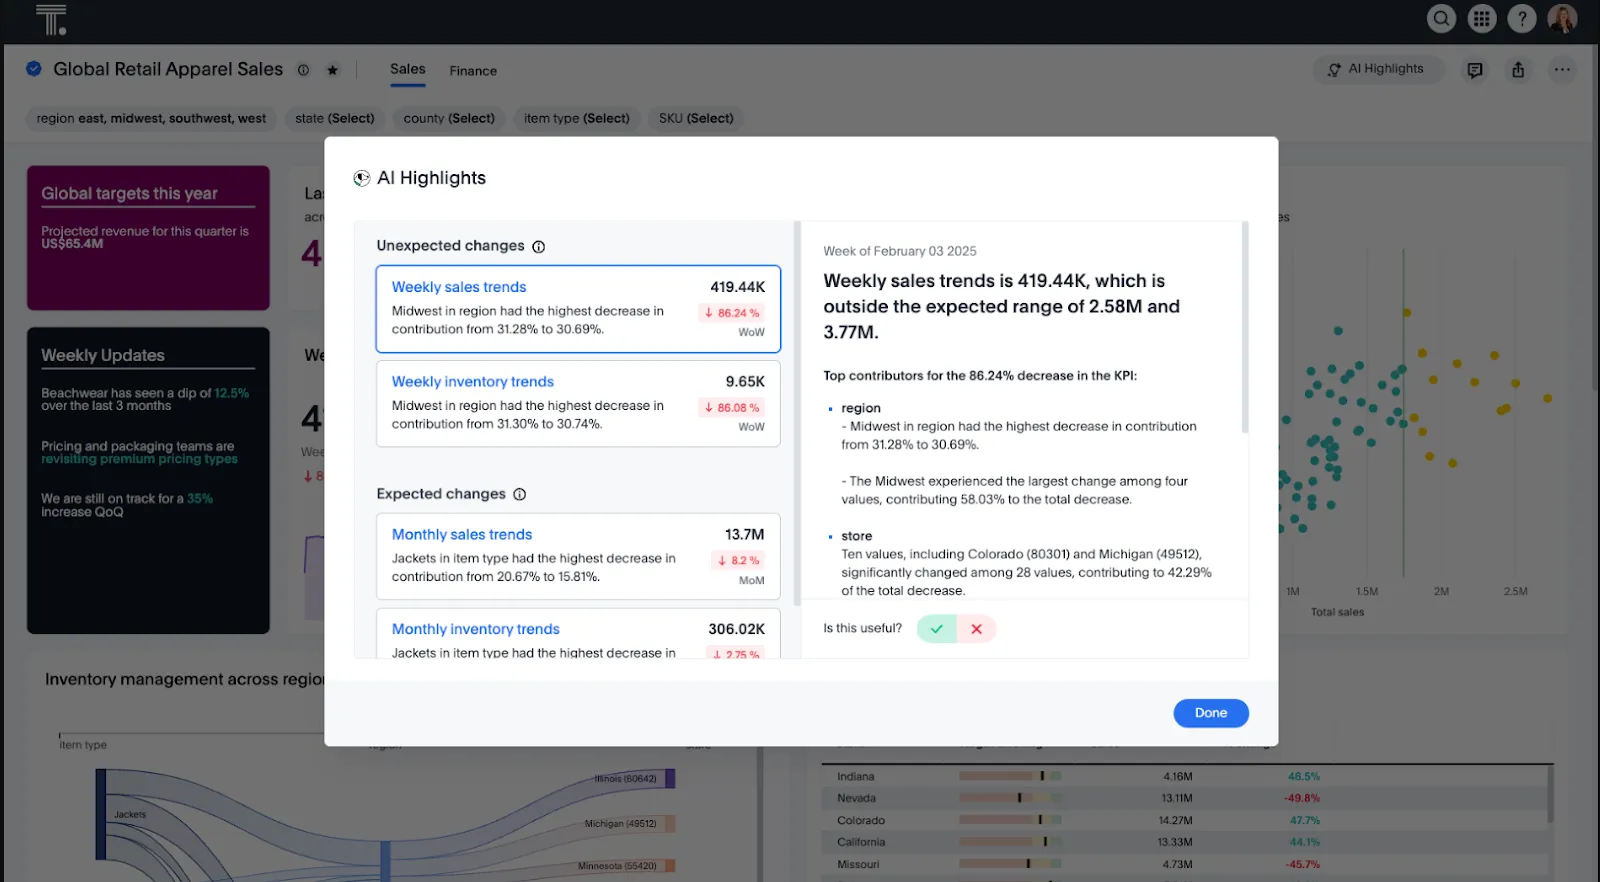
- Natural language analytics: Ask questions in plain English and get instant, governed answers from live data without building dashboards.
- AI agents (Spotter): Agentic tools that automatically generate analyses, dashboards, and insights, even from unstructured data.
- Automated dashboards with SpotterViz: Data turns into complete, styled dashboards without manual layout or chart configuration.
ThoughtSpot Pricing
ThoughtSpot offers two separate products - ThoughtSpot Analytics for internal BI and ThoughtSpot Embedded for building analytics into applications - each with flexible pricing depending on scale and usage:
- ThoughtSpot Analytics:
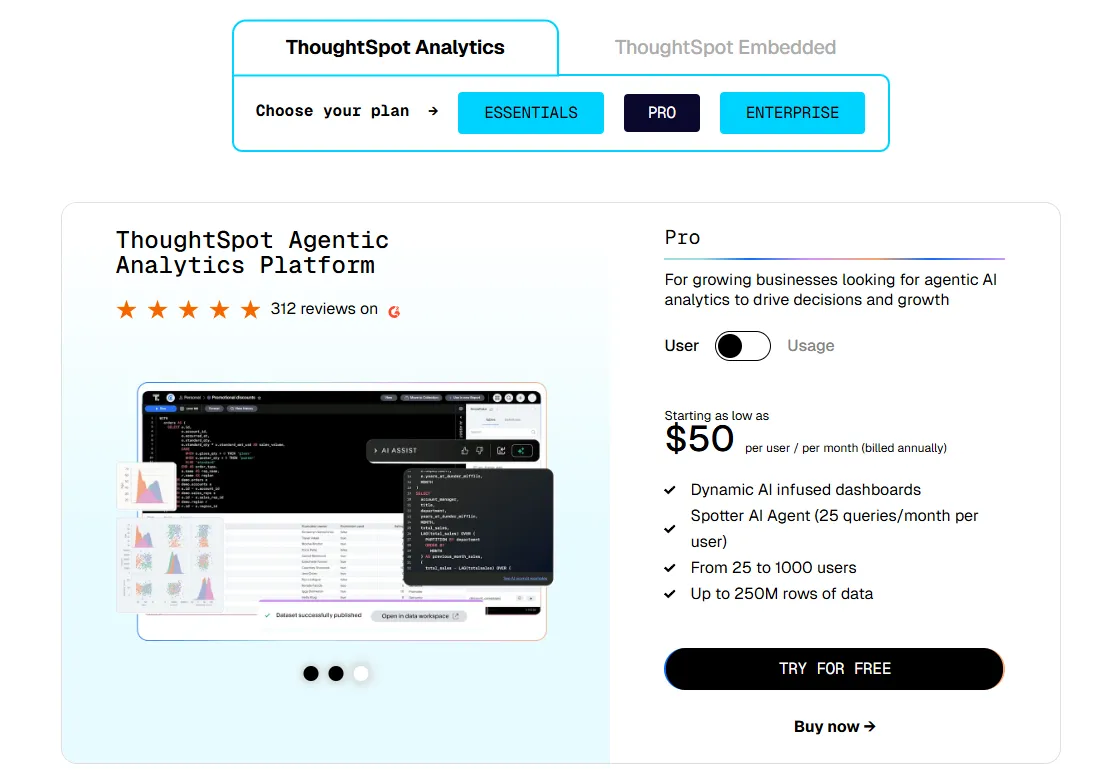
- Essentials: From $25 per user per month (billed annually), for teams of 5-50 users, includes dynamic interactive dashboards and AI-powered insights and supports up to 25M rows of data.
- Pro (per user pricing): From $50 per user per month (billed annually), for 25–1,000 users, includes everything in Essentials, plus AI-infused dashboards and Spotter AI Agent (25 queries per user/month), and supports up to 250M rows of data.
- Pro (usage-based): From $0.10 per query, includes everything in Pro per user, and adds Analyst Studio.
- Enterprise (user or usage-based): Custom pricing, includes everything in Pro, plus unlimited users and data.
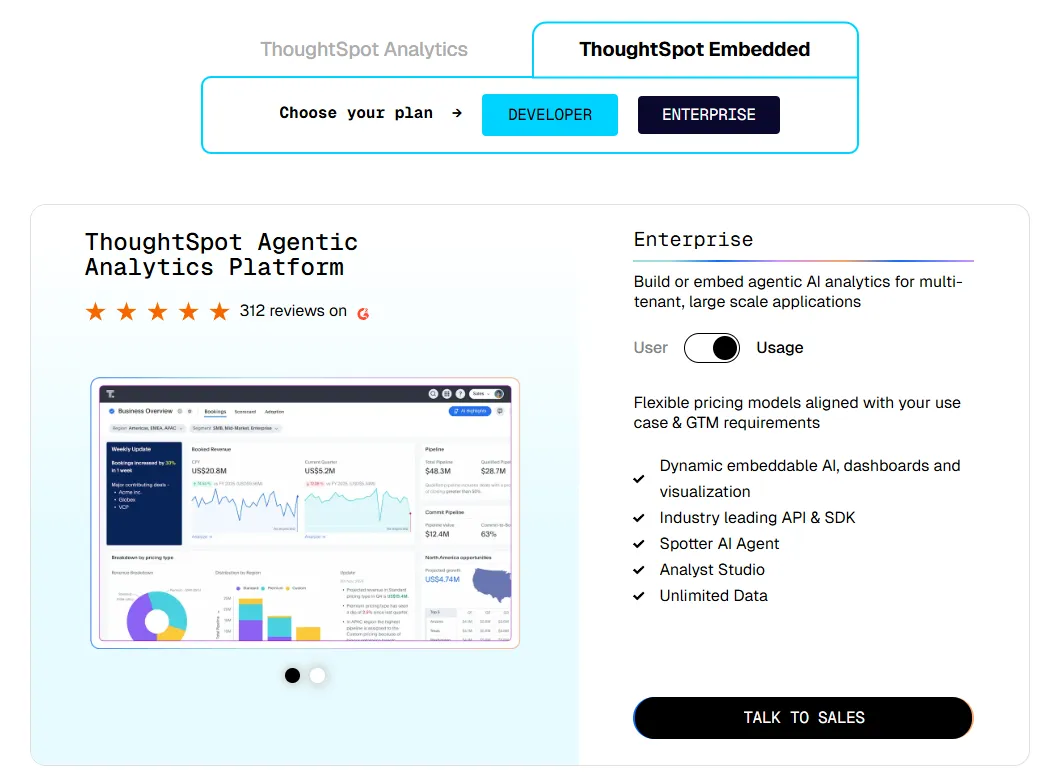
- ThoughtSpot Embedded:
- Developer: Free for 1 year, includes embeddable AI analytics, dashboards, and visualizations, APIs and SDKs, up to 10 users and 25M rows of data.
- Enterprise (user-based): Custom pricing, includes everything in Developer, plus unlimited data.
- Enterprise (usage-based): Custom pricing, everything in Enterprise, plus Spotter AI Agent and Analyst Studio.
ThoughtSpot Pros and Cons
✅ Easy for non-technical users thanks to natural language search and guided analytics, unlike more technical tools likeMindsDB.
✅ Built-in AI surfaces patterns and explanations faster than traditional dashboards.
❌ Custom and usage-based pricing makes costs harder to predict at scale.
❌ AI-generated answers can sometimes miss context without careful semantic layer setup.
#5: Sigma
Best for: Teams that want to analyze live warehouse data using a familiar spreadsheet interface, without exporting to Excel or learning SQL.
Similar to: Mode, Looker.
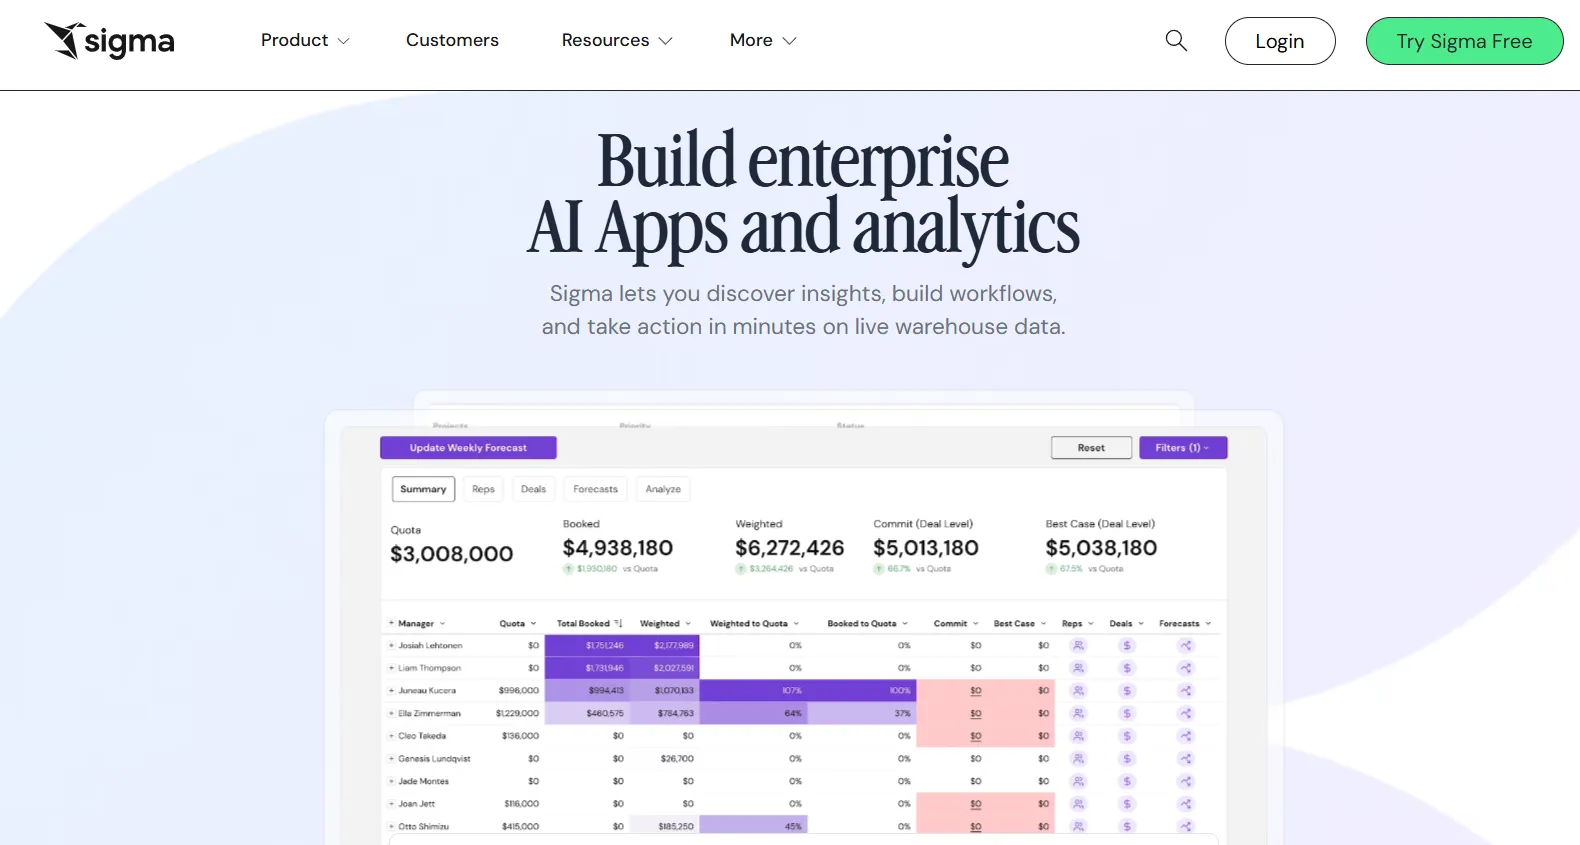
Sigma connects directly to your cloud data warehouse and lets users work with data in a spreadsheet-like environment.
For Metabase users who find themselves exporting data to Excel just to do more flexible analysis, Sigma removes that extra step entirely.
Sigma's Top Features
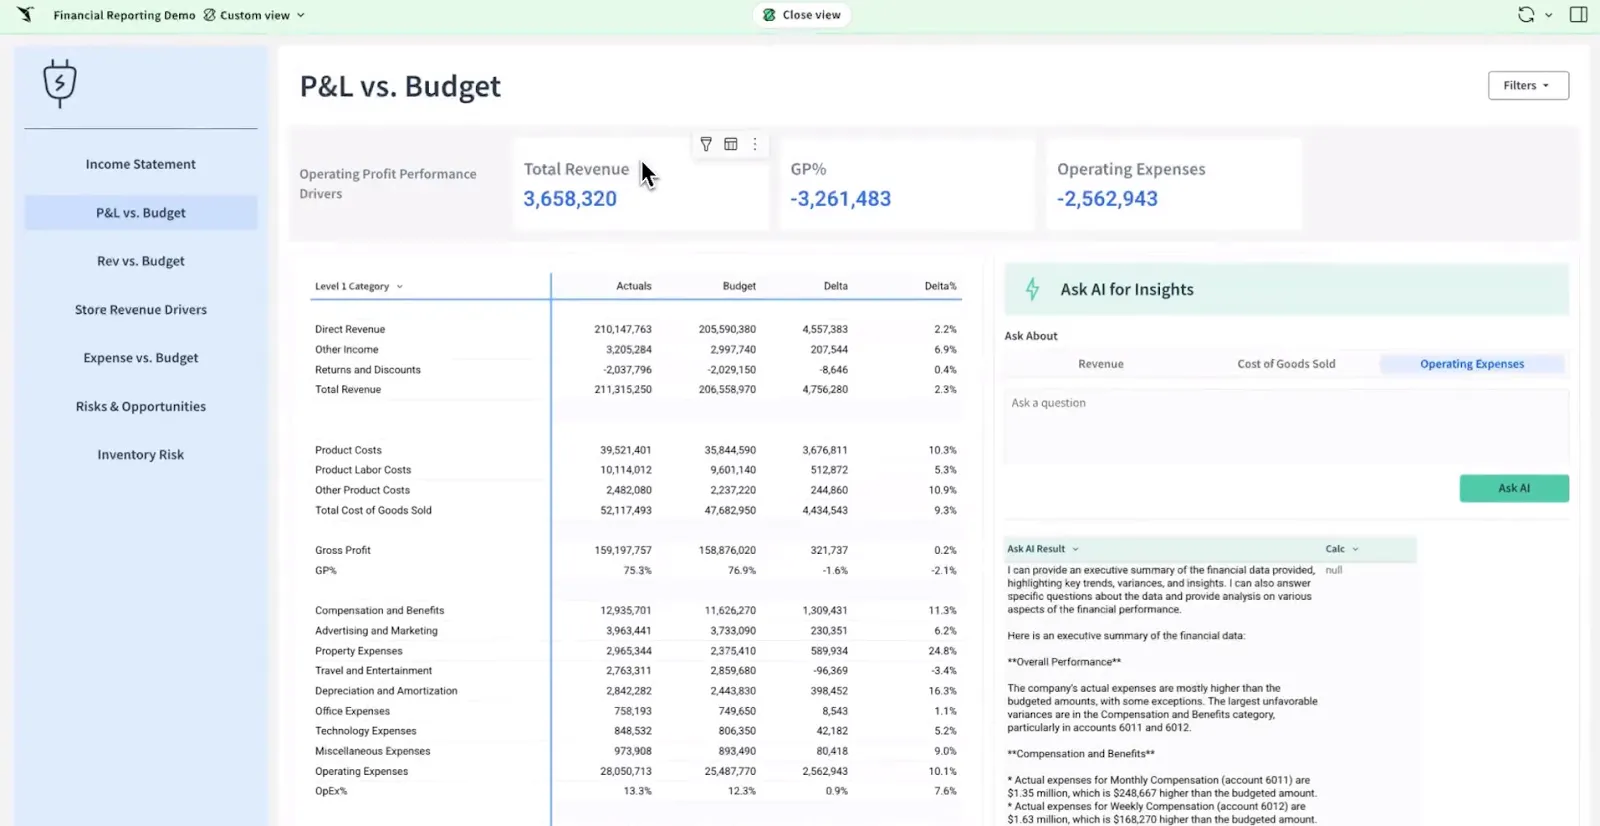
- Spreadsheet interface on live warehouse data: Analyze billions of rows using formulas, tables, and logic that feel familiar to Excel users, with no extracts or data duplication.
- AI-powered dashboards and apps: Use natural language and AI to build dashboards and operational analytics apps that support real business workflows.
- Collaborative workbooks: Build interactive analysis in shared workbooks where teams can comment, version, and iterate together.
Sigma Pricing
Sigma hasn't published its pricing.
You can contact its sales team directly to get a custom quote.
Sigma Pros and Cons
✅ Spreadsheet-like interface makes warehouse data accessible to anyone used to Excel.
✅ AI features like Ask Sigma and chart explanations speed up analysis and reduce analyst workload.
❌ Limited visual customization with fewer chart types and design controls compared to visual-first BI tools.
❌ Complex data modeling workflows need careful backend optimization to avoid performance issues.
#6: Mode
Best for: Data teams that want to combine SQL analysis, Python and R notebooks, and reporting in a single workflow without juggling separate tools.
Similar to: Metabase, Sigma.
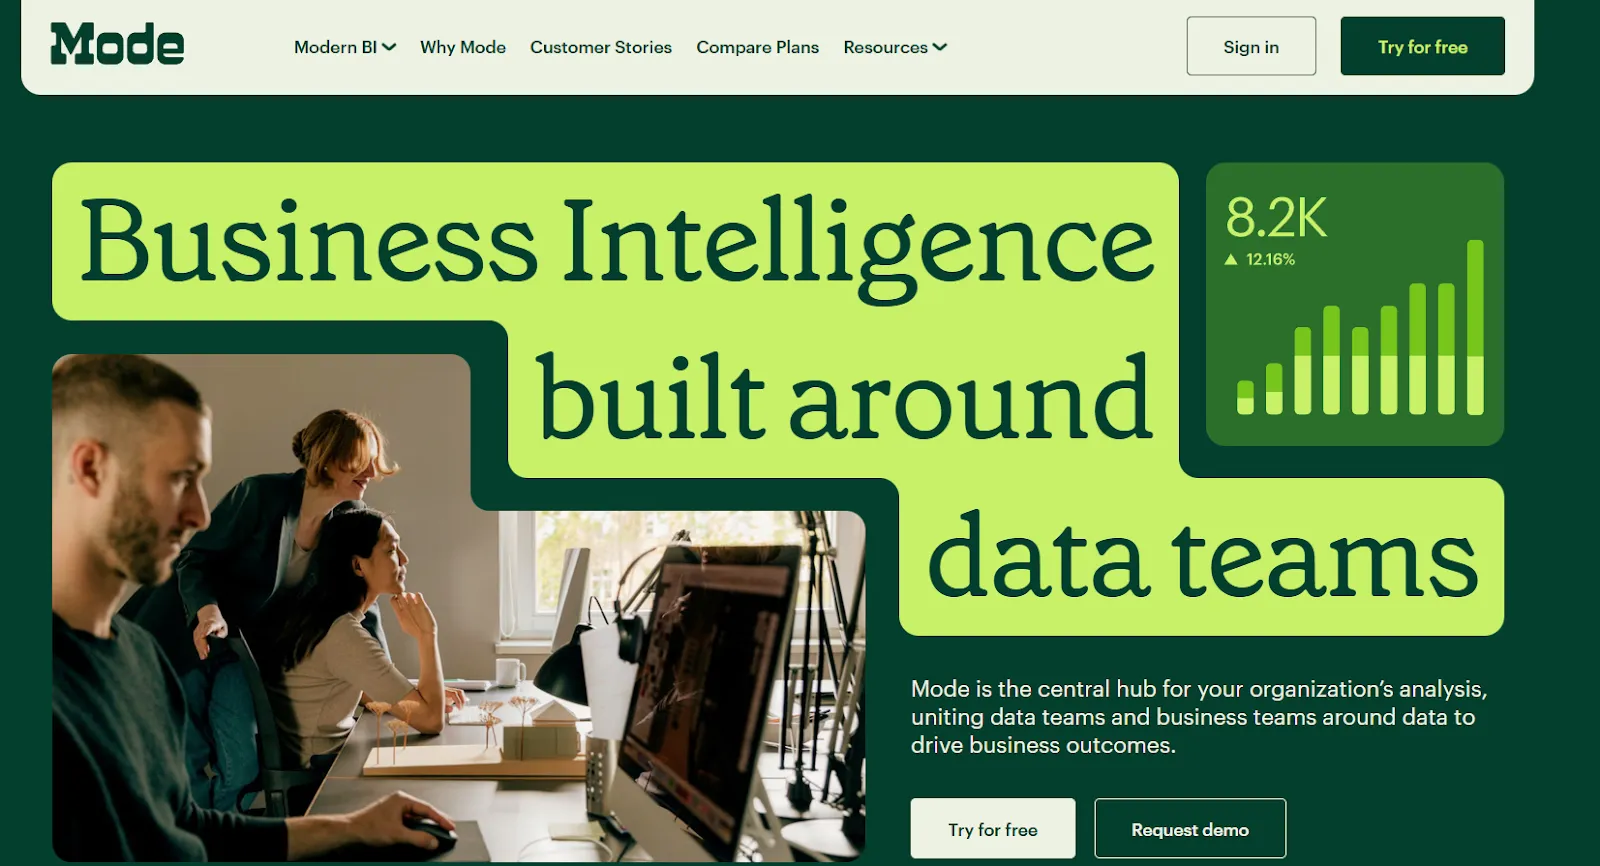
Mode is a BI platform built around the analyst's workflow, starting with SQL queries and extending into Python, R, and shareable dashboards.
It shares Metabase's SQL-first DNA but adds statistical analysis and data science capabilities that Metabase can't match.
Mode's Top Features
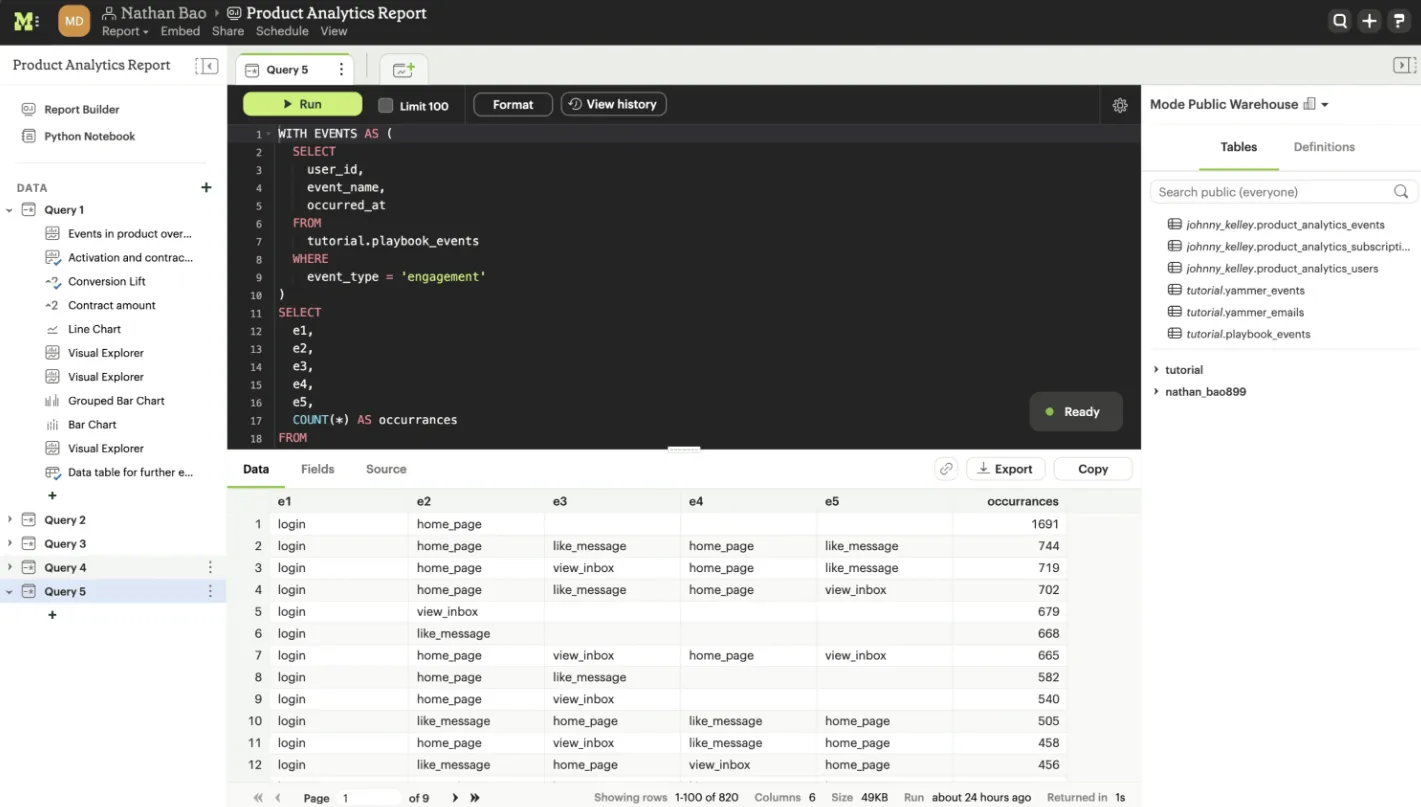
- SQL-first ad hoc analysis: Analysts can dive straight into data with SQL, making it easy to explore and iterate on complex questions.
- Python and R notebooks: SQL results flow directly into notebooks for deeper analysis, forecasting, and statistical models, all inside one workspace.
- Interactive dashboards and visual exploration: Mode supports interactive dashboards for exploring trends and patterns, helping teams share analysis without email chains.
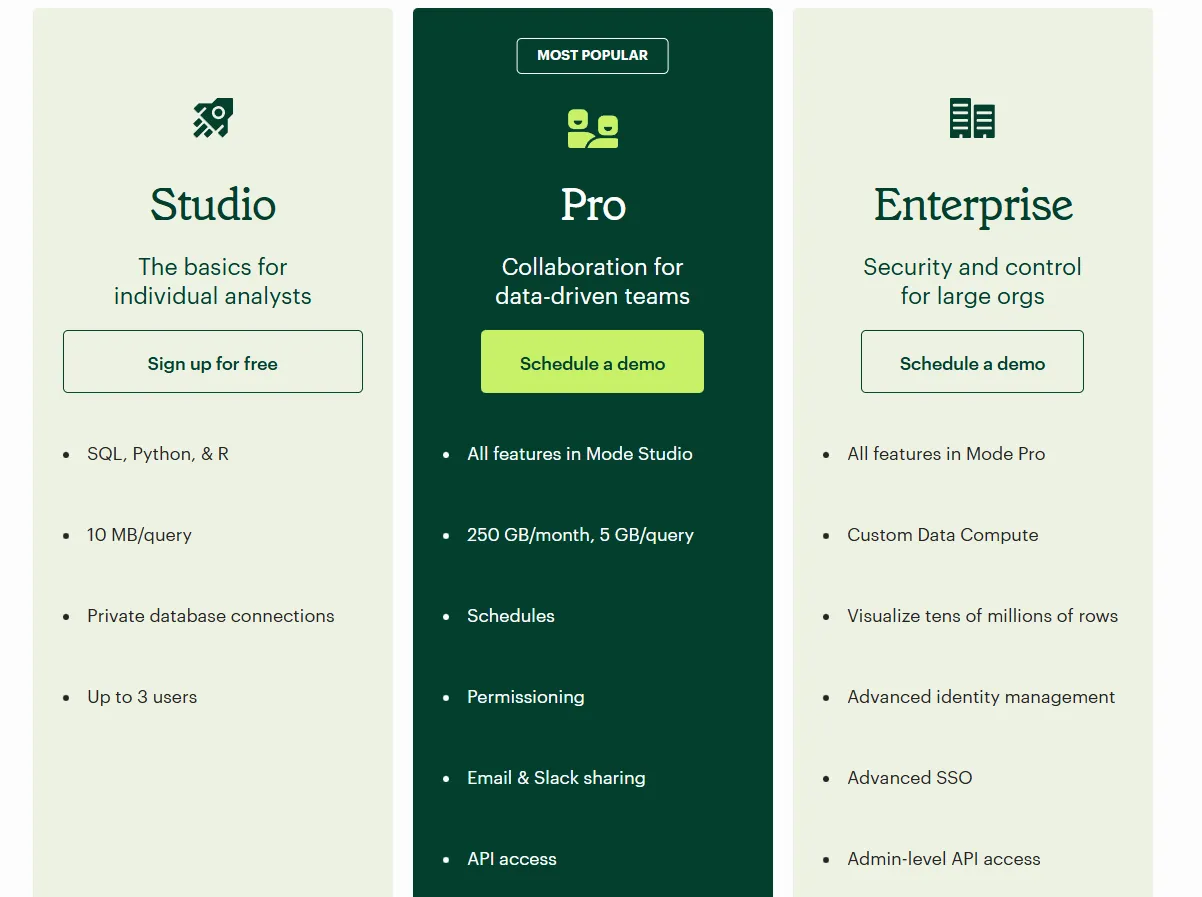
Mode Pricing
Mode offers three pricing tiers:
- Studio: Free plan, includes SQL, Python, and R, private database connections, support for up to 3 users.
- Pro: Custom price, adds team collaboration, scheduled reports, permissions, Slack and email sharing, and higher data limits.
- Enterprise: Custom price, extends Pro with advanced identity management, SSO, admin-level API access, and premium support.
Mode Pros and Cons
✅ Clean, role-based interface that makes it easy to track metrics and feature performance.
✅ Powerful combination of SQL, Python, R, and visualizations in one workflow.
❌ Performance slows down noticeably with large datasets or complex queries.
#7: Domo
Best for: Mid-to-large teams that want an all-in-one platform combining data integration, dashboards, automation, and AI in a single cloud environment.
Similar to: Zoho Analytics, Qlik Sense.
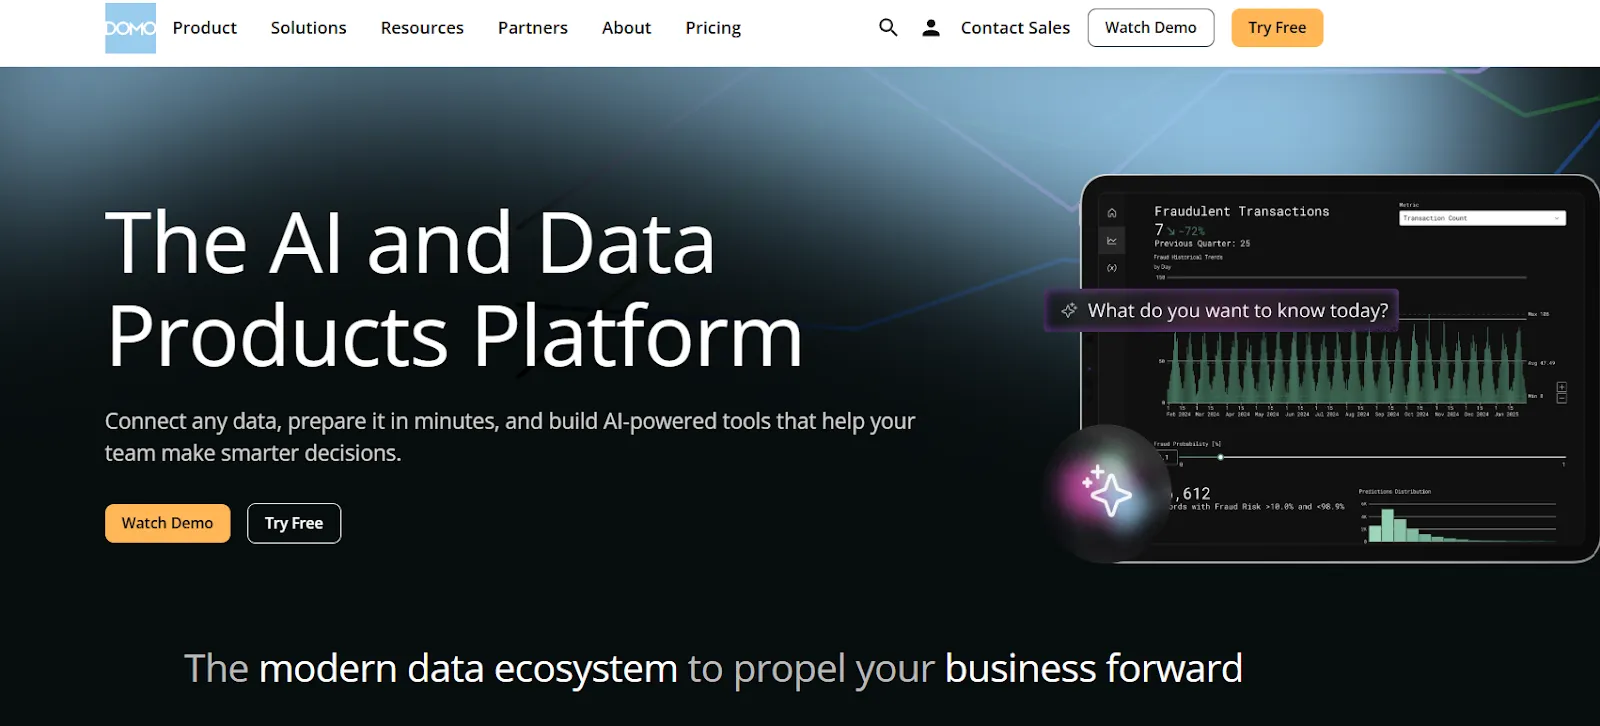
Domo pulls data from hundreds of sources and combines it with dashboards, automation rules, and AI-driven actions.
It's a heavier solution than Metabase, but for teams that want everything in one place, it covers a lot of ground.
Domo's Top Features
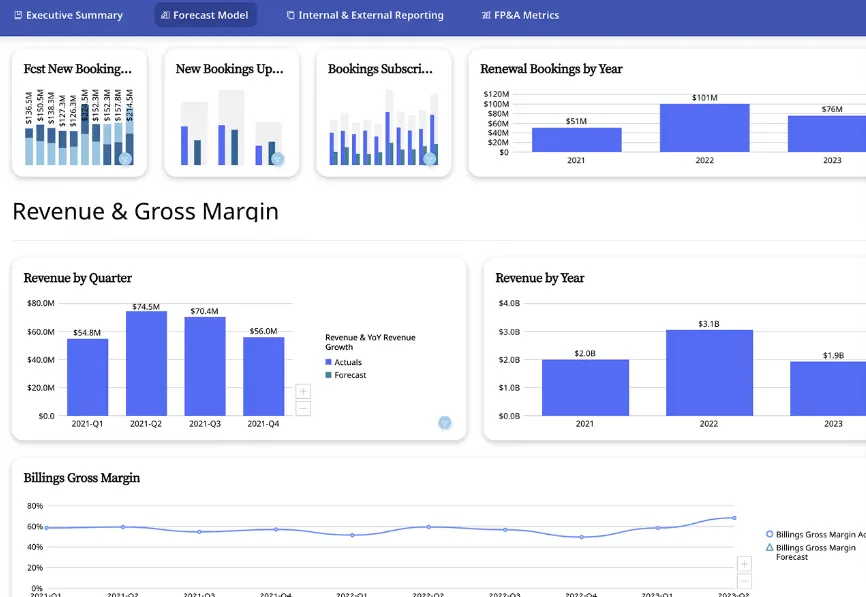
- Interactive dashboards and sharing: Build real-time dashboards that are easy to explore, share, and embed across teams or customer-facing apps.
- No-code analytics apps: Create custom data-driven apps and reports tailored to business workflows without writing code.
- AI-powered insights and chat: Ask questions in natural language, surface hidden trends, and use AI agents to automate decisions from dashboards.
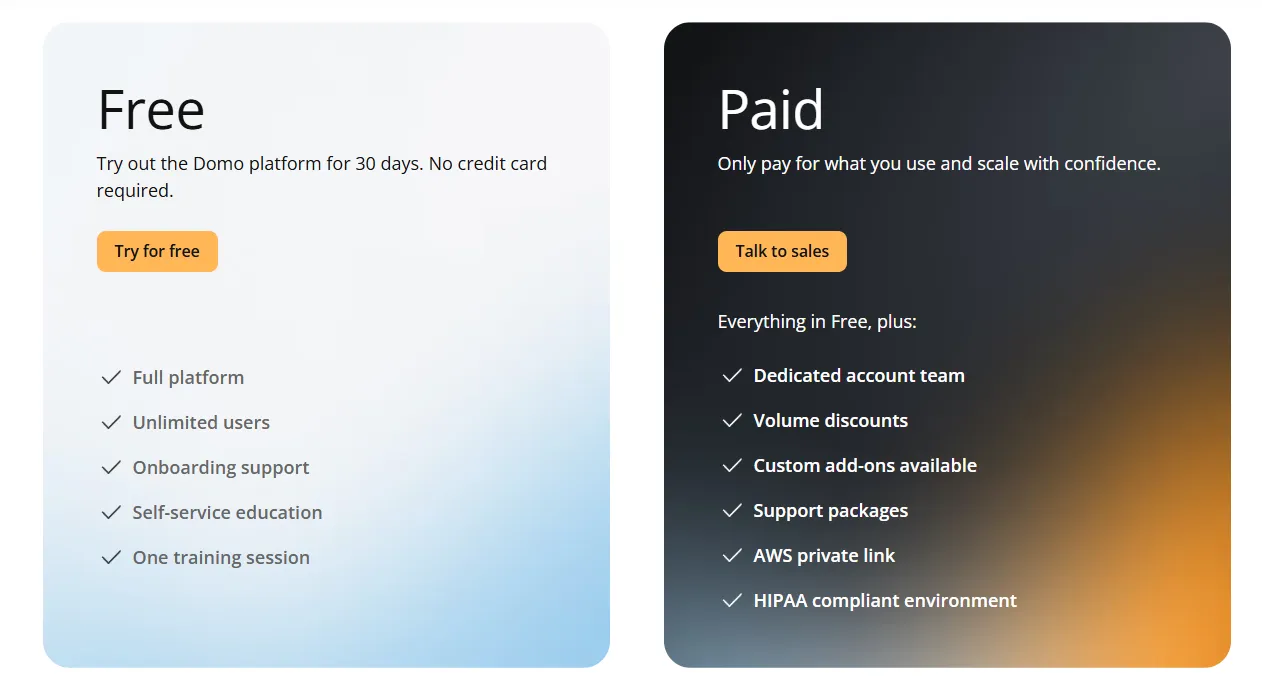
Domo Pricing
Domo has one paid plan and a free trial.
The trial gives you 30 days with full platform access, unlimited users, onboarding support, and one guided training session, no credit card required.
The paid tier is usage-based and includes a dedicated account team, volume discounts, custom add-ons, and a HIPAA-compliant environment.
For pricing details, you'd need to contact their sales team.
Domo Pros and Cons
✅ Very easy for non-technical teams, with a clean interface and intuitive dashboards.
✅ Strong connector library that centralizes data from many tools in one place.
❌ AI features feel uneven and sometimes get pushed before they're fully useful in real workflows, which is why some teams have been looking forDomo alternatives.
❌ Opaque pricing makes it difficult to budget before talking to sales.
#8: Zoho Analytics
Best for: Teams that want affordable BI with dashboards, AI features, and native integration with the Zoho ecosystem.
Similar to: Domo, Metabase.
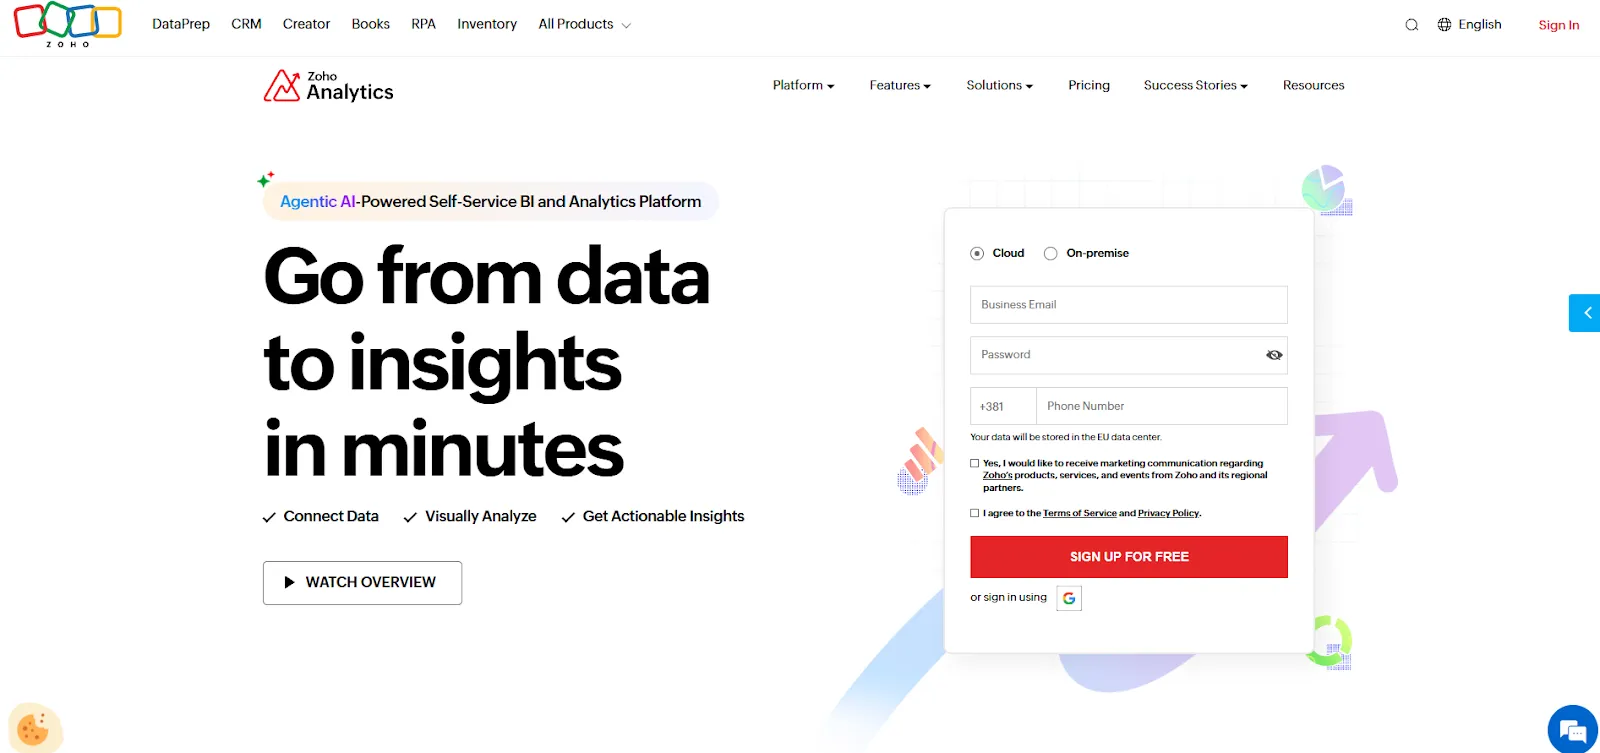
Zoho Analytics is a full BI platform that combines data prep, interactive dashboards, and a conversational AI assistant called Zia.
For teams already using Zoho apps, it's the most natural upgrade path from Metabase when reporting needs grow, but budgets stay tight.
Zoho Analytics' Top Features
- Ask Zia: Use natural language to analyze data, build reports, and get predictions and recommendations through Zoho's conversational AI.
- Data preparation and metrics layer: Clean, transform, and model data with over 250 no-code transformations while managing business metrics centrally.
- Flexible dashboards and embedded BI: Create interactive dashboards with over 50 visualization types and embed analytics into apps or customer-facing products.
Zoho Analytics Pricing
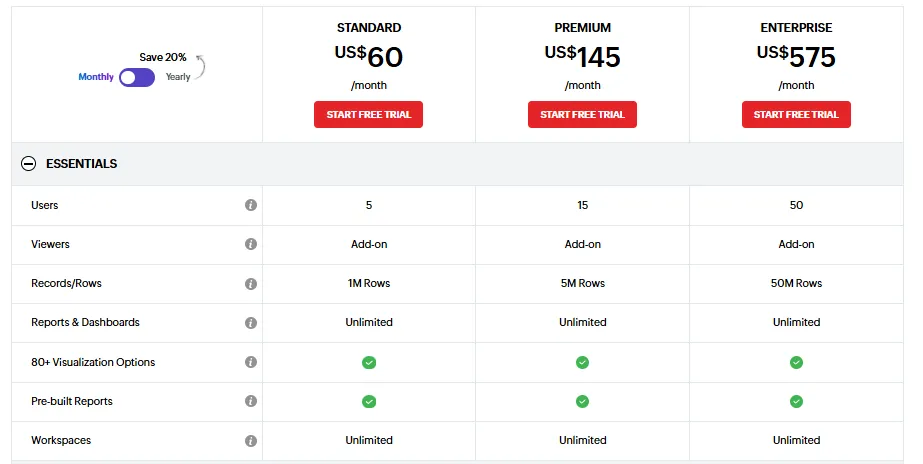
Zoho Analytics has three pricing plans:
- Standard: $60/month, includes up to 5 users, 1M rows, unlimited workspaces, reports and dashboards, and basic AI features.
- Premium: $145/month, includes up to 15 users, 5M rows, advanced data integration, and all AI features except AI studio.
- Enterprise: $575/month, includes up to 50 users, 50M rows, advanced governance and security, and AI studio.
Zoho Analytics Pros and Cons
✅ Tight integration with Zoho apps and popular third-party tools makes setup fast and reporting simple.
✅ Good value for money with an accessible interface for both business users and analysts.
❌ Data syncing isn't always real-time, and exports can feel clunky for presentation-ready reports.
❌ AI features are solid but don't match the depth of dedicated AI analytics platforms.
#9: Omni
Best for: Data-driven teams that want a flexible semantic layer with governed metrics and self-service exploration, without the rigidity of older BI modeling approaches.
Similar to: Looker, Sigma.
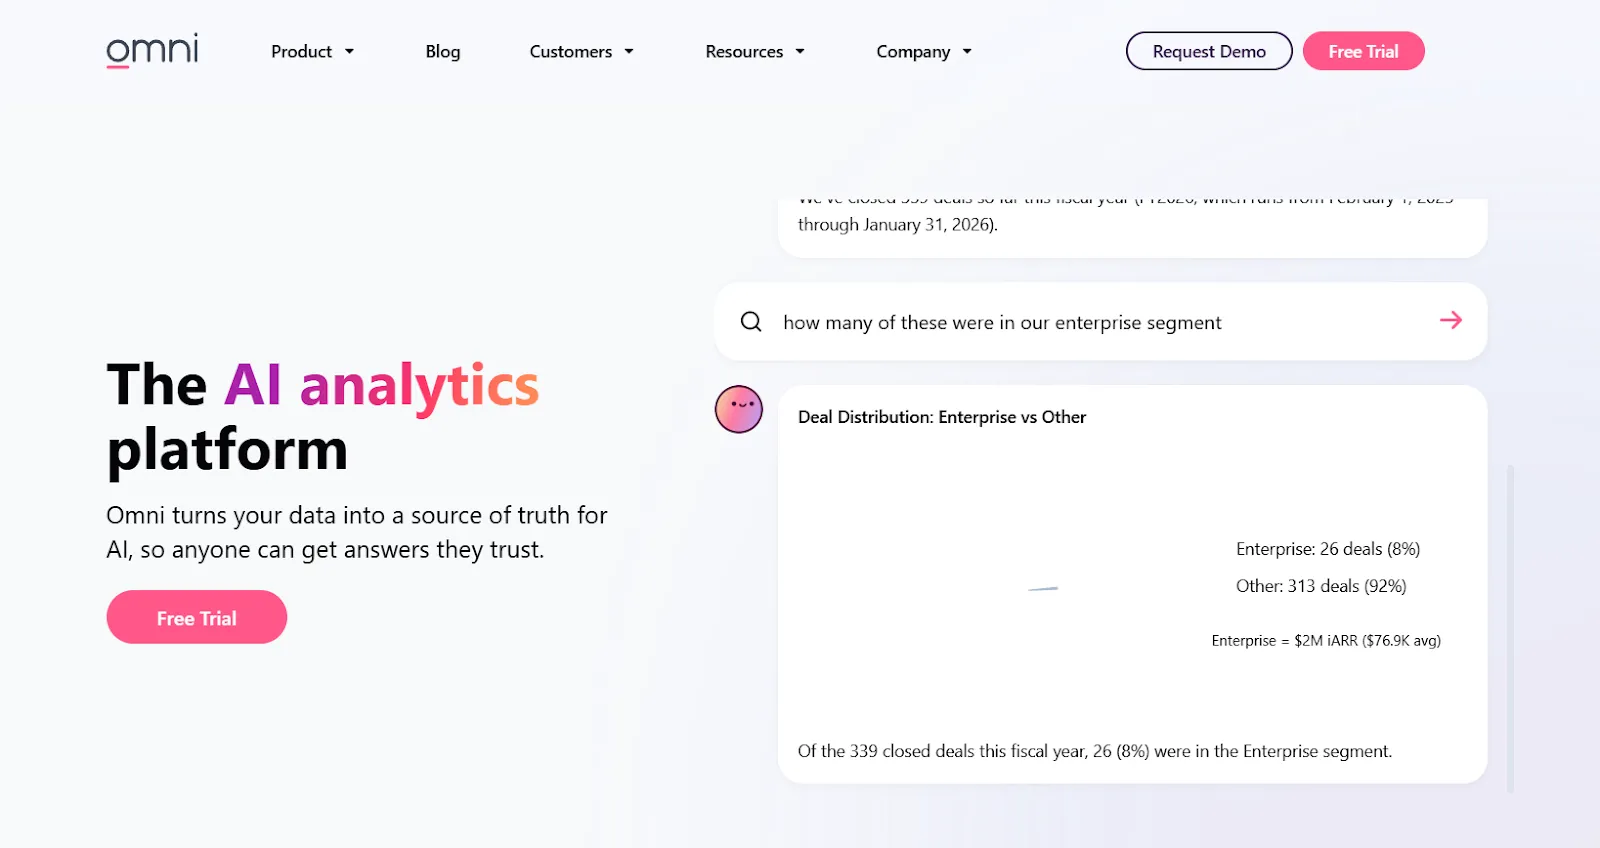
Omni is a modern BI platform built around a centralized semantic model that keeps metrics consistent while letting both technical and business users explore data on their own.
For teams outgrowing Metabase's lack of governance, Omni fills that gap without requiring full LookML-style engineering.
Omni's Top Features
- Metrics-first modeling: Define metrics once in a centralized model that supports governed, reusable calculations without rigid LookML-style workflows.
- AI in dashboards and workbooks: Use AI inside dashboards to summarize charts, generate queries, explain trends, and recommend next steps.
- Spreadsheet-like exploration: Analyze live warehouse data in a familiar spreadsheet interface while maintaining governed metrics and real-time connections.
Omni Pricing
Omni hasn't published subscription pricing.
You can request a free trial on its website and inquire about pricing details during a demo.
Omni Pros and Cons
✅ Intuitive drag-and-drop interface with strong dbt integration and direct warehouse querying for modern data stacks.
✅ Governed metrics layer that addresses Metabase's biggest weakness at scale.
❌ No public pricing, so it's hard to evaluate costs without going through sales.
#10: Qlik Sense
Best for: Organizations that need interactive analytics for exploring complex data relationships, especially in heavily governed industries.
Similar to: Tableau, ThoughtSpot.
Qlik Sense runs on an associative analytics engine that lets users explore data in any direction without being locked into predefined queries or dashboard paths.
Where Metabase limits exploration to pre-built dashboards and relatively basic drill-through, Qlik lets analysts follow data connections freely across multiple sources.
Qlik Sense's Top Features
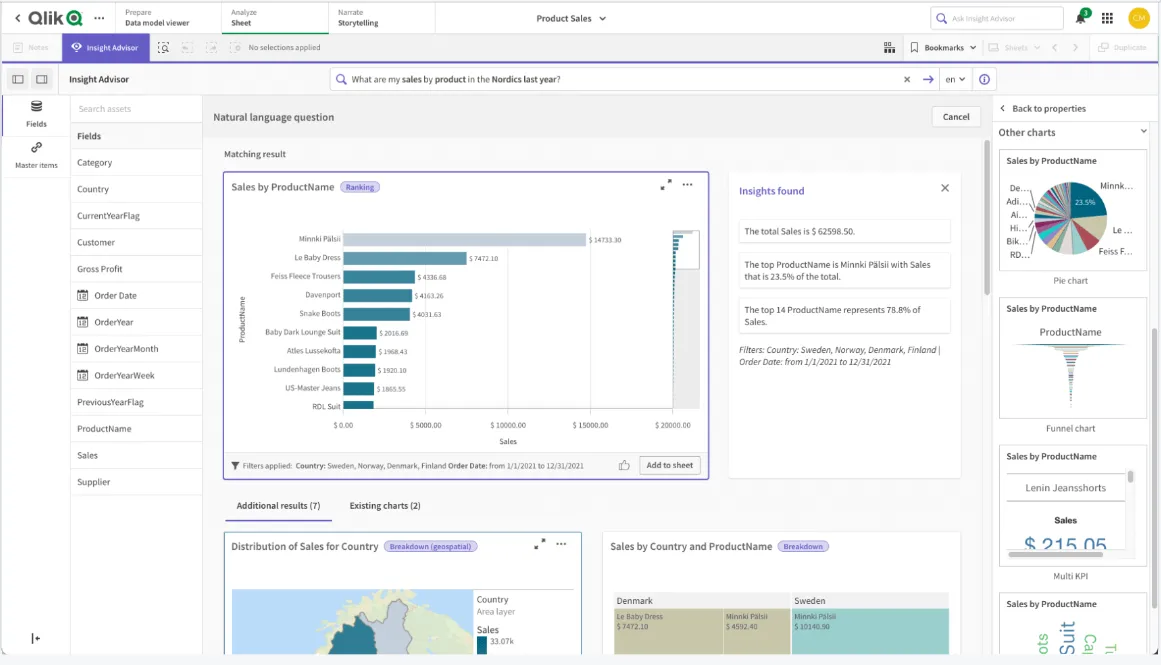
- Associative analytics engine: Explore data in any direction by selecting values across charts and tables, with instant recalculations that keep everything in context.
- AI-powered augmented analytics: Built-in machine learning generates insights automatically, supports natural language search, and enables predictive analytics without heavy data science work.
- Real-time alerts and automation: Monitor data changes with intelligent alerts and trigger automated actions when thresholds or events occur.
Qlik Sense Pricing
Qlik hasn't published pricing for Qlik Sense.
Its website states that you need to contact sales for a custom quote.

Qlik Sense Pros and Cons
✅ Highly flexible and customizable, with an associative engine that reveals data relationships other BI tools miss.
✅ Scales well for enterprise use, performing reliably with large data volumes and complex analytics needs.
❌ Expensive, especially when scaling access across broader teams.
❌ Steeper learning curve than lightweight tools like Metabase, and the on-prem setup adds infrastructure overhead.
Get Started with Dot For Free Today
Metabase is a solid choice for teams that want fast, lightweight dashboards without much setup.
But as data needs grow, the same things that make Metabase easy in the beginning start holding teams back: basic AI, limited governance, performance that degrades under load, and visualizations that don't scale.
Most Metabase alternatives still revolve around the same idea: better dashboards, better visuals, better governance, but the same manual interpretation at the end.
Dot takes a different approach.
Instead of asking teams to build and maintain dashboards, Dot does the analysis for you.
You ask a business question, and Dot:
- Investigates the data.
- Explains what changed and why.
- Delivers a clear narrative with recommendations.
- Shows its work with a full audit trail.
No SQL bottlenecks. No dashboard hunting. No analyst backlogs.
Here's what's in it for your team when you try Dot:
- Access to a free Starter plan with chat-based analysis, 3 active tables, 100 credits, and model and evaluation access.
- Automated executive business review reports delivered on your schedule, directly from your warehouse.
- Ad-hoc analysis through Slack, Microsoft Teams, email, or the web app so insights show up where decisions happen.
- A Context Agent that maintains shared business definitions and prevents metric drift across teams.
- Full audit trail on every insight, with transparent links to underlying SQL, Python logic, and datasets.
Sign up for Dot's free plan or book a demo to see how teams replace Metabase’s reports with automated, decision-ready insights.
Theo Tortorici
Theo writes about AI-powered analytics, data tools, and the future of business intelligence at Dot.