
10 Best No-Code Data Analysis Tools In 2026
A no-code data analysis tool lets someone who has never written SQL pull an answer out of company data, either by typing a question or by dragging fields onto a canvas.
I'll go through the 10 best no-code data analysis tools in 2026, covering what a non-technical user can do in each one and what it costs once a whole team is using it.
TL;DR
- Dot is the best no-code data analysis tool in 2026 for non-technical managers and operators, with its written answers in Slack and Microsoft Teams and a query behind every figure for anyone who wants to check it.
- If you'd rather ask than build, ThoughtSpot, Supaboard, Metabase and Sigma answer from live databases through a search bar, a chat window, a point-and-click builder and a spreadsheet grid respectively.
- Teams that already build reports on a drag-and-drop canvas will recognize Microsoft Power BI, Tableau, Qlik Sense and Zoho Analytics, all four of which now pair that visual builder with an AI assistant.
- Domo suits buyers who want one vendor for everything from source connectors to the no-code apps built on the data, under a single consumption-priced contract.
What are the best no-code data analysis tools in 2026?
Dot ranks first among no-code data analysis tools in 2026 as it answers typed business questions from your warehouse inside Slack and Microsoft Teams, ahead of ThoughtSpot for search-led self-service and Zoho Analytics for drag-and-drop reporting at a published price.
Here’s the full shortlist of vendors:
Tool | Use case | Price |
Dot | Written answers to everyday business questions, drawn from your warehouse with the query attached. | Free plan with 300 credits; Pro at $180/month. |
ThoughtSpot | Search-led self-service, where a typed question returns a governed chart. | Essentials at $25/user/month, annual. |
Zoho Analytics | Drag-and-drop reporting on data from dozens of business apps, plus the Ask Zia assistant. | Free plan; paid from $30/month. |
Supaboard | Dashboards and reports generated from a written description, for teams with nobody writing SQL. | Individual at $83/user/month, annual. |
Sigma | Spreadsheet formulas and pivots run straight against live warehouse data. | Quote only. |
Metabase | Point-and-click questions on your own database, free to self-host. | Free open source; Starter at $100/month. |
Qlik Sense | Associative exploration that keeps every field linked as you click. | Starter at $300/month, annual. |
Domo | Magic ETL for visual data prep, alongside no-code app building on one platform. | 30-day trial; paid plans quoted on credits. |
Microsoft Power BI | Report building and Copilot for companies already running Microsoft 365. | Free for personal use; Pro at $14/user/month. |
Tableau | Deep visual analysis on a drag-and-drop worksheet, with Tableau Agent on the higher Cloud editions. | $15/user/month for Viewers, $75 for Creators. |
I held every tool to four checks before it made the list:
- Answers without code: If a first result needed SQL or DAX, the tool didn't qualify, so every entry here works through typed questions or dragged fields.
- Real company data: I only counted tools that connect directly to a database or warehouse, since one uploaded spreadsheet isn't how most teams keep their numbers.
- A cost you can explain: Published rate cards counted most. Where a vendor quotes privately, I needed enough public detail on the plan structure to describe it honestly.
- Generally available: Every product here can be bought today. Where a feature is still in beta, such as Sigma's Build mode, it's labeled.
➡️ A caveat on the term: "no-code" in this guide describes the person asking the question. Dot and several others still need someone technical to connect a database the first time.
#1: Dot
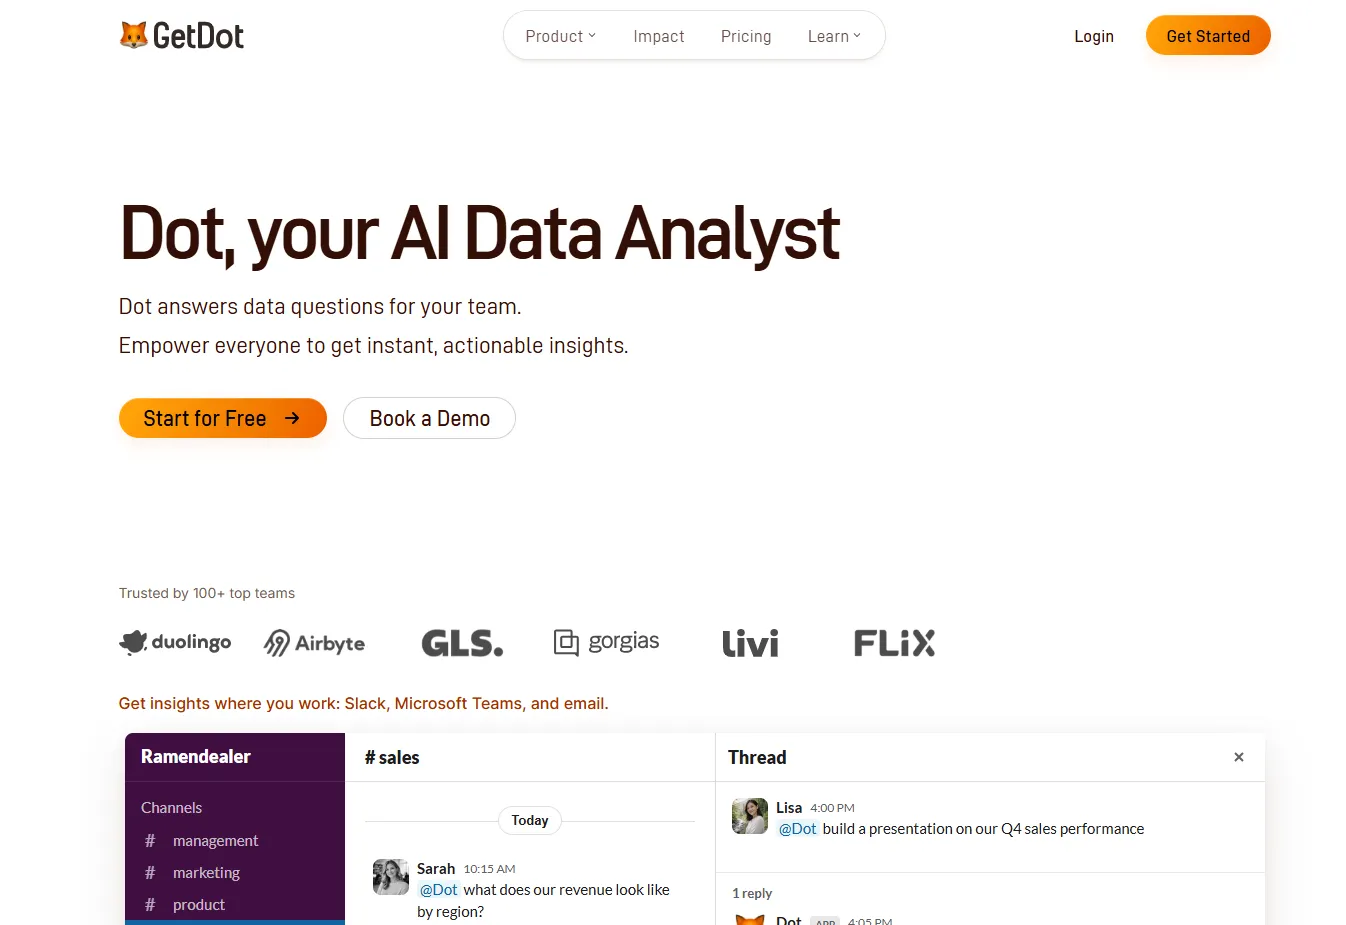
Dot offers the best no-code data analysis tool on the market for non-technical managers and operators because the whole job, from the question to a written explanation of what changed, happens without anyone on the business side touching SQL.
Disclaimer: This is our own product, so weigh the section accordingly, though the case for the top spot still has to be argued, and that is what follows in this guide.
We built Dot for the manager who needs a number before a meeting and currently has two options: waiting for an analyst to pick up the request or opening a dashboard that almost answers the question.
Our aim is to let that manager ask the question the way they'd ask a colleague, while the data team keeps control of the definitions and permissions every answer is built on.
A non-technical team mostly uses four parts of Dot: 👇
Everyday questions in Chat mode
In Chat mode, Dot converts a question written in everyday language into a query against your connected warehouse, then replies with the answer and the query it ran.
You can ask from Slack or Microsoft Teams, or in Dot's own web app.
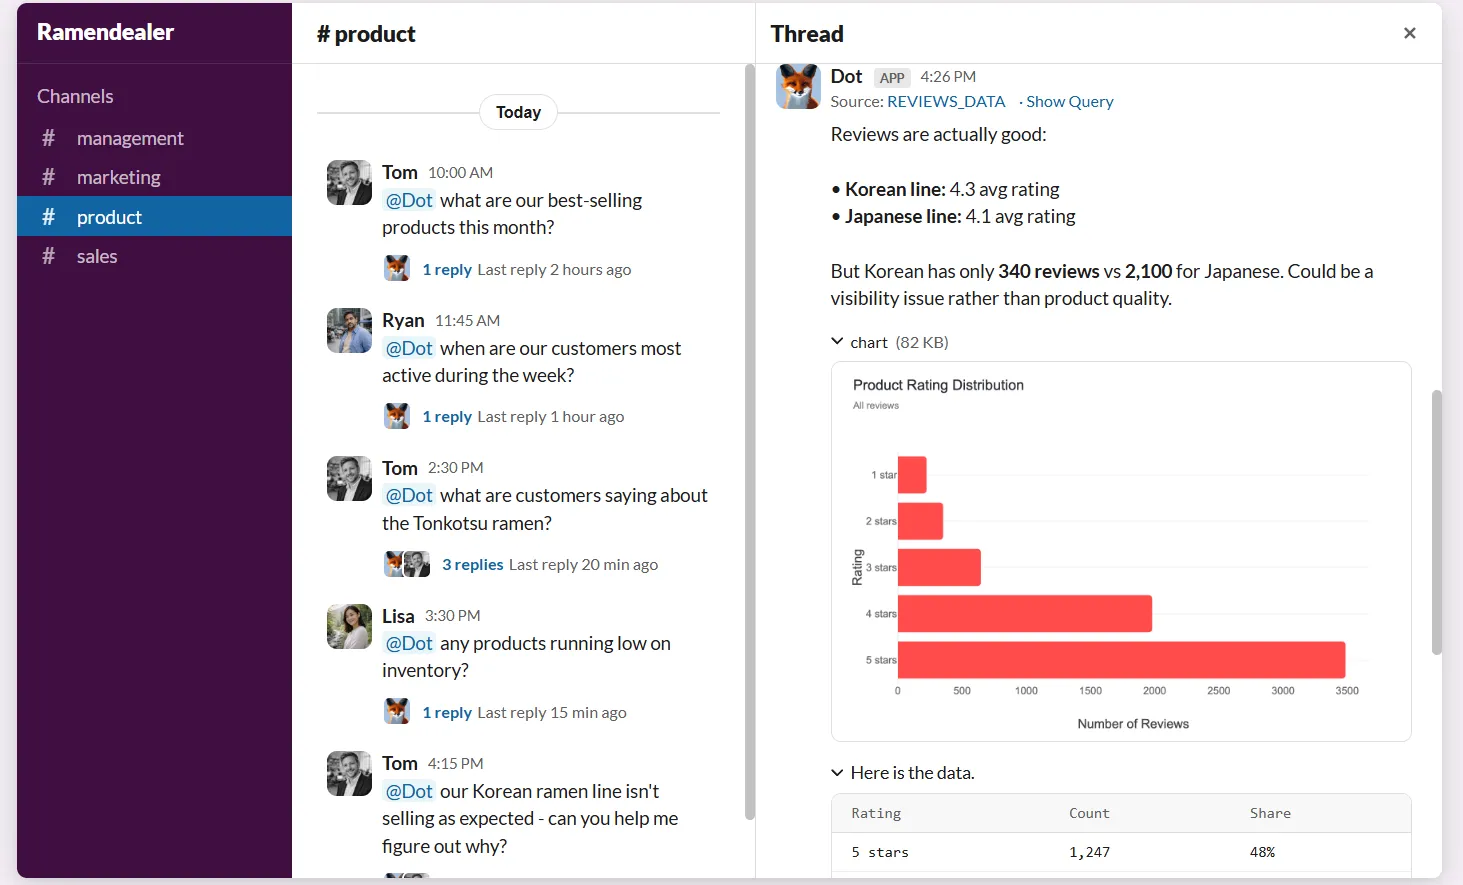
You don't need to learn a query language, although you'll get sharper answers with four habits from Dot's question guide:
- Name the figure: Say "revenue" or "number of orders" outright, using your company's glossary terms such as "Active Buyer."
- Give a time period: A question without a timeframe is one of the guide's own examples of a weak question, so add "July 2024" or "last month."
- Choose the granularity: Say whether you want the result daily, weekly, by region or by country.
- Ask for the chart you want: Put the visualization request in the same sentence as the question.
When a reply misses, you can type "try again" to send Dot at the question from another angle.
Admins review thumbs-up answers on the Model page before Dot reuses those queries for similar questions.
One limit to know upfront is that Chat won't forecast future figures.
Deep Analysis for the reasons behind a change
Deep Analysis is Dot's investigation mode, built to run several queries in sequence and check each result before it writes anything up.
Once it finishes, Dot hands back a written report, with charts supporting each finding.
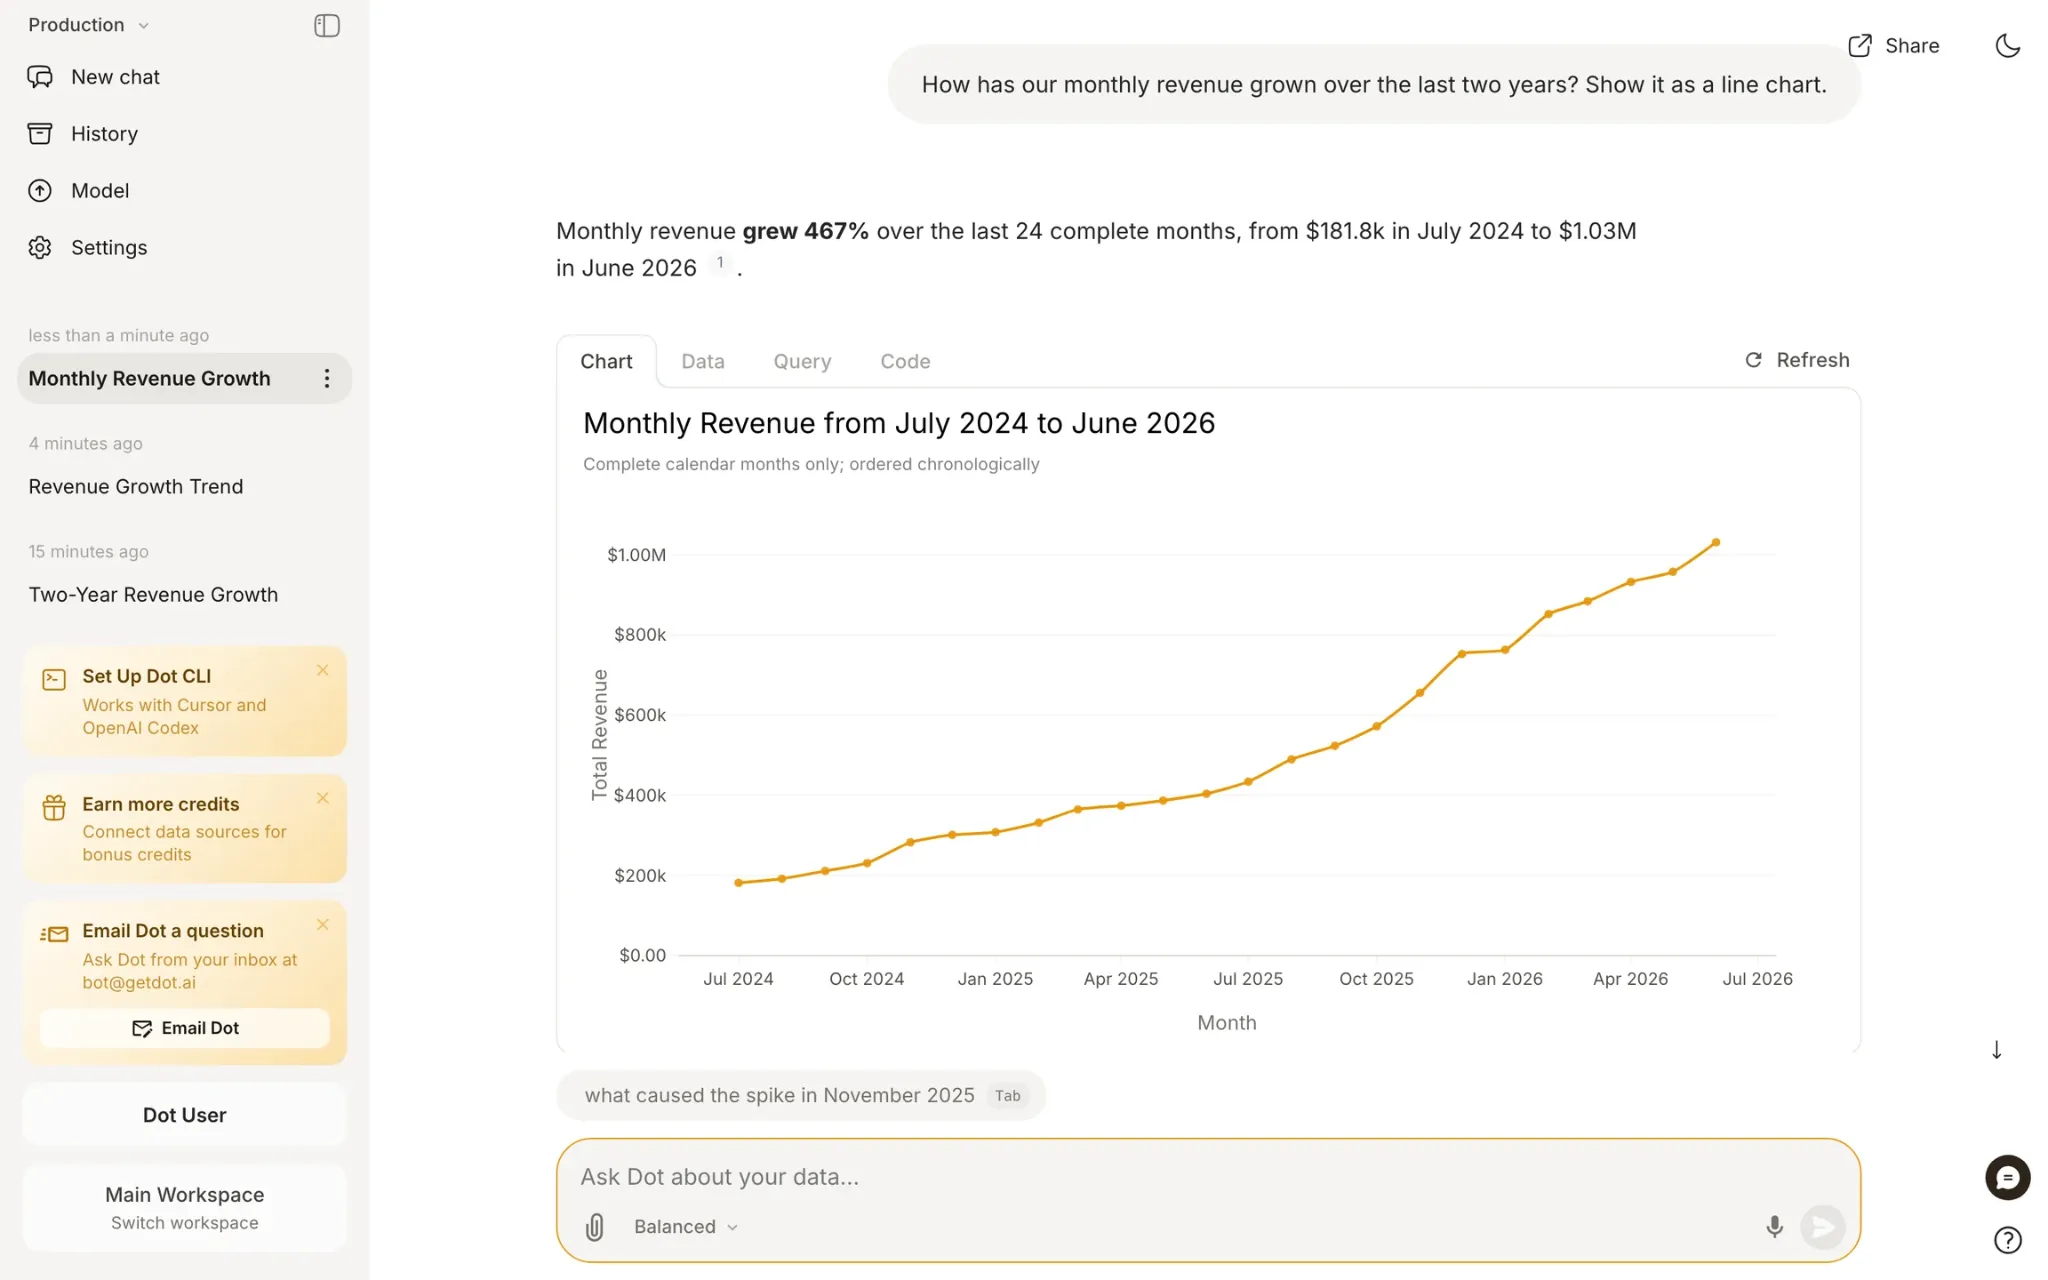
It's meant for questions about why a number moved, such as a drop in Enterprise sales between Q3 and Q4, while quick lookups stay in Chat.
While it works, you can follow each query and tool call on screen.
Dot's documentation puts a typical run at one to five minutes, depending on complexity.
Each report is laid out the same way:
- A quantified finding: The report opens with one number that sums up what happened, followed by a short executive summary of two to three key points.
- Supporting sections: Detailed analysis comes next, with charts and tables placed wherever they explain a point.
- Recommendations and assumptions: Dot ends with specific next steps and lists the definitions and caveats it worked from.
- Source links: Dot ties every claim to the data behind it, so a reader can check any finding.
As Deep Analysis keeps context between messages, a manager can ask for a regional breakdown of the finding without starting over.
Dot exports a finished report to PowerPoint through the Download as Presentation button or shares it as a link.
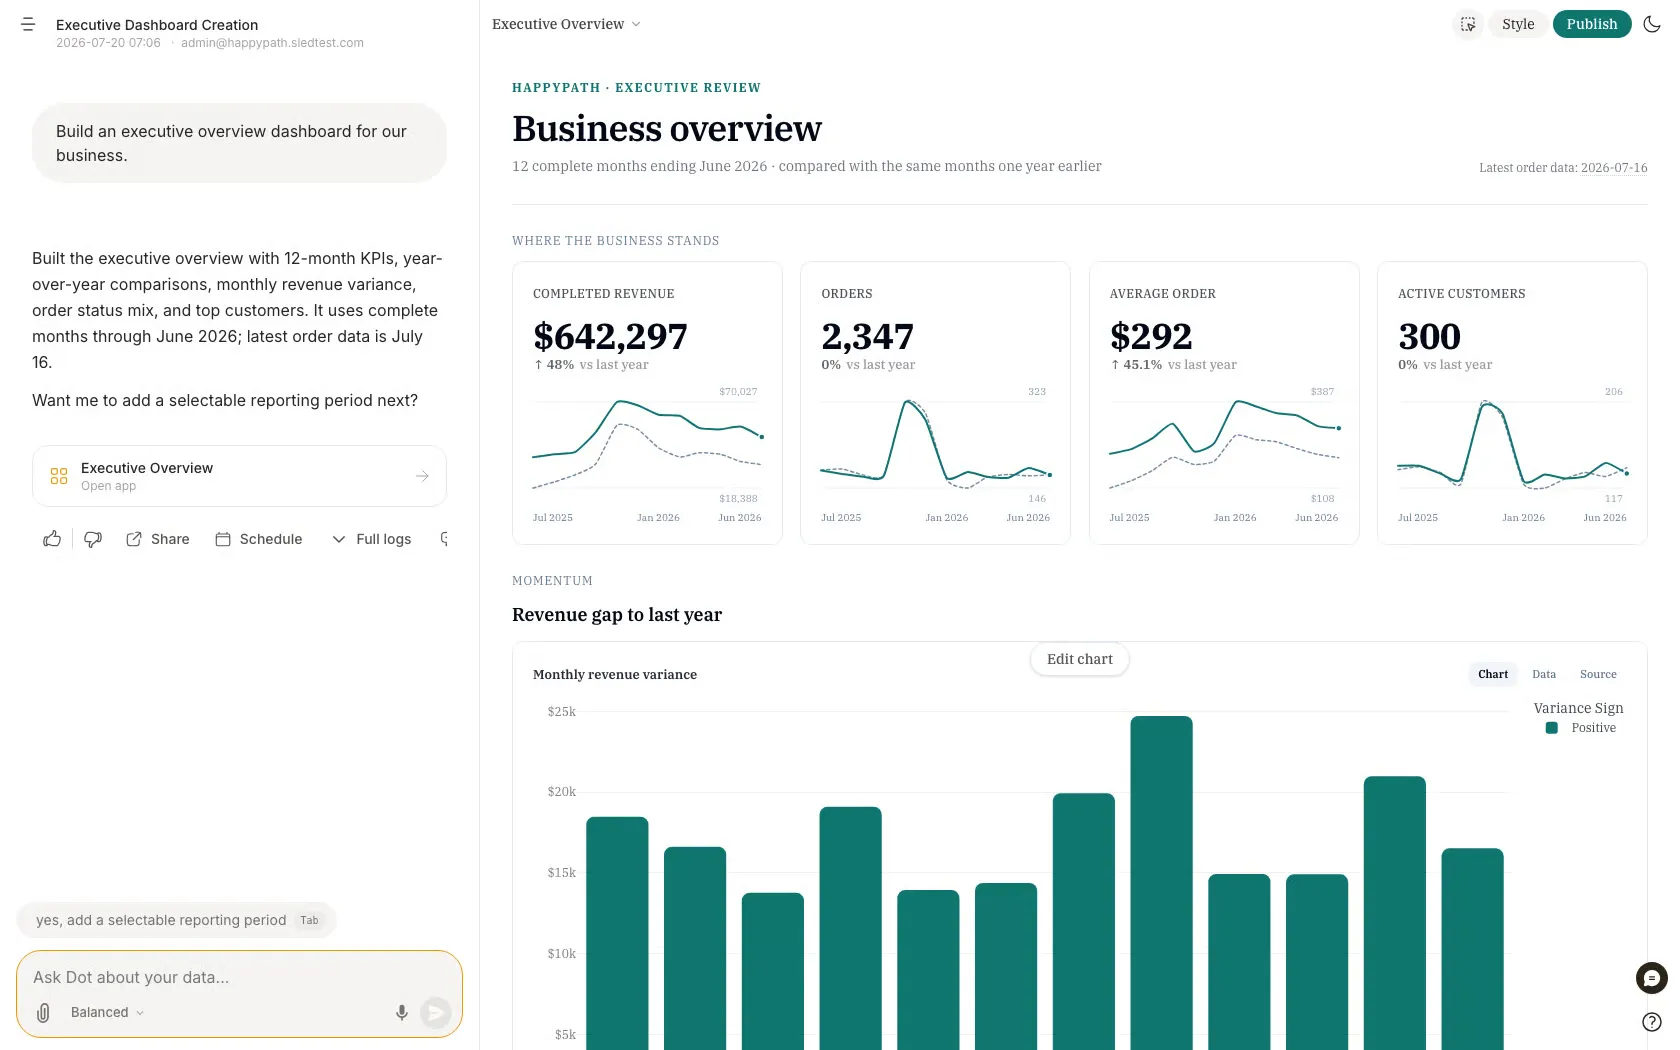
Admins who switch on intelligent triggering let Dot move complex questions into Deep Analysis on its own.
Scheduled reports before the meeting starts
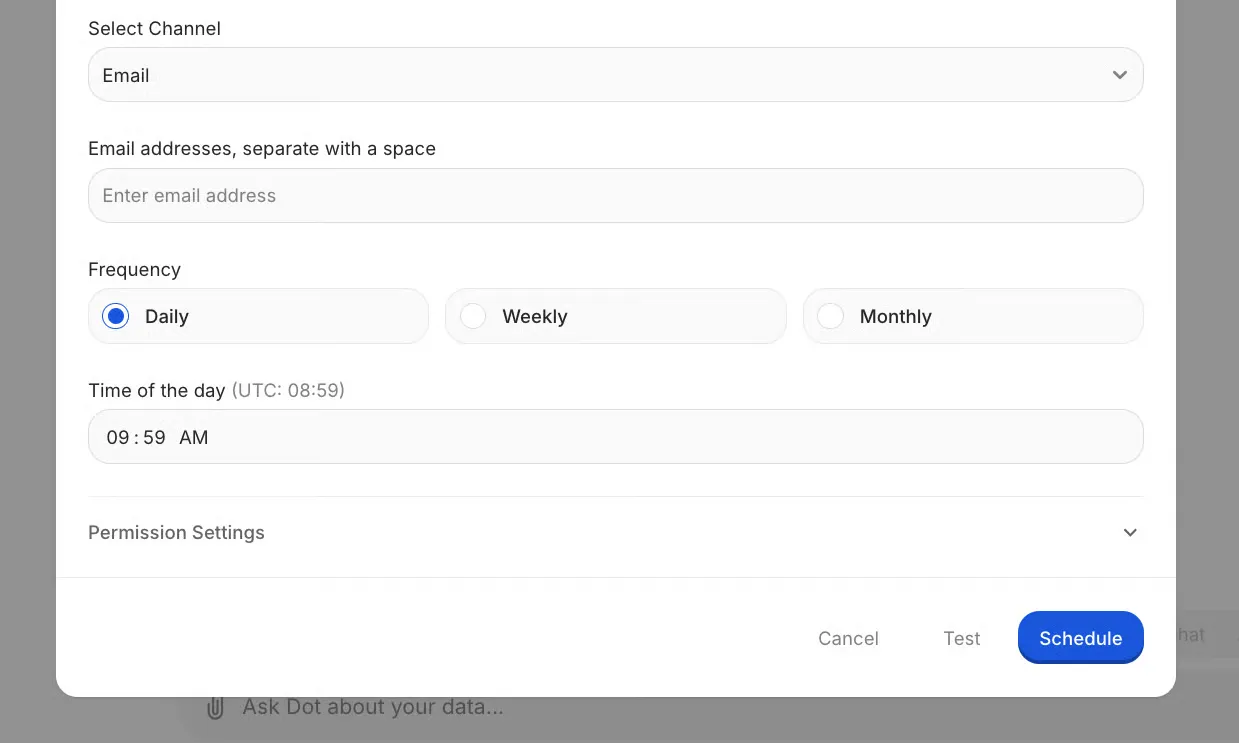
Any Deep Analysis can be scheduled to rerun on a cadence you set for a list of recipients.
Dot sends each run by email or posts it into Slack or Microsoft Teams.
You can run a schedule every day, or pick the exact weekday or date for weekly and monthly runs.
Two setups work especially well for managers:
- Meeting prep: Managers set the report to arrive 30 minutes before a recurring meeting, and people come in already briefed.
- Monday review: Teams get a weekly what-changed analysis in Slack at the start of each week, ready to discuss.
To set one up, press Schedule on a Deep Analysis response, then use Test to preview it before it goes live.
Each run costs one Agent Compute Credit.
One-time setup by the data team
An admin connects the warehouse under Settings, which is a step from our Dot's getting-started guide that needs permissions and no code.
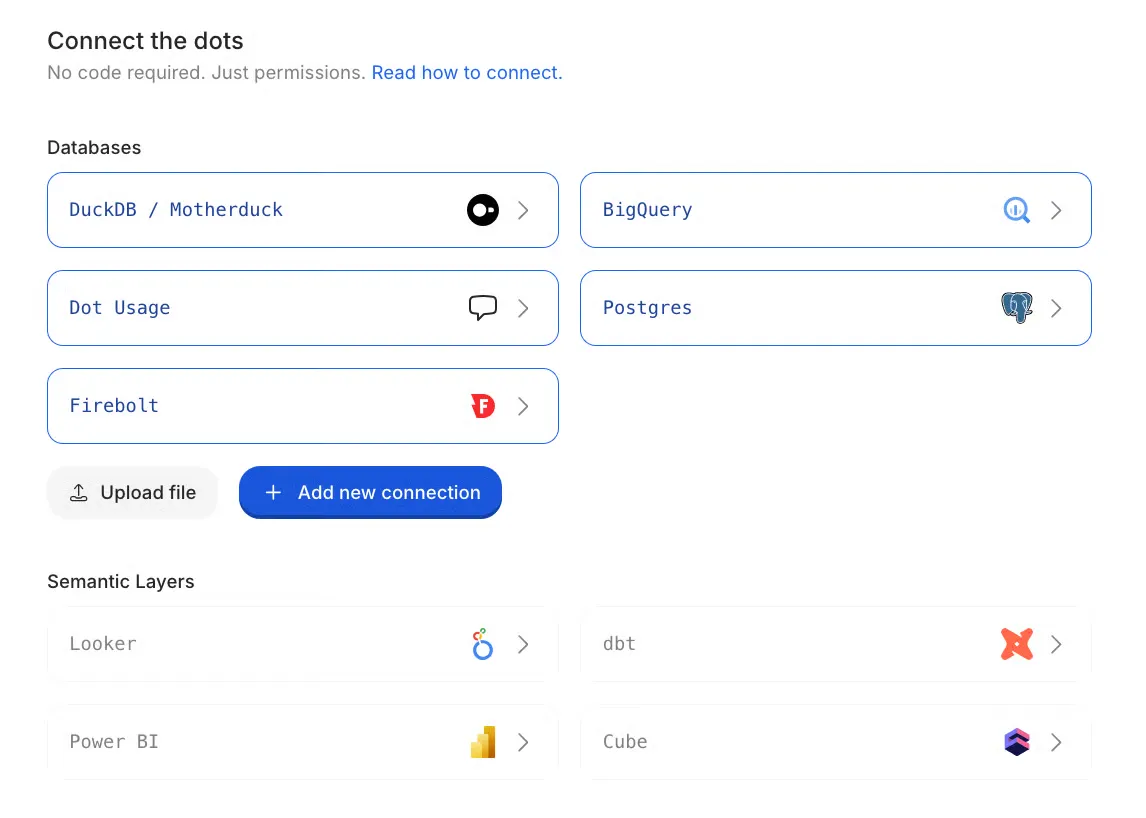
Snowflake, BigQuery, Redshift and Databricks are all supported, as are semantic layers like dbt and Power BI.
From there, the Context Agent, Root, interviews the person who knows the business and explores the data to set up a first use case.
Nothing Root writes goes live until someone reviews the diff and merges it, because Root works in an isolated sandbox.
Four jobs suit Root well at the start:
- Metric glossaries from dashboards: Root reads trusted Tableau or Metabase dashboards through their APIs and turns their calculations into standard definitions.
- Gaps in past questions: By reviewing recent Dot conversations, Root finds what people ask most and where Dot couldn't answer.
- Documentation checks: Root queries the tables themselves to test whether their descriptions still hold, then suggests fixes.
- Wiki migration: Root extracts business definitions from Confluence or Notion and rewrites them as notes Dot can use.
Your data team can also write notes, for example, an instruction to always check whether someone means live or booked revenue.
Dot manages access through groups, so a user can only query the tables shared with their group.
Row-level filtering comes with the Team plan.
On security, Dot completes annual SOC 2 Type II audits, and its pricing page states zero data retention with every LLM provider it uses.
What makes Dot different from other no-code data analysis tools?
The main difference is the starting point: a traditional no-code tool gives you a canvas for building a dashboard, whereas Dot takes the question and returns a written answer with its evidence attached.
The comparison below covers the points a manager notices first:
Dot | Traditional no-code data analysis tool | |
How a question starts | Typed into Slack or Microsoft Teams in everyday language | A dashboard or report has to be built on a canvas first |
What comes back | A written answer with its query attached, plus a chart on request | A chart or dashboard the reader interprets |
Explaining a change | Deep Analysis runs several queries and writes up the likely drivers | Usually the reader filters and drills down, or files a request with an analyst |
Where results are read | The chat thread the question came from, or an email | Mostly inside the tool's own interface, with emailed or Slack snapshots on some platforms |
Recurring reporting | Scheduled reports that explain what changed, run under a chosen user's data permissions | Scheduled snapshots or subscriptions of an existing dashboard |
Business definitions | Notes and a metric glossary, with Root's changes reviewed as diffs | Calculated fields and models maintained inside each report or workspace |
Pricing basis | Credits for analysis work, with unlimited users on paid plans | Usually per user, though some vendors price by capacity |
What has to exist first | A connected warehouse or database | Often just a spreadsheet or file upload |
Dot pricing
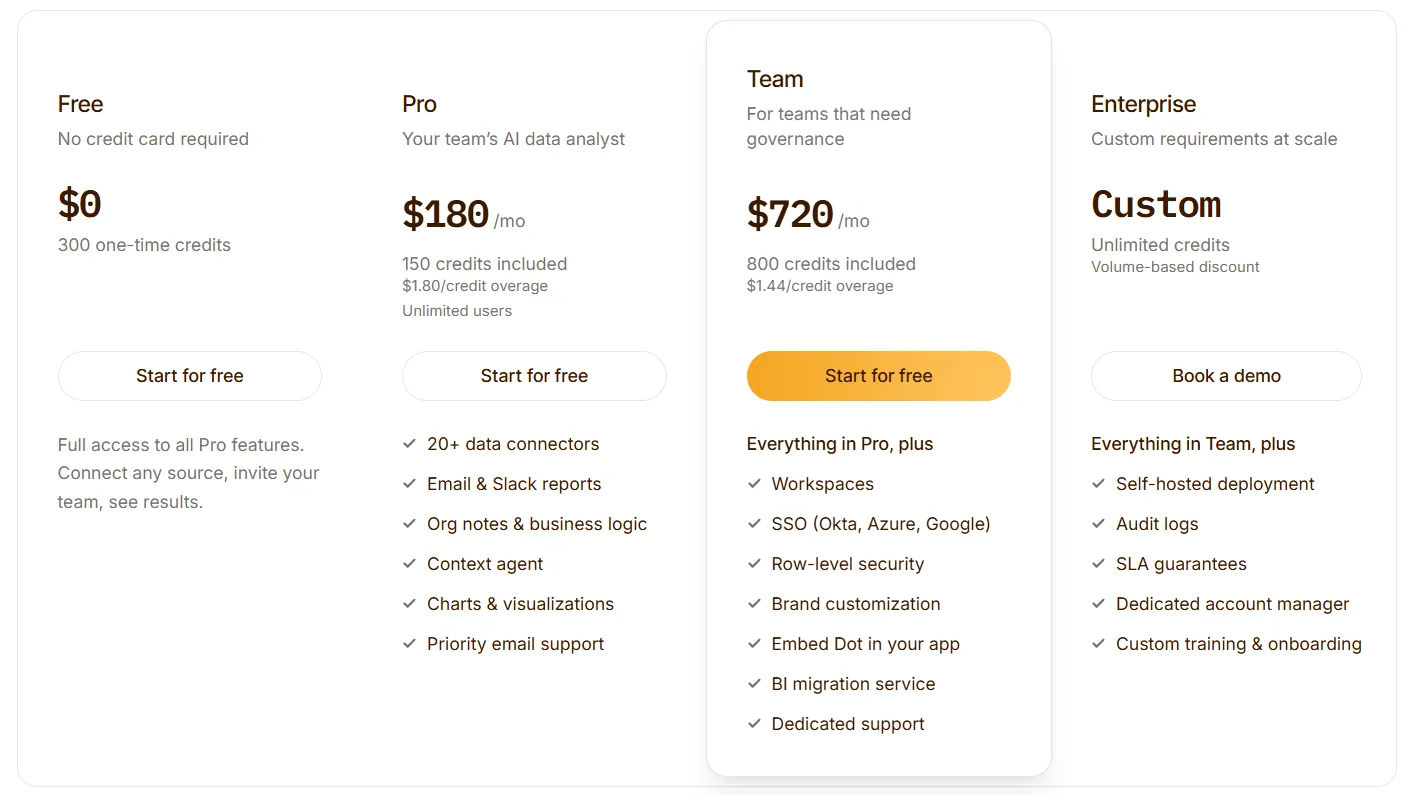
Dot's Free plan costs $0 and includes 300 one-time credits, while Pro, the first paid plan, costs $180 a month with unlimited users.
Dot bills for the analysis it runs, measured in credits, and the plan price stays the same regardless of how many people have an account.
- Free: $0. The 300 credits don't refill, and every Pro feature is switched on while they last.
- Pro: $180 a month for 150 credits and unlimited users, with extra credits at $1.80 each. Its features include the Context Agent, Slack and email reports, priority email support and more than 35 data connectors.
- Team: 800 credits come with the $720 monthly price, and each extra credit is $1.44. This tier adds workspaces, SSO, embedding and row-level security, plus help migrating off your current BI tool and dedicated support.
- Enterprise: Priced on request. It covers unlimited credits at a volume discount, plus self-hosted deployment, audit logs, SLA guarantees and a dedicated account manager.
Dot pros and cons
✅ Managers ask and get answers without leaving Slack or Microsoft Teams
✅ You can open the query behind any figure
✅ Unlimited users on every paid plan
✅ Scheduled reports explain why a number changed
❌ Needs a connected warehouse or database before the first question
#2: ThoughtSpot
Best for: Companies rolling analytics out to a wide business audience that prefers searching over waiting for a new dashboard.
Similar to: Supaboard, Qlik Sense.
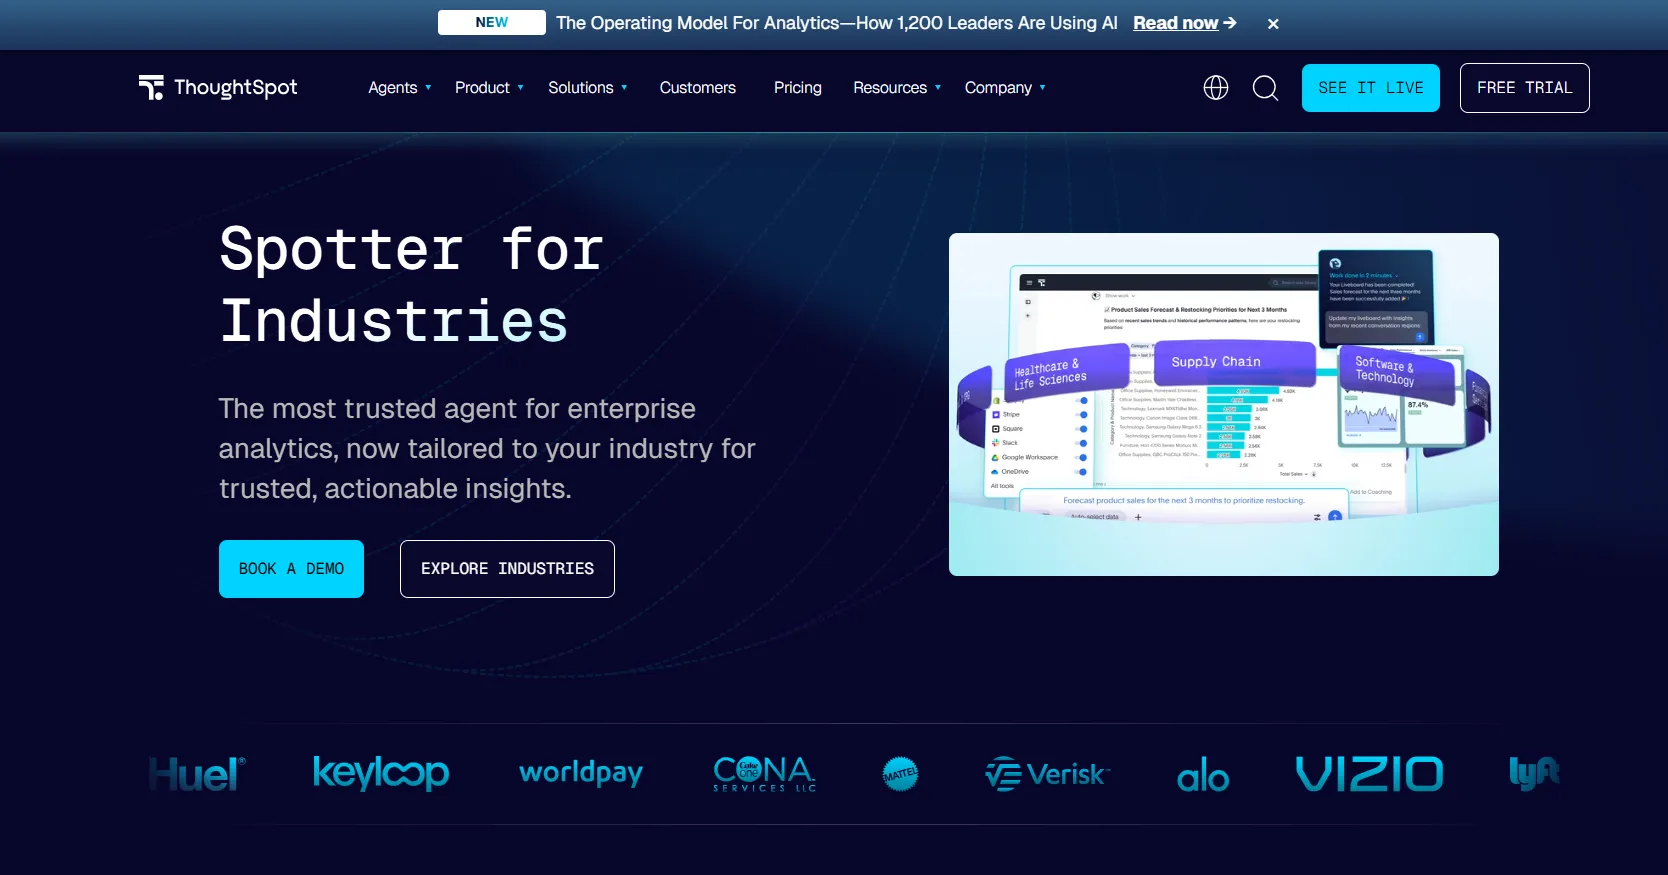
ThoughtSpot answers questions typed in everyday language with governed charts built from live warehouse data, and its Spotter agent carries the conversation into follow-ups.
Its plans stretch from five users on Essentials to unlimited users on Enterprise, which puts it within reach of mid-sized and large companies alike.
ThoughtSpot's top features
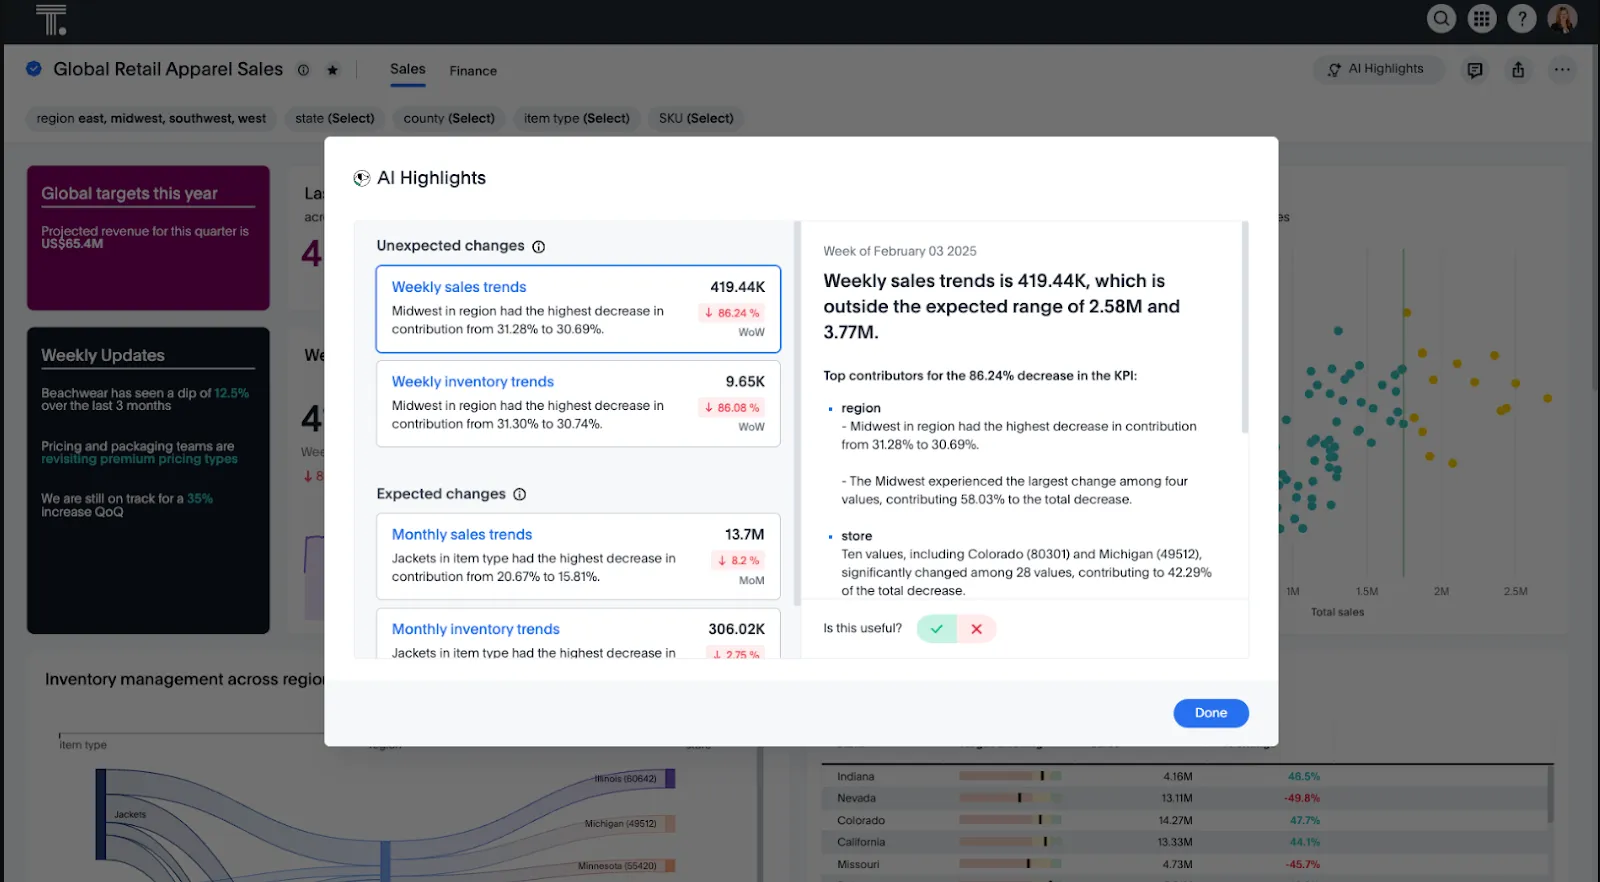
- Spotter: ThoughtSpot's AI analyst holds a conversation about your data, and the platform suggests follow-up questions along the way.
- Automated change analysis: ThoughtSpot lists automatic analysis of metric changes among the AI features on its plans.
- KPI monitoring: Automated KPI monitoring, with anomaly detection and alerts, is included on every plan.
- Mobile apps: iOS and Android apps come with every plan, so a manager can check a KPI away from the desk.
ThoughtSpot pricing
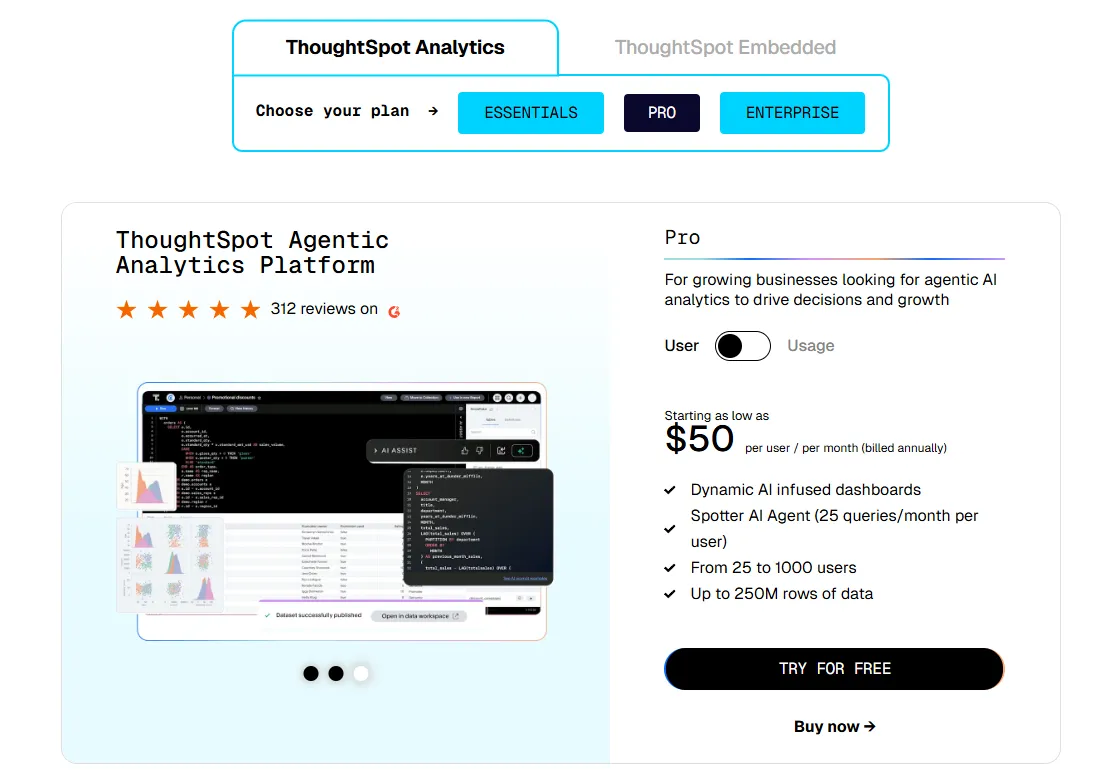
ThoughtSpot Analytics starts at $25 per user per month on the annual Essentials plan.
- Essentials: $25 a user each month on an annual contract, for teams of 5 to 50 users and data up to 25 million rows.
- Pro, per user: At $50 a user each month, also billed annually, this tier handles 25 to 1,000 users and 250 million rows, and each user gets 25 Spotter queries a month.
- Pro, usage-based: A metered alternative starting at $0.10 per query, which bundles Spotter with Analyst Studio.
- Enterprise: Custom pricing with no ceiling on users or data.
There's also a separate ThoughtSpot Embedded line for building analytics into your own product, including a Developer plan that's free for one year.
ThoughtSpot pros and cons
✅ Business users can get a first answer before anyone builds a dashboard
✅ Anomaly alerts are included from the entry plan
❌ Buyers have to model two Pro billing options before choosing
#3: Zoho Analytics
Best for: Growing businesses that want drag-and-drop reports on their business app data, with prices listed upfront.
Similar to: Microsoft Power BI, Metabase.
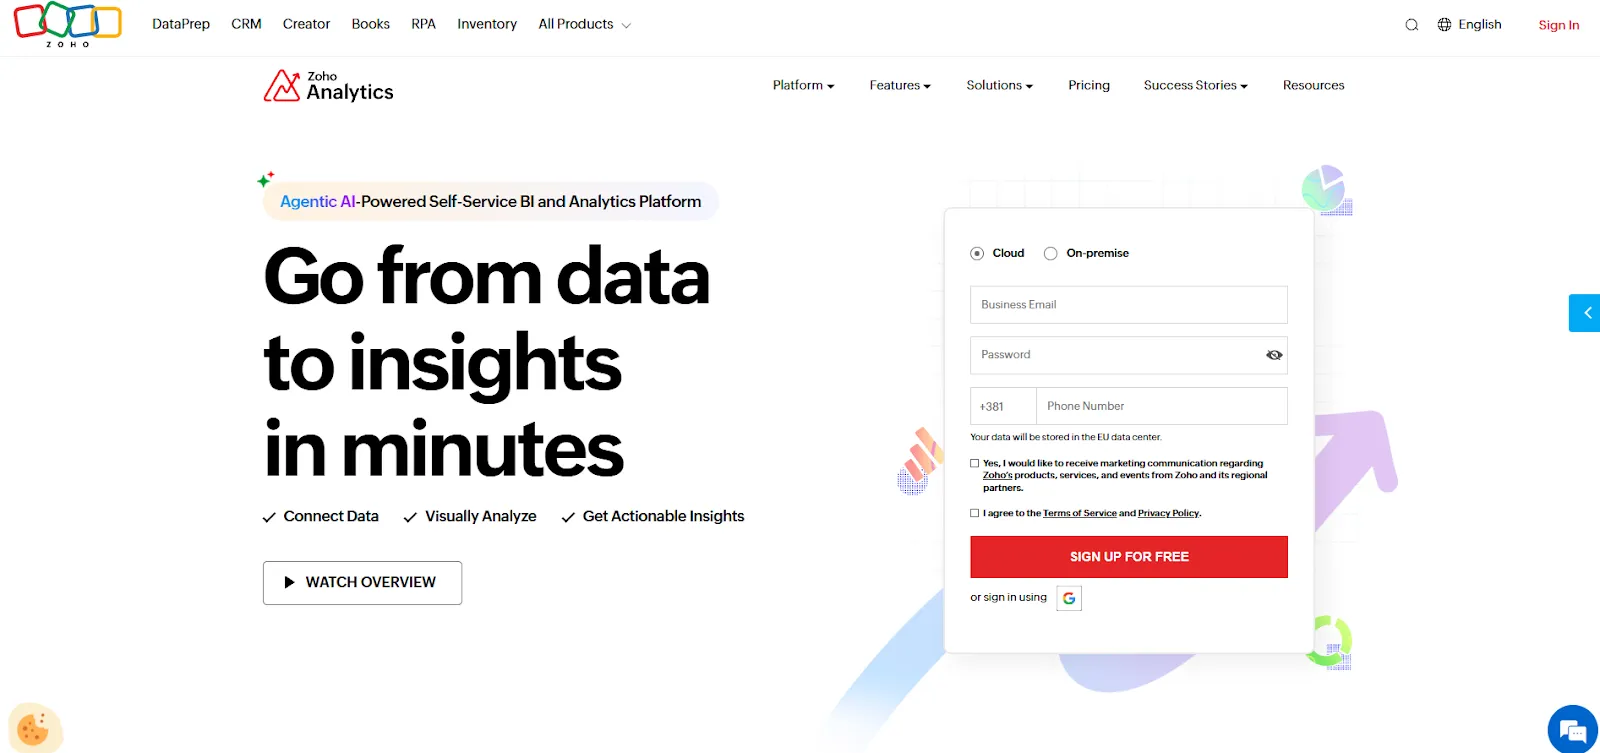
Zoho Analytics brings data from databases and more than 50 business apps into a drag-and-drop report builder, where an AI agent called Ask Zia takes questions in everyday language.
Small and mid-sized companies make up its core audience, especially those already on Zoho CRM or Zoho Books.
Zoho Analytics' top features
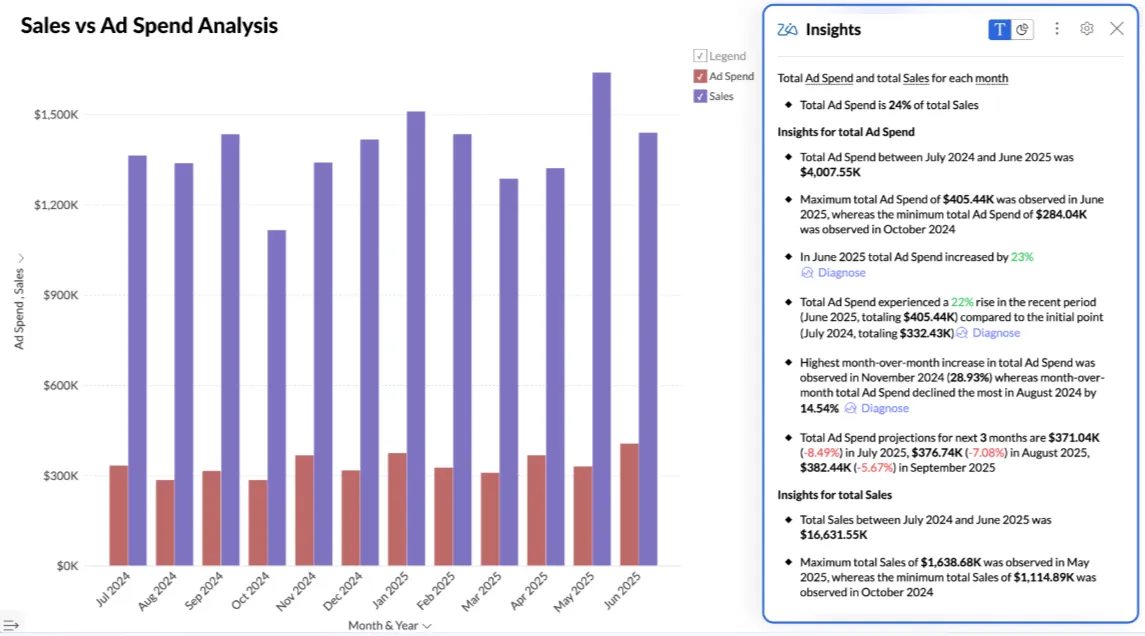
- Pre-built reports for business apps: Each business app connector ships with ready-made reports and dashboards, so CRM or accounting data is readable from the first day.
- Ask Zia: Zoho's AI agent builds reports from typed requests and recommends next steps, and its LLM-powered version is limited to Premium and Enterprise.
- Auto Analysis: Zoho can generate a full set of reports and dashboards from any dataset in one click, and you decide which ones to keep or edit.
- Data Storytelling: You can present reports as a slideshow, and the Standard plan and above let you write a narrative for each slide.
Zoho Analytics pricing
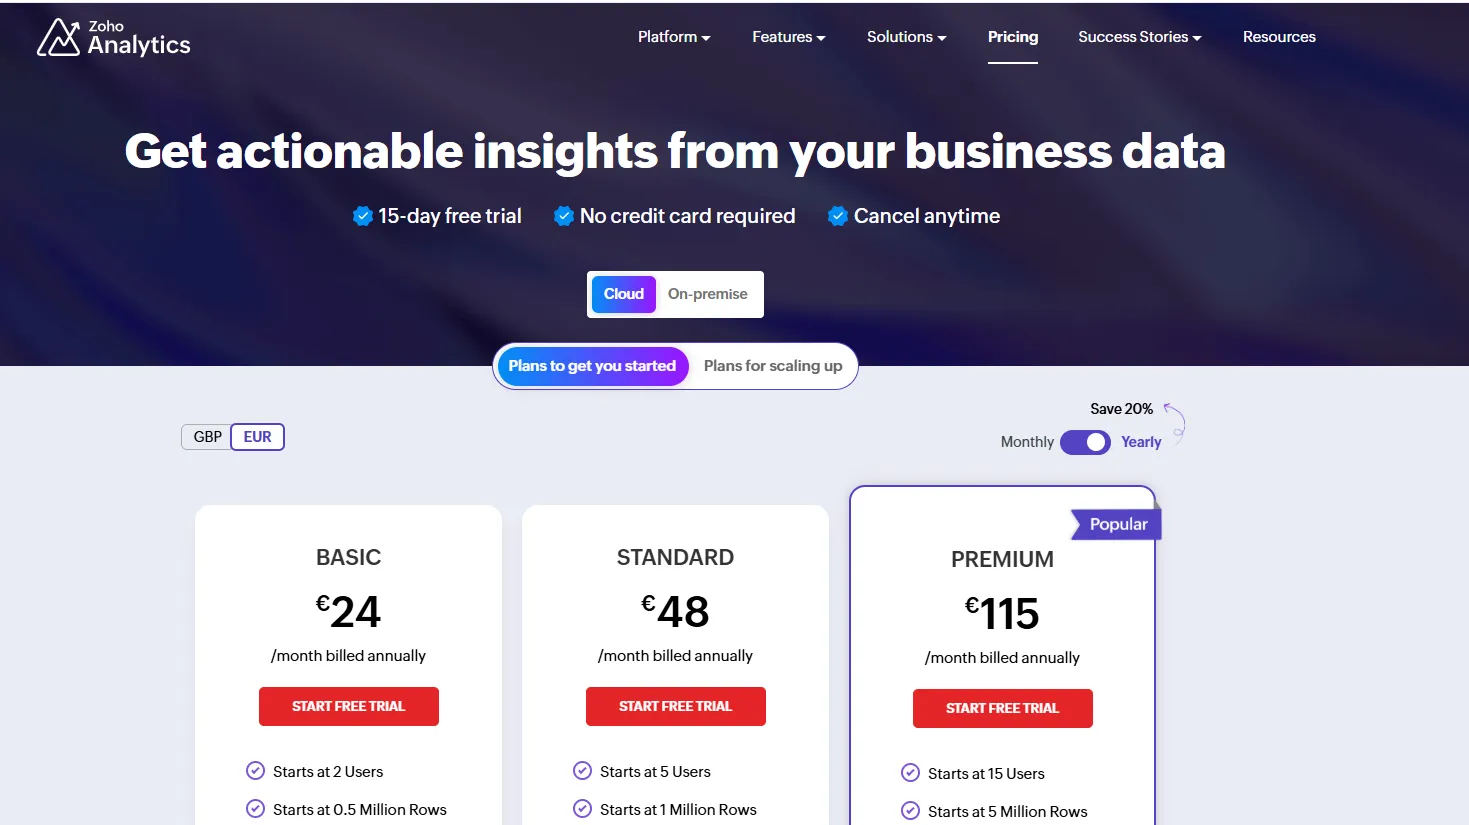
Zoho Analytics has a permanent free plan, and its paid tiers run from $30 a month on Basic up to $575 on Enterprise.
The free plan covers two users and 10,000 rows, while every paid plan starts with a 15-day trial.
Zoho Analytics’ pricing starts at $30 a month for Basic on monthly billing, and a permanent free plan covers 2 users and 10,000 rows.
- Basic: $30 a month covers two users and half a million rows.
- Standard: For $60 a month, five users share 1 million rows.
- Premium: $145 a month for 15 users and 5 million rows. The LLM-powered Ask Zia agent and Zoho DataPrep both start at this tier.
- Enterprise: At $575 a month, 50 users get 50 million rows, plus AutoML and a Code Studio for custom Python.
Zoho Analytics pros and cons
✅ Published prices at every tier
✅ Connectors come with ready-made reports attached
❌ The LLM-powered Ask Zia agent starts at Premium
#4: Supaboard
Best for: Startups and lean teams with nobody writing SQL who want dashboards generated from a written request.
Similar to: ThoughtSpot, Metabase.
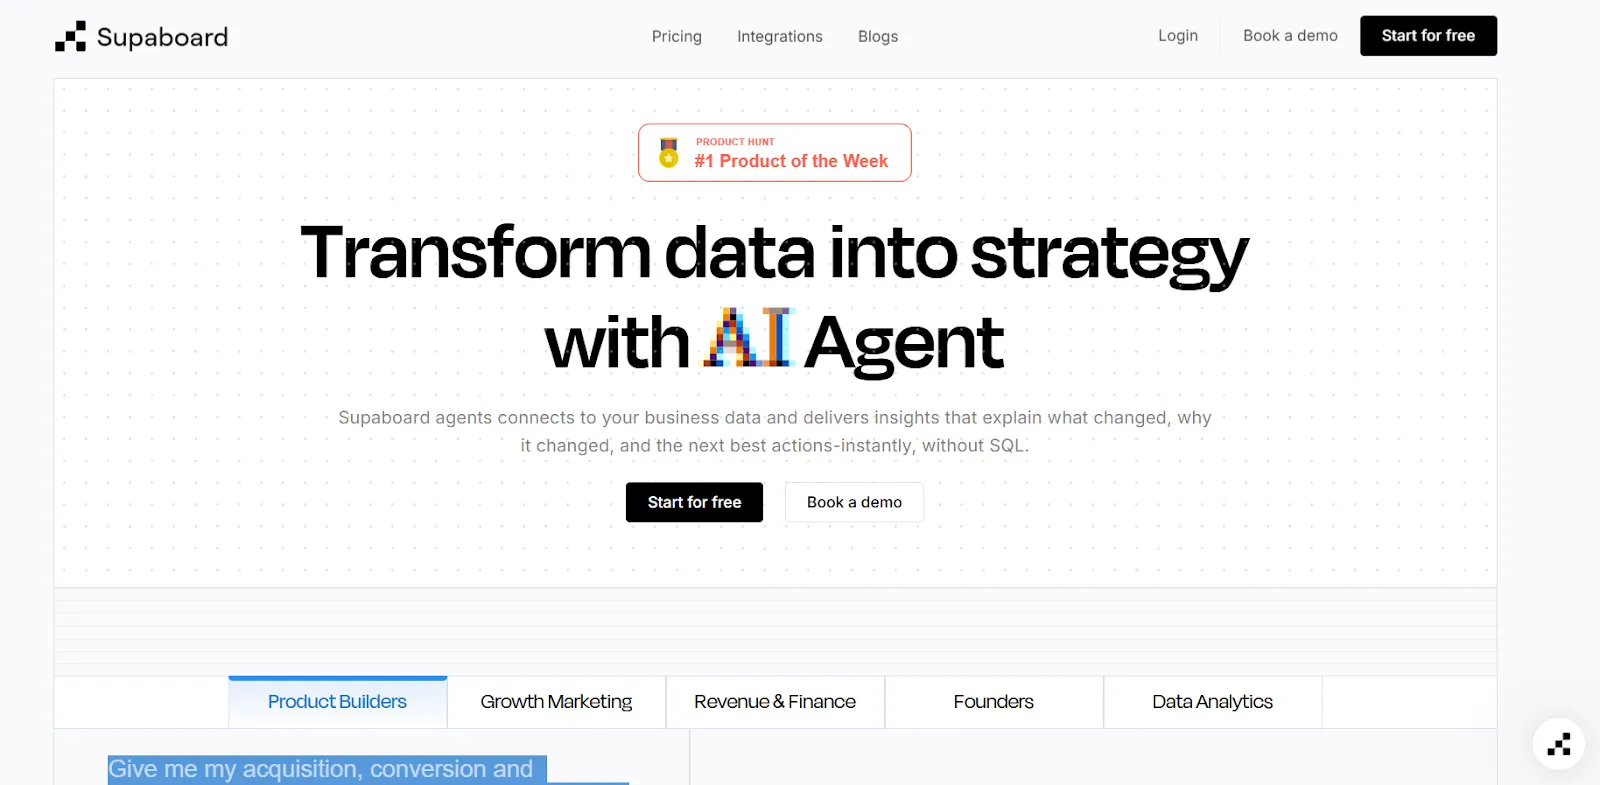
Supaboard connects to a database or business app and builds dashboards and reports from a written request, skipping the modeling step many BI tools require before a first answer.
As Supaboard bills only the people who edit, it suits lean teams where a handful build and everyone else reads.
Supaboard's top features
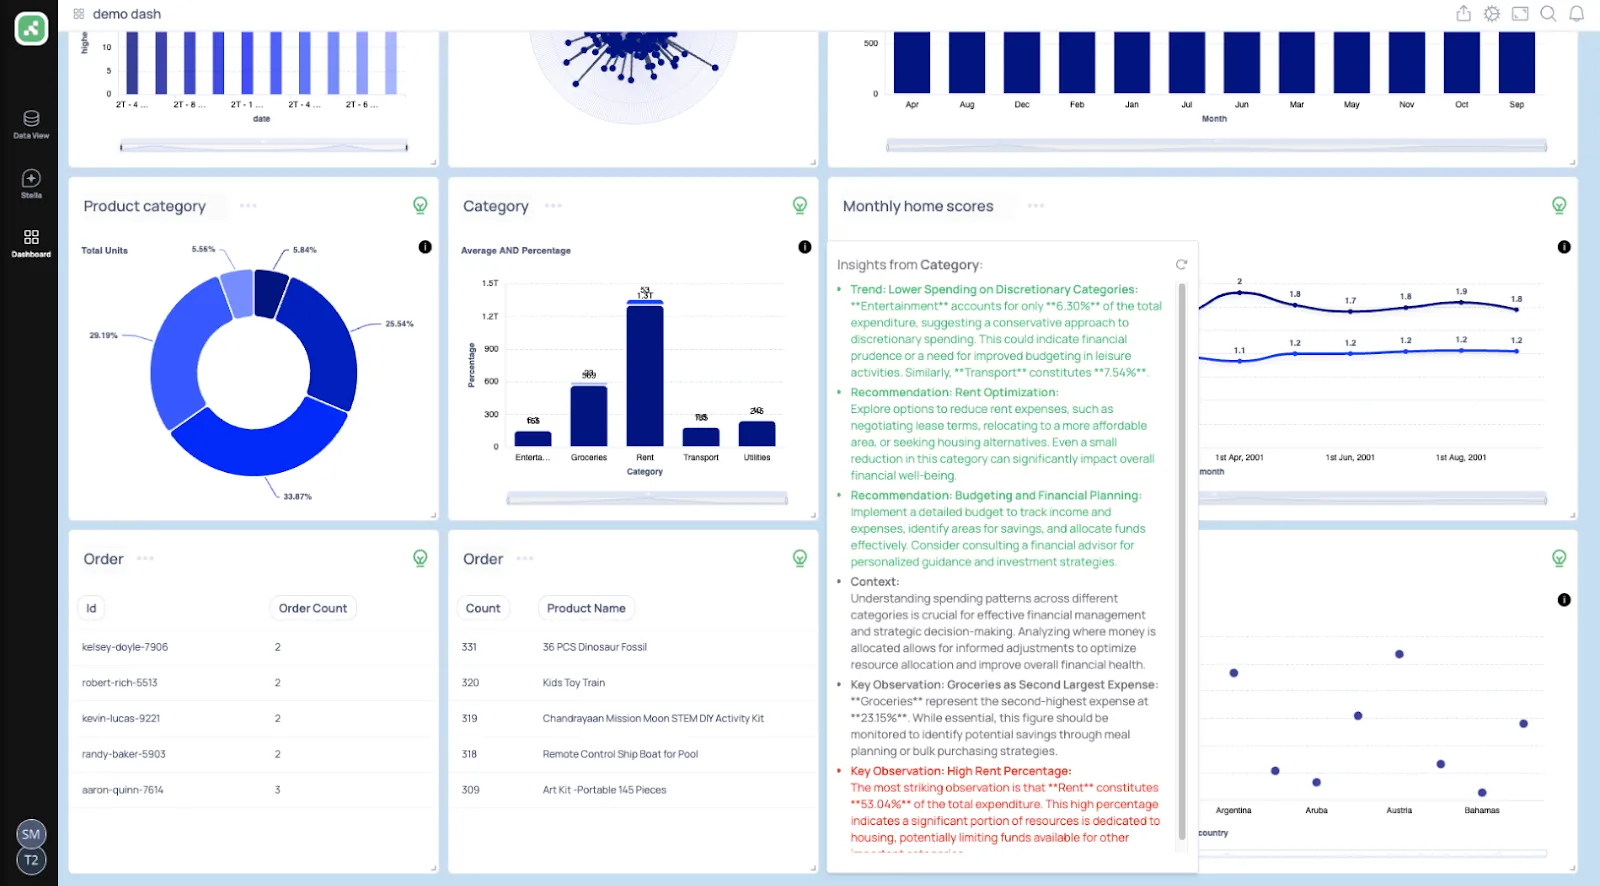
- Ask Analysts: Supaboard's chat interface replies to a typed question with a chart and a short written explanation.
- Report builder: A written brief is enough for Supaboard to assemble a report, and the builder is included on every plan.
- Data view: Business users can filter, sort, pivot and chart the distribution of any result without opening a query editor.
- Public share links: Dashboards and whole conversations can be shared through a public link, which helps when the audience has no Supaboard account.
Supaboard pricing
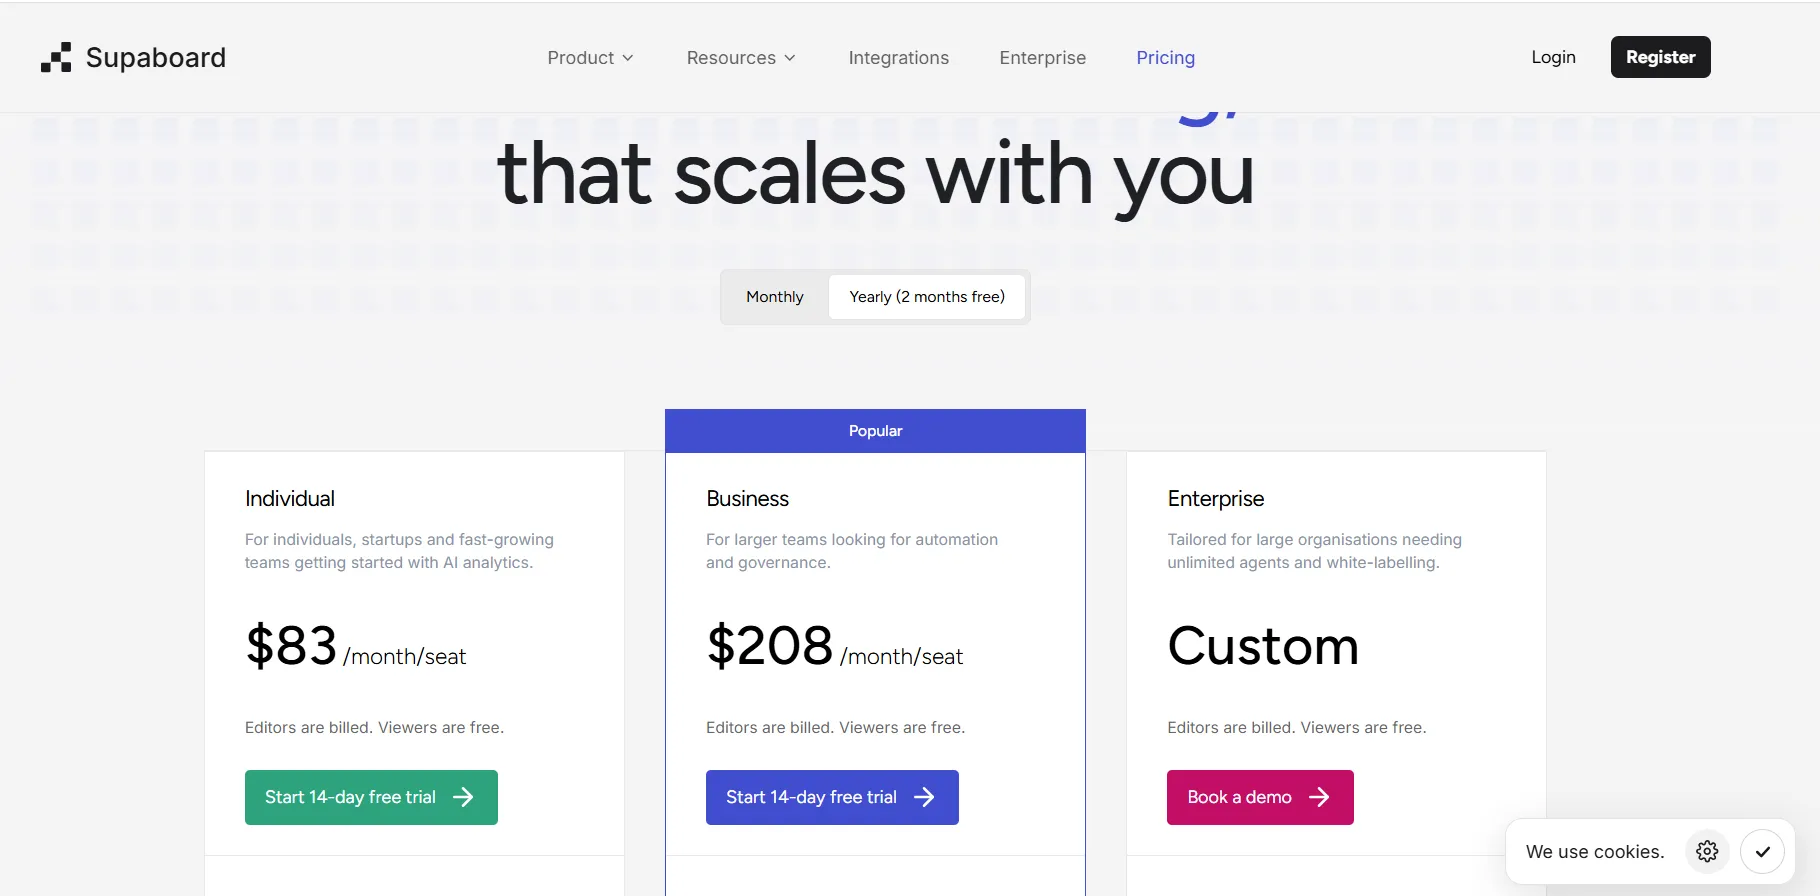
Supaboard's Individual plan is $99 per user per month, or $83 if you pay annually.
Editors count as billable seats, as do admins and owners, but viewers are free and uncapped.
There's a 14-day trial on every plan, and you won't need a card to start it.
- Individual: $83 per seat per month billed annually, covering two data connections and two custom data agents.
- Business: For $208 per seat per month billed annually, teams get unlimited connections across more than 700 connectors and unlimited automations for reports and alerts.
Supaboard pros and cons
✅ Viewers cost nothing, however many there are
✅ You can start from a connection, with no modeling layer to write first
❌ Limited dashboard customization options are implied by a G2 review.
#5: Sigma
Best for: Excel-fluent finance and operations teams whose data is already in a cloud warehouse.
Similar to: Metabase, Microsoft Power BI.
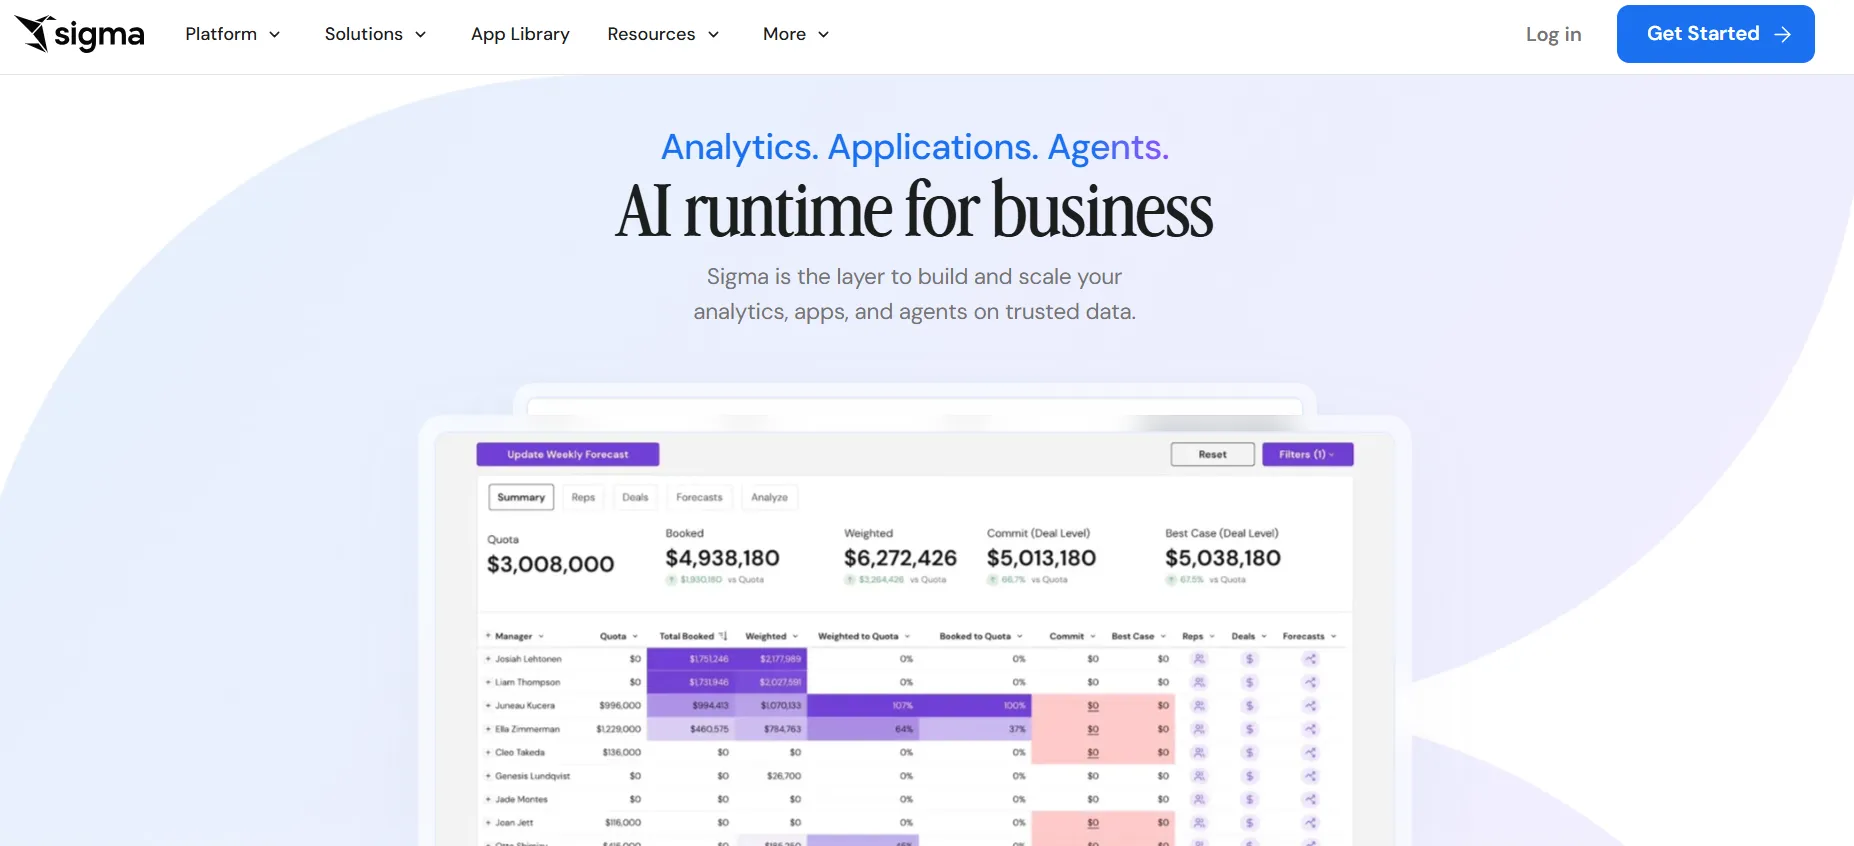
Sigma gives your cloud data warehouse a spreadsheet interface, translating formulas and pivots into queries that run against live data.
Analysts and business teams who think in spreadsheets use it most, particularly when their data is already in Snowflake or BigQuery.
Sigma's top features
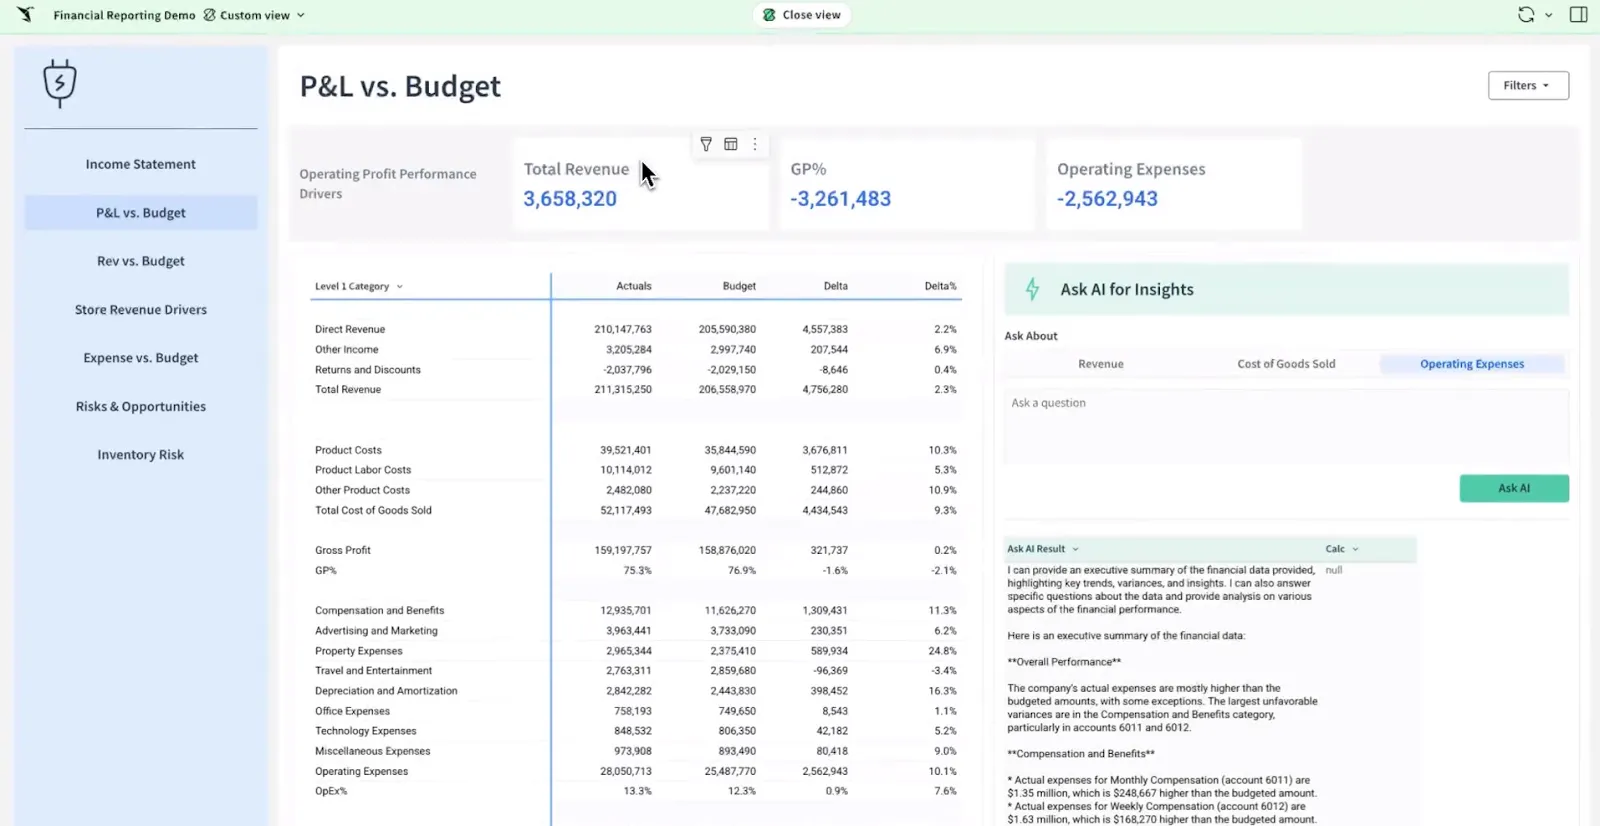
- Input tables: Business users type values into a table that writes back to the warehouse, which makes budget and forecast assumptions easy to capture.
- Sigma Assistant: Launched in May 2026 as the successor to Ask Sigma and AI Builder, it responds to questions using your certified metrics and data models, and users can inspect the formulas and filters behind every answer. Its Build mode, which drafts workbooks from a description, is still in beta.
- Explain this Chart: Sigma writes a short description and summary of any chart on request, so a manager gets the main observations in words.
- Formula Assistant: Sigma's AI can draft a formula from a description, and it also explains or corrects formulas already in the workbook.
Sigma pricing
Sigma doesn't publish prices, so every purchase goes through a sales quote.
Quotes depend on the mix of seat types, and viewer seats cost less than the builder seats that create workbooks.
Your warehouse provider bills the compute separately, since every Sigma query runs in your warehouse.
Sigma pros and cons
✅ Excel users keep the formulas they already know
✅ Writeback to the warehouse through input tables
❌ No public pricing
#6: Metabase
Best for: Startups and product teams that want point-and-click analytics on their own database, free if they host it.
Similar to: Sigma, Zoho Analytics.
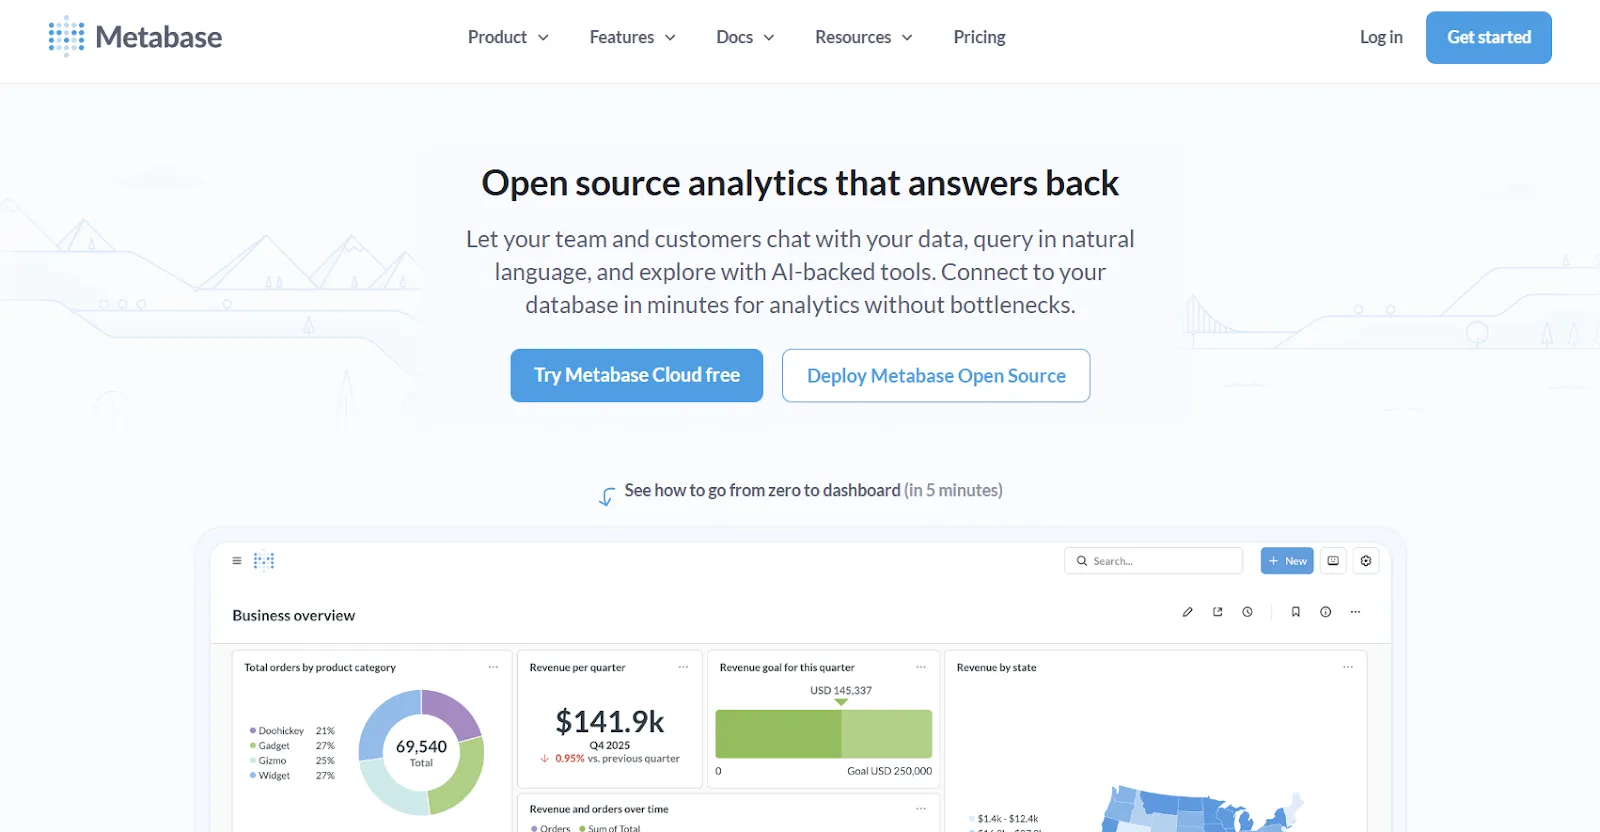
Metabase, an open-source analytics tool, lets users build questions by clicking through menus in a visual query builder, and SQL stays available for anyone who prefers it.
Metabase's top features
- Query builder: Users build a question by adding filters and joins to a table from menus, then choose how to summarize and chart the result.
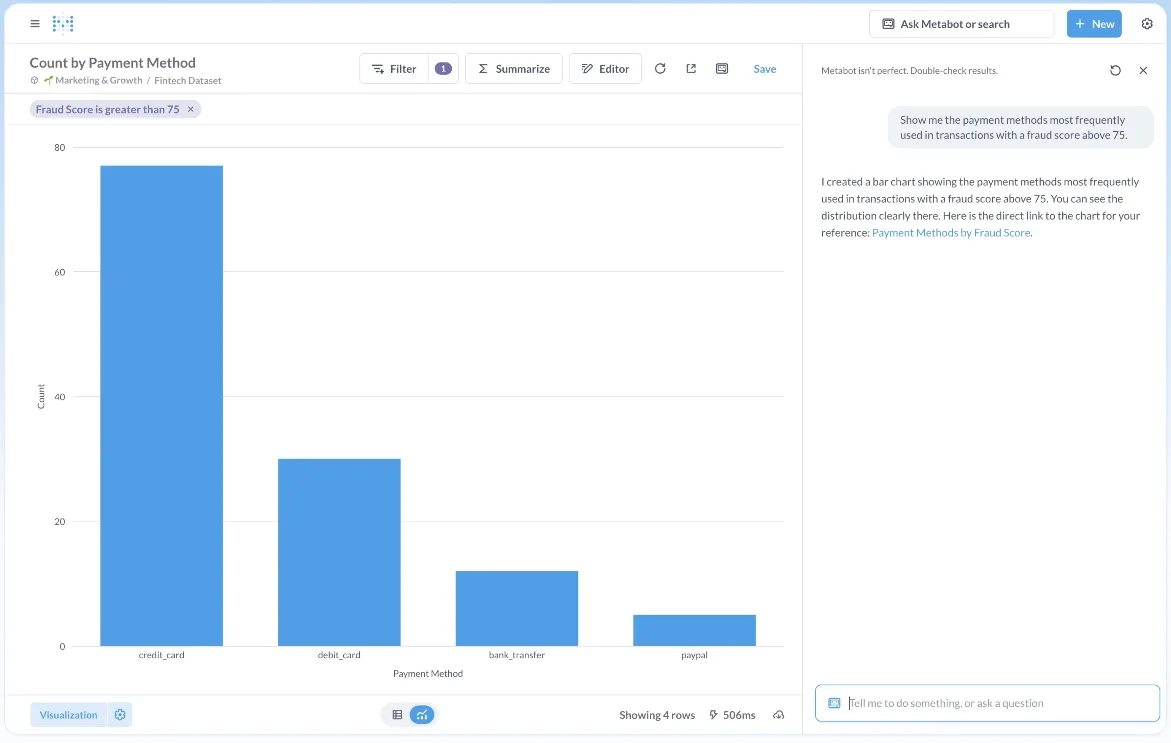
- Metabot: Metabase's AI assistant answers typed questions with charts built on your semantic definitions. Metabase includes it in every edition, open source among them, and also offers it inside Slack.
- CSV uploads: A spreadsheet or CSV can be uploaded for analysis when the data isn't in a database, and the first 1 million stored rows are free.
- Dashboard subscriptions: Users can have a dashboard sent by email or Slack on a schedule, which puts the numbers in front of people who rarely log in.
Metabase pricing
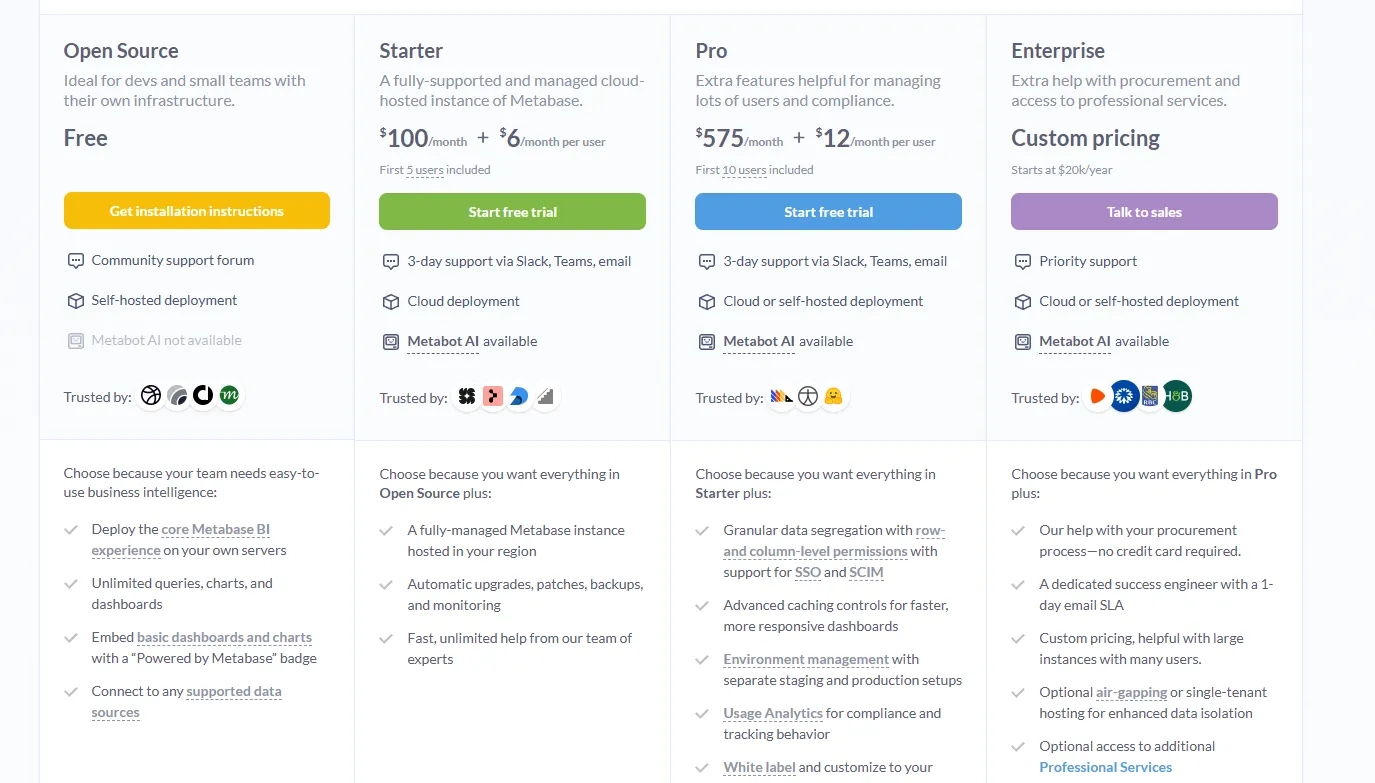
Metabase is free to self-host as open source, and its cloud Starter plan costs $100 a month with five users included.
- Open Source: Free for unlimited users and dashboards, as long as your team hosts and maintains the server.
- Starter: $100 a month including five users, plus $6 per extra user each month, with Metabase running the hosting and upgrades.
- Pro: Priced at $575 a month for the first 10 users and $12 for each one after that, Pro adds row- and column-level permissions and SSO.
- Enterprise: Custom pricing from $20,000 a year, including a dedicated success engineer and a one-day support SLA.
Metabase pros and cons
✅ A full open-source edition at no cost
✅ Metabot ships with every edition
❌ A user on G2 believes that Metabase will benefit from having an AI assistant that understands the databases and assists in building queries
#7: Qlik Sense
Best for: Organizations exploring complex data that want related values to surface as users click through it.
Similar to: Tableau, Microsoft Power BI.
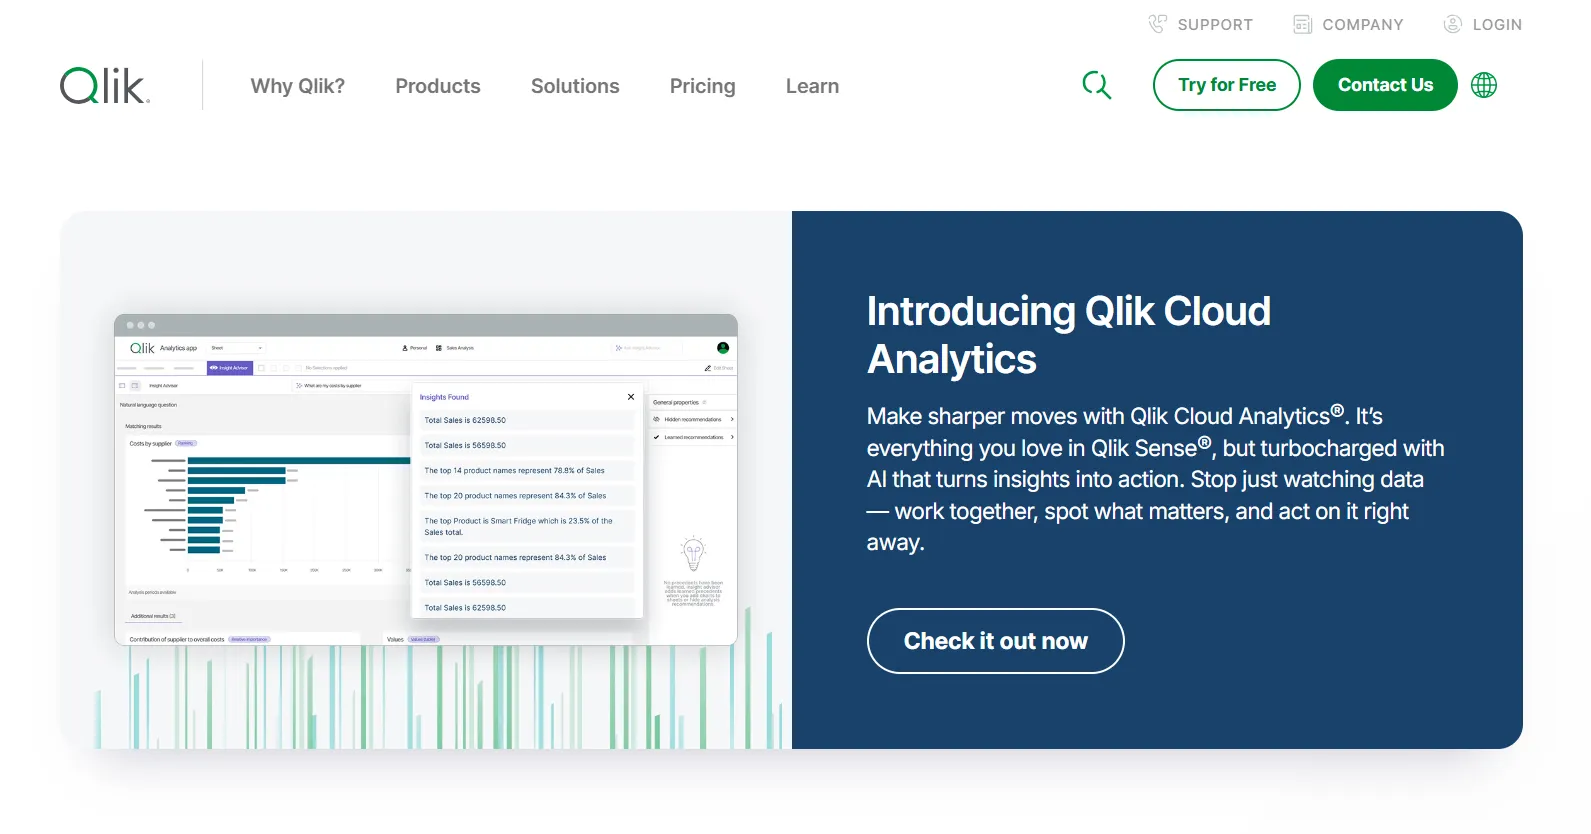
Qlik Sense, sold in the cloud as Qlik Cloud Analytics, is built on an associative engine that keeps every field in the data linked, so one click shows what's related across the whole app.
Above the entry tier, Qlik stops charging per user, a model that suits mid-sized and large organizations with many people exploring data.
Qlik Sense's top features
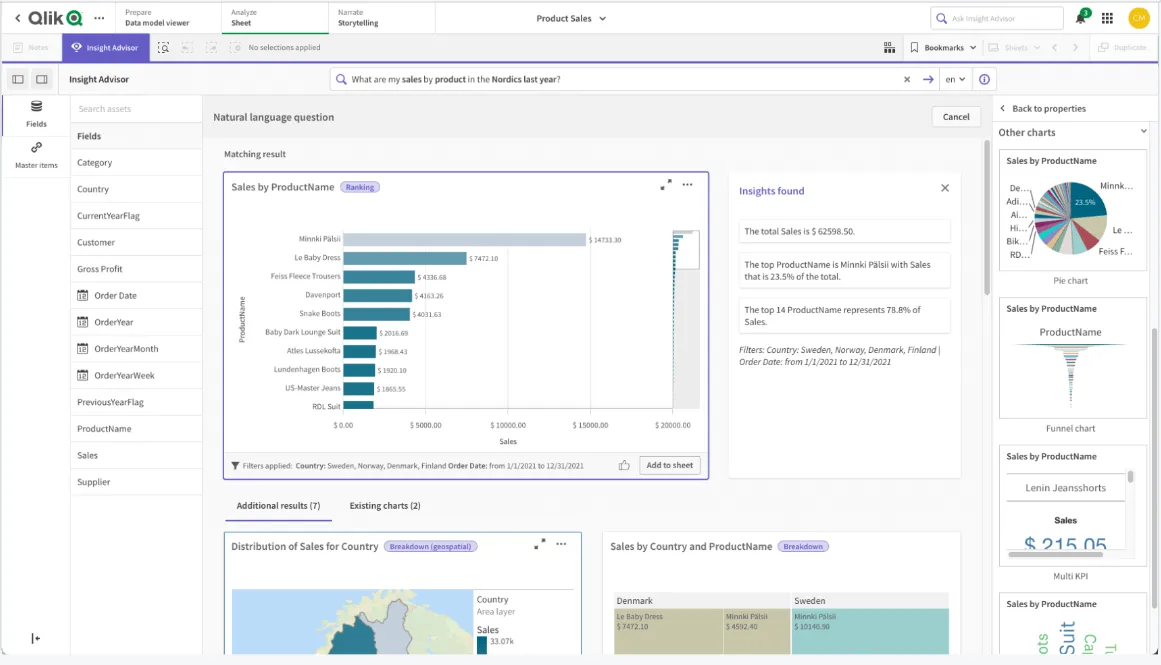
- Qlik Answers: Beyond replying in conversation, Qlik's assistants can index unstructured documents where they're already kept.
- Qlik Predict: Premium subscribers get predictive analytics built on automated machine learning, with no data science code involved.
- No-code automation builder: Teams set up actions in other systems that fire when data changes, working from a visual builder.
- Scheduled report delivery: Qlik generates reports and sends them out automatically, a feature included on every tier.
Qlik Sense pricing
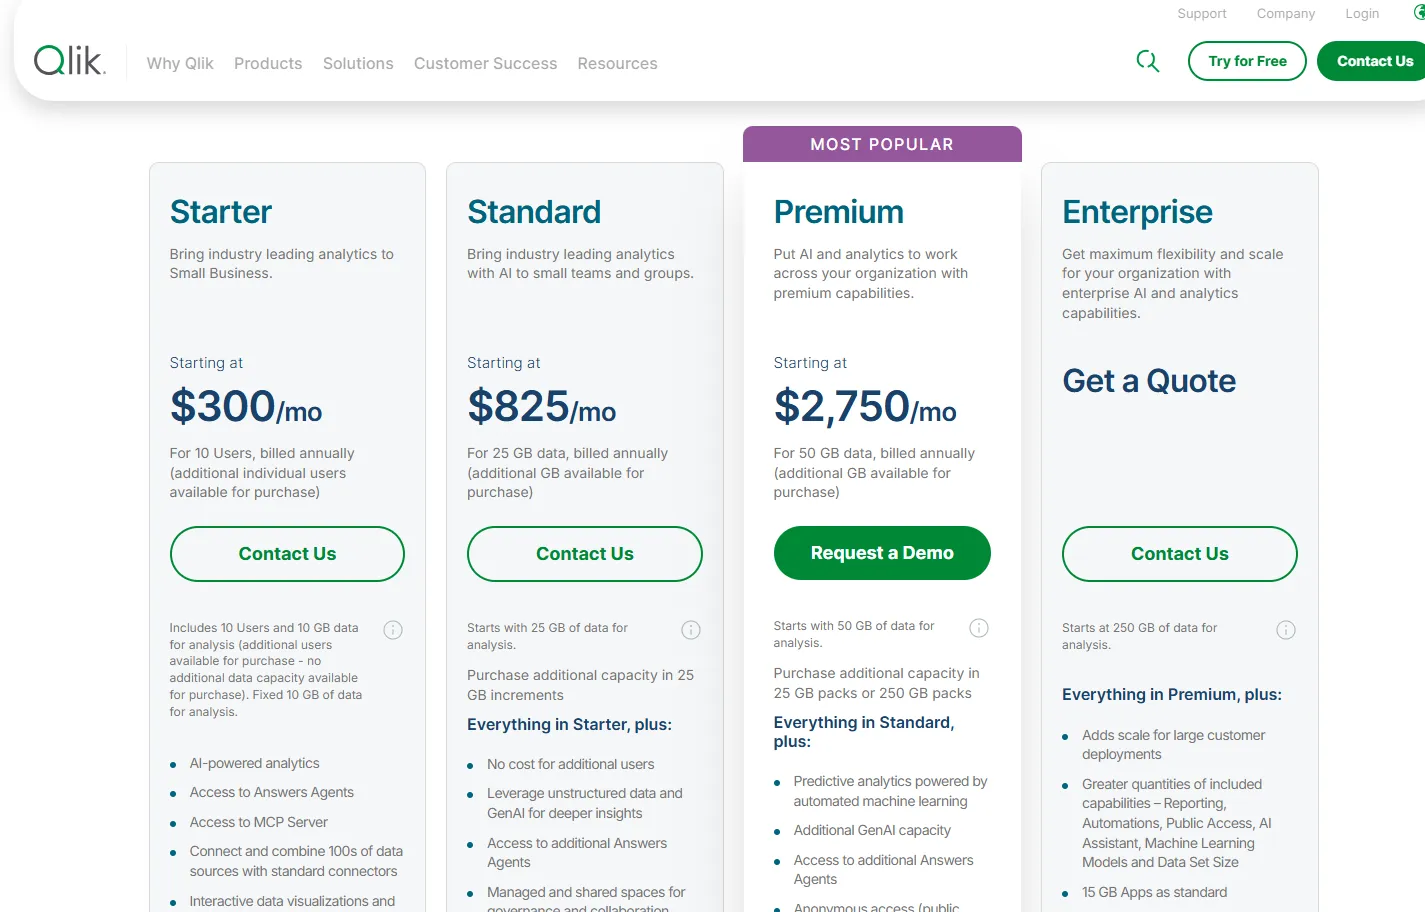
Qlik Cloud Analytics starts at $300 a month on the Starter plan, billed annually, for 10 users and 10 GB of data.
From Standard upward, Qlik prices by the volume of data loaded for analysis, and extra users cost nothing.
- Starter: $300 a month for 10 users and a fixed 10 GB of data, with AI-powered analytics and access to Qlik's MCP server.
- Standard: The $825 monthly price covers 25 GB of data and any number of users, and more capacity comes in 25 GB steps.
- Premium: $2,750 a month for 50 GB of data. It's the tier that adds predictive analytics and anonymous public access.
- Enterprise: Quoted by Qlik, starting at 250 GB of data.
Qlik Sense pros and cons
✅ Unlimited users from Standard upward
✅ Every chart responds at once when a user clicks a value
❌ A G2 review mentions that there can be loading issues, especially when business intelligence is running updates.
#8: Domo
Best for: Operations and BI teams that want visual data preparation and no-code apps from one vendor.
Similar to: Zoho Analytics, Microsoft Power BI.
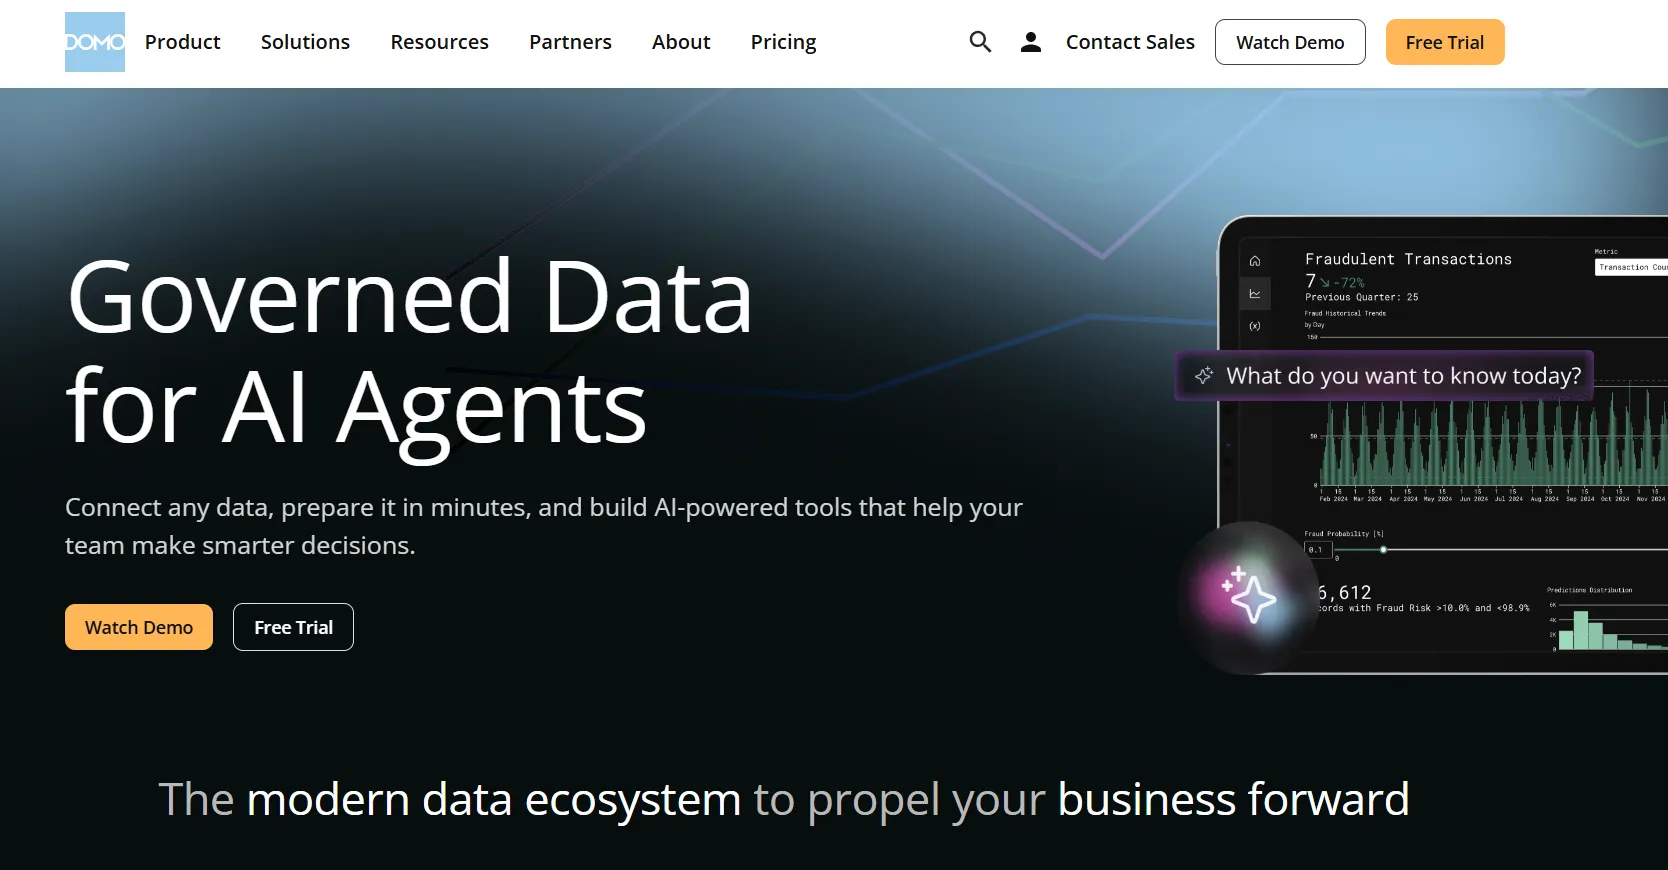
Domo pulls data in through more than 1,000 connectors and reshapes it in a drag-and-drop tool called Magic ETL, all on one hosted platform.
Mid-market and enterprise companies choose Domo when they want one contract covering the route from source data to the apps their teams use.
Domo's top features
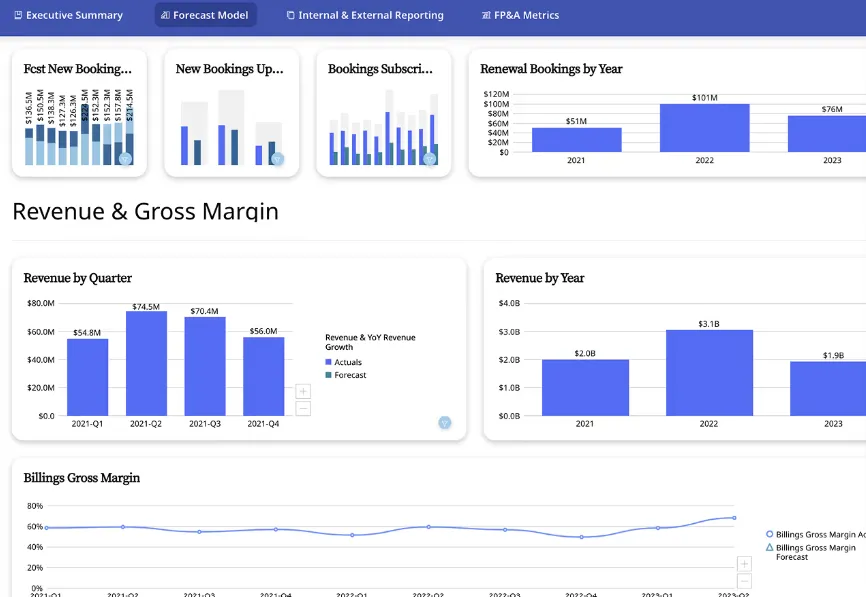
- Magic ETL: Analysts join and reshape datasets by arranging transformation steps in a visual flow.
- App Studio: Teams assemble data apps around a specific business process with no developer involved.
- Agent Catalyst: In this no-code workspace, a team defines what each AI agent knows and approves the tools it may use.
- Native mobile apps: Managers can open Domo dashboards on iOS and Android.
Domo pricing
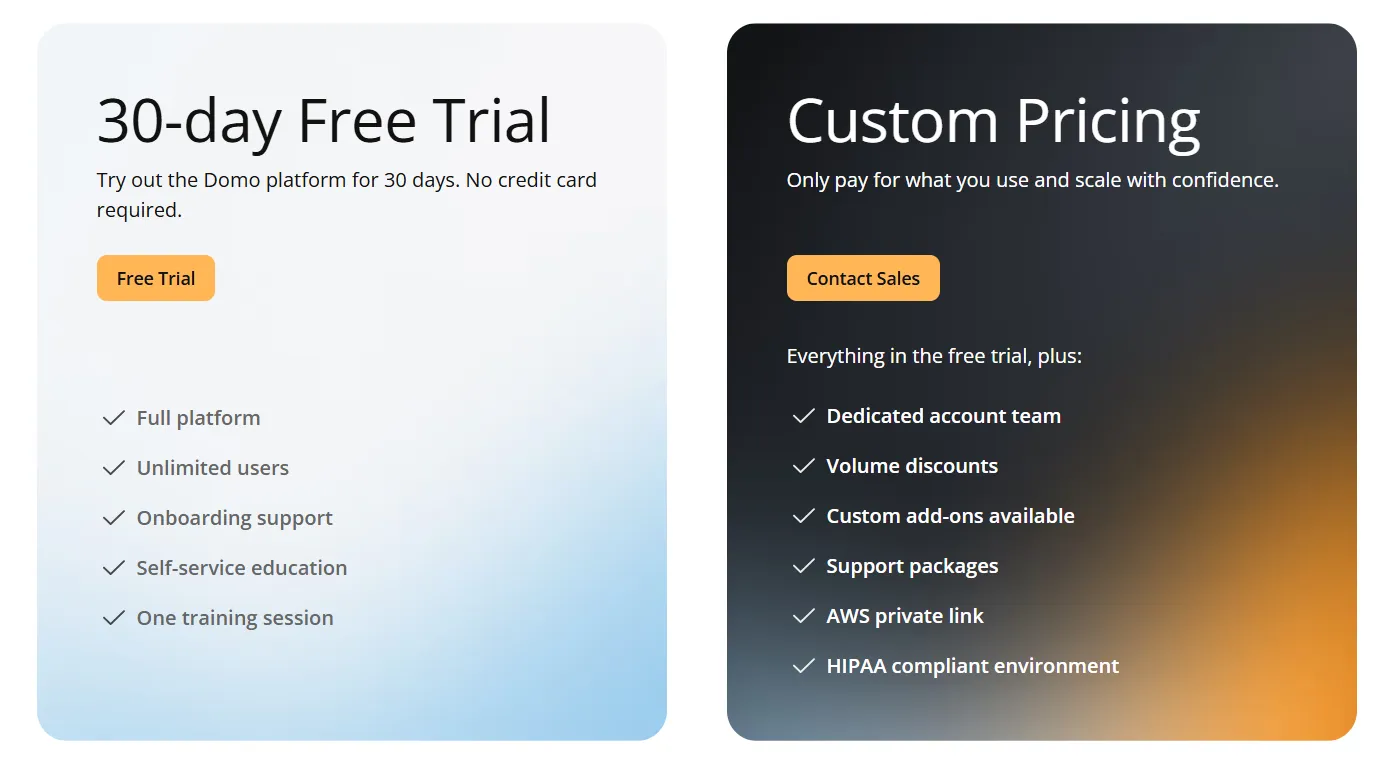
Domo has no published rates, and the only entry point without a sales conversation is a 30-day trial.
That trial asks for no credit card and caps neither credits nor users, and it includes onboarding support with one training session.
- Free trial: 30 days, no credit card needed, with full platform access for unlimited users and a guided training session.
- Paid plan: usage-based pricing that scales with analytics needs, adding a dedicated account team, volume discounts, and support packages.
➡️ We work through what the credit model would to your budget in ourDomo pricing guide.
Domo pros and cons
✅ Analysts can prep data in Magic ETL without SQL
✅ More than 1,000 connectors
❌ No published rates
#9: Microsoft Power BI
Best for: Companies whose staff already work in Excel and Teams and want reports they can build without code.
Similar to: Tableau, Qlik Sense.
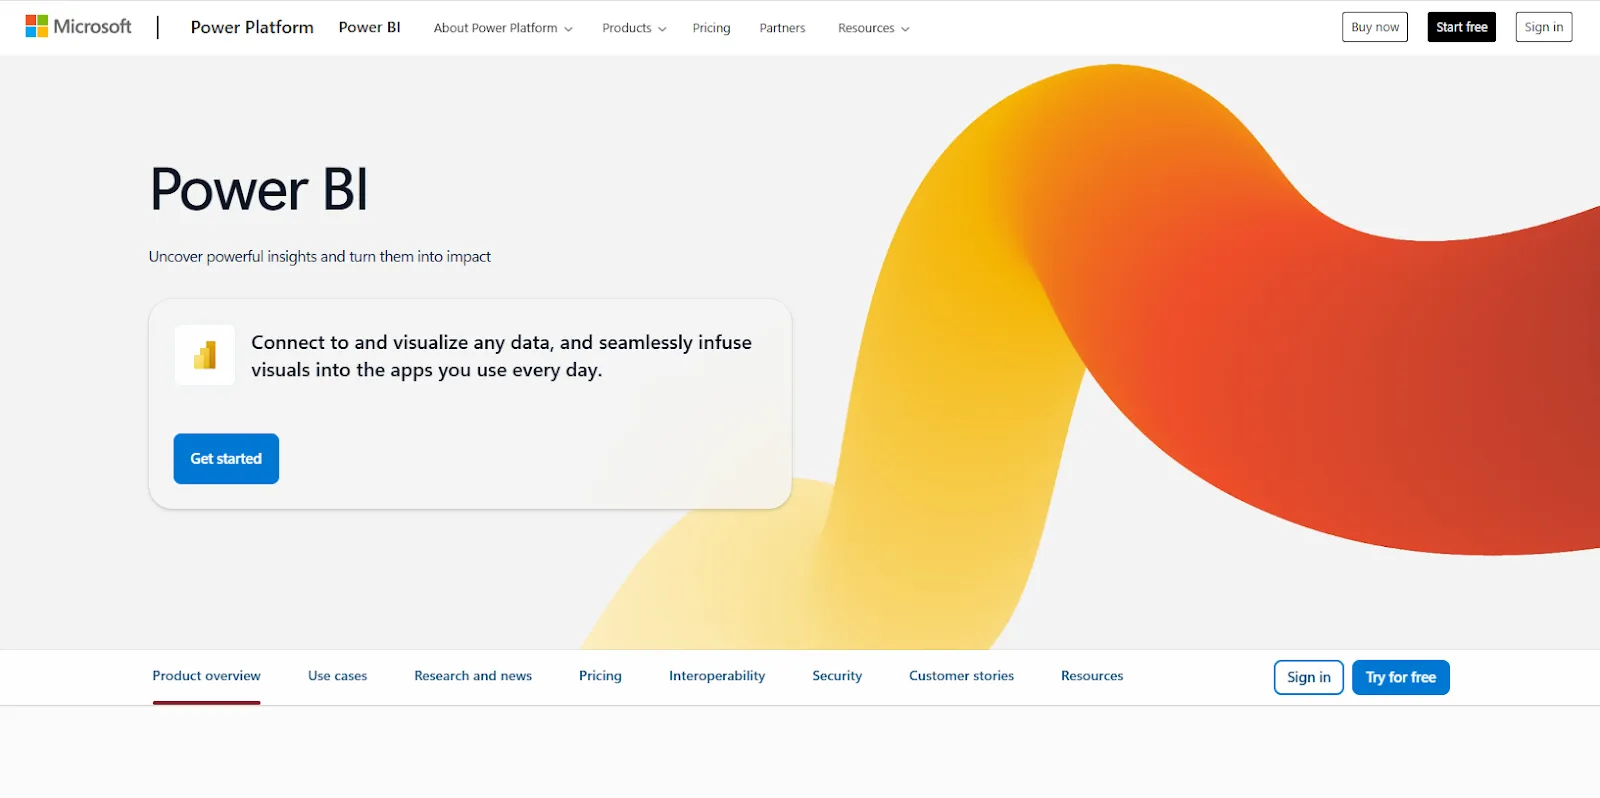
Microsoft Power BI lets users build interactive reports by dragging fields onto a canvas in Power BI Desktop, while Copilot answers questions from the underlying semantic model.
The natural buyer is a company already on Microsoft 365, where Excel and Teams are part of everyday work.
Microsoft Power BI's top features
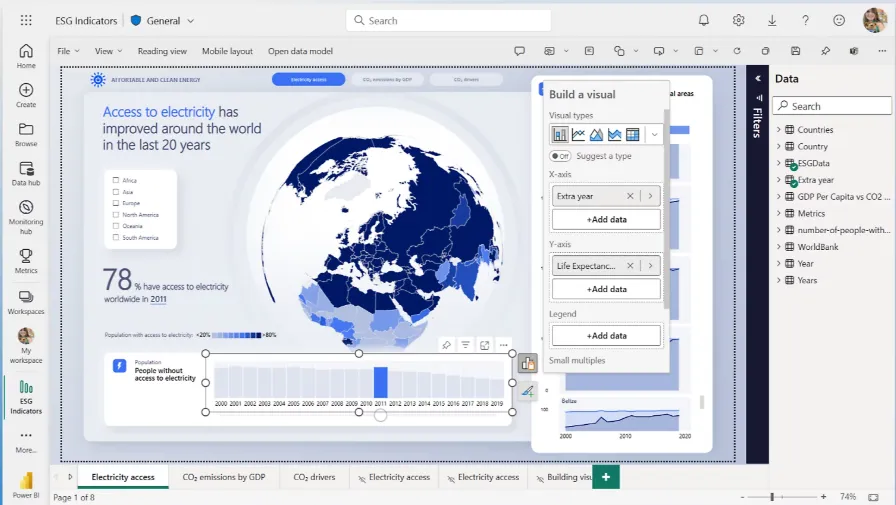
- Power Query: Users merge tables and change data types through menus with a live preview, in the same editor Excel ships with.
- Report canvas: Visuals are built by dropping fields onto a page, and readers can filter and drill into a published report without editing it.
- Copilot: Microsoft's AI assistant reads the semantic model to summarize a report or answer a question about it.
- Analyze in Excel: Finance teams can connect Excel pivot tables straight to a published Power BI semantic model and keep working in the spreadsheet.
Microsoft Power BI pricing
Power BI Pro costs $14 per user per month and Premium Per User costs $24, rates that took effect on April 1, 2025, according to Microsoft's pricing announcement.
- Free: Anyone can build reports in Power BI Desktop for personal use, though they'll need a paid license to share them.
- Power BI Pro: $14 a user each month, the license needed to publish reports for colleagues and place them inside SharePoint or Teams.
- Power BI Premium Per User: At $24 a user each month, this license raises the model size limit and allows 48 scheduled refreshes a day.
- Microsoft Fabric capacity: Organization-wide compute sold as F SKUs, beginning around $262 a month for F2, and from F64 upward report readers don't need their own paid seat.
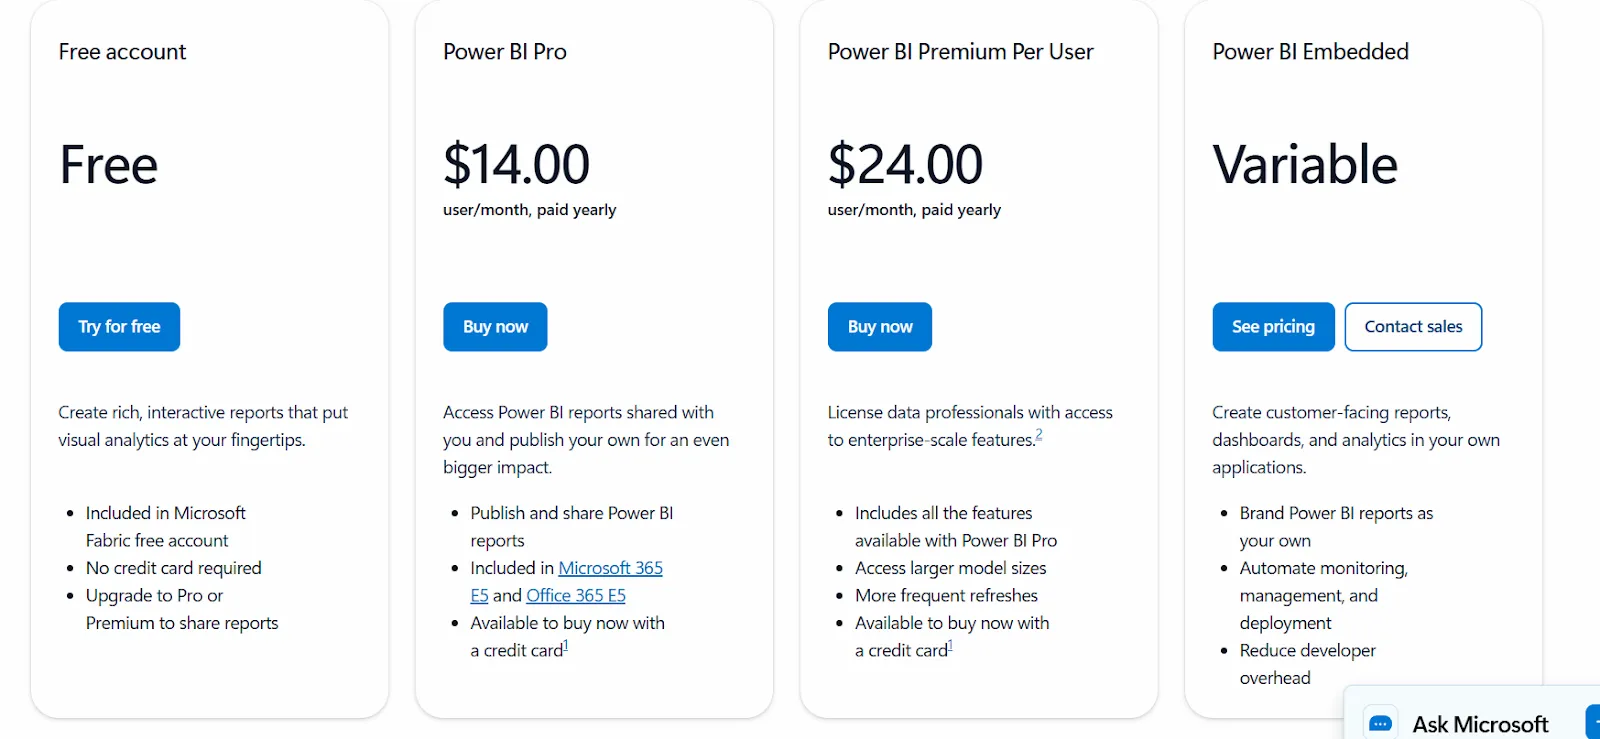
If you sell software and want Power BI inside it for your own customers, that's Power BI Embedded, which Microsoft prices separately.
➡️ We model what seats and capacity cost a growing team in our Power BI pricing guide.
Microsoft Power BI pros and cons
✅ Pro licenses come bundled with Microsoft 365 E5
✅ Spreadsheet users will recognize Power Query and Analyze in Excel
❌ Below F64, each read-only colleague needs a Pro seat
#10: Tableau
Best for: Analysts and business teams that want deep visual exploration, with AI added at the higher editions.
Similar to: Microsoft Power BI, Qlik Sense.
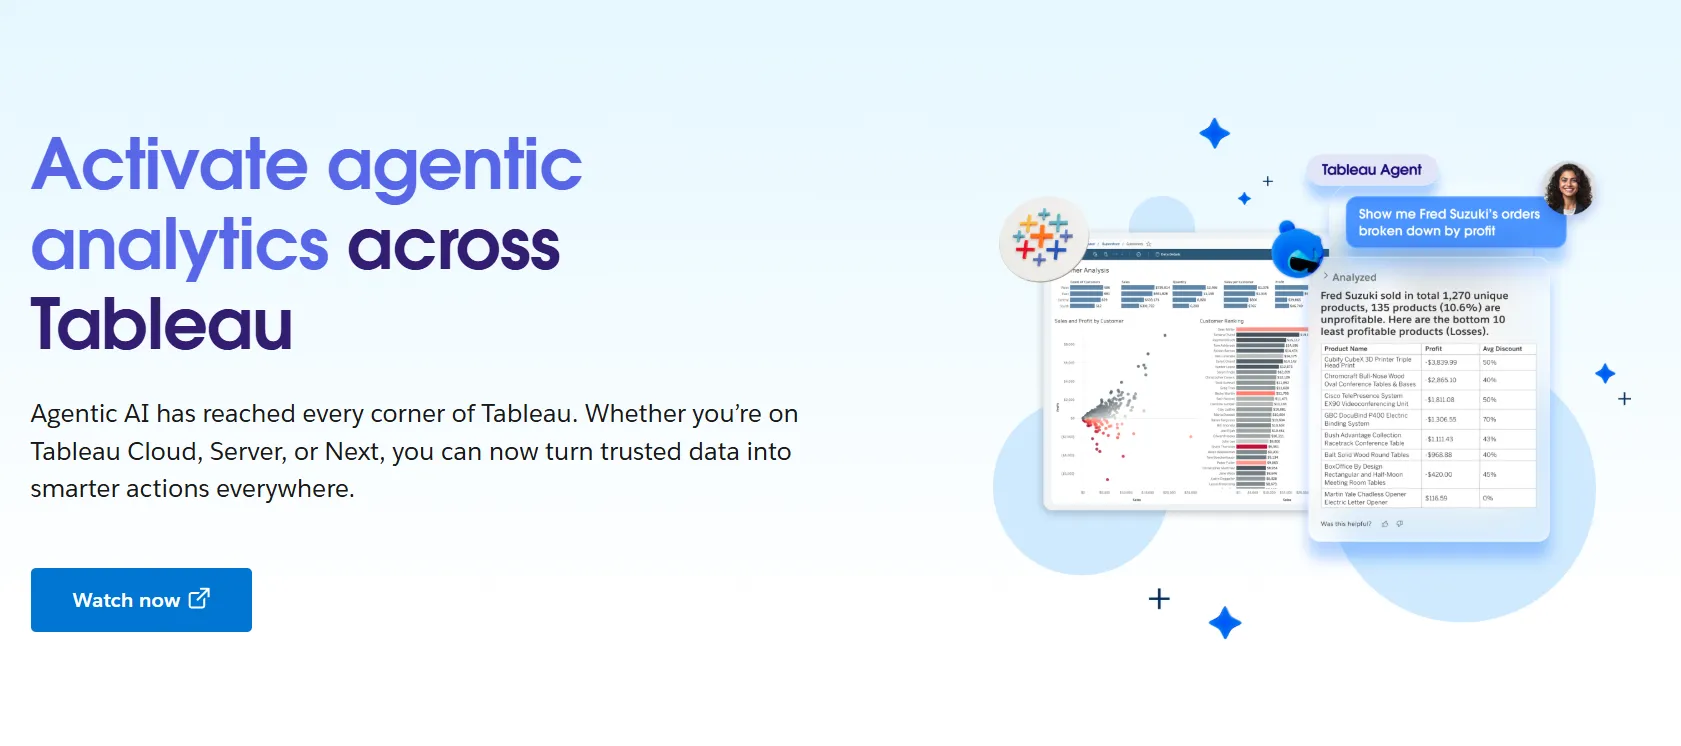
Tableau turns fields dragged onto a worksheet into charts, using its VizQL technology to translate each drag into a query.
Its heaviest users are analysts and data teams exploring large datasets, while Viewer licenses reach colleagues who only read the results.
Tableau's top features
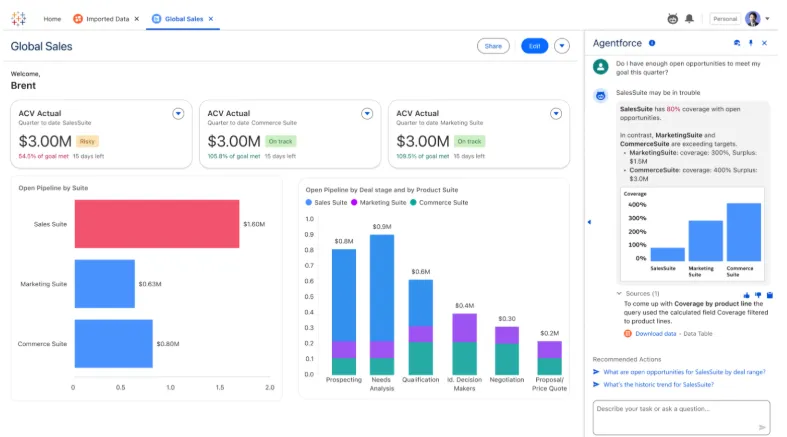
- Visual authoring: Charts and dashboards come together as fields are dropped onto the canvas, whether in Tableau Desktop or the browser.
- Tableau Prep Builder: Creators clean and combine data in visual flows before analysis, and every Creator license includes it.
- Data-driven alerts: Creators and Explorers can set up alerts and subscriptions for colleagues, while Viewers receive them and can subscribe themselves.
- Tableau Agent: The AI assistant works across authoring, data prep, Catalog and Pulse, and Tableau Cloud customers get it through the Cloud+ edition or the Tableau+ Bundle.
Tableau pricing
Tableau Cloud Standard starts at $15 per user per month for a Viewer, while the Creator license that builds content costs $75, both billed annually.
- Tableau Standard: Creators pay $75 per user per month and Explorers $42, while read-only Viewers cost $15. Desktop and Prep Builder come with every Creator seat.
- Tableau Enterprise: $115 for each Creator and $70 for each Explorer, with Viewers at $35. Advanced Management and Data Management are part of this edition.
- Tableau Cloud+: Sales quotes this edition, which adds Tableau Agent across Tableau Cloud and Pulse along with Premier Success support.
- Tableau+ Bundle: A quoted package that combines Cloud+ with Tableau Next and Data 360.
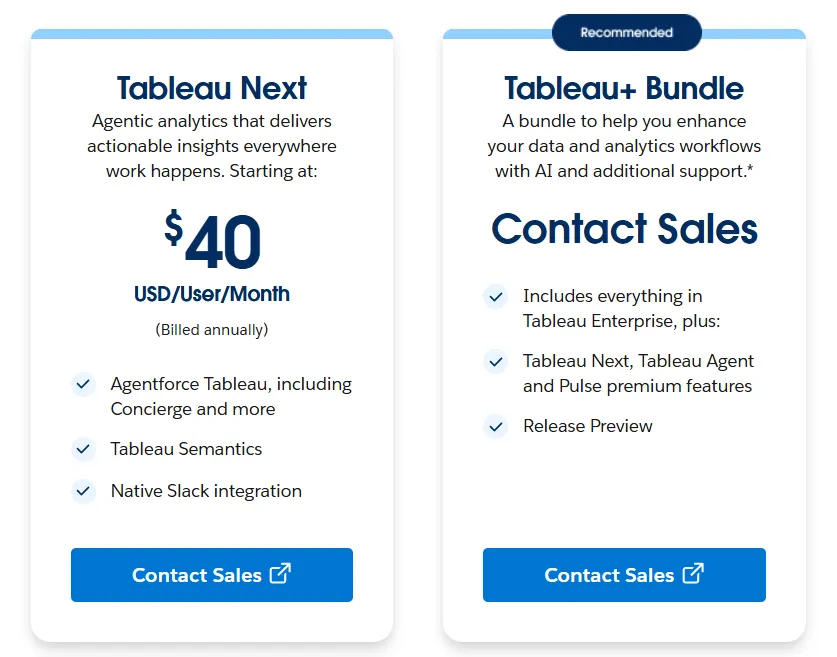
Tableau Next, the agentic line built on Salesforce's Agentforce 360 Platform, starts at $40 per user per month.
Self-managed Tableau Server editions start at the same $15 and $35 rates.
Every Tableau plan needs an annual contract.
Tableau Desktop Free Edition covers local analysis of Excel and CSV files at no cost, but nothing made in it can be published or shared.
➡️ Our Tableau pricing guide works out the total for a realistic mix of license roles.
Tableau pros and cons
✅ Fine-grained control over every chart
✅ A free desktop edition for local analysis
✅ On Standard, a Viewer license costs a fifth of a Creator seat
✅ Server deployment for data that has to stay on your own infrastructure
❌ Per-user pricing can scale fast for organizations rolling out broadly.
Get started with Dot for free
That's the list: 10 no-code data analysis tools for 2026, from drag-and-drop builders with years of users behind them to AI agents that take a typed question directly.
Several of them will serve a team well, each taking the code out of analysis in its own way.
Dot's approach is to start from the question itself, answering in writing from the warehouse your data team already maintains.
If you sign up, your team gets:
- Monday's numbers explained before the leadership meeting, on a schedule you choose
- The query behind every figure, one click away for anyone who wants to check it
- Room for the whole company, since paid plans don't cap users
- A Context Agent that builds business definitions with your data team and waits for approval before anything goes live
➡️ You can create a free Dot account with 300 credits to try it on your own warehouse, or book a demo with our team to see it run on your data.
⚠️ Disclaimer: Everything above reflects what vendors published as of September 29, 2026. Let us know if anything here is out of date or wrong, and we'll check it.
Theo Tortorici
Theo writes about AI-powered analytics, data tools, and the future of business intelligence at Dot.