
10 Best Supaboard Alternatives & Competitors In 2026
In this article, I'll review the 10 best Supaboard alternatives and competitors in 2026 across AI-native analytics platforms, self-service BI for business teams, and enterprise BI platforms, covering their features, pricing, and pros and cons.
TL;DR
- Dot offers the best Supaboard alternative in 2026, with AI-driven business analysis, scheduled executive reports, a Context Agent for shared metric definitions, and a full audit trail behind every insight.
- If your team wants AI-native analytics with strong natural language search and broad coverage of business workflows, ThoughtSpot, Domo, and Zoho Analytics are well-known platforms with deep feature sets.
- For self-service BI on top of your warehouse or open-source flexibility, Metabase, Sigma, and Omni give business teams direct access to data without heavy modeling overhead.
- For traditional enterprise dashboarding at scale, Tableau, Microsoft Power BI, and Qlik Sense are the platforms most large organizations already know and trust.
What are the best Supaboard alternatives in 2026?
The best Supaboard alternatives are: Dot, ThoughtSpot, and Domo.
Here's a breakdown:
Tool | Use Case | Price |
Dot | AnAI data analyst that delivers narrative insights, recommendations, and automated executive reports instead of static dashboards. | Free plan; Paid from $180/month. |
ThoughtSpot | AI-driven analytics with natural-language search for fast self-service data exploration. | From $25/user/month (annual). |
Domo | All-in-one cloud BI with data ingestion, dashboards, automation, and AI-driven actions. | Custom pricing (30-day free trial). |
Zoho Analytics | Budget-friendly BI with dashboards, AI, and 50 visualization types, especially for Zoho users. | From $60/month (Standard). |
Metabase | Open-source BI for simple dashboards and self-service analytics with minimal setup. | Free (Open Source); Cloud from $100/month. |
Sigma | Spreadsheet-style analytics on live warehouse data for finance and ops teams. | Custom pricing. |
Omni | Modern BI with a flexible semantic layer for self-service analytics on warehouse data. | Custom pricing (free trial). |
Tableau | Advanced visual analytics and exploratory data storytelling for large, complex datasets. | From $75/creator/month. |
Microsoft Power BI | Standardized dashboards and self-service reporting inside the Microsoft ecosystem. | Free plan; Pro from $14/user/month. |
Qlik Sense | Associative analytics engine for exploring complex data relationships beyond traditional queries. | Custom pricing. |
What are the best AI-native analytics platforms?
If your team is drawn to the AI-first, no-SQL approach, these are the platforms competing in the same lane.
They share the same core idea: getting answers from data shouldn't require a ticket queue, a SQL course, or hours of dashboard-building.
Here are the best AI-native analytics platforms in 2026:
#1: Dot
Dot offers the best AI-native Supaboard alternative on the market, built for teams that want their analytics tool to do the actual analysis, not just produce charts faster.
Most analytics work, even the AI-assisted kind, ends at a dashboard. You ask a question, the tool generates a chart, and the interpretation falls back to you.
That's the model the BI category has run on for two decades, and AI has mostly accelerated chart-building rather than replacing it.
We built Dot around the opposite assumption.
The question shouldn't end at a chart. It should end with a written analysis, the supporting math, and a clear sense of what to do next.
Here's how that plays out across the platform: 👇
Ask plain-English business questions in Slack and get the analysis back
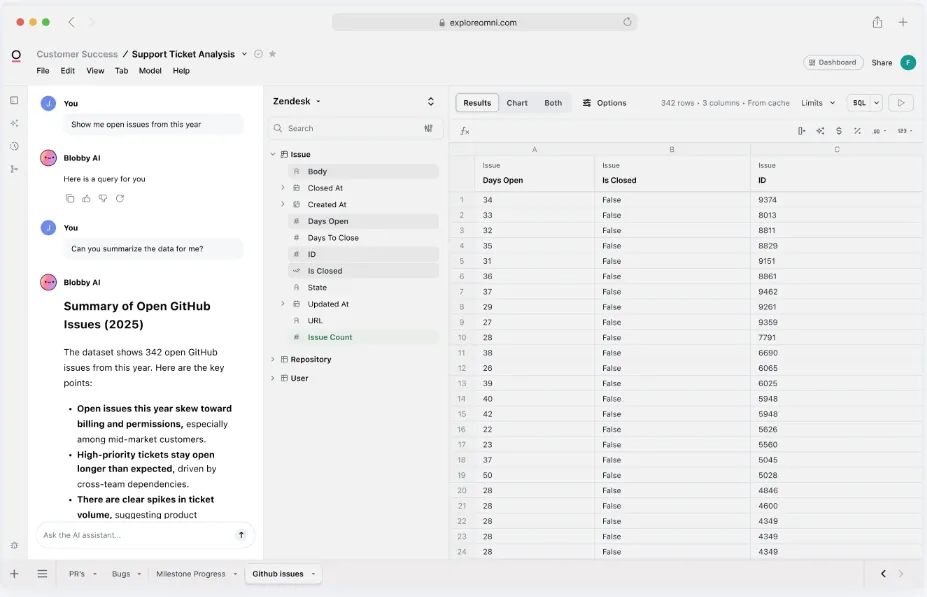
Take a question that comes up at most companies once a quarter: why did our gross margin shift on Plan B accounts last month?
Without Dot, that goes into the analyst queue.
Someone opens the warehouse, writes the SQL to reconcile cost-of-revenue allocations against deal-level data, double-checks against finance's figures, and circles back when the rest of their workload allows.
With Dot, the same question goes into Slack, and a structured response comes back in minutes.
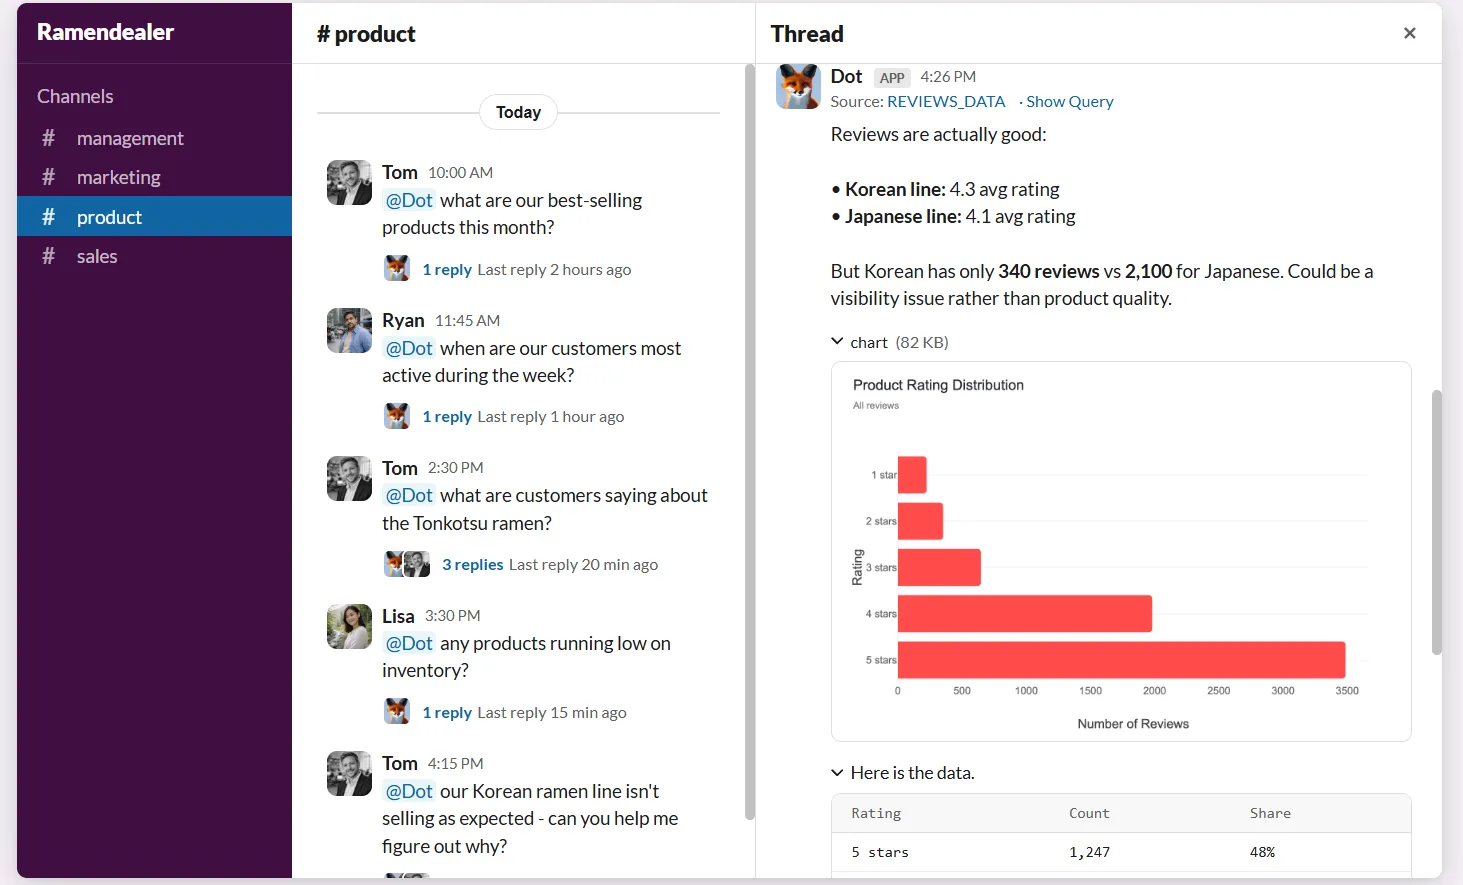
The answer walks through which deal cohorts moved, which revenue lines drove the change, and which costs allocated differently than the prior period.
You don't just get a chart to interpret: you get the written reasoning alongside it.
Recurring reports, generated end-to-end
Recurring reports are the silent tax on most data teams.
Weekly business reviews, monthly board updates, and quarterly executive readouts are all things data analysis teams deal with every week.
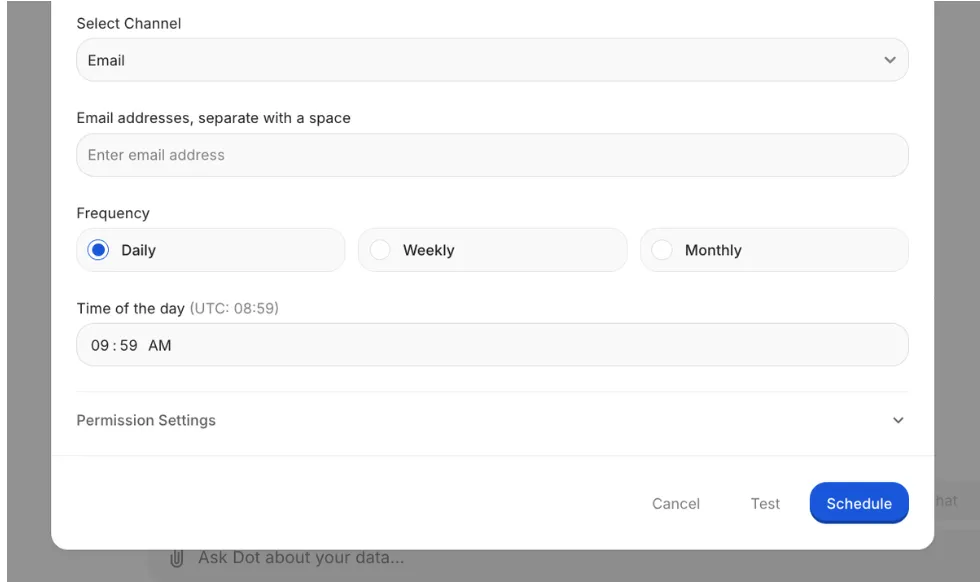
Same shape every time, with someone on the team spending hours pulling charts together and writing commentary that gets read once, briefly.
Dot turns these into actual documents that build themselves.
You configure the schedule once, point it at the warehouse, and the platform pulls live data on each cadence, runs the analysis, and delivers an executive-ready PowerPoint to whoever needs it.
The deck includes period-over-period numbers, anomaly callouts, and a written narrative explaining what changed and why.
Persistent business context across the company
Most companies eventually run into the same definitional drift.
"Qualified pipeline" means one thing to sales ops, a different thing to marketing, and a third thing to the CFO when she's preparing the board deck.
Each team has good reasons for their version. None of them are wrong.
But the disagreement quietly costs hours every quarter when somebody has to reconcile the numbers before a key meeting.
Dot's Context Agent sits at the layer underneath all of this.
It crawls dbt models, your data catalog, Confluence, and any documentation it can reach, then builds a single definition layer that every Dot answer pulls from.
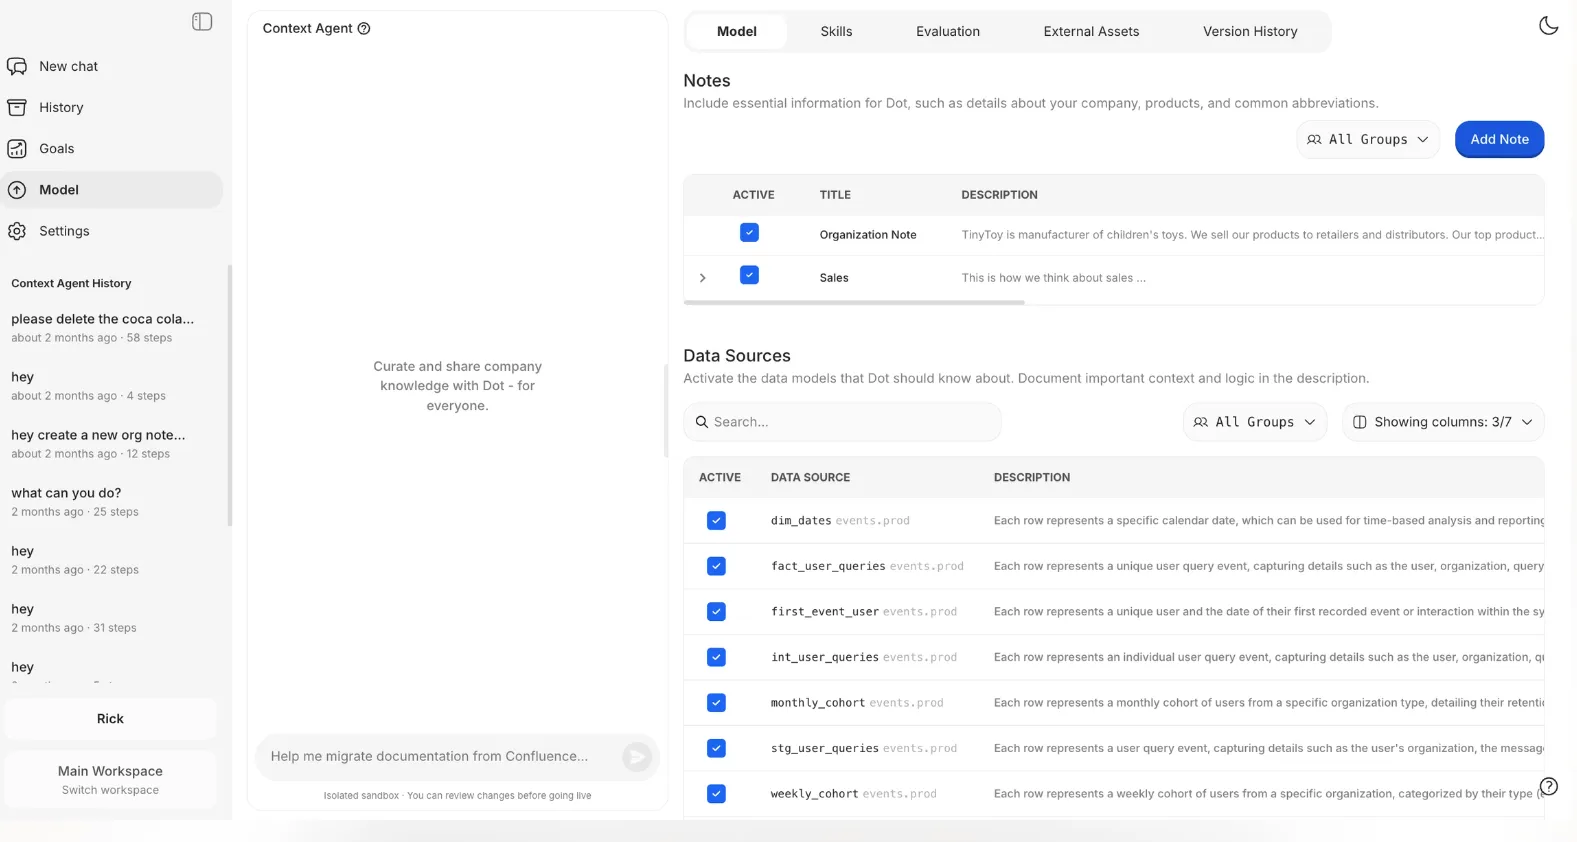
If a metric isn't documented, the agent writes the documentation. If two systems define it differently, it surfaces the conflict instead of quietly choosing one.
The result is that a question asked by sales ops returns a number consistent with the same question asked by finance.
Inspectable audit trail on every output
Surprising numbers raise the same question every time: how was this calculated?
If the tool can't show its work, the insight rarely leads to action.
Someone asks for verification, the data team digs back through the model, and what should have been a 30-second answer turns into a 30-minute investigation.
Every Dot output includes footnotes that point back to the underlying logic.
Each answer links to the SQL query that ran, any Python used in the calculation, and the specific tables and fields the data came from.
Click through, read the query, and confirm the math in minutes.
For finance teams defending a number to the audit committee, for RevOps explaining variance to a CRO, or for any analyst whose name is attached to the report, traceability is what makes the output actually usable.
The number stops being something you take on faith and starts being something you can independently verify.
Dot's integrations
Dot doesn't ask your team to migrate anything.
On the warehouse side, connections include Snowflake, BigQuery, Redshift, Databricks, Postgres, MySQL, and SQL Server.
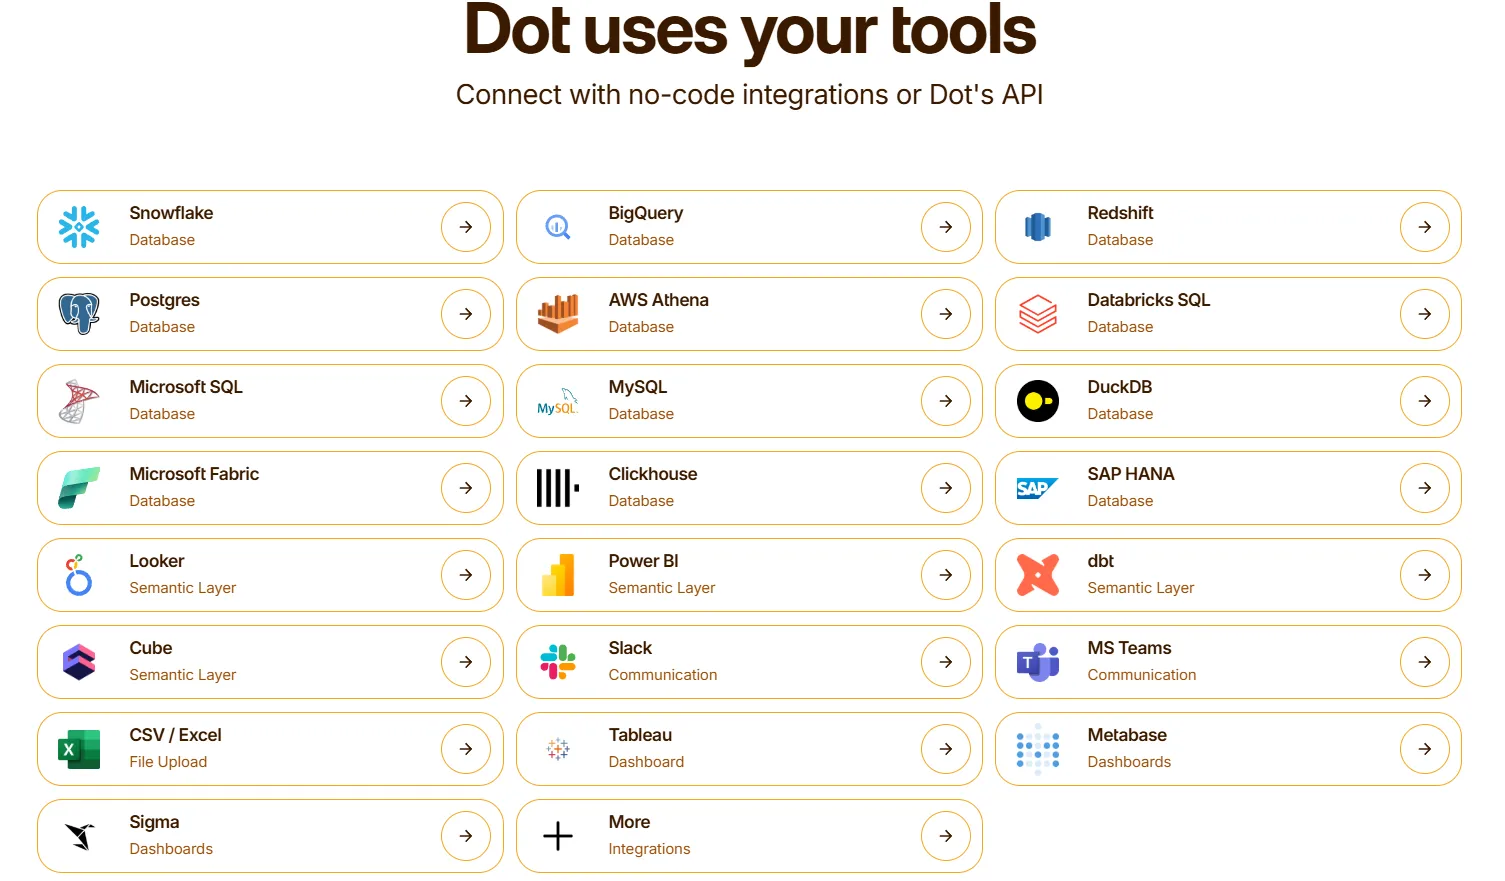
It also reads from semantic layers like dbt, Looker, Power BI models, and Cube, so the modeling work your team has already done gets reused rather than rebuilt.
On the delivery side, answers and reports show up in Slack, Microsoft Teams, email, or the Dot web app, wherever your team is already working.
Dot also pairs cleanly with existing BI tools.
If your team uses Tableau, Metabase, or Looker for specific dashboards or embedded reports, Dot operates alongside them rather than asking you to deprecate anything.
What makes Dot different from Supaboard and other AI analytics tools?
The category Dot belongs to is sometimes called AI analytics, but most products in that space are still organized around the same artifact: a dashboard.
- Type a question, get a chart faster.
- Type a different question, get another chart.
The interpretation work still falls on the user.
Dot inverts that. The system runs the analysis end-to-end, returns the explanation in plain English, and points to what's worth attention.
Charts appear when they help the explanation, not as the destination.
The other practical difference is governance.
Most AI analytics tools generate answers in isolation, drawing whatever data the question implies.
Dot's Context Agent grounds every answer in shared business definitions, so what one team gets matches what another team gets when they ask the same question.
That's the part that makes the output trustworthy beyond a single user's screen.
Dot pricing
Dot offers a free plan with 300 one-time credits and full access to Pro features, so teams can run real analyses before deciding whether to commit.
There are three paid plans:
- Pro: $180/month, includes 150 credits per month, $1.80 per credit overage, and unlimited users.
- Team: $720/month, includes 800 credits per month, $1.44 per credit overage, SSO, row-level security, embedded analytics, and dedicated support.
- Enterprise: Custom pricing, includes unlimited credits, volume discounts, self-hosted deployment, audit logs, SLA, and a dedicated account manager.
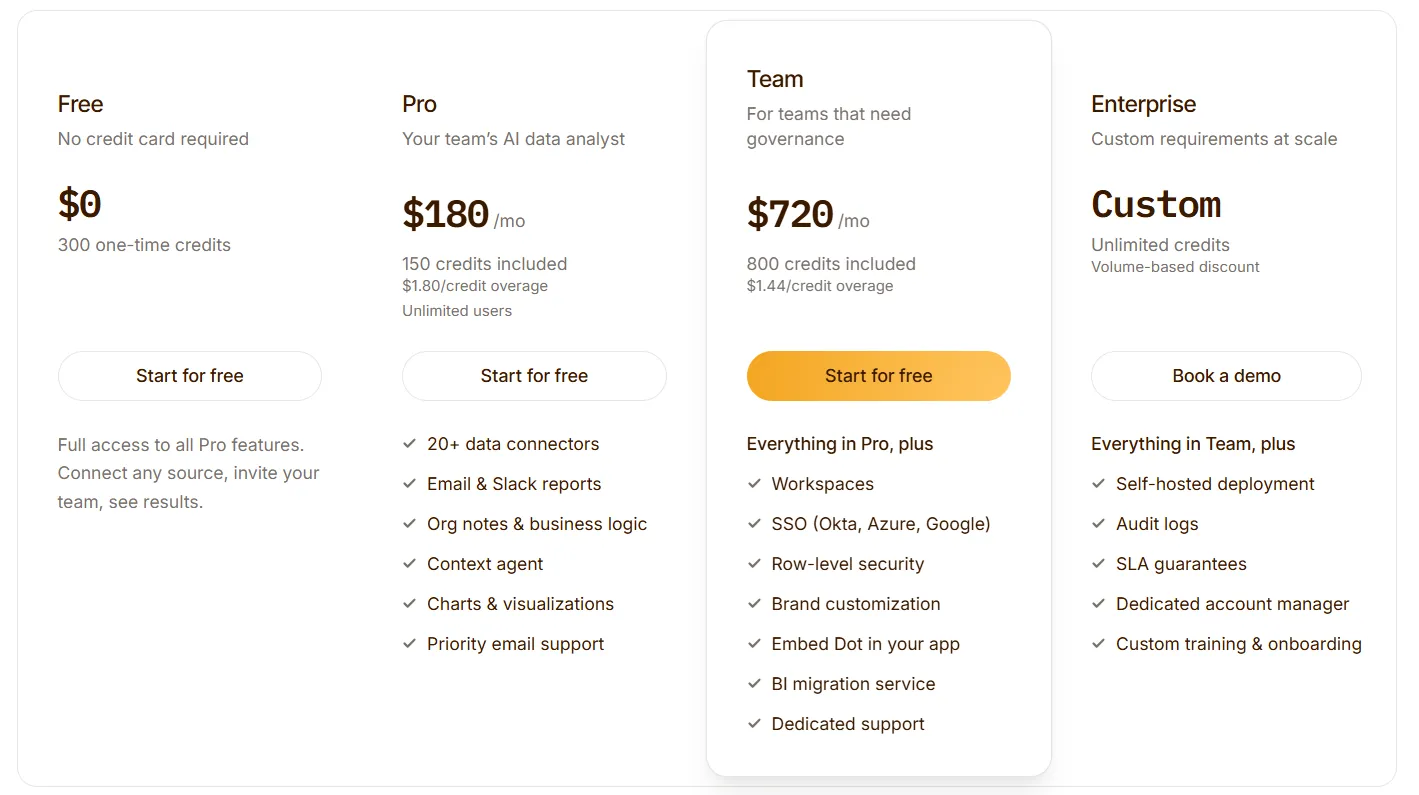
➡️ Annual billing saves 10% across all paid plans.
Dot pros and cons
✅ Written analysis, not charts.
✅ Recurring business reviews.
✅ Every answer links back to the query, Python logic, and source tables behind it.
✅ Context Agent enforces shared definitions across the data environment.
✅ Deploys on top of your existing warehouse and semantic layer, no replacements.
✅ Credit-based pricing scales with usage rather than seat count.
❌ Not a dashboarding tool, so heavy custom-visual workflows still need a dedicated BI layer.
❌ A connected warehouse is required.
#2: ThoughtSpot
Best for: Business teams that want fast, natural-language access to data without relying on analysts or learning SQL.
Similar to: Dot,Julius AI.
ThoughtSpot turns plain-English questions into interactive charts, dashboards, and AI-generated explanations through a search-first interface.
Enterprise teams have leaned on it for years to take pressure off the analyst queue.
ThoughtSpot's top features
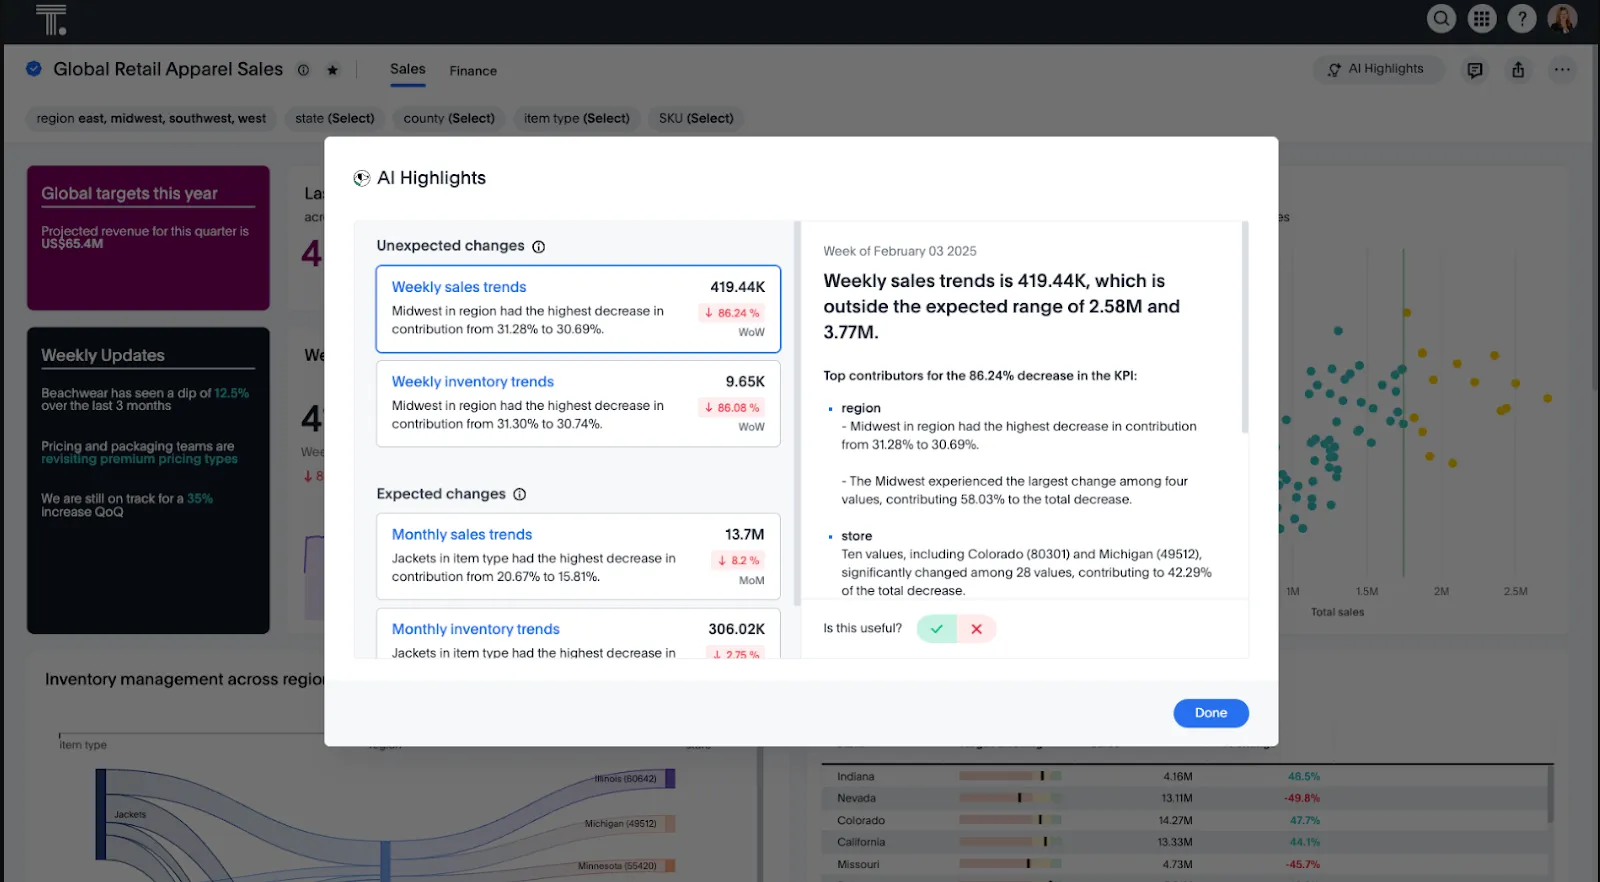
- Search-based analytics: Type a question into the search bar and get a visualization back, with follow-up drill-downs available without writing SQL.
- Application embedding: Drop ThoughtSpot's search and dashboards into customer-facing products with full theming and SDK control.
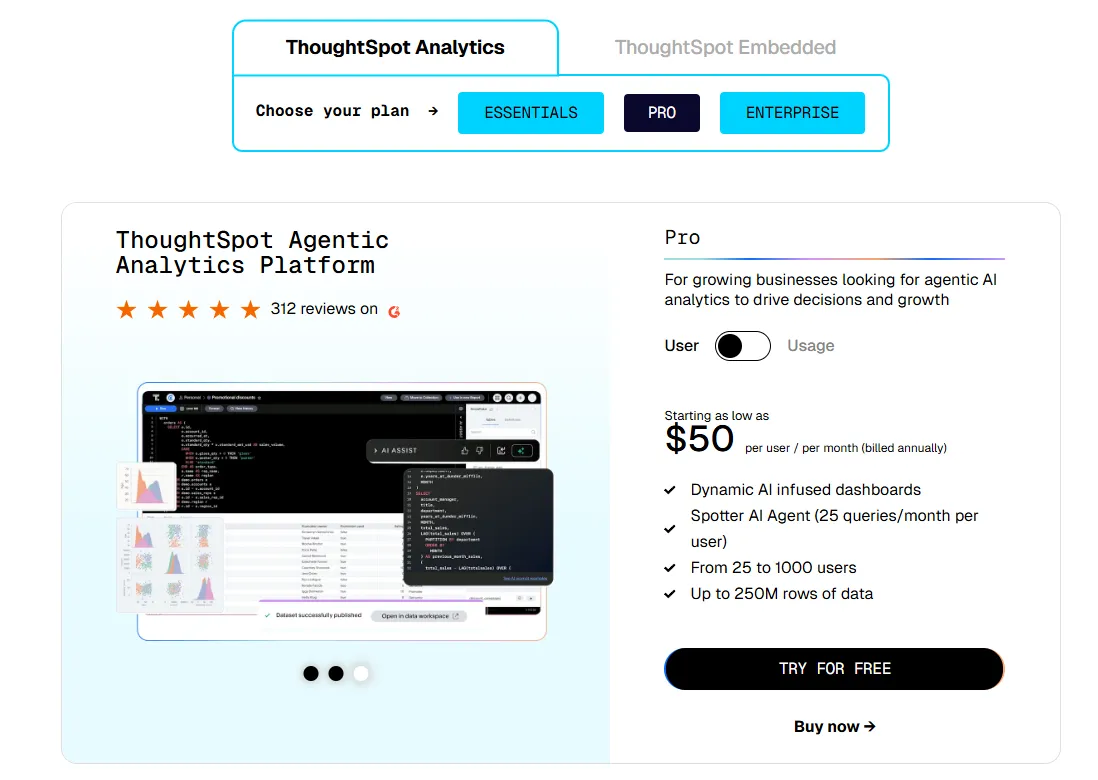
ThoughtSpot pricing
ThoughtSpot offers two separate products - ThoughtSpot Analytics for internal BI and ThoughtSpot Embedded for building analytics into applications - each with flexible pricing depending on scale and usage:
- ThoughtSpot Analytics:
- Essentials: From $25 per user per month (billed annually), for teams of 5-50 users, includes dynamic interactive dashboards and AI-powered insights and supports up to 25M rows of data.
- Pro (per user pricing): From $50 per user per month (billed annually), for 25–1,000 users, includes everything in Essentials, plus AI-infused dashboards and Spotter AI Agent (25 queries per user/month), and supports up to 250M rows of data.
- Pro (usage-based): From $0.10 per query, includes everything in Pro per user, and adds Analyst Studio.
- Enterprise (user or usage-based): Custom pricing, includes everything in Pro, plus unlimited users and data.
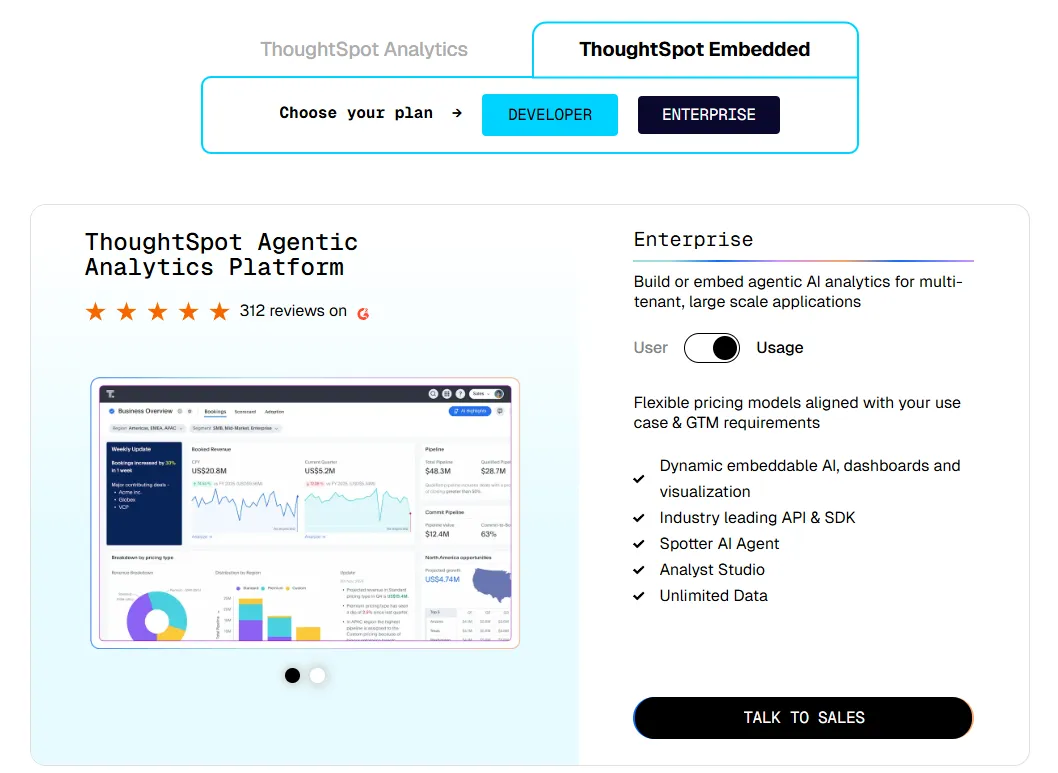
- ThoughtSpot Embedded:
- Developer: Free for 1 year, includes embeddable AI analytics, dashboards, and visualizations, APIs and SDKs, up to 10 users and 25M rows of data.
- Enterprise (user-based): Custom pricing, includes everything in Developer, plus unlimited data.
- Enterprise (usage-based): Custom pricing, everything in Enterprise, plus Spotter AI Agent and Analyst Studio.
ThoughtSpot pros and cons
✅ Search bar interface is approachable for business users.
✅ Strong governance for enterprise rollouts.
❌ Two pricing structures (per user vs. usage-based) can get confusing at scale.
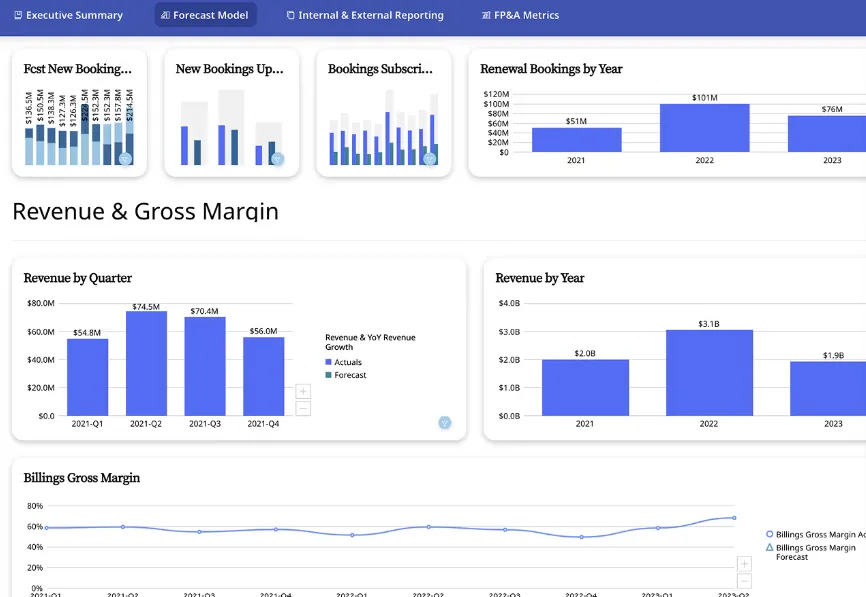
#3: Domo
Best for: Mid-to-large teams that want an all-in-one BI platform combining data integration, dashboards, automation, and AI-driven actions.
Similar to: Power BI,TextQL.
Combining ingestion, modeling, dashboards, automation, and embedded AI in a single workspace, Domo lands most often at mid-market and enterprise teams that want one product instead of a stack.
The reach into downstream actions is what sets it apart from more focused AI tools likeMindsDB.
Domo's top features
- Cards and dashboards: Domo organizes reports into modular Cards that snap into dashboards, get embedded into apps, or shared across departments.
- Drag-and-drop app builder: Build custom data apps for forecasting, planning, or monitoring without writing code.
- AI Chat and agents: Ask questions in natural language, get explanations of trends, and route AI agents to take downstream actions like alerts or system updates.
Domo pricing
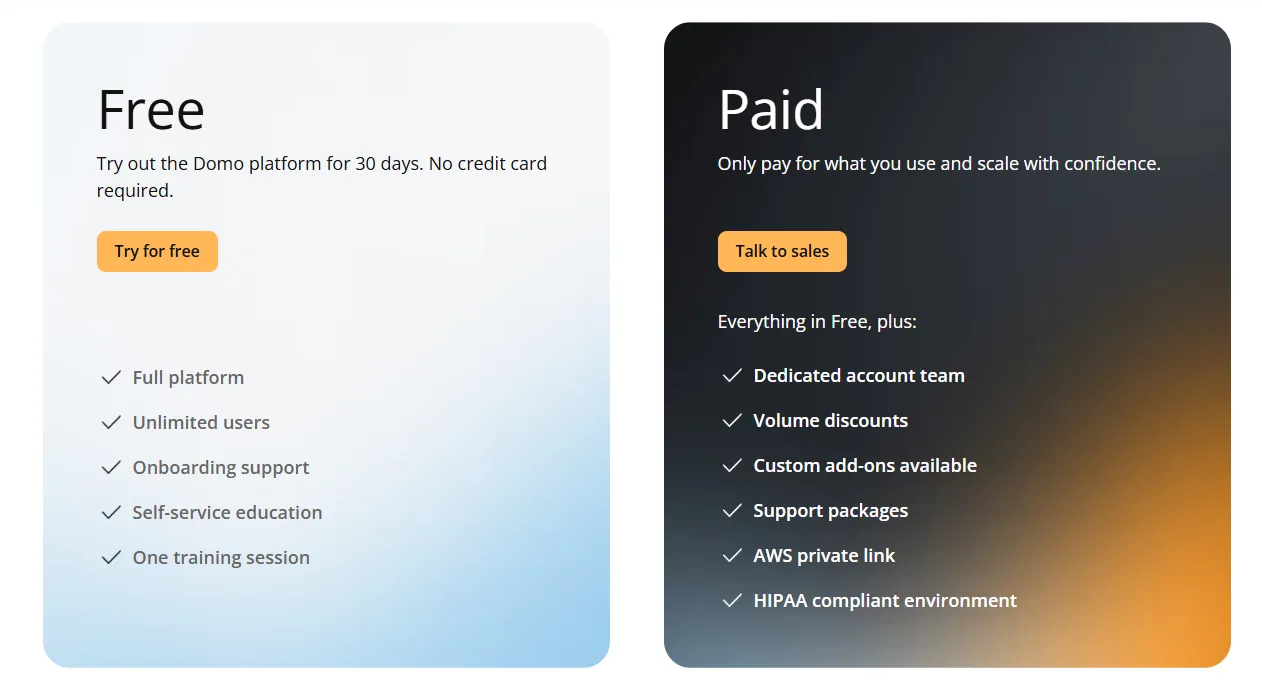
Domo has one paid plan and a free trial:
- Free trial: 30 days, no credit card required, includes unlimited users, full platform access, onboarding support, self-service education, and one guided training session.
- Paid plan: Usage-based pricing designed to scale as your analytics needs grow, includes everything in the trial and adds a dedicated account team, volume discounts, custom add-ons, and support packages.
Domo pros and cons
✅ One platform handles ETL, modeling, dashboards, and automation.
✅ Big connector library.
❌ Pricing is not disclosed. We covered affordable options in our Domo alternatives breakdown.
#4: Zoho Analytics
Best for: Teams that want a budget-friendly BI platform with strong AI features, lots of connectors, and an interface that both analysts and business users can work in.
Similar to: Metabase, Power BI.
Self-service data preparation, dashboards, and a conversational AI assistant called Zia anchor what Zoho Analytics offers, all wrapped inside a friendlier price band than most enterprise BI tools.
Teams already inside the Zoho ecosystem use it heavily, and it's a popular pick for buyers who want a full BI suite without enterprise-level pricing.
Zoho Analytics' top features
- Zia conversational AI: Ask Zia questions about your data and get charts, predictions, and written explanations back without writing a query.
- Self-service data prep: Clean and reshape data with 250 or more no-code transformations, then maintain a central metrics layer for cross-report consistency.
- Visualization library and embedding: Pick from 50 or more chart types and embed dashboards, AI assistants, or full reports into customer-facing products.
Zoho Analytics pricing
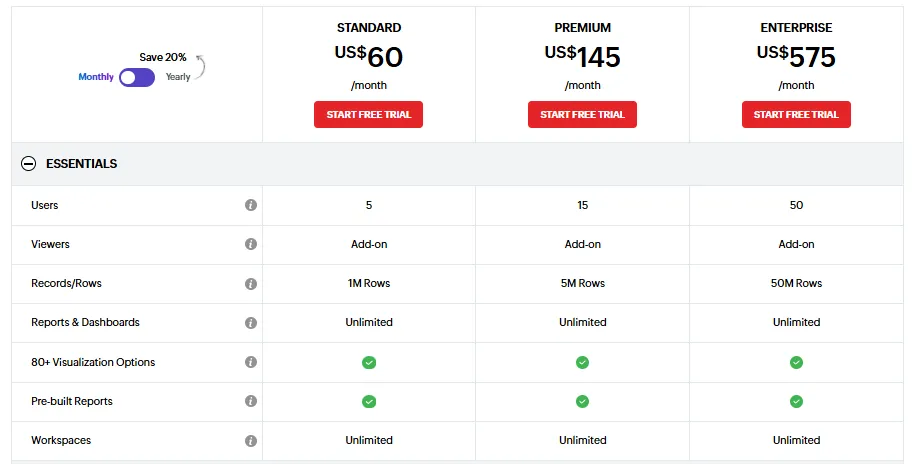
Zoho Analytics has three pricing plans:
- Standard: $60/month, includes up to 5 users, 1M rows, unlimited workspaces, reports and dashboards, and basic AI features.
- Premium: $145/month, includes up to 15 users, 5M rows, advanced data integration, and all AI features except AI Studio.
- Enterprise: $575/month, includes up to 50 users, 50M rows, advanced governance and security, and AI Studio.
Zoho Analytics pros and cons
✅ Approachable pricing for small and mid-sized teams.
✅ Tight integration with Zoho's CRM, finance, and ops products.
❌ The user interface is not top-notch, according to a G2 review.
What are the best self-service BI tools for business teams?
Some teams want a tool that connects directly to their warehouse, keeps metrics consistent, and gives both analysts and business users a way to explore data without heavy upfront engineering.
That's where this group fits.
These platforms are less about full AI agents and more about giving people direct, governed access to live data:
#1: Metabase
Best for: Startups, product teams, and data-lean organizations that want fast, self-serve analytics and flexible embedding without enterprise BI complexity.
Similar to:Lightdash,Basedash.
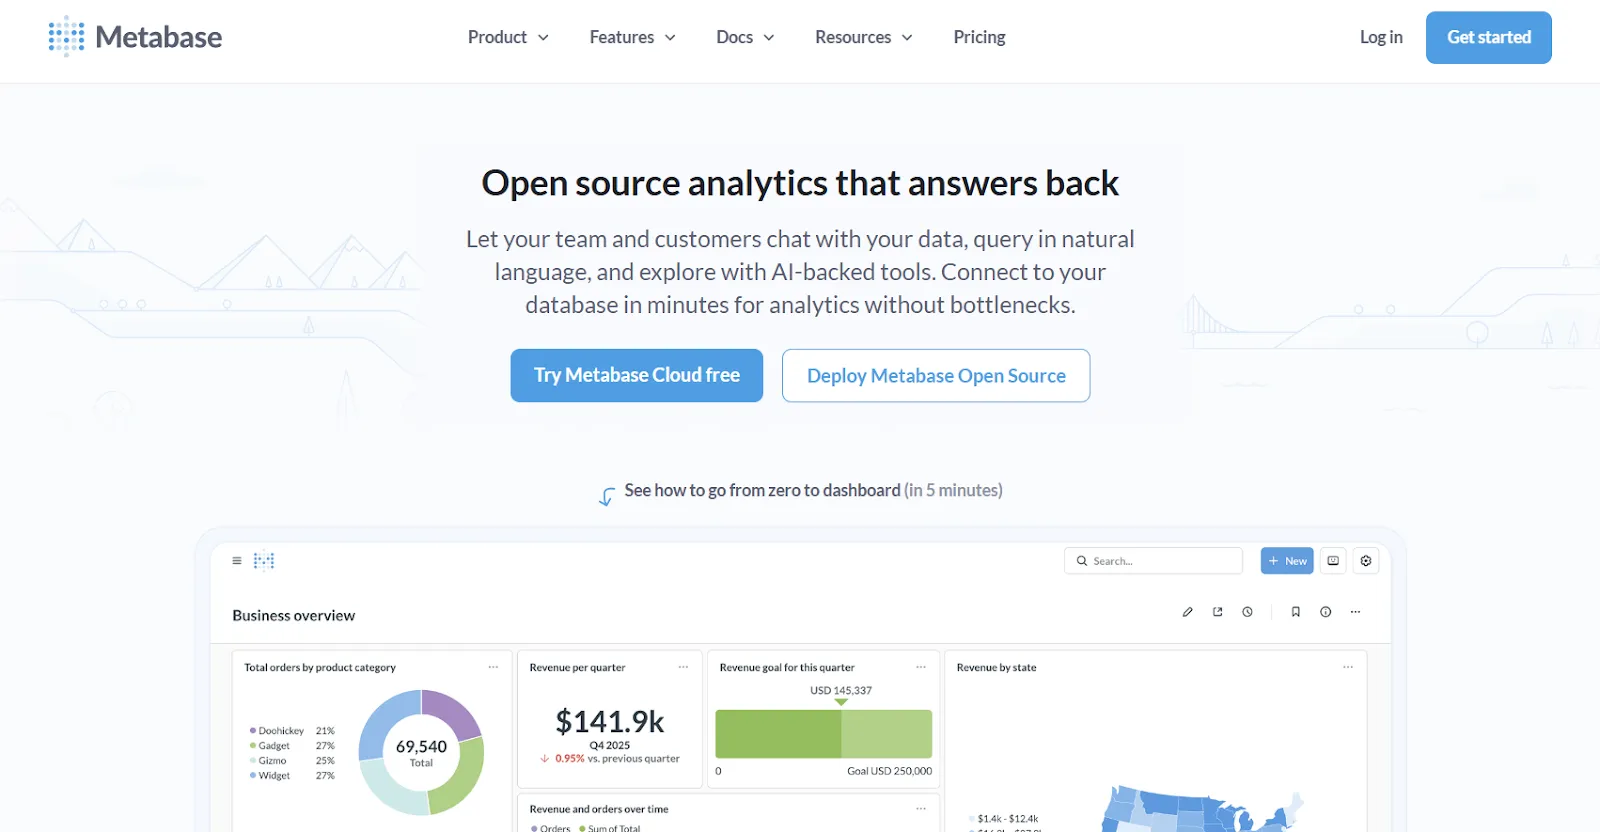
Many SaaS companies treat Metabase as the default when they need fast, embeddable analytics without the cost of enterprise tooling.
Open source at its core, the platform supports SQL, a no-code question builder, and Metabot AI for natural-language querying, putting it on shortlists alongside lighter SQL-generation tools likeVanna AI.
Metabase's top features
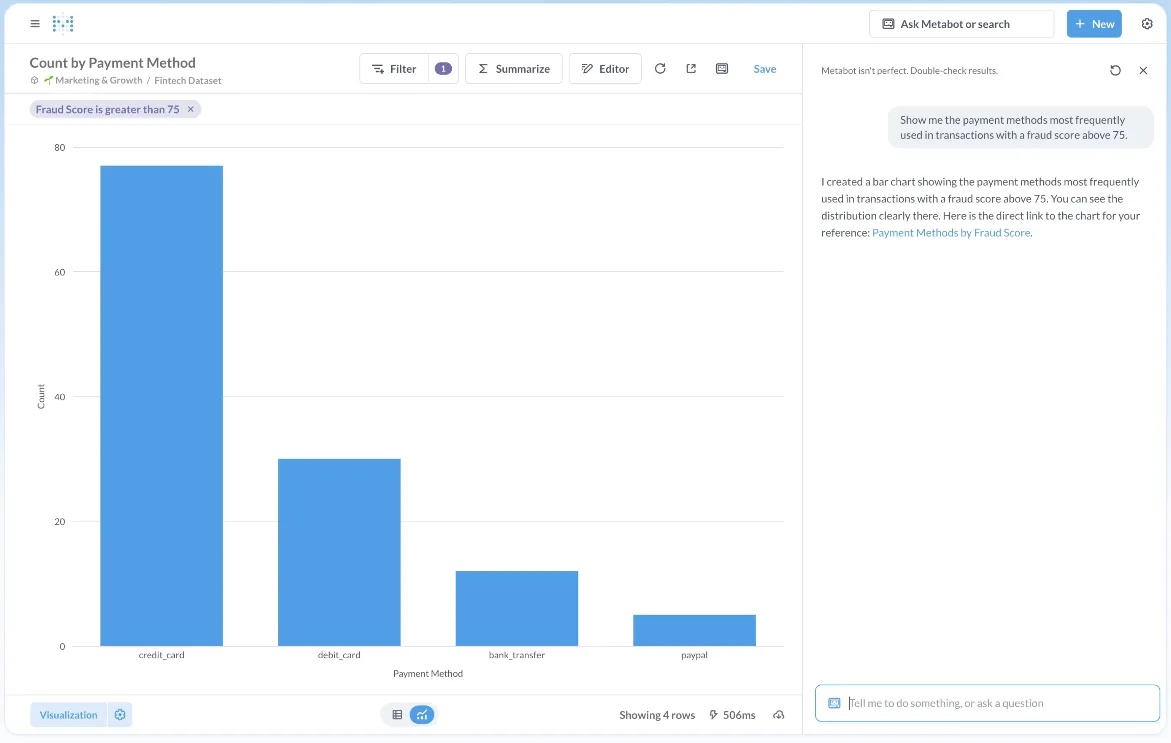
- Metabot AI: Ask data questions in plain English and Metabot generates the underlying query and visualization for you.
- No-code question builder: Walk through joins, filters, and aggregations through a step-by-step UI, with the option to drop into raw SQL whenever you want.
- Click-to-drill exploration: Click any chart to filter, segment, or pivot the data without rebuilding the question from scratch.
Metabase pricing
Metabase offers two pricing options depending on how you use the product: internal business intelligence or customer-facing embedded analytics.
- Business Intelligence:
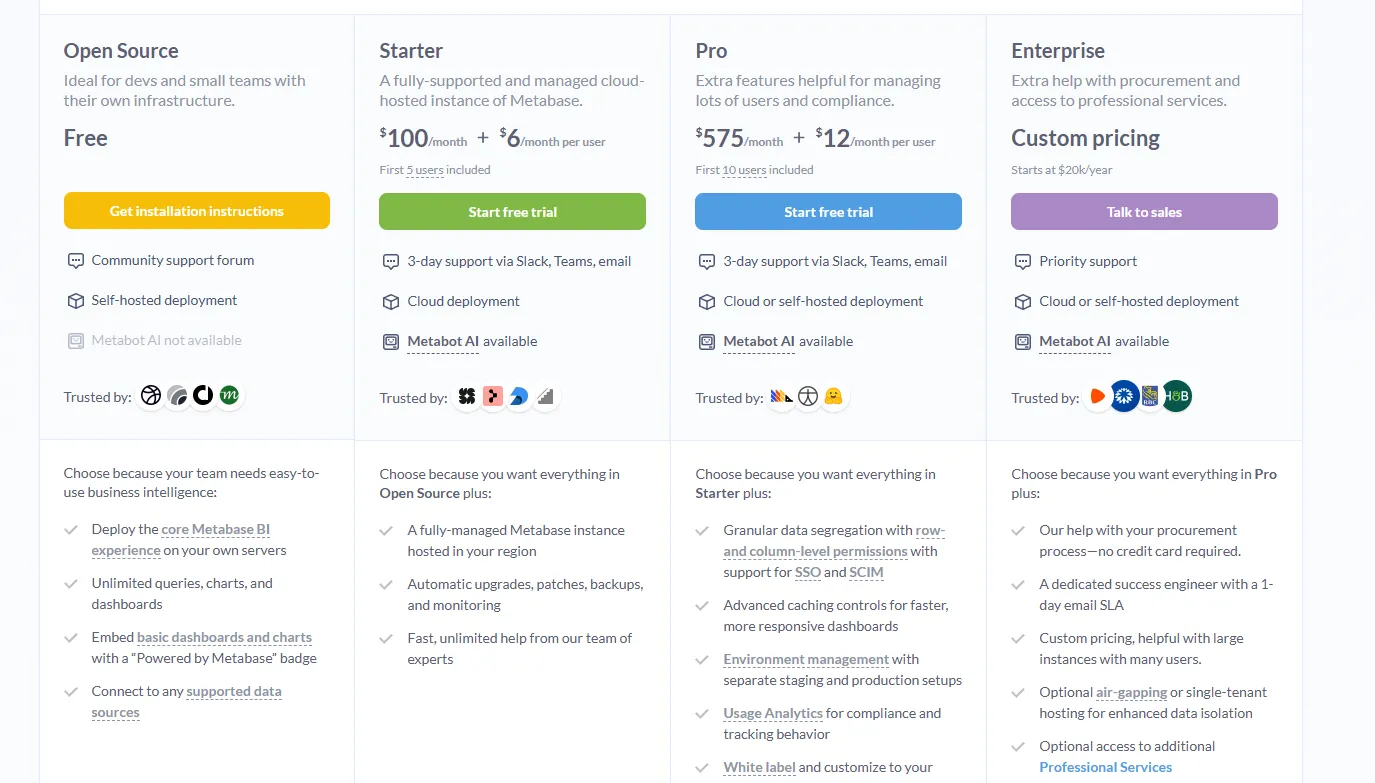
- Open Source (Self-hosted): Free, self-hosted deployment, includes unlimited queries, charts, and dashboards, connects to all supported data sources, basic embedding with “Powered by Metabase” branding, community support only.
- Starter (Cloud-hosted): $100/month + $6/user/month, first 5 users included, includes everything in Open Source, plus option to include Metabot AI (charged extra), automatic upgrades, backups, and monitoring, support via Slack, Teams, and email (3-day SLA).
- Pro: $575/month + $12/user/month, first 10 users included, cloud or self-hosted deployment, includes everything in Starter, plus row- and column-level permissions, SSO and SCIM support, advanced caching and performance controls, staging + production environments, usage analytics and audit visibility, white-labeling, and embedded analytics capabilities.
- Enterprise: Custom pricing (starts at $20k/year), includes everything in Pro, plus priority support, dedicated success engineer (1-day email SLA), optional single-tenant or air-gapped deployment, and optional professional services.
- Embedded Analytics pricing:
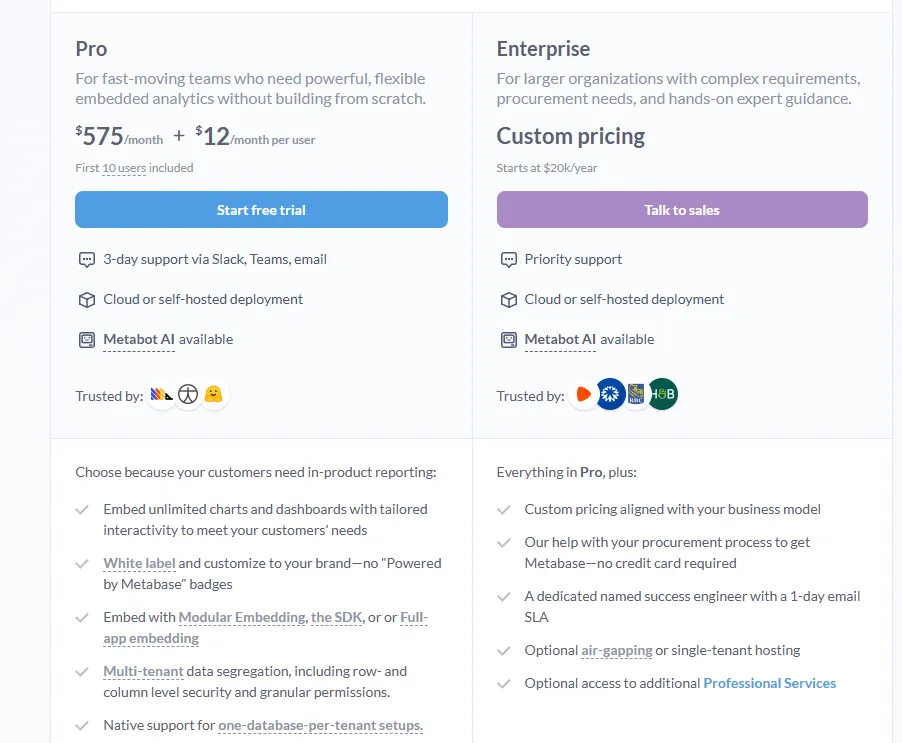
- Pro: $575/month + $12/user/month, first 10 users included, includes unlimited embedded dashboards and charts, full white-labeling, modular embedding, SDK, or full-app embedding, multi-tenant security (row- and column-level), one-database-per-tenant support, staging + production environments, usage analytics, internal BI for your team, and option to include Metabot AI (charged extra).
- Enterprise: Custom pricing (starts at $20k/year), includes everything in Pro, plus a dedicated success engineer, priority support, optional single-tenant or air-gapped hosting, and optional professional services.
Metabase pros and cons
✅ Self-host the open-source version for free.
✅ Quick to install and configure on a new database.
❌ A user on G2 believes that Metabase could benefit from having an AI assistant that understands the databases and assists in building queries
#2: Sigma
Best for: Finance and ops teams that want spreadsheet-style analytics directly on live warehouse data without exporting to Excel.
Similar to: Omni, Metabase.
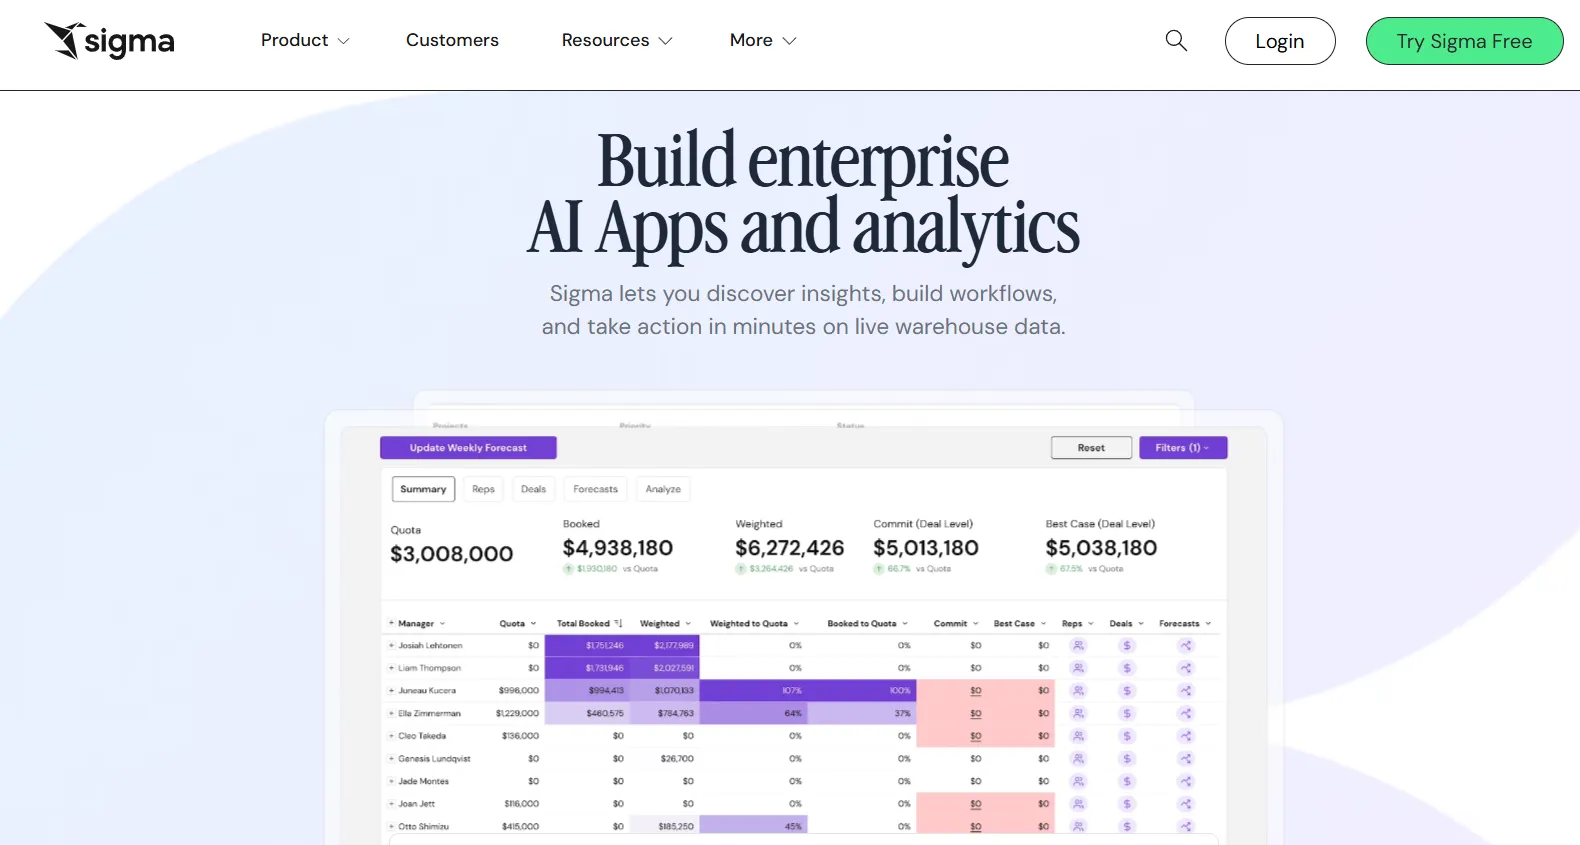
Built around a spreadsheet-style interface, Sigma fits teams that prefer working in formulas and pivots rather than chart builders.
Connections to Snowflake, BigQuery, Databricks, and Redshift mean queries run directly against the warehouse instead of duplicating data anywhere.
Sigma's top features
- Workbook interface: Build pivots, formulas, and grouped tables on top of warehouse-scale data using a UI that maps closely to Excel.
- Ask Sigma and AI workflows: Generate dashboards, summaries, and analytics apps from natural-language prompts inside a workbook.
- Team workbooks: Build, comment on, and version analyses in a shared file rather than emailing CSVs around.
Sigma pricing
Sigma doesn't publish its pricing. You can contact their sales team directly to get a custom quote.
Sigma pros and cons
✅ Warehouse-native architecture keeps data current and governed.
✅ Excel-like interface lowers the bar for finance and ops teams.
#3: Omni
Best for: Data teams that want a modern semantic layer with self-service exploration and AI-powered analysis on live warehouse data.
Similar to:Looker, Sigma.
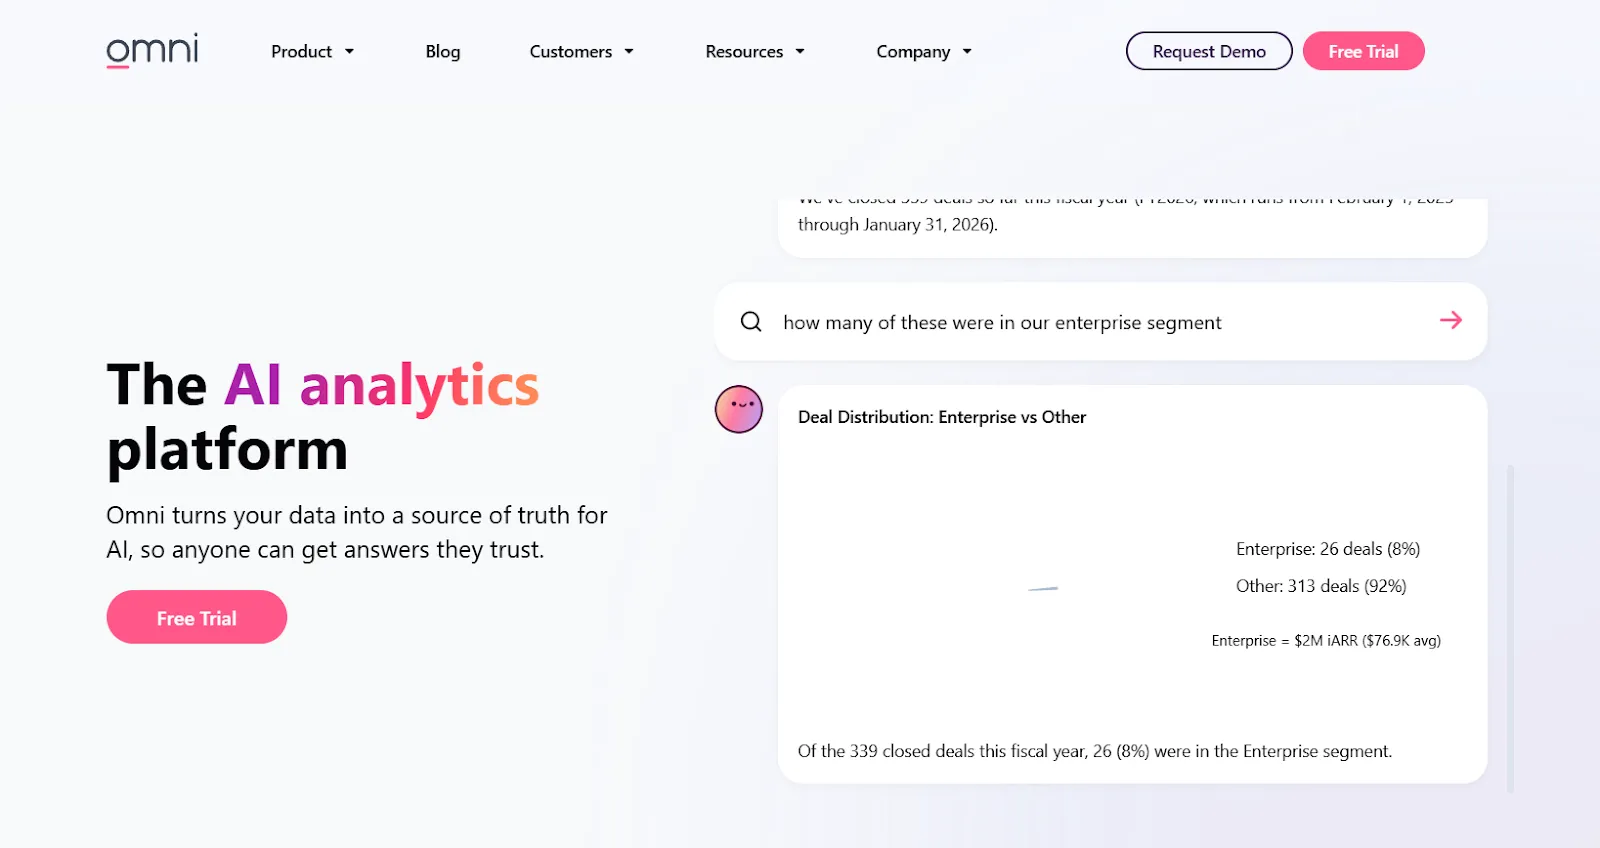
Omni centers on a semantic model that keeps metrics consistent while letting both technical and business users move quickly through the data.
Direct warehouse connections and a more flexible take on modeling make it less rigid than older BI platforms in the same category.
Omni's top features
- Metrics-first modeling: Define metrics once in a centralized model with governed, reusable calculations that don't require rigid LookML-style workflows.
- AI in dashboards and workbooks: AI built into the exploration layer can summarize charts, generate queries, explain trends, and recommend next steps.
- Spreadsheet-like exploration: Analyze live warehouse data through a familiar spreadsheet interface while keeping governed metrics intact.
Omni pricing
Omni doesn't publish subscription pricing. You can request a free trial on their website and get a quote from their team.
Omni pros and cons
✅ Intuitive drag-and-drop interface.
✅ Strong dbt integration and direct warehouse querying.
What are the best enterprise BI platforms?
If your organization needs established, battle-tested dashboarding and reporting at scale, this is the group most teams already know.
These platforms have the largest user communities, deep ecosystems, and the multi-department reporting capability that newer tools are still building out.
Below are the picks shaping that segment in 2026:
#1: Tableau
Best for: Data teams and enterprises that need advanced visual analytics, exploratory analysis, and flexible deployment across cloud and self-hosted environments.
Similar to: Power BI, Qlik Sense.

Few BI platforms have the analytics power of Tableau, which built its reputation on drag-and-drop visual analytics and dashboard storytelling for analysts.
With Tableau Next, the company is now layering agentic analytics and Agentforce-powered natural language on top of that exploration experience.
Tableau's top features
- Visual exploration: Drag fields onto a canvas to build interactive dashboards, with a wide range of chart types and inline filtering.
- Tableau Next agents: Ask natural-language questions of your data and receive AI-generated answers and recommended next steps inside Slack or Salesforce.
- Tableau Pulse and governance: Centralize metric definitions, set role-based permissions, and manage data sensitivity across larger deployments.
- Cloud, server, or Tableau Next: Choose between hosted Tableau Cloud, self-hosted Tableau Server, or the agentic Tableau Next offering.
Tableau pricing
Tableau uses per-user, per-month pricing, with separate plans depending on whether you deploy Tableau in the cloud, on your own servers, or as part of its newer AI-driven offering:
- Tableau Cloud has three pricing plans:
- Tableau Standard: $75 per 1 creator per month, with each additional license from $15 per user/month, includes browser-based authoring and collaboration, Tableau Desktop and Prep Builder, Tableau Pulse for metrics and insights.
- Tableau Enterprise: $115 per 1 creator per month, with each additional license from $35 per user/month, includes everything in Standard, plus Advanced Management and Data Management for governance and scale.
- Tableau+ Bundle (Cloud + AI): Custom pricing, includes everything in Tableau Enterprise, plus Tableau Next, Tableau Agent, and Pulse premium features, with access to release previews and early AI capabilities.
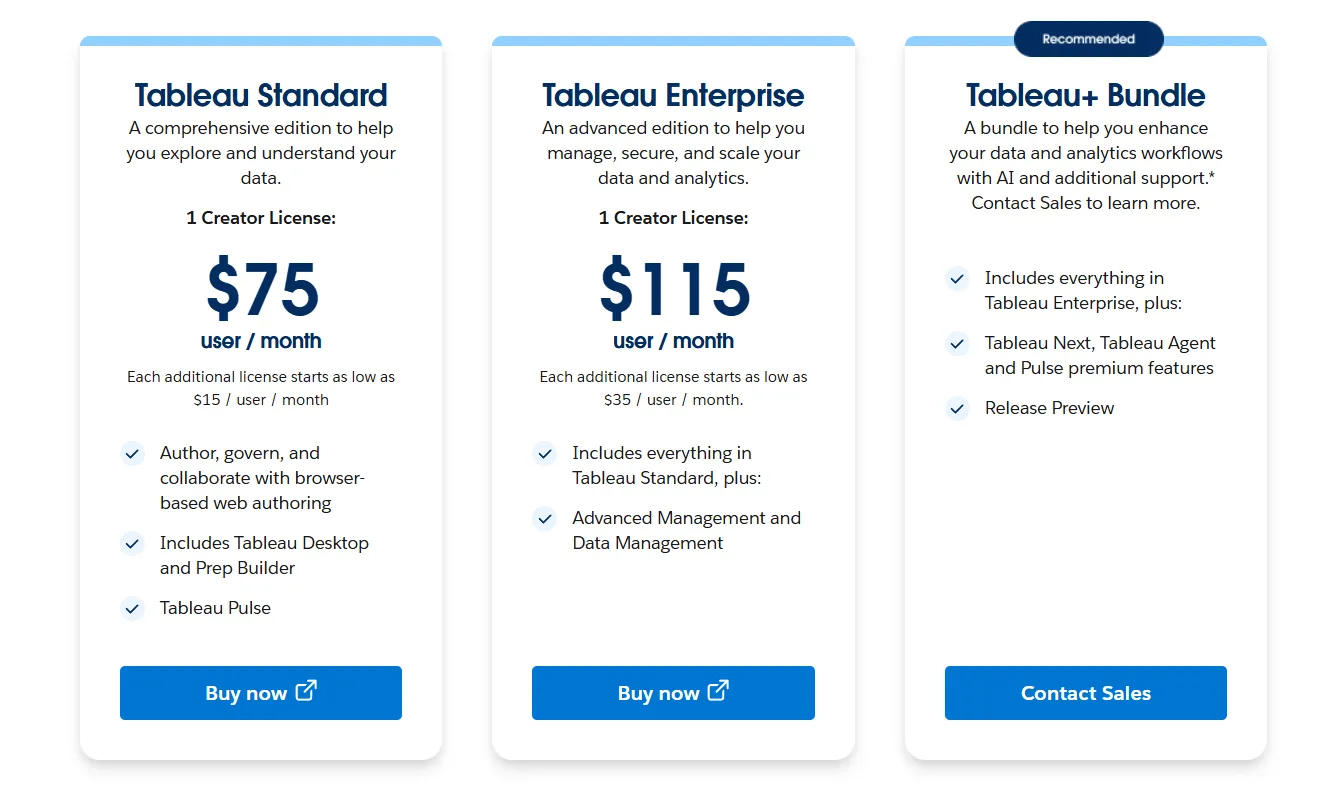
- Tableau Server has two pricing plans:
- Tableau Standard: $75 per 1 creator per month, with each additional license from $15 per user/month, includes authoring, governance, and collaboration and Tableau Desktop and Prep Builder.
- Tableau Enterprise: $115 per 1 creator per month, with each additional license from $35 per user/month, includes everything in Standard, plus Advanced Management, Data Management, and eLearning.
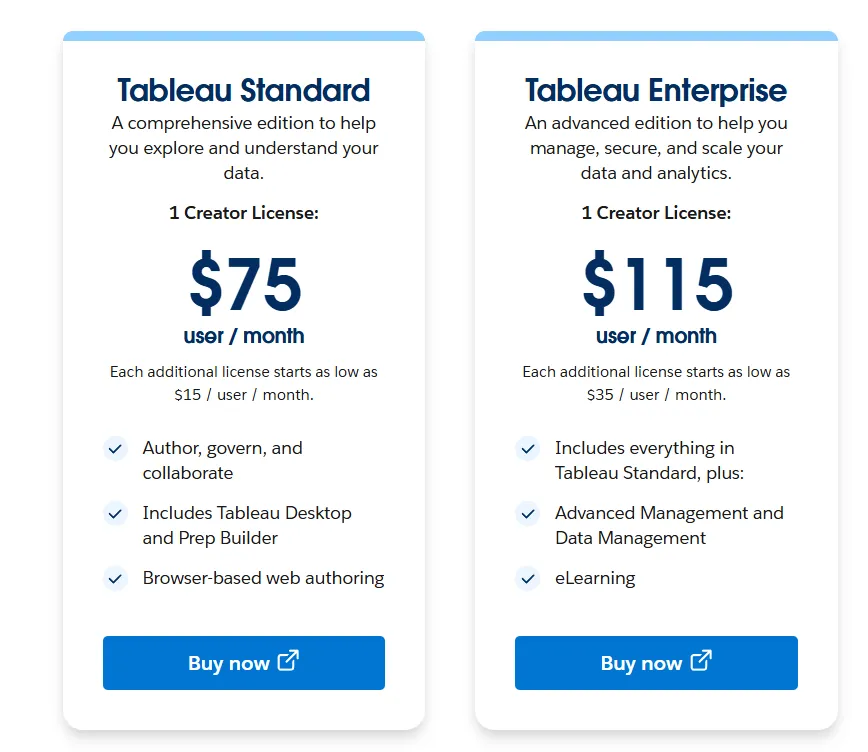
- Tableau Next (agentic analytics): Requires an annual contract, includes agentic analytics via Agentforce, Tableau Semantics, Tableau Pulse (including premium), and Data 360.
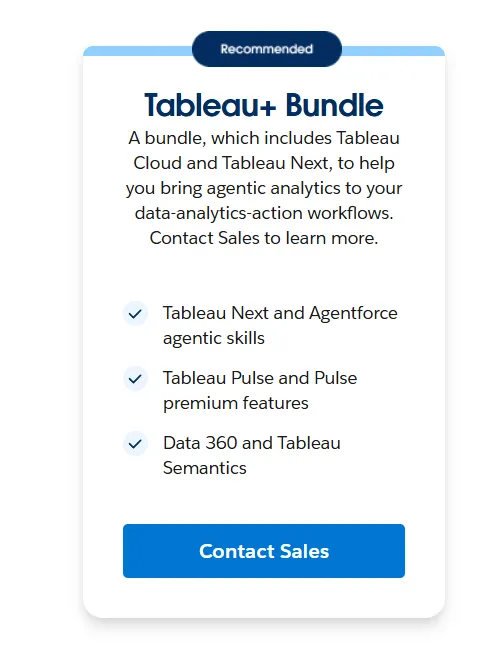
Tableau pros and cons
✅ Some of the deepest visual analytics capability in BI.
✅ Massive global community with tutorials and certification paths.
❌ Per-user pricing can scale fast for organizations rolling out broadly.
#2: Microsoft Power BI
Best for: Organizations already invested in the Microsoft ecosystem that want standardized dashboards, reporting, and self-service analytics at scale.
Similar to: Tableau, Domo.
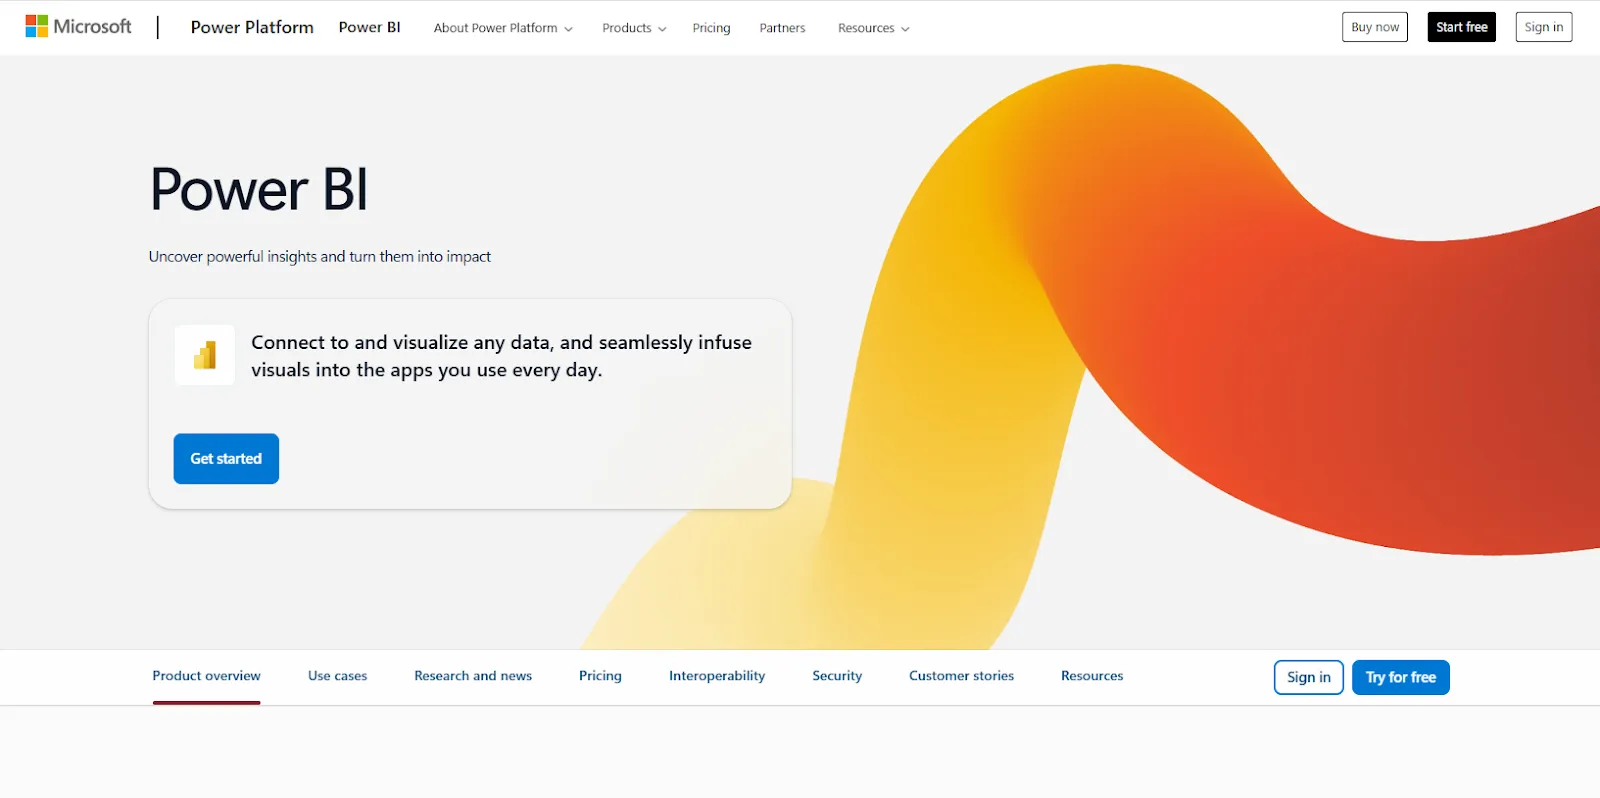
Designed for organizations already running on Microsoft 365, Power BI handles modeling, interactive dashboards, paginated reports, and AI-assisted insights.
The deep ties into Excel, Teams, and SharePoint are what make it the default choice across most Microsoft-first stacks.
Power BI's top features
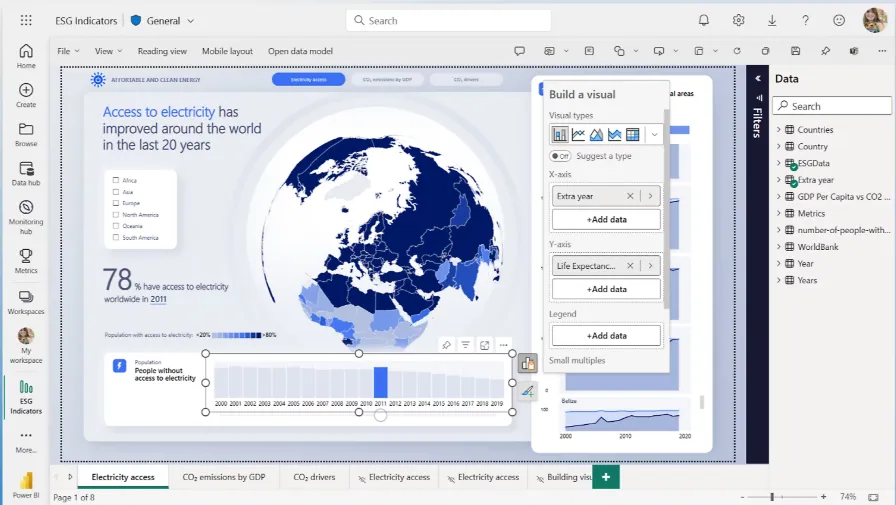
- Reports and dashboards: Combine multiple visuals, filters, and drill-throughs to publish interactive reports across an organization.
- Enterprise governance: Apply row-level security, sensitivity labels, and Microsoft Entra ID controls to lock down access at scale.
- Copilot and quick insights: Use AI to surface unusual patterns, generate forecasts, and write summary commentary for reports.
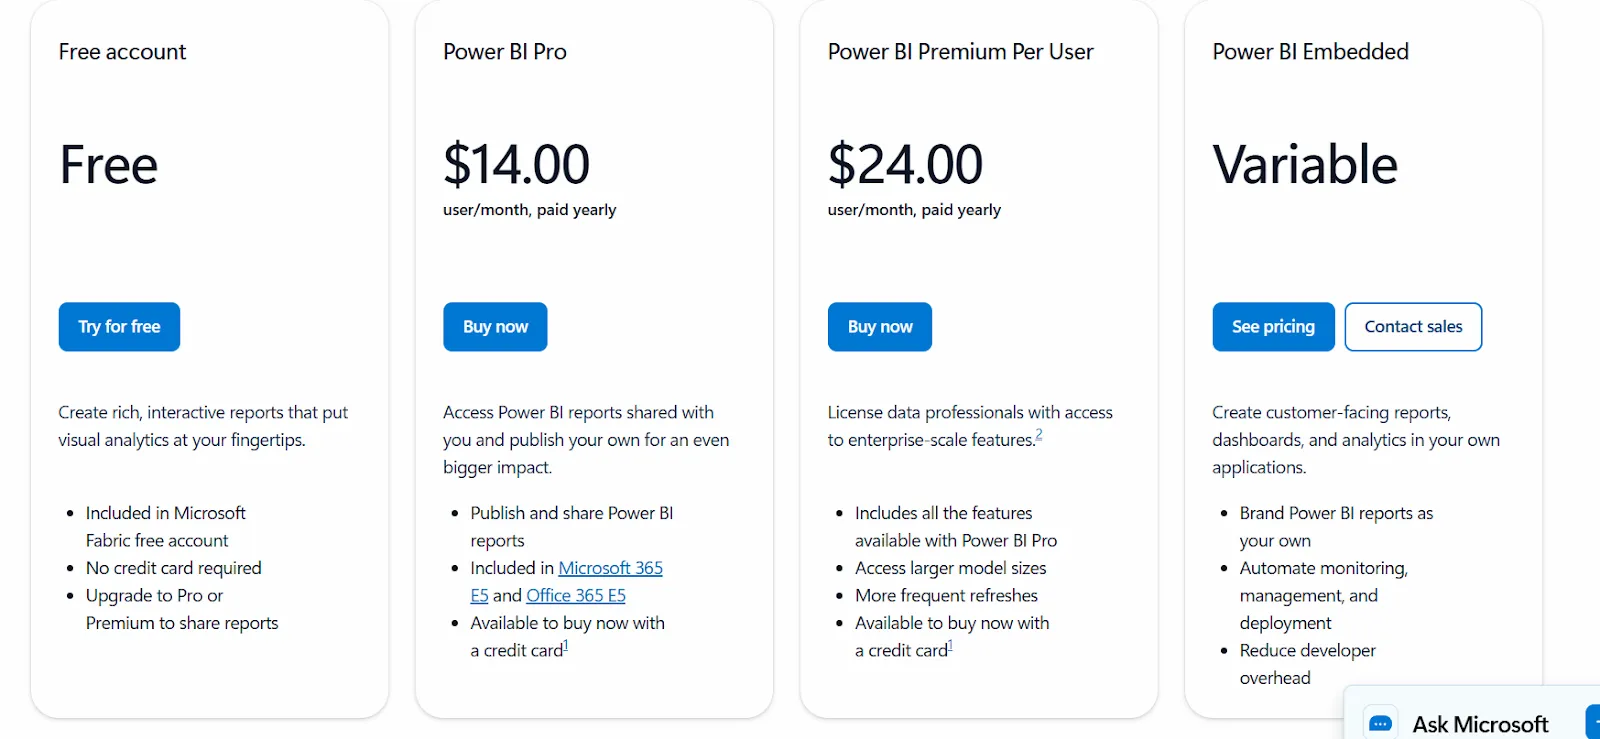
Power BI pricing
Power BI uses a per-user and capacity-based model:
- Free: Build personal reports and dashboards, but no sharing or collaboration.
- Power BI Pro: $14/user/month, includes report publishing, workspace sharing, scheduled refresh, and Teams or SharePoint embedding.
- Power BI Premium Per User: $24/user/month, adds larger model sizes, more refreshes per day, paginated reports, and AI features.
- Power BI Embedded: Custom pricing for customer-facing analytics inside your own apps.
Power BI pros and cons
✅ One of the most affordable BI entry points at $14/user/month.
✅ Native Excel and Teams integration.
❌ For beginners, the learning curve can feel steep, particularly when you start working with data modeling and DAX formulas, according to a G2 review.
#3: Qlik Sense
Best for: Organizations that want interactive analytics for exploring complex data, especially teams in governed industries that prefer on-prem deployments.
Similar to: Tableau, Power BI.
Qlik Sense runs on the company's associative engine, which lets users move across any combination of dimensions instead of being confined to predefined drill paths.
Regulated industries pick it frequently when they need on-prem deployment paired with flexible analysis.
Qlik Sense's top features
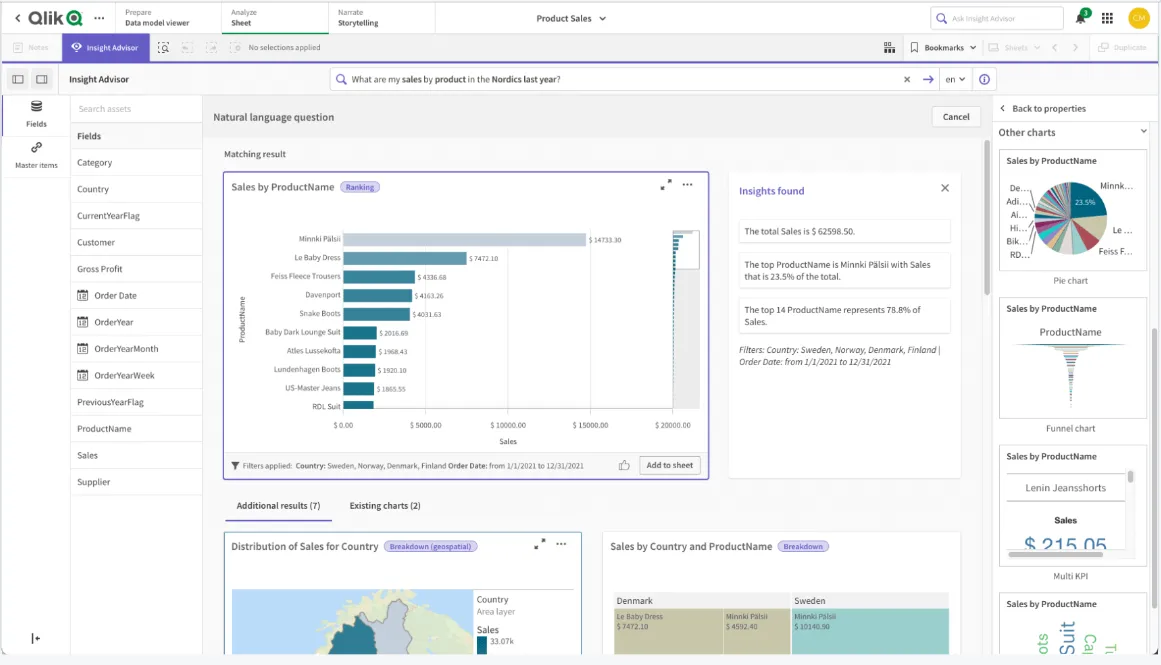
- Associative engine: Selecting a value in one chart updates everything else on screen in real time, opening exploration paths that traditional drill-downs don't expose.
- Insight Advisor: AI-driven insight generation, natural-language search, and predictive analytics built into the platform.
- Real-time alerts: Trigger automated notifications or downstream actions when monitored metrics cross defined thresholds.
Qlik Sense pricing
Qlik doesn't publish pricing for Qlik Sense. You have to contact their sales team for a custom quote.

Qlik Sense pros and cons
✅ Associative engine handles complex, multi-dimensional exploration well.
✅ Strong fit for governed and on-prem use cases.
❌ One user on G2 mentions that sometimes there are loading issues, especially when business intelligence is running updates.
Get started with Dot for free
If your team is tired of dashboards as the default analytics output, Dot is one of the few platforms in this category built around analysis rather than visualization.
What you get with Dot:
- Slack and Teams for asking questions, with answers and scheduled reports delivered there, in email, or in the web app.
- Recurring business reviews automated end-to-end and delivered as scheduled PowerPoints.
- A persistent Context Agent that keeps metric definitions consistent across teams.
- Inspectable audit trails on every output, with one click back to the query and the data.
- Native connections to Snowflake, BigQuery, Redshift, Databricks, and a range of other warehouses, databases, and SaaS sources.
- Compatibility with existing dbt, Looker, and Power BI modeling work, no migration required.
- SOC 2 Type II compliance and enterprise-grade access controls.
- Credit-based pricing that scales with usage rather than seats.
➡️ Get started for free with Dot's Starter plan, or schedule a demo to see how it works with your data.
⚠️ Disclaimer: This article was last updated on the 8th of May, 2026, and if there's any misinterpretation of the information, please contact us, and we will fact-check it.
Theo Tortorici
Theo writes about AI-powered analytics, data tools, and the future of business intelligence at Dot.