
Top 5 Generative AI Use Cases In Data Analytics In 2026
Generative AI use cases in data analytics now go well past summarizing someone else's dashboard, covering SQL writing, metric investigations, documentation and scheduled reporting.
Below are the five worth learning about and prioritizing, with what each one produces and who it helps, using Dot, our conversational analytics software, as the running example.
TL;DR
- Generative AI in data analytics creates output that didn't exist before: a SQL query, a written explanation, a dashboard or a metric definition.
- The five use cases covered here are answering questions without SQL, investigating why a metric moved, sending scheduled updates, turning answers into live data apps and drafting the documentation an AI analyst relies on.
- Dot handles all five AI use cases in this guide, and each figure it pulls from your data links to the query that produced it.
- Documentation gets the least attention of the five, yet weak definitions drag down every answer built on top of them.
What are the top generative AI use cases in data analytics?
The top generative AI use cases in data analytics are answering questions without SQL, investigating why a metric moved, sending scheduled updates, turning answers into live data apps and drafting documentation for an AI analyst.
Here's what each one produces and who it helps most:
Use case | What it produces | Who it helps |
Answering questions without SQL | A direct answer backed by a visible query | Anyone who would otherwise file a ticket with the data team |
Investigating why a metric moved | A written report that opens on a quantified finding and includes recommended next steps | Managers preparing for a business review |
Sending scheduled updates | A summary of what changed, with optional conditions deciding whether it goes out | Stakeholders who rarely open a dashboard |
Turning answers into live data apps | Dashboards, cited reports, slide decks and data essays that rerun on current data | Teams that revisit the same numbers weekly or present them to a board |
Drafting documentation for an AI analyst | Table descriptions and metric definitions awaiting human review | Data teams with hundreds of undocumented tables |
➡️ For a side-by-side look at software built for these jobs, our roundup of thebest AI data analysis tools compares ten options.
1. Everyday business questions answered without SQL
This use case lets anyone ask a data question in ordinary words and get back an answer computed from the company's own tables.
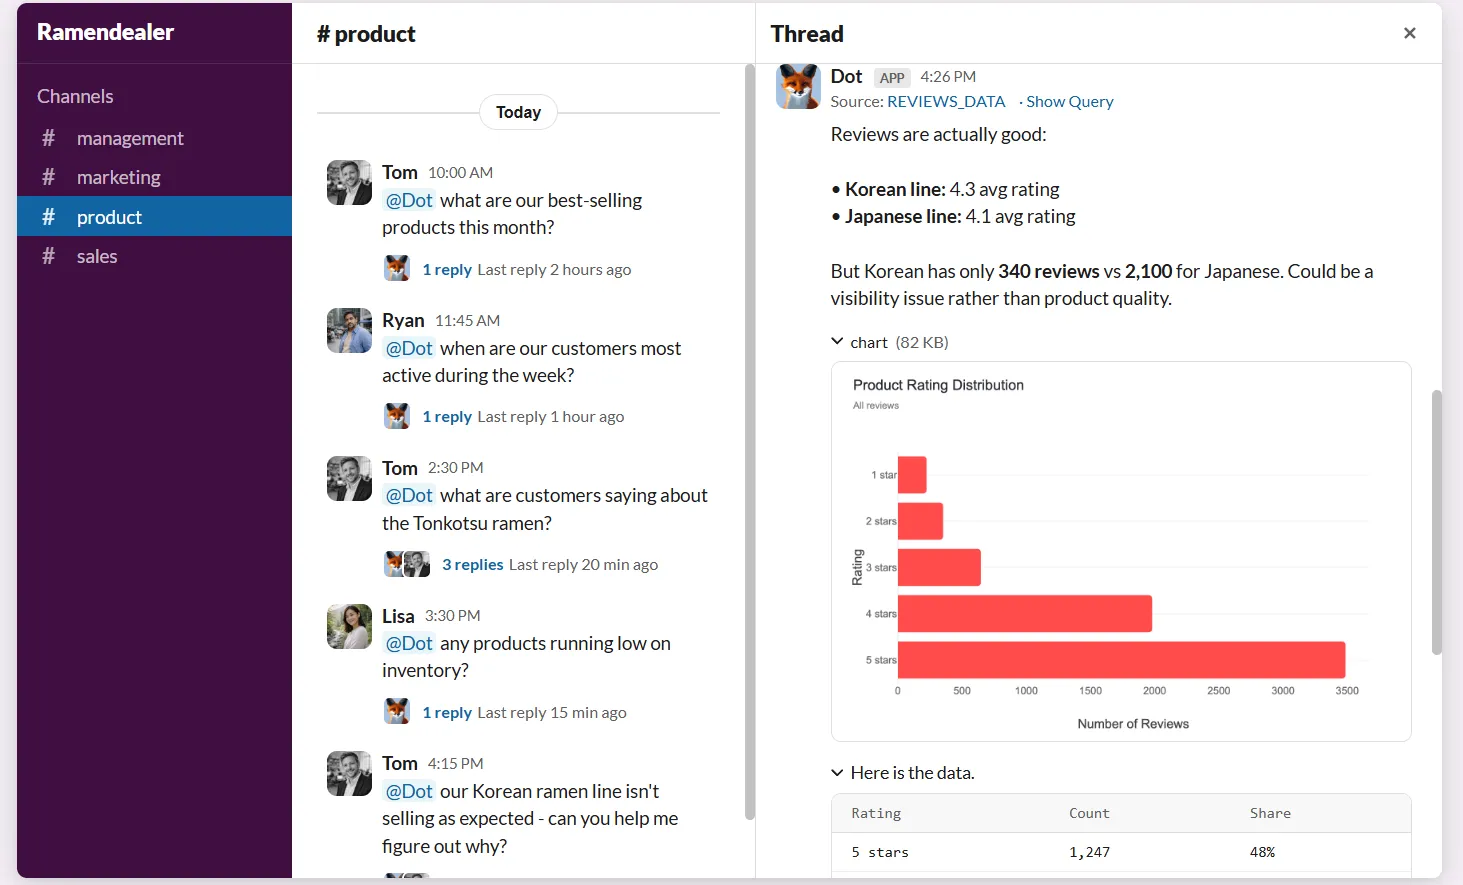
Behind the scenes, a language model turns the question into SQL and writes the result up as a sentence, adding a chart when one helps.
It works well only when the model can reach your data and has your metric definitions to work with.
A general-purpose chatbot can handle a question like this if someone pastes in an export, and BI suites have started shipping assistants for questions about their own dashboards.
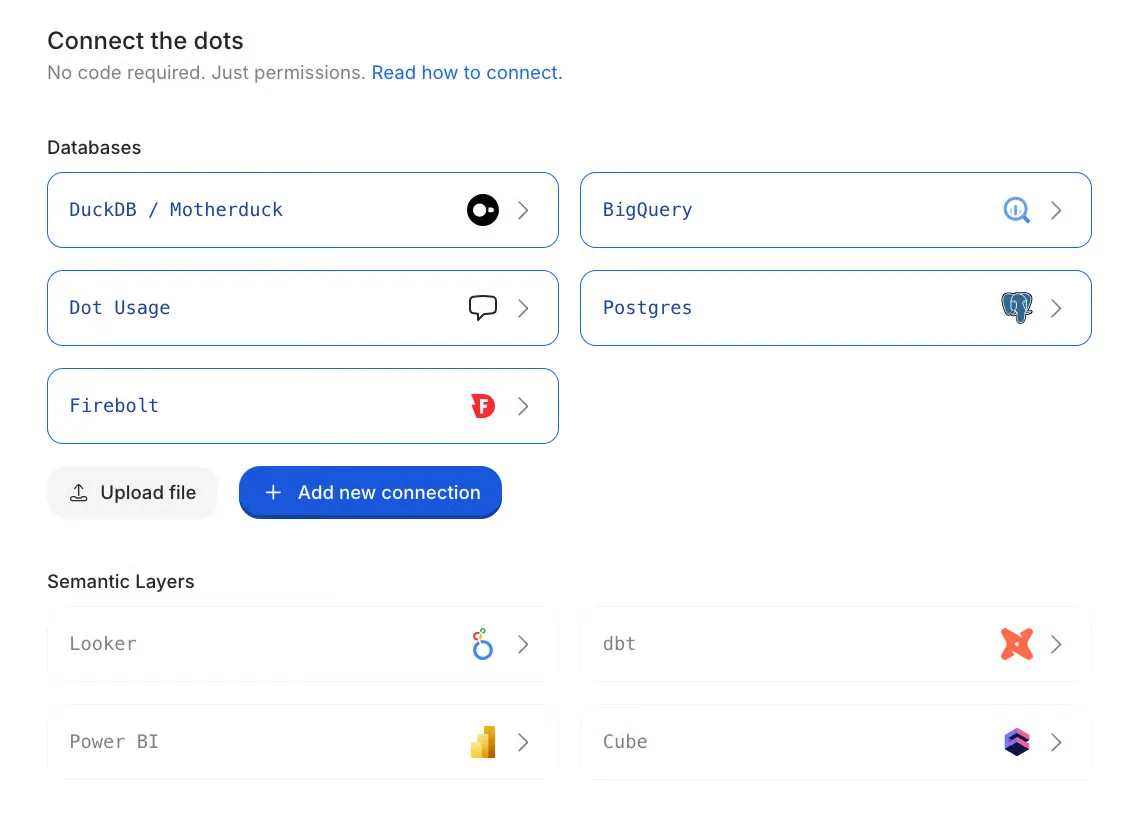
Dot connects to the warehouse itself and checks its own SQL before replying.
The query comes attached to every answer for anyone who wants to audit the logic.
People can put questions to it from Slack, Microsoft Teams, their inbox or the Dot web app, the same tools most of them keep open all day.
A sales lead asking for the share of March signups who placed a second order within 30 days gets the percentage back in the same Slack thread.
Questions that need outside context, like a competitor's published pricing, can pull web research into the answer.
A common cause of misses is a question that could mean two different metrics, so naming the metric and the time frame up front saves Dot from asking which one you meant.
💡 Pro tips:
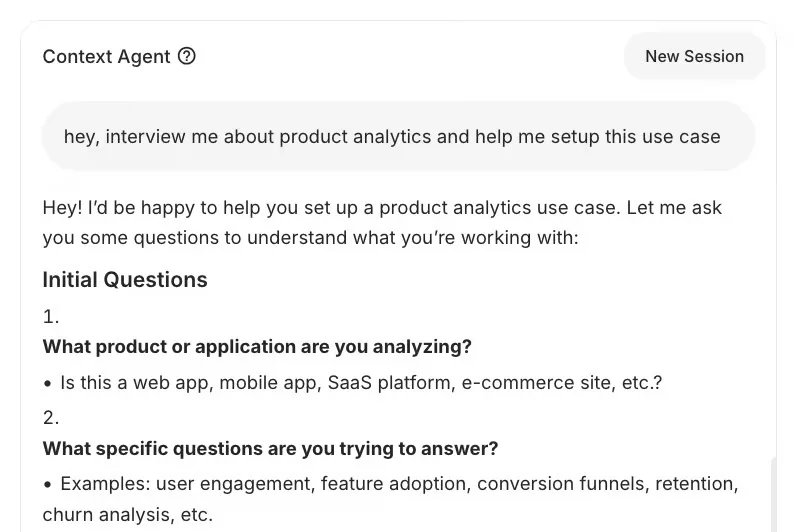
- Let Root interview you: a prompt like 'interview me about how we count active customers' turns what's in your head into a note Dot uses on later questions.
- Seed the channel: a few well-phrased example questions pinned where people ask Dot give newcomers a format worth copying.
- Switch on the business-questions setting early: it steers Dot to decline off-topic requests in two sentences without running a query, and those declines cost next to nothing during the first wave of joke questions.
2. Investigations into why a metric moved
An AI investigation is a chain of queries that each test one explanation for a change, ending in a short written report on the explanations the data supports.
A familiar example is repeat purchases in Germany slipping in August with nothing obvious to explain it.
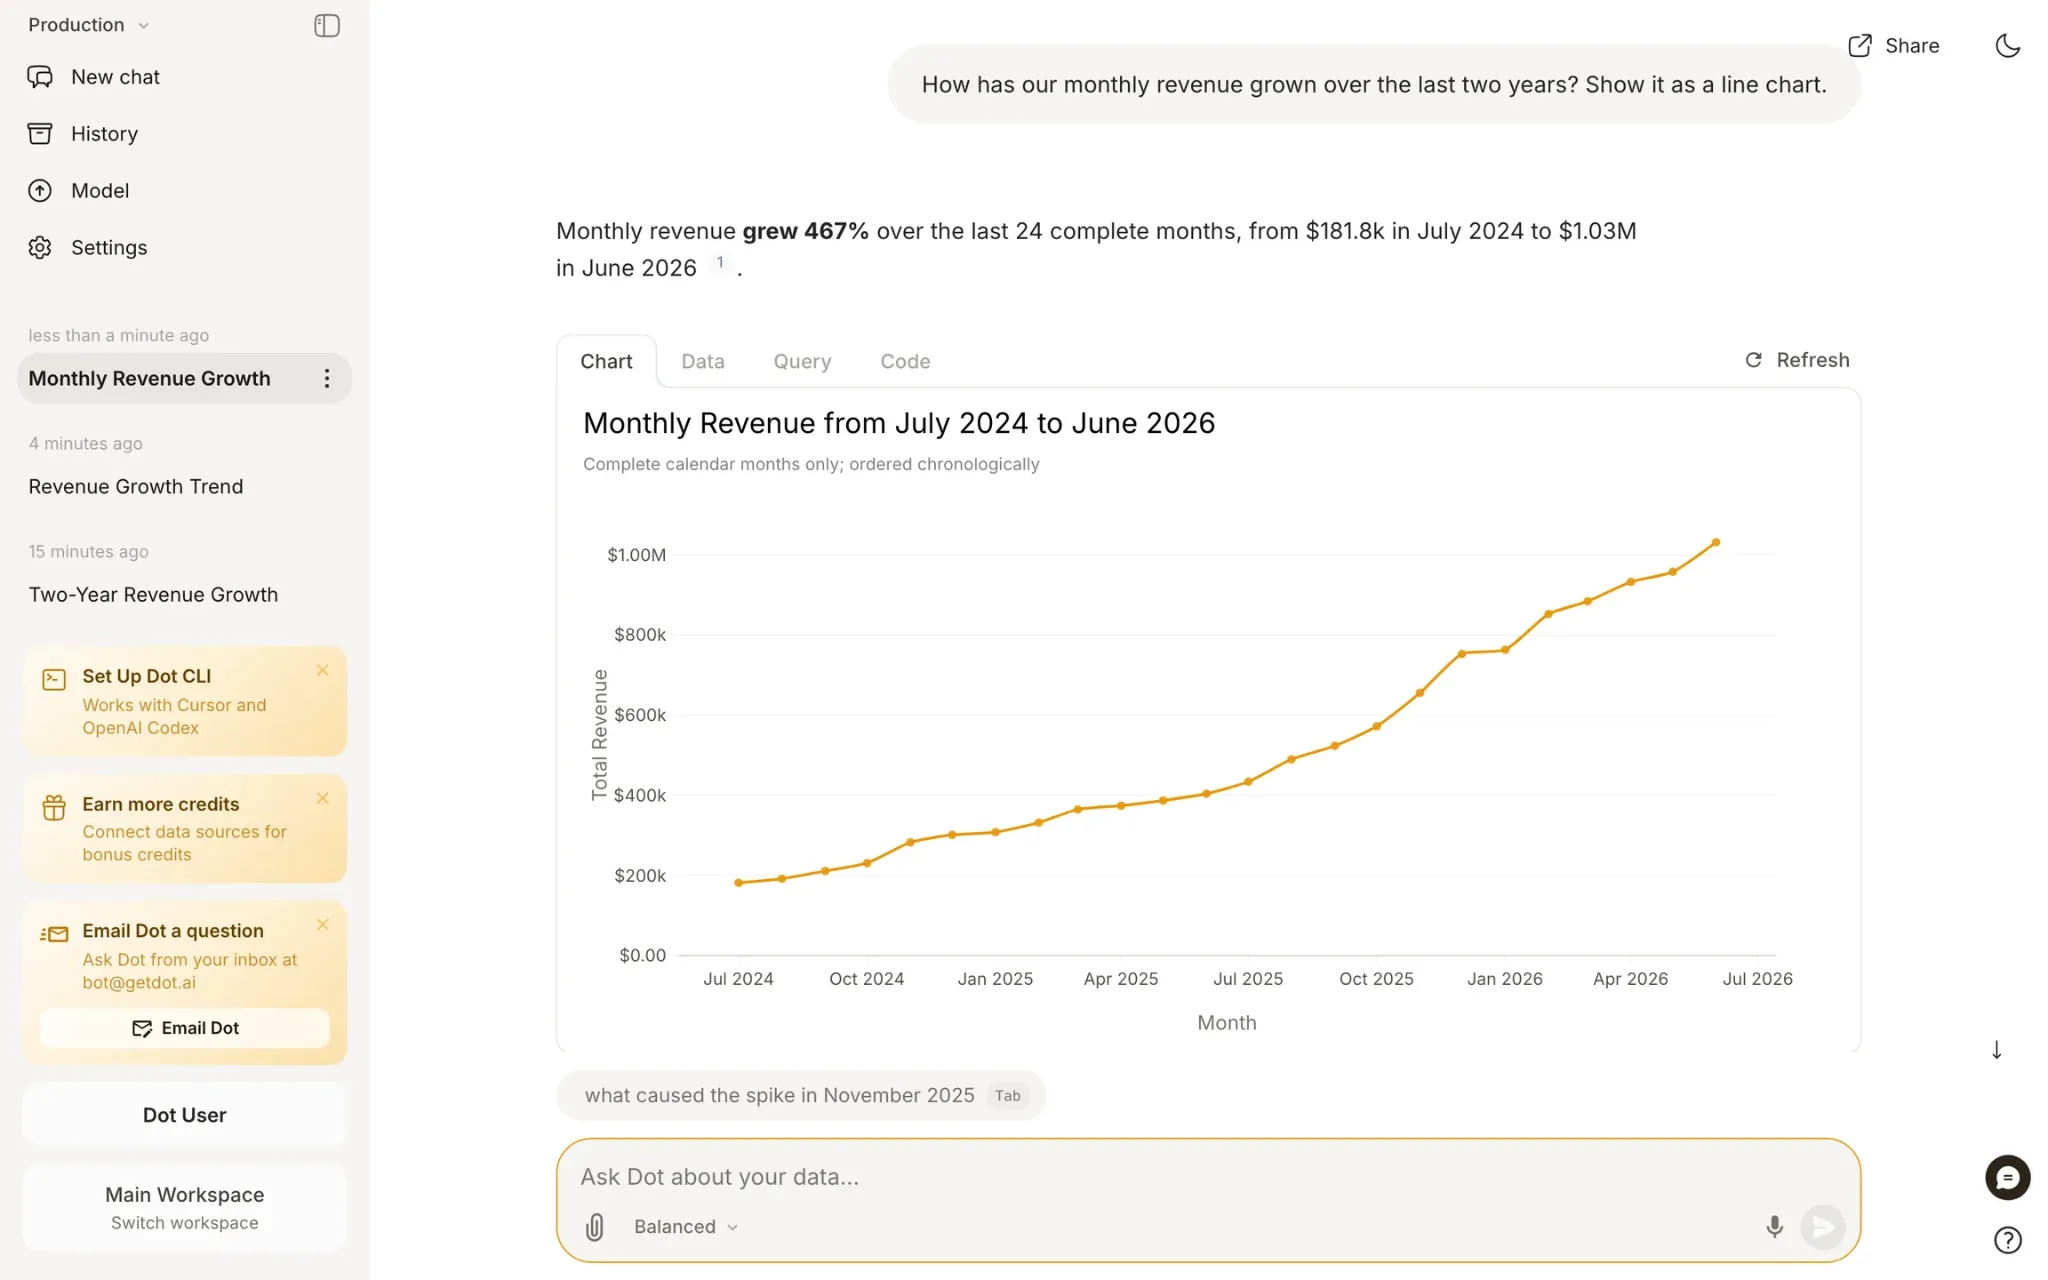
An analyst would slice the number several ways and chase whichever slice looked odd, which can swallow an afternoon.
Some analytics platforms automate part of that work by ranking the statistical drivers behind a change.
Dot's version, Deep Analysis, treats a "why" question as an investigation from the start.
Each query appears on screen as it runs, and the Full logs view keeps the whole trail for anyone retracing it later.
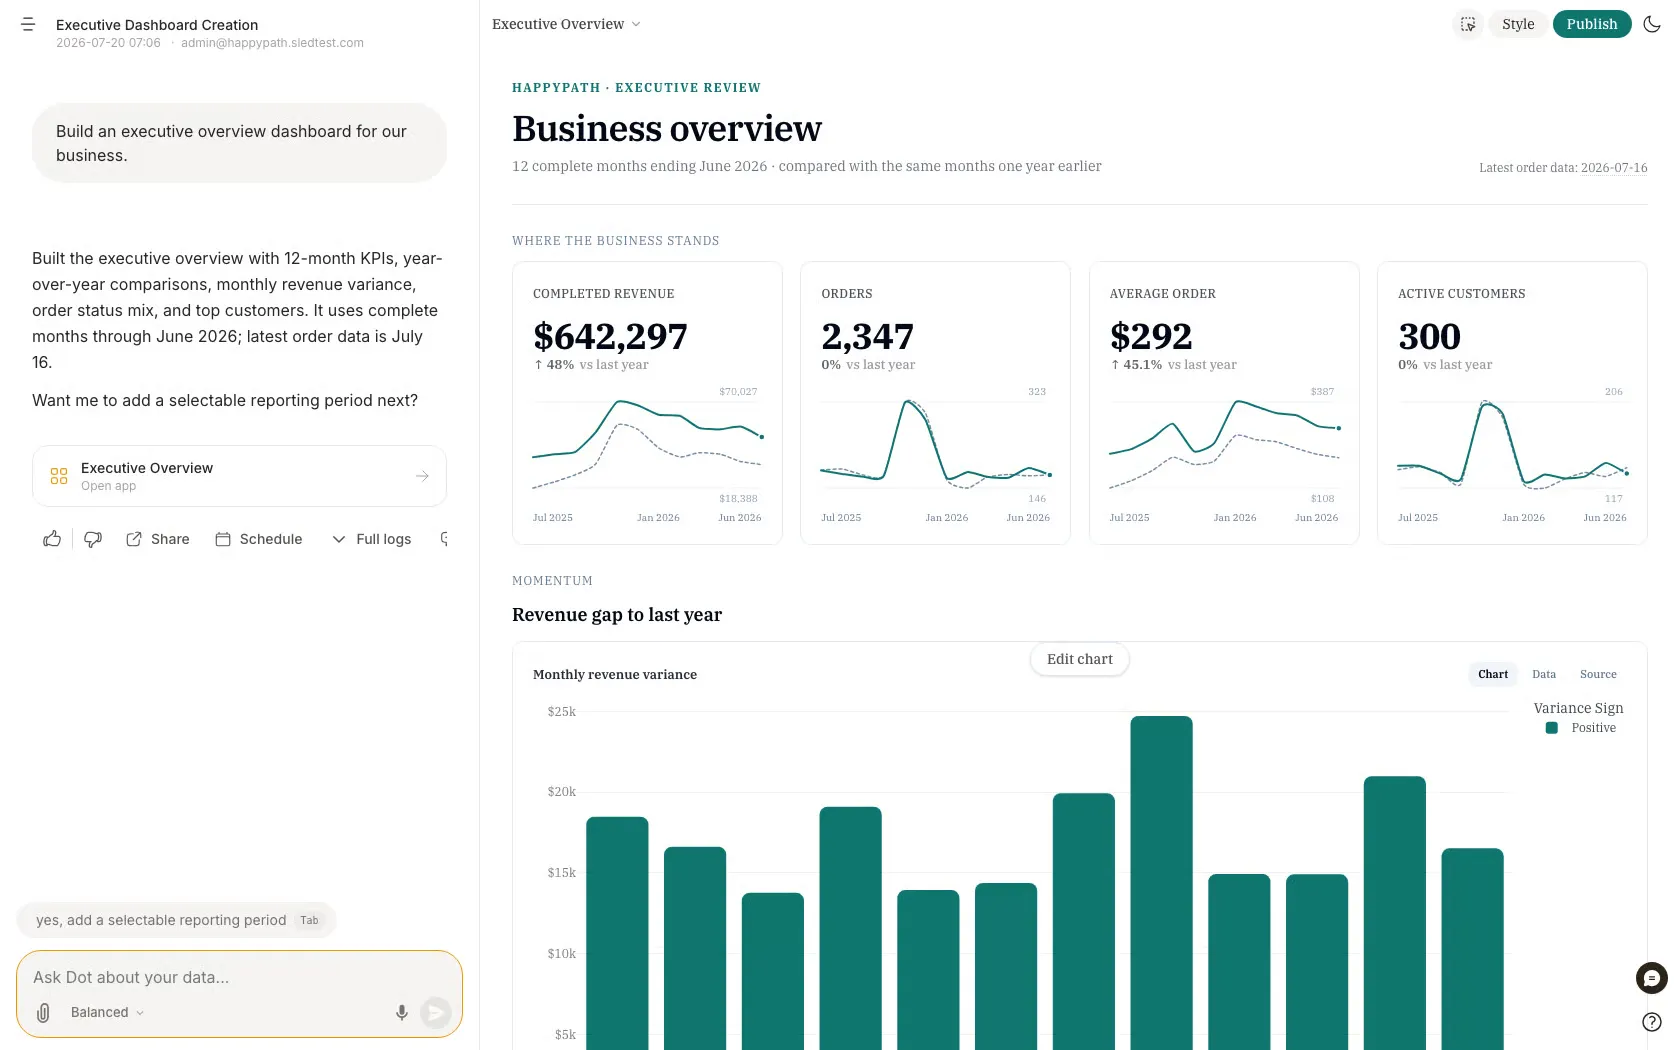
The report leads with one quantified finding and closes with a note on the definitions and time windows Dot assumed, caveats included.
Charts and recommendations fill the middle, with each claim linked back to its data.
Using it takes nothing more than typing the "why" question into the same chat, and the finished report can go straight into the review.
When the findings need to go into a meeting, the whole report exports to PowerPoint.
💡A few more pro tips:
- Read the assumptions note first: a definition that doesn't match yours is easier to catch in that list than in a chart.
- Ask while the change is recent: an investigation started the same week a number moves can draw on people who remember what else happened, and they can add that context in the thread.
3. Scheduled written updates
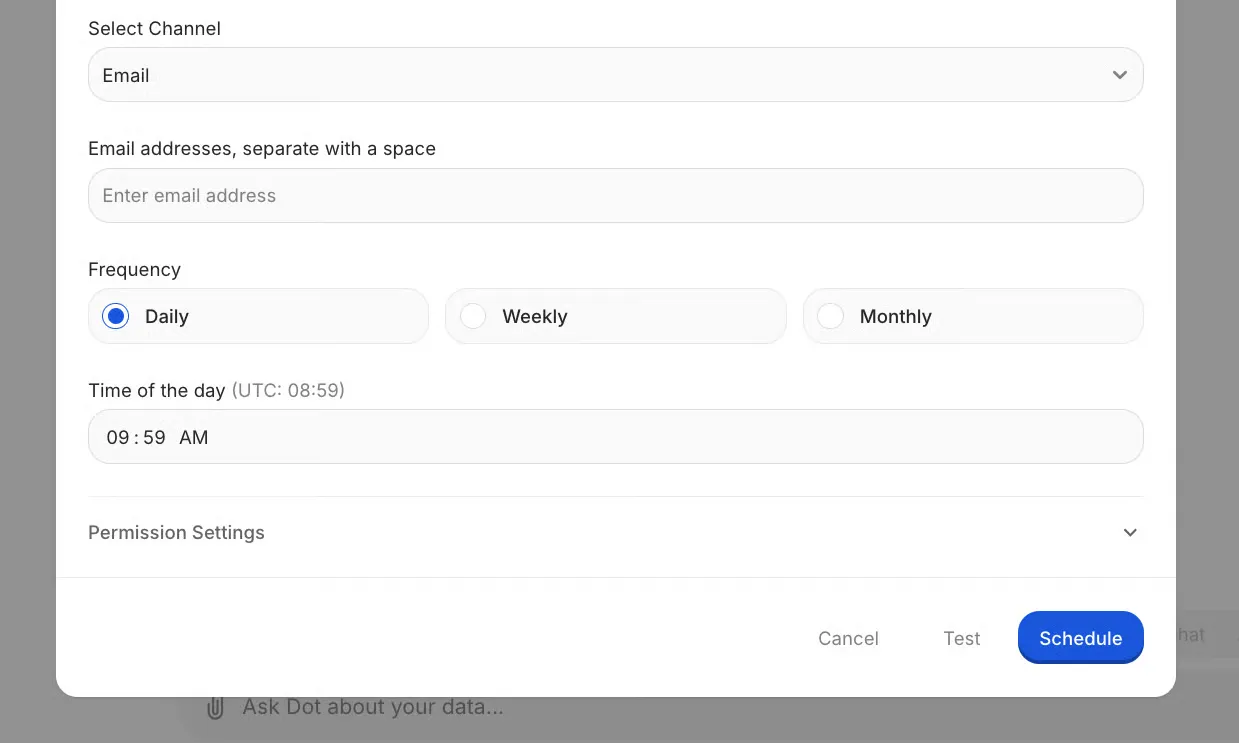
Scheduled updates are analyses the AI reruns on a set cadence and sends out as a written summary of what changed, from a Monday sales recap to a monthly churn review.
Recurring meetings tend to depend on one person pulling the numbers beforehand, usually repeating whatever they did last time.
Dashboard subscriptions and threshold alerts already cover part of this, and a few tools now attach a generated summary.
Dot reruns a Deep Analysis on a schedule and delivers the write-up by email or through Slack or Microsoft Teams, up to twice a day.
Two gates, one before the analysis and one after it, stop a schedule from turning into noise.
The work gate looks at your database ahead of any analysis, testing a condition you describe in words, such as whether yesterday's orders table has finished loading.
Dot writes and maintains that check itself, so nobody on the team has to script it.
A failed check cancels that run, and no credit gets spent on it.
An error inside the check has the opposite effect, letting the run go ahead so a bug in the gate doesn't quietly hide a report.
The result gate decides delivery once the analysis is done, with conditions like "only send if more than three enterprise accounts cancelled this week."
Held-back reports still cost the usual 1 Agent Compute Credit, since the analysis ran, and each one stays logged in run history.
Setting one up starts from an investigation you've run before, with a schedule and a list of recipients added on top.
A per-schedule toggle swaps the default short summary for the full report.
4. Live data apps built from answers
A live data app turns a one-off answer into something people can reopen, laid out as a dashboard, a cited report, a slide deck or a scrolling data essay.
The AI saves the SQL behind the answer and builds a layout around it.
Drafting a chart from a prompt is common in BI tools, usually inside their own authoring canvas.
Opening an app in Dot doesn't call a language model at all.
The saved queries run against current data, and the same data produces the same view every time.
Building one starts with a request in the chat thread (a board deck for Thursday's review, say), and Dot tests the queries before showing a preview.
Changes happen through the same conversation, whether that's a new plan-tier filter or a different theme.
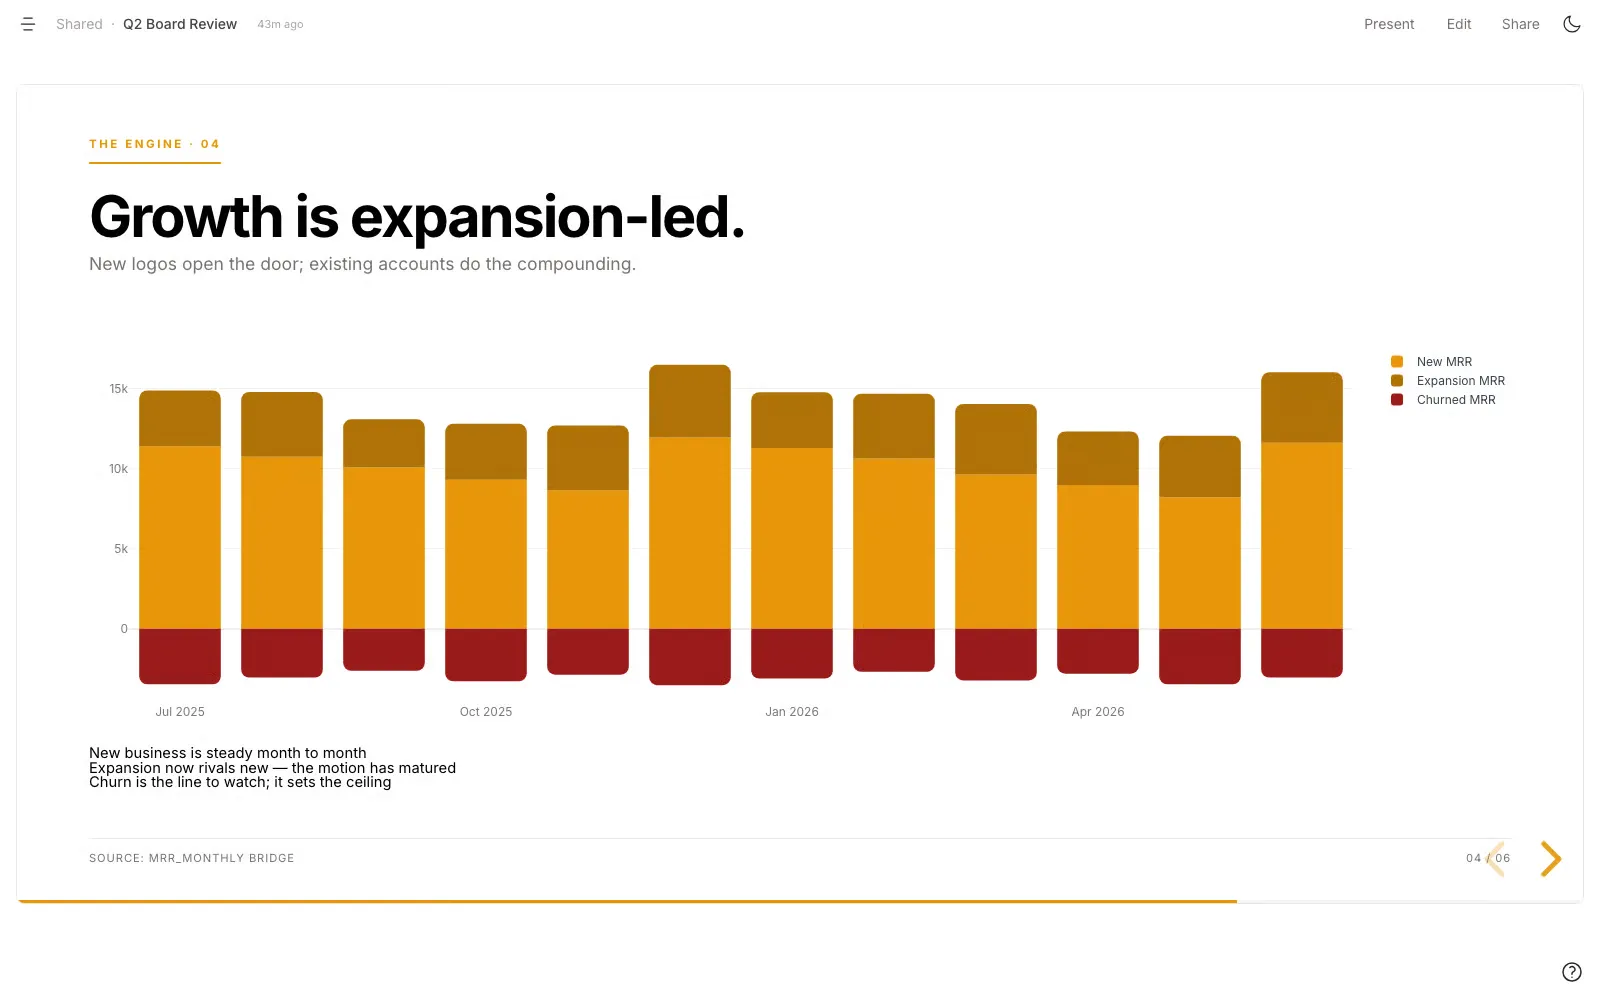
A copied link carries its filters along, meaning a colleague who opens it gets the same filtered view.
Teams that review changes in Git can keep each app as a .app file and edit it through pull requests.
The harder part of any dashboard is keeping people's trust in it six months later.
Dot's answer is a Certified badge, which an admin or modeler grants and which disappears by itself if something the app is built on changes without another review.
Apps nobody opens anymore are archived automatically, which stops abandoned dashboards from cluttering the list.
5. AI-drafted documentation and metric definitions
Here the AI drafts the documentation other analytics features depend on: table descriptions and metric definitions that a person approves before they go live.
It's the least visible job on this list, even though the other four lean on it.
An AI that doesn't know your "active customer" excludes trial accounts will report a count nobody in finance recognizes.
Documenting tables by hand takes months, and many teams never finish.
Auto-generated column descriptions are showing up in more data platforms, and the more ambitious ones draft semantic model code for review.
Dot hands this drafting work to its Context Agent, which is called Root.
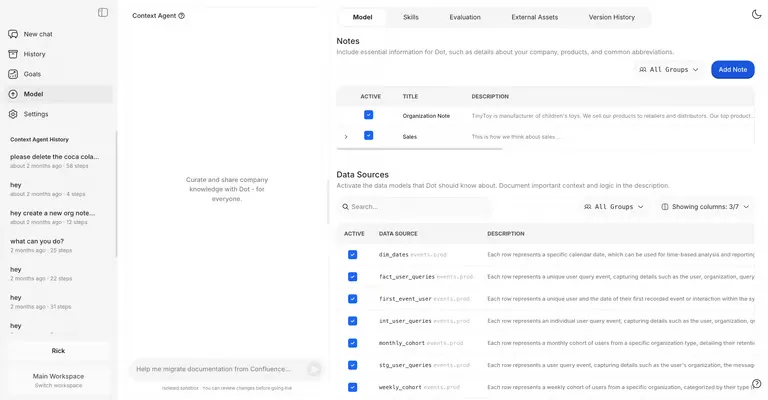
Pointed at a schema, it reads column names and types alongside real sample values and writes a description for every table and each of its columns.
It can audit existing descriptions as well, querying the data to see whether each one holds up.
Definitions trapped in Confluence or Notion can be pulled across into Dot's notes, and the logic inside trusted BI dashboards can become a metric glossary.
After a bad answer, Root can replay that conversation to find the step where Dot slipped and propose a fix.
Root's drafts stay out of production until they're merged by an admin or by a modeler an admin has trusted with reviews.
A plausible description and a correct one can look identical, which is why the review step deserves real time.
💡 You want to start narrow. Point Root at the tables behind your most-asked metrics first, and leave rarely used tables for later.
Where should your team start with these five AI use cases for data analysis?
The best starting point is the use case that addresses your team's loudest complaint, and Dot's free plan lets you test it on your own data before committing to more.
The table below matches four common complaints to a starting point in Dot and a first thing to try:
If your team has this problem | Start with this in Dot | First thing to try |
A queue full of one-line data requests | Everyday questions in Slack or Microsoft Teams | Dot installed in the team's busiest request channel, with a few example questions pinned |
Leaders keep asking why a number moved | Deep Analysis | The next "why" question from a business review, with the assumptions note read before the recommendations |
A weekly recap that one person prepares by hand | A scheduled Deep Analysis | Last week's recap rerun in Dot and scheduled ahead of the meeting, with a work gate on the overnight load |
Dashboards nobody trusts or opens | Root first, then a certified data app | The most disputed metric documented by Root and rebuilt as an app an admin certifies |
Whichever row fits, one piece of groundwork comes before it: once the warehouse is connected, Root documents the tables behind the metrics that use case touches.
A few weeks of real questions in that one area will show which definitions still need work, and Dot's History page labels the conversations that went badly.
Each fix an admin merges through Root applies to every later question about that metric, which gives the second use case firmer ground than the first one had.
Try these five use cases with Dot for free
Dot's free plan lets you try these use cases on your own data.
You can ask questions in the chat apps your team already uses, while the data team keeps control of the definitions behind every answer.
Below Enterprise, each plan comes with a credit allowance that analysis draws down, and no paid plan limits how many people can use Dot.
- Free: $0 with no card required, carrying 300 one-time credits and full access to Pro features.
- Pro: 150 credits for $180/month, then $1.80 for every credit after that.
- Team: $720/month for 800 credits, with each extra credit at $1.44 and governance features such as SSO, row-level security, workspaces and embedding.
- Enterprise: custom quotes, covering unlimited credits and volume discounts, with self-hosting, audit logs, an SLA and a dedicated account manager available.
➡️ You canstart on the free plan with your own warehouse, orbook a demo if you'd like our team to walk you through the five use cases first.
⚠️ Disclaimer: This article was last updated on September 28, 2026. If you spot any inaccuracies, please do contact us, and we'll fact-check it.
Frequently asked questions about generative AI in data analytics
What is generative AI in data analytics?
Generative AI in data analytics refers to language models producing analytical output, such as SQL queries, written explanations, dashboards and documentation, from a request in ordinary words.
Older analytics software displays what somebody built in advance, while a generative tool creates the query or the narrative on request.
Is generative AI different from predictive analytics?
Predictive analytics is a separate discipline that forecasts a value, like next quarter's churn, using statistical or machine learning models.
Generative AI creates new content from a prompt, for example, a query or a written summary.
The two can work alongside each other, since they answer different kinds of questions.
Will AI replace data analysts?
It's unlikely, although AI does take many repetitive lookups and recurring reports off an analyst's plate.
People keep ownership of the metric definitions and review the answers that feed large decisions.
What analysts can get back is time for the projects that kept slipping.
Are an AI analyst's numbers trustworthy?
Trust starts with being able to check them: each figure should come from a query run against your own warehouse, with that query shown beside the answer.
A visible query isn't the whole story, because a correct query on the wrong definition still returns a wrong number.
Dot's evaluations add a measurable check by scoring its answers against a set of reference numbers you already trust.
Should you worry about company data in AI analytics tools?
A little caution is sensible, and two things are worth checking first: whether the tool connects with read-only access, and what its model providers retain.
Queries run directly against your warehouse, and Dot is SOC 2 Type II audited.
The LLM providers Dot relies on all operate under zero data retention.
Do you need a data warehouse for AI analytics?
Not for one-off work, since most general-purpose AI assistants will read an uploaded spreadsheet.
A warehouse connection starts to pay off when the numbers change daily and several teams rely on them.
Dot is designed around a warehouse or database, though it can also query an uploaded CSV or Excel file or a linked Google Sheet.
Answers tend to improve on top of dbt models or documented tables.
Theo Tortorici
Theo writes about AI-powered analytics, data tools, and the future of business intelligence at Dot.