
10 Best AI Tools For Business Analysts In 2026
This guide ranks the 10 best AI tools for business analysts in 2026, with a read on what each one changes about the working week and what it costs to run.
Two kinds of products appear below: agents that carry out an analysis and write up the findings, plus reporting platforms that have layered AI over authoring your stakeholders know.
TL;DR
- Dot is the best AI tool for business analysts in 2026 for teams who would sooner receive completed analysis than a chart to interpret, with multi-step investigation into a figure that moved, business reviews drafted on a schedule, a lineage map beneath every number, and unlimited users on every paid plan.
- ThoughtSpot and Tellius are the strongest agent-led options at enterprise scale, one organized around a search bar and the other around automated root-cause work.
- Zenlytic and Sigma both hand an analyst something defensible to put in front of a stakeholder, through a self-learning semantic layer in one case and a warehouse-native spreadsheet grid in the other.
- Zoho Analytics and Metabase publish what they charge and start cheaply, the realistic picks for a one-person or two-person analytics function.
- Microsoft Power BI and Tableau are still the platforms most big companies report through, each carrying an AI layer over report authoring analysts know.
- Domo bundles ingestion, transformation, dashboards, and monitoring agents into one platform and bills on consumption.
What are the best AI tools for business analysts in 2026?
The best AI tool for business analysts in 2026 is Dot, an AI data analyst that writes up its findings in Slack, Microsoft Teams, email, and the web app, followed by ThoughtSpot and Tellius for agent-led investigation at scale.
Four conditions decided what made this shortlist:
- The product can be bought today, through a working signup or a sales path.
- It reads from live business data systems, going beyond files an analyst uploads by hand.
- Its AI capability ships in the product today, never an item on a roadmap.
- It maps onto work analysts get measured on: fielding ad hoc requests, explaining what changed, reporting to stakeholders, and defending the numbers afterwards.
Below is the full shortlist, with the buyer each tool fits and the figure you would be quoted.
Tool | Use case | Price |
Dot | Writes up its findings and drafts recurring business reviews, reachable wherever your team asks questions. | Free tier; paid tiers from $180 a month. |
ThoughtSpot | Search-led analytics where an agent plans and runs the analysis behind a typed question. | From $25/user/month (annual). |
Tellius | Automated driver and root-cause analysis over large enterprise data, written up as a narrative. | Pricing not published. |
Zenlytic | An analyst agent, Zoë, that builds its own semantic layer and cites the calculation beneath each figure. | Pricing not published; self-serve signup up to 10 users. |
Sigma | A spreadsheet grid that compiles to SQL and runs on the warehouse, with AI drafting workbook content. | Pricing not published. |
Zoho Analytics | Low-cost BI carrying the Ask Zia agent and connectors to the tools a small team runs on. | Free plan; paid from $30/month. |
Metabase | Open-source BI that gets dashboards and SQL access running quickly, with Metabot sold as an add-on. | Free (open source); Cloud from $100/month. |
Microsoft Power BI | Company-wide reporting for organizations licensed through Microsoft 365, with Copilot inside reports. | Free tier; Pro from $14/user/month. |
Tableau | Visual analysis your stakeholders explore themselves, with agentic answers arriving through Tableau Next. | From $15/user/month (annual). |
Domo | Ingestion, transformation, dashboards, and monitoring agents in one consumption-priced platform. | Pricing not published; 30-day free trial. |
#1: Dot
Dot is the best AI tool for business analysts in 2026 because it hands back the written finding, in whichever channel the question arrived, with the query and the full data lineage attached beneath every figure it publishes.
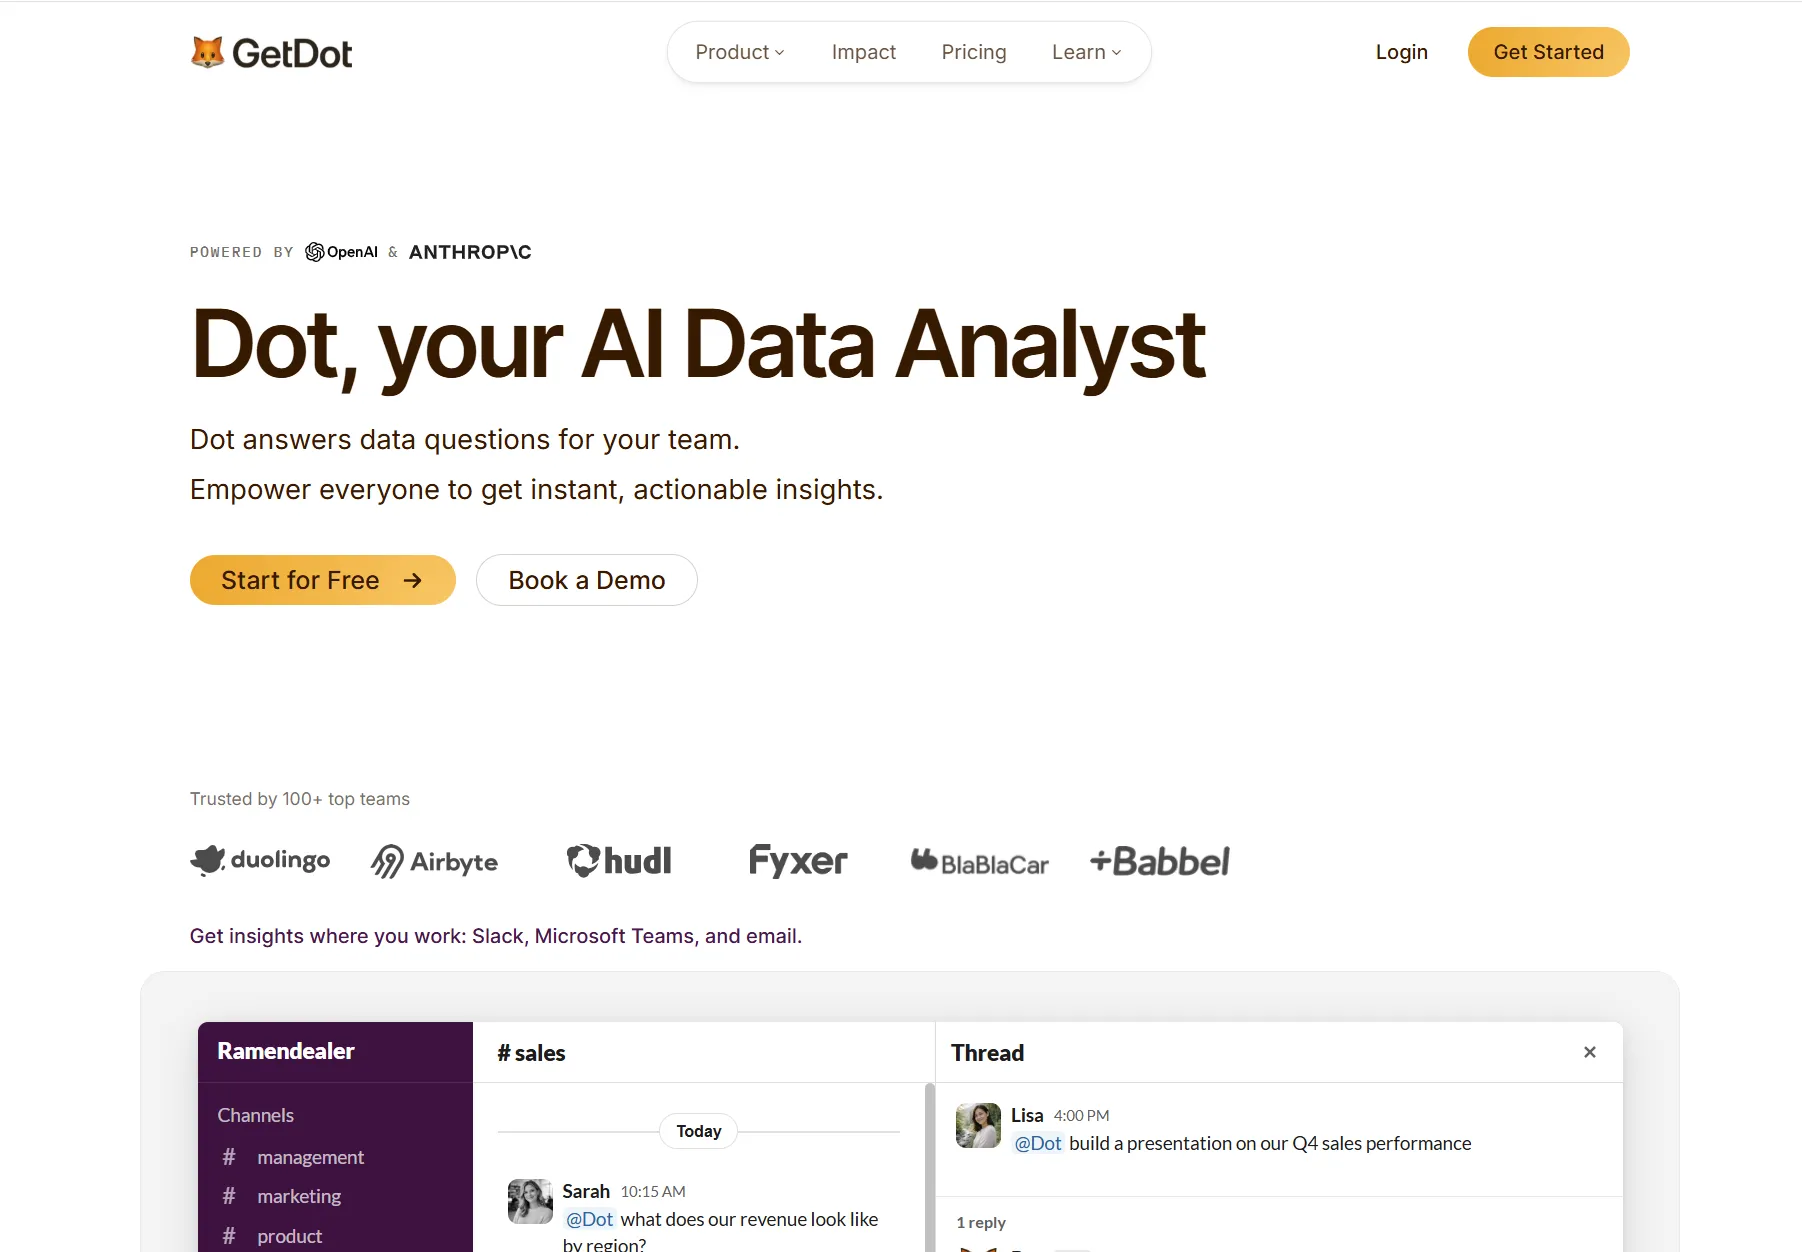
Disclaimer: Dot is our own AI data analyst, so I will make the case for it and leave the evidence in the open for you to check.
Setup happens once: a warehouse connection, then a pointer at the dbt models and documentation your team maintains.
After that, the questions your stakeholders would normally bring to you get answered without your involvement.
Here is what that covers:
Written analysis in the channel where the question was asked
Dot fields business questions in Slack, Microsoft Teams, email, and the web app.
The reply lands in that same thread with the analysis written out and a recommendation on what to do next, figures included.
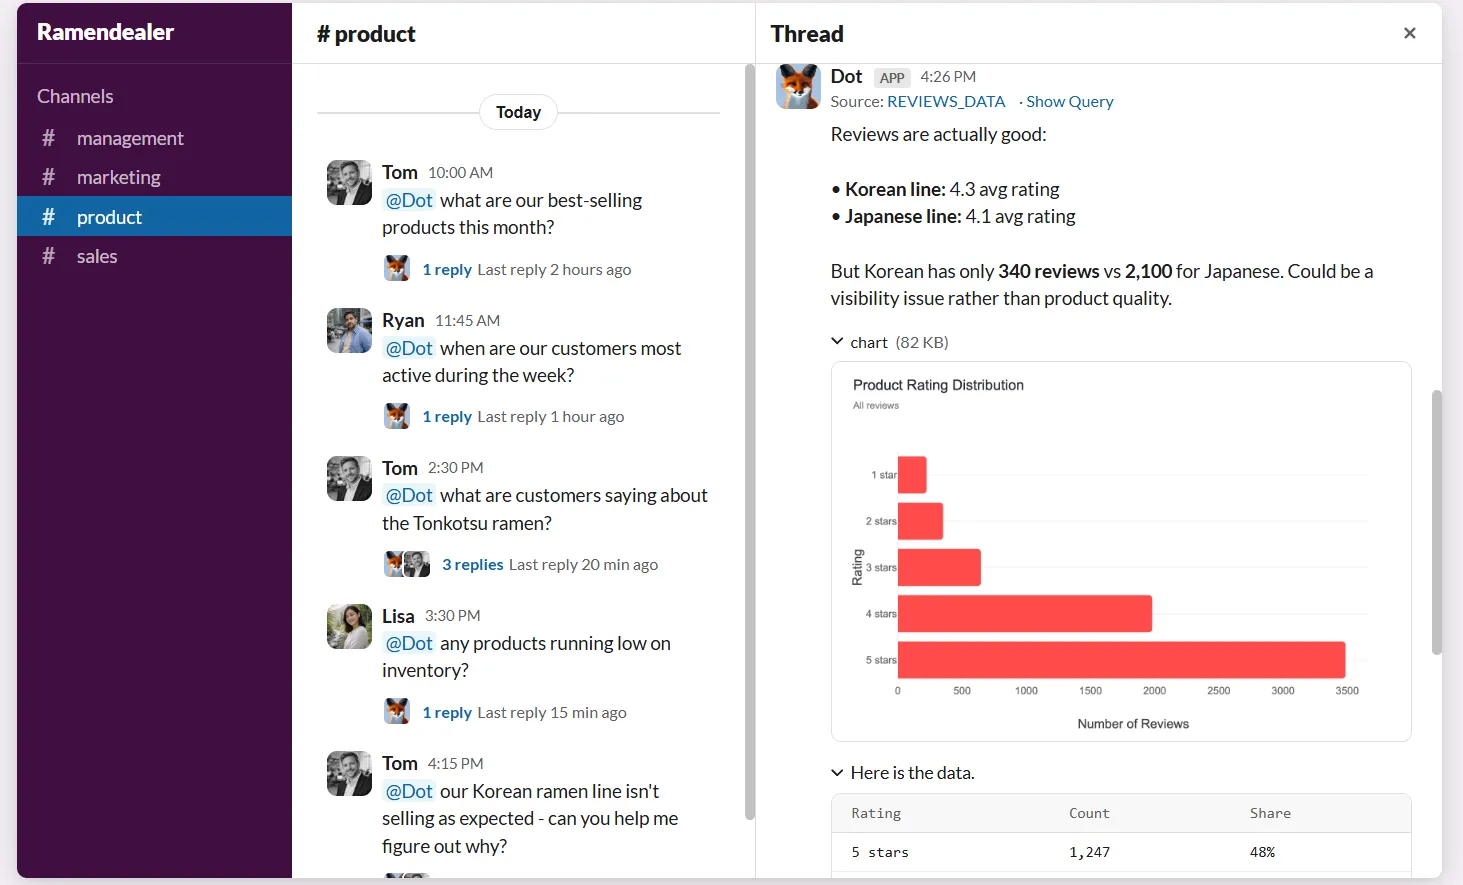
A stakeholder who wants to know why support volume climbed types the question into their own channel and reads the answer there, having opened no dashboard and written no SQL.
Energy Mode governs how much horsepower each question receives:
- Economy covers routine lookups.
- Balanced is the standing default.
- Frontier handles the genuinely hard questions.
➡️ Admins hold the company default, and any question sent through Slack, Microsoft Teams, or email accepts an !economy or !frontier prefix to override it once.
The effect on an analyst's week: routine pulls stop landing in your queue, and what does reach you deserves your judgment.
Deep Analysis for the questions that start with why
Deep Analysis is the mode Dot reaches for when a single query cannot settle the question.
Dot plans several lines of inquiry, runs them in parallel across two to ten minutes, then returns a written finding naming what shifted, sizing it against the prior period, offering the likeliest cause, and marking what still needs checking.
After a metric drops, that investigation is what fills an analyst's week.
Having the first pass assembled leaves your time for judging the conclusion.
Business reviews drafted on your cadence
Recurring business reviews come out of live warehouse data on whatever schedule you set.
Each edition names what changed, quantifies it against the previous period, offers a probable cause, and marks what needs a closer look.
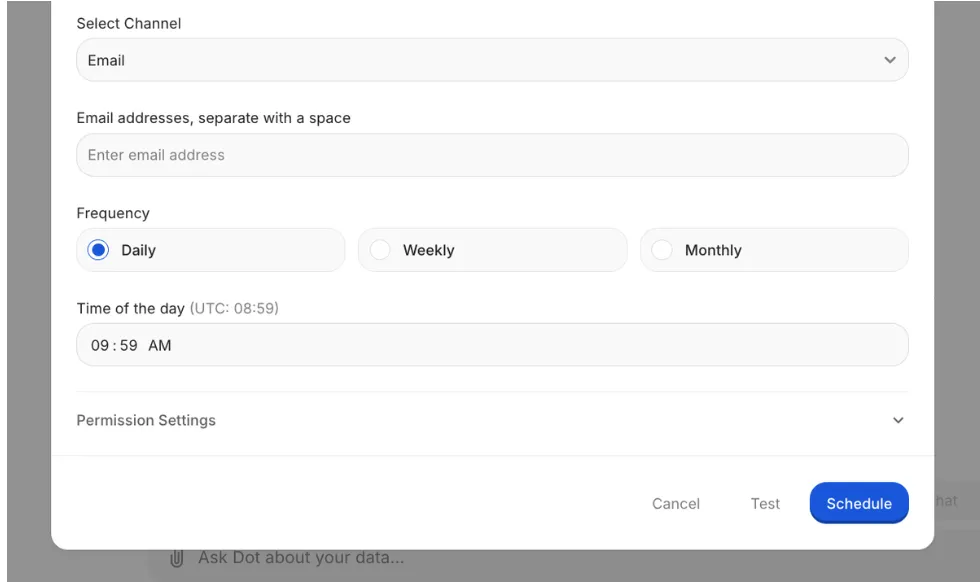
Reviews arrive in Slack or by email, and anyone who receives one can reply to that email with a follow-up question, answered by Dot in the same thread.
A monthly cycle usually means reconstructing identical charts and rewording the previous edition's commentary.
That work disappears off the calendar.
A Context Agent holding one definition per metric
Dot's Context Agent keeps a single record of how the business defines each metric, and every answer draws on that record.
It reads your dbt repository on a daily re-sync and pulls from whatever catalog, warehouse, Confluence, or Slite documentation it can reach, writing definitions where a metric has none and raising a conflict when two sources disagree.
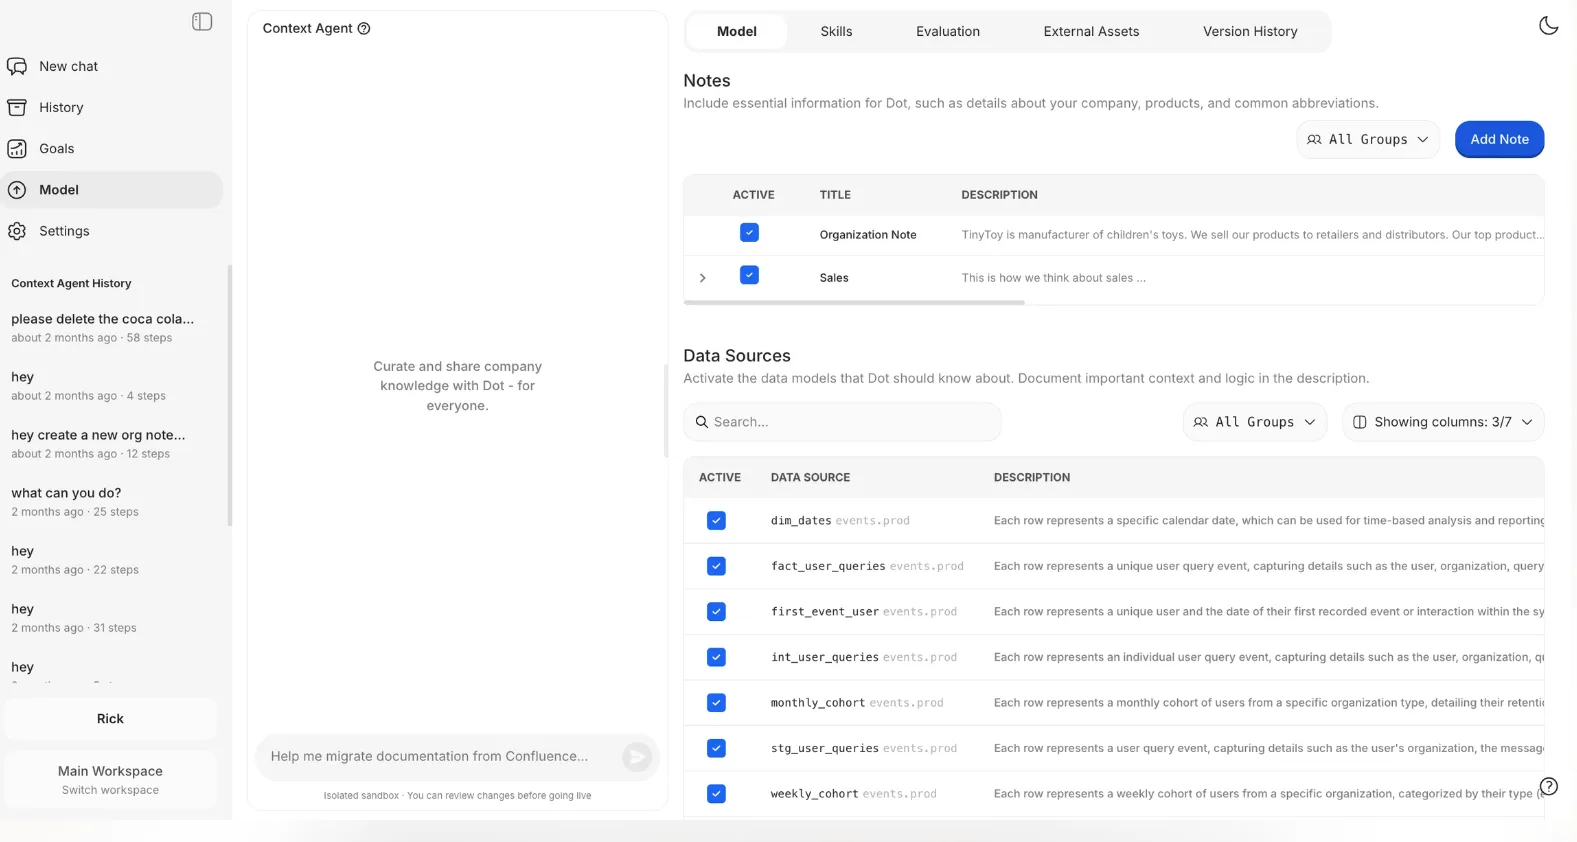
Corrections offered in chat become proposals for an admin to review before anything changes company-wide, and the definition layer stays governed as headcount grows.
Personal preferences stay personal: a request to always show figures in EUR saves a memory visible only on your own profile.
What makes Dot different from other AI tools for business analysts?
Most products on this list return a chart, a dashboard, or a query, and the reading of it falls to whoever opens it.
Dot returns the interpretation in writing, with the evidence one click beneath.
The commercial model differs too.
Among the tools here that publish a price, a user count sets the bill, whether that is a per-seat rate or a plan cap on how many people the account holds.
The fifty-first stakeholder wanting an answer becomes a budget conversation.
Dot's paid plans carry unlimited users and meter the analysis work itself.
Our decision intelligence software is best for a team that wants written findings and scheduled reviews produced on top of modeling work that already exists, with no migration and no new canvas for stakeholders to learn.
Dot pricing
Dot bills for the analysis work it performs, across one free tier and three paid ones:
- Free: $0, carrying 300 credits granted once and the full Pro feature set, enough for a proper evaluation on live questions.
- Pro: $180 a month with 150 credits included, then $1.80 for each credit past them, and no ceiling on user count.
- Team: $720 a month with 800 credits included, then $1.44 a credit, plus SSO, row-level security, embedding, migration help off your current BI tool, and dedicated support.
- Enterprise: priced on request, with no credit ceiling, volume rates, self-hosted deployment, audit logging, an SLA, and a named account manager.
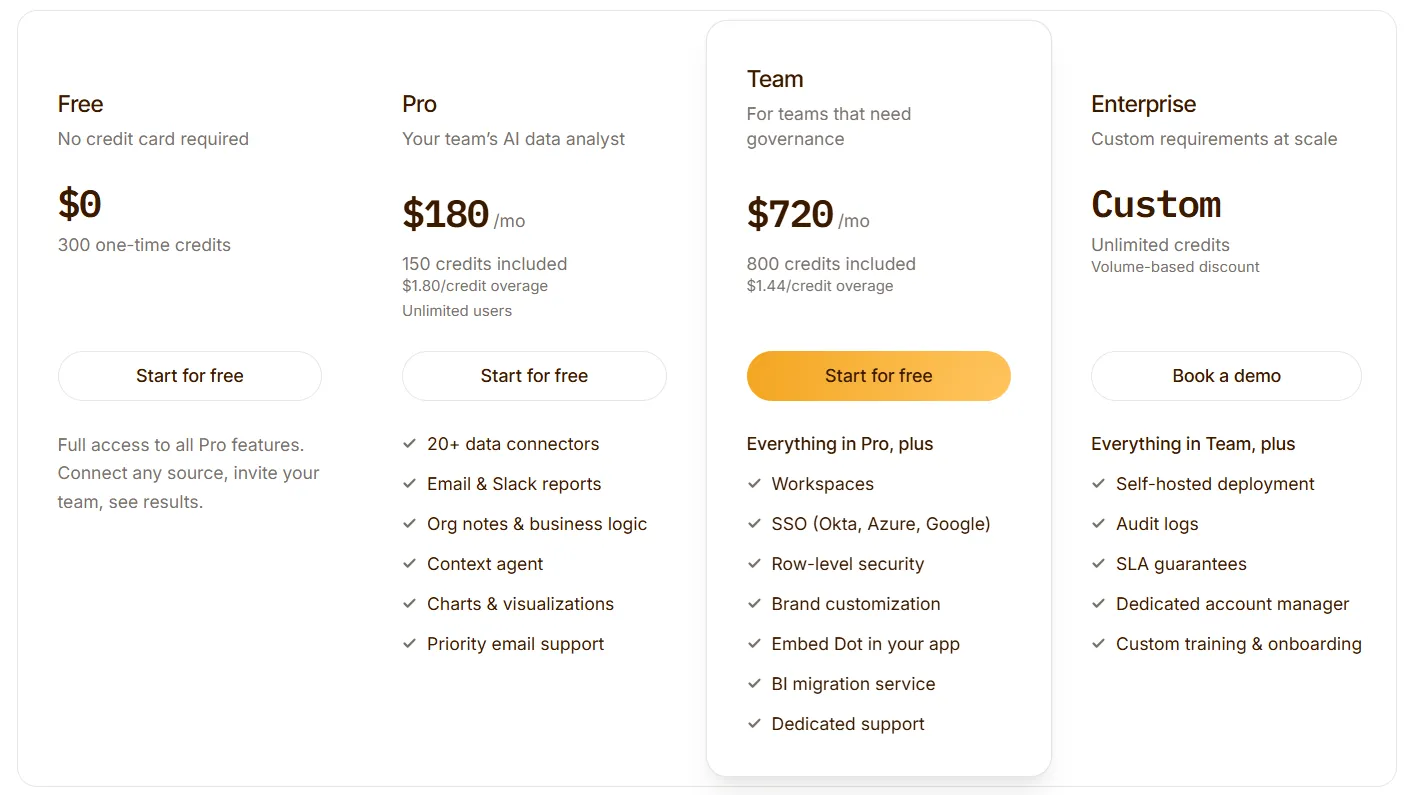
Credits get drawn down as Dot answers a question or writes a report.
The invoice therefore tracks how much analysis your company consumes and never how many people consume it.
Dot pros and cons
✅ Findings come back written out, with a recommendation attached, in the channel the question came from.
✅ Recurring business reviews get drafted from live data at whatever frequency you choose.
✅ Any figure can be traced through its query and dbt models to the source tables on a lineage map.
✅ Unlimited users on every paid plan, with SOC 2 Type II certification, GDPR compliance, and zero data retention across LLM providers.
❌ Credit billing means a heavy month needs watching, though weekly limits can be set per user or as a shared group pool.
❌ Dot works against connected data systems, and a team with no warehouse or database gets less out of it.
#2: ThoughtSpot
Best for: Analysts at larger companies who want stakeholders self-serving through search while the ad hoc queue shrinks.
Similar to: Tellius, Zenlytic.
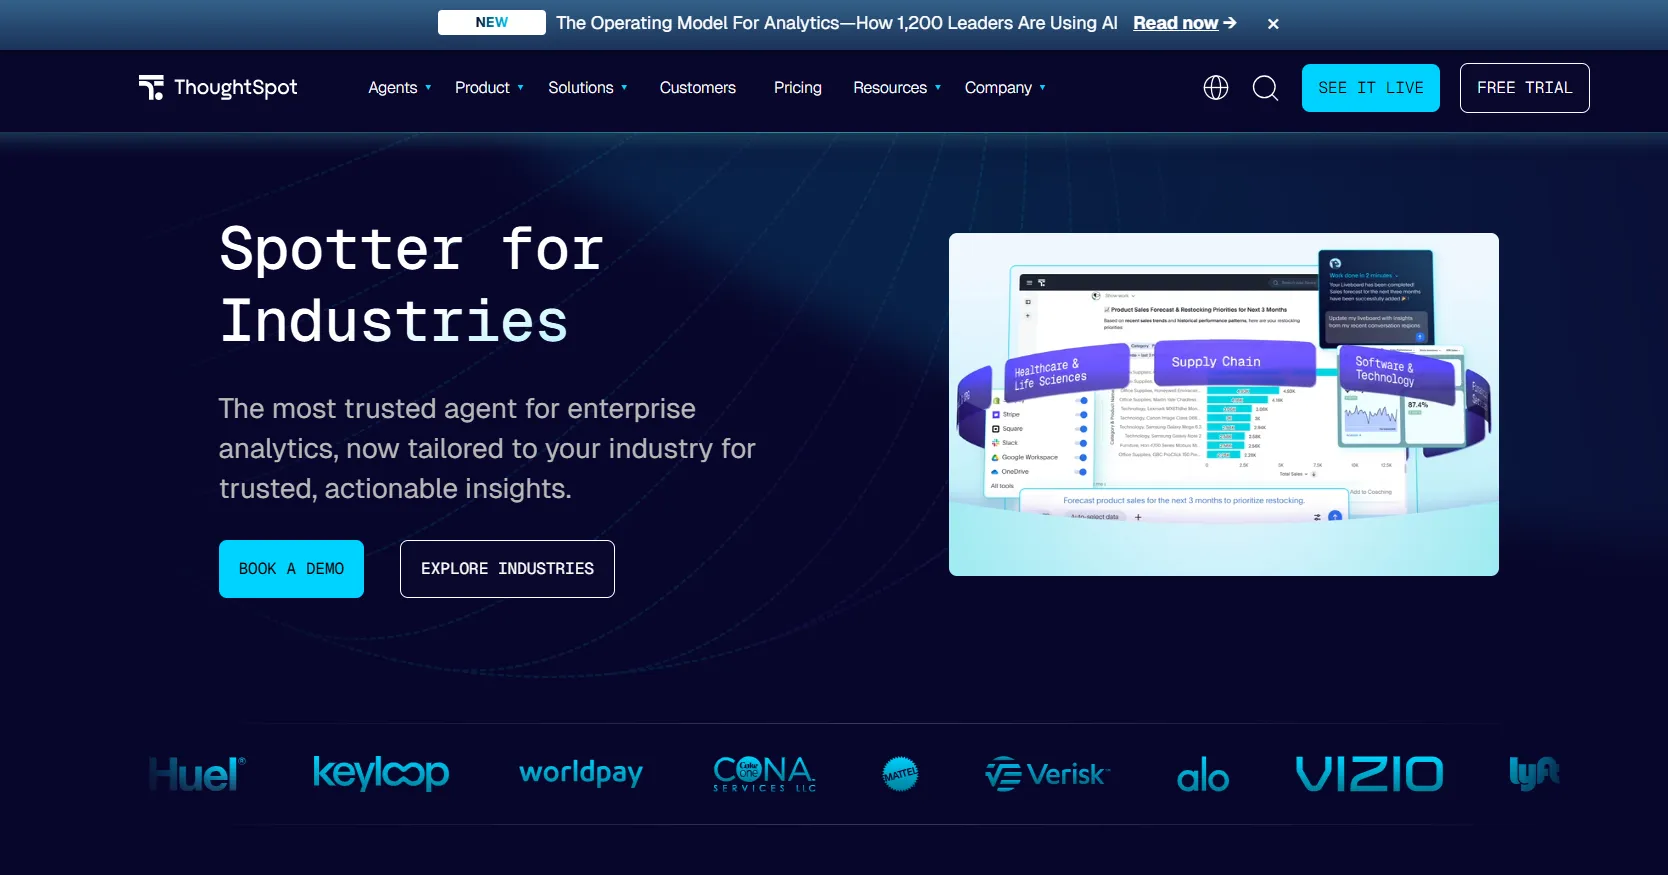
ThoughtSpot is an agentic analytics platform built around a search bar, where a typed question takes the place of an opened dashboard.
Spotter and a set of coordinated agents decide on the analysis and return a visualized result, with Analyst Studio held back for the SQL work agents should not touch.
ThoughtSpot's top features
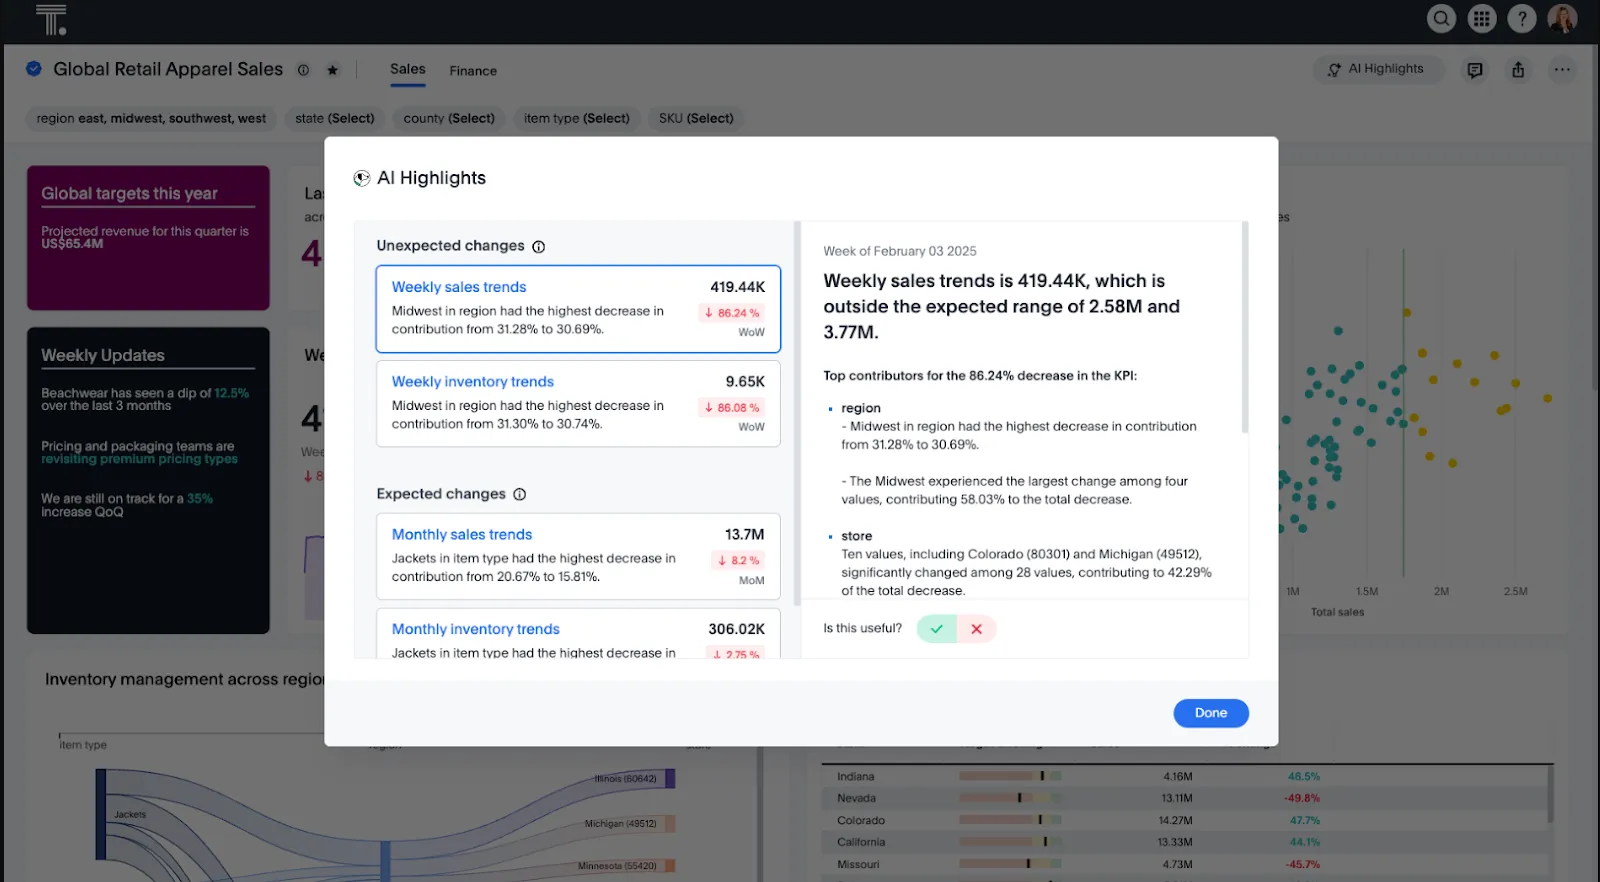
- Spotter: ThoughtSpot's agent reads a written question, picks and runs the analyses that answer it, then returns the charts alongside a list of follow-ups.
- Governed search: A stakeholder's typed question resolves against modeled data, with their own permissions applied before anything renders.
- SpotterViz: Datasets come back as styled dashboards, with layout and chart-type decisions taken off an analyst's desk.
- Analyst Studio: Analysts get a notebook-style workspace for SQL work and metric-logic prototyping, with results feeding back into the search layer.
ThoughtSpot pricing
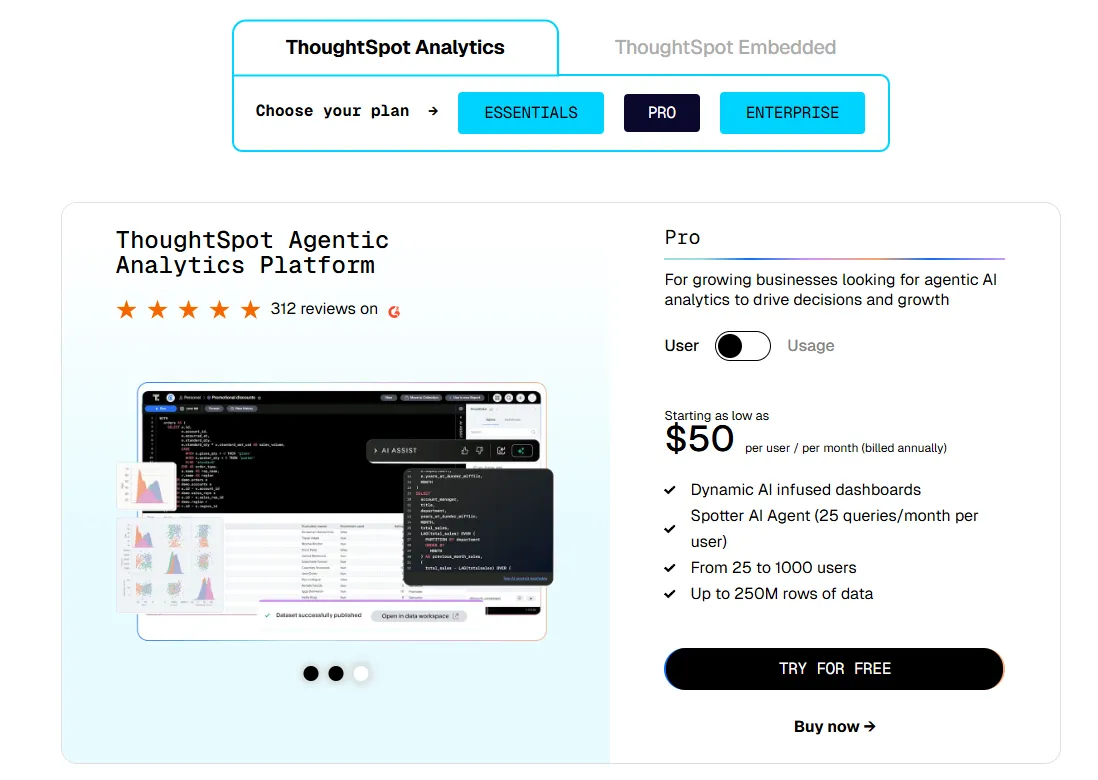
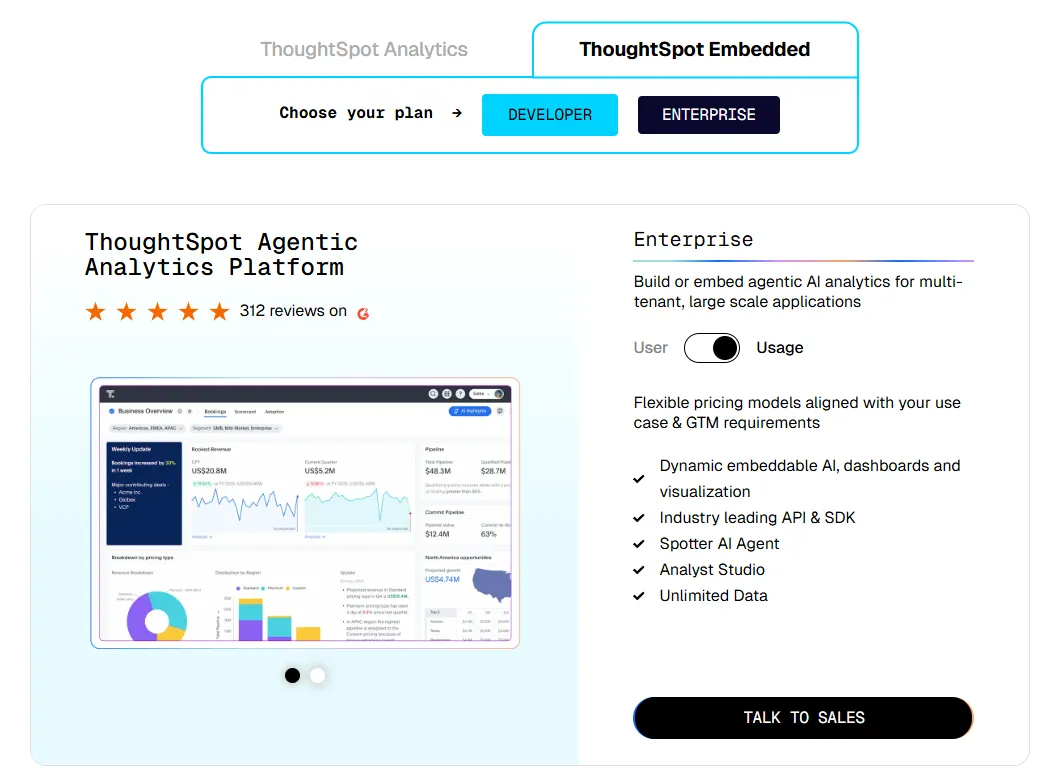
ThoughtSpot offers two separate products: ThoughtSpot Analytics for internal BI and ThoughtSpot Embedded for building analytics into applications - each with flexible pricing depending on scale and usage:
- ThoughtSpot Analytics:
- Essentials: From $25 per user per month (billed annually), for teams of 5-50 users, includes dynamic interactive dashboards and AI-powered insights and supports up to 25M rows of data.
- Pro (per user pricing): From $50 per user per month (billed annually), for 25–1,000 users, includes everything in Essentials, plus AI-infused dashboards and Spotter AI Agent (25 queries per user/month), and supports up to 250M rows of data.
- Pro (usage-based): From $0.10 per query, includes everything in Pro per user, and adds Analyst Studio.
- Enterprise (user or usage-based): Custom pricing, includes everything in Pro, plus unlimited users and data.
- ThoughtSpot Embedded:
- Developer: Free for 1 year, includes embeddable AI analytics, dashboards, and visualizations, APIs and SDKs, up to 10 users and 25M rows of data.
- Enterprise (user-based): Custom pricing, includes everything in Developer, plus unlimited data.
- Enterprise (usage-based): Custom pricing, everything in Enterprise, plus Spotter AI Agent and Analyst Studio.
ThoughtSpot pros and cons
✅ Stakeholders adopt search quickly, the fastest route to shrinking the ad hoc request queue an analyst carries.
✅ The built-in AI surfaces patterns and explanations faster than a dashboard-first workflow does.
❌ Two pricing structures (per user vs. usage-based) can get confusing at scale.
#3: Tellius
Best for: Business analysts whose job is explaining what changed across large enterprise datasets.
Similar to: ThoughtSpot, Domo.
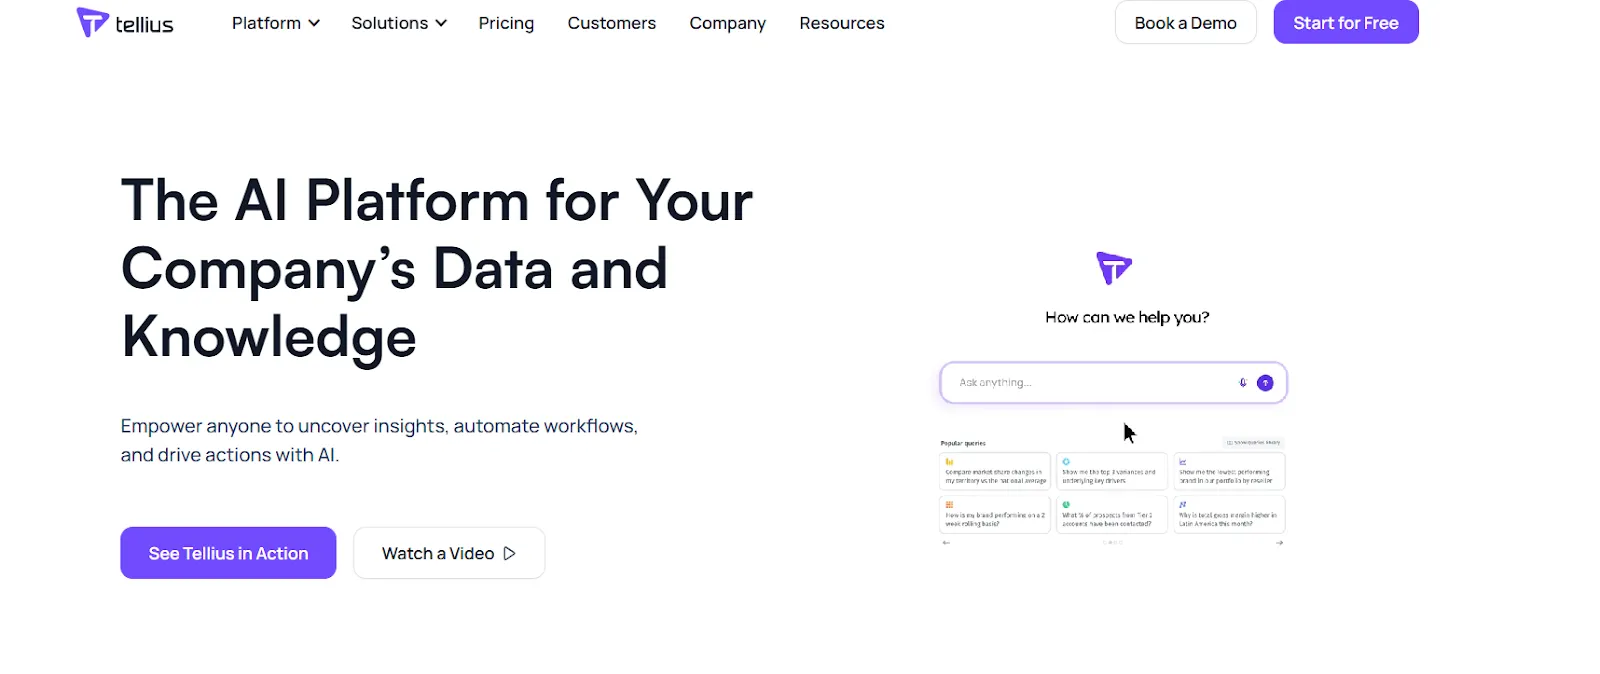
Kaiya is what Tellius calls its agentic layer, and the questions behind its design are the ones nobody answers in a single query.
Driver and root-cause analysis runs automatically across large datasets, after which Tellius writes the finding up as a narrative with the supporting visuals.
Tellius' top features
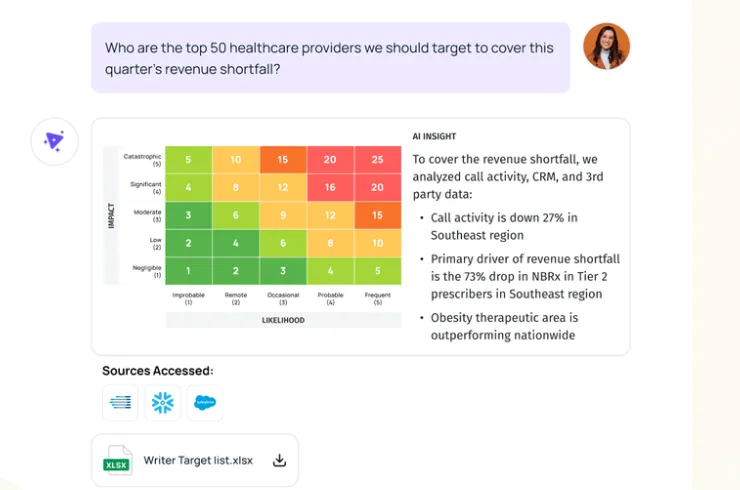
- Kaiya conversational AI: Questions about what happened, why it happened, and what to do next get answered in natural language over governed enterprise data.
- AI insights: Root causes, key drivers, cohorts, and anomalies surface automatically across billions of data points, with alerts raised unprompted.
- GenAI narratives: A finished analysis returns as written commentary with the visuals attached, close to review-ready.
- Agentic workflow configuration: Multi-step workflows assemble without code, letting an investigation fire on a trigger and land as a completed write-up.
Tellius pricing
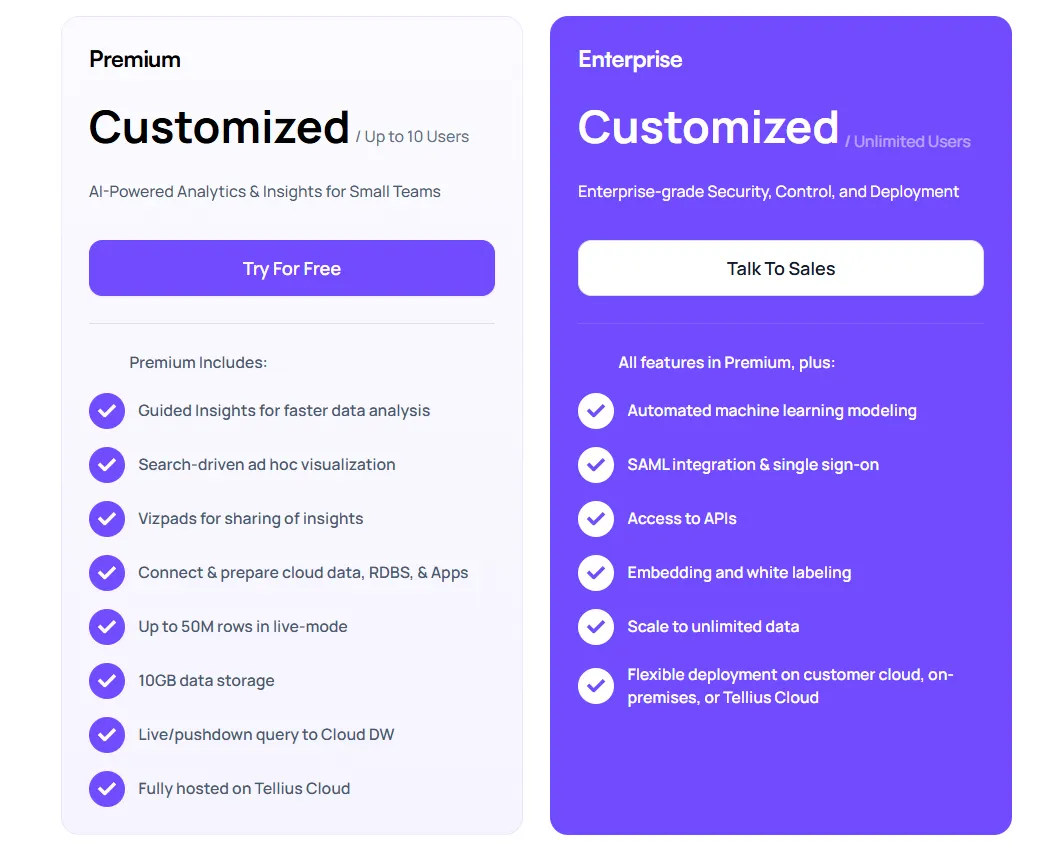
Tellius lists two plans on its pricing page and no figures against either.
Every number therefore comes out of a sales conversation.
- Premium: Kaiya conversational AI, GenAI narratives, AI agents, AI-assisted data preparation, and connectivity to cloud sources, flat files, and relational databases.
- Enterprise: everything above, with automated machine learning modeling, SAML single sign-on, APIs, white-labeled embedding, no data ceiling, and a choice of Tellius Cloud, your own cloud, or on-premises.
Tellius pros and cons
✅ Explaining a change is the core of the product, matching the request that lands on an analyst the morning after a metric moves.
✅ Deployment covers Tellius Cloud, customer-managed cloud, and on-premises for teams with data residency obligations.
#4: Zenlytic
Best for: Analysts who need every answer traceable to a definition they can defend in a meeting.
Similar to: ThoughtSpot, Sigma.
Since May 2026, Zenlytic has taken self-serve signups for teams of up to ten, a real change in who can try it without booking a call.
Zoë, its analyst agent, answers questions in natural language and shows the metrics and query beneath each figure, working off a semantic layer assembled from analytics work your team has done.
Zenlytic's top features
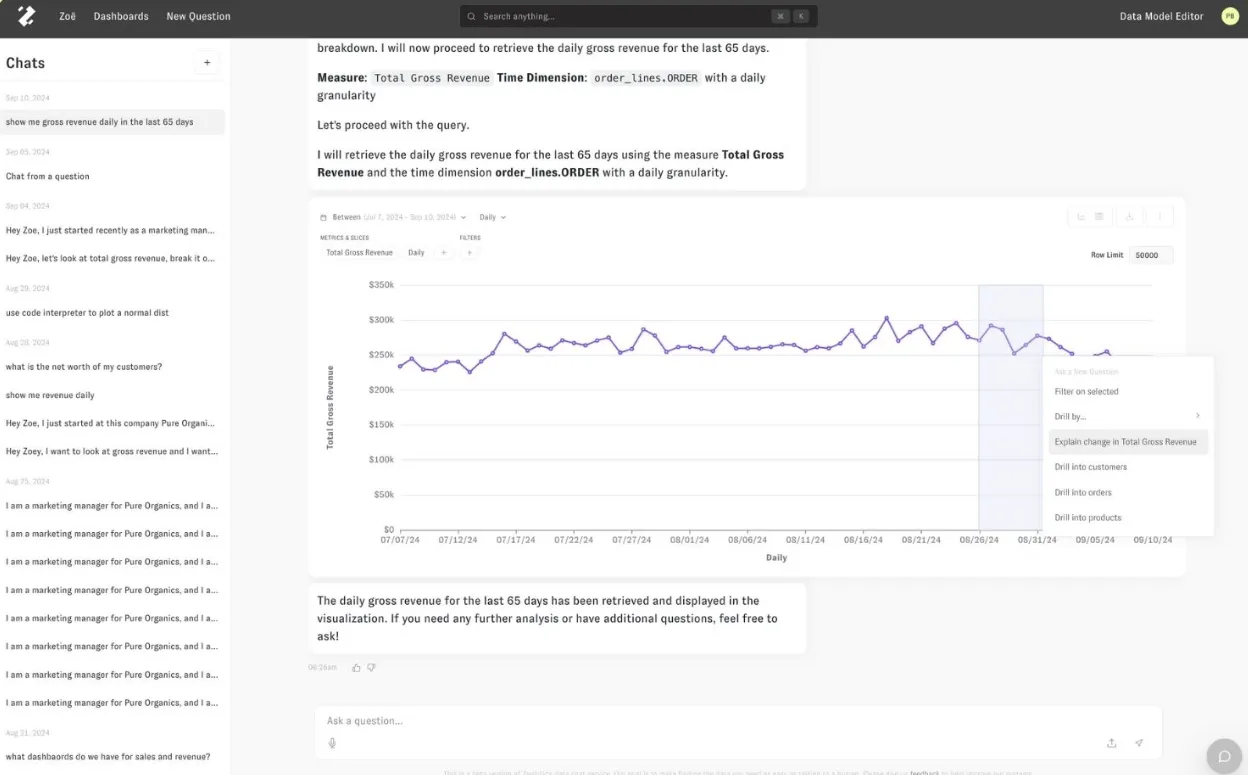
- Zoë Self-Learning: The agent onboards itself onto company data within minutes, with no YAML buildout or multi-month modeling project first.
- Patterns: An index of query history, dashboards, SQL, and dbt models gives Zoë business context from day one.
- Memories: Definitions and their assumptions lock in once, keeping the same question from quietly returning a different number next quarter.
- Artifacts: Presentations, data apps, and financial models stay wired to the warehouse and refresh on schedule.
Zenlytic pricing
Zenlytic keeps figures off its website.
Zenlytic pros and cons
✅ Traceability is the point of the product, with citations under each answer showing how the figure was calculated.
✅ Onboarding is short, since the agent maps the data and drafts the semantic layer without an analyst doing it by hand.
❌ No published figure exists past the self-serve tier, which is why some teams weigh upZenlytic alternatives before committing.
#5: Sigma
Best for: Analysts and finance partners who work in spreadsheets but need warehouse-scale data behind the formulas.
Similar to: Metabase, Domo.
For an analyst who thinks in spreadsheets, Sigma keeps the grid and changes what powers it.
Formulas and pivots compile into SQL and execute against live tables in Snowflake, BigQuery, Databricks, or Redshift, with AI features drafting workbook content from a written request.
Sigma's top features
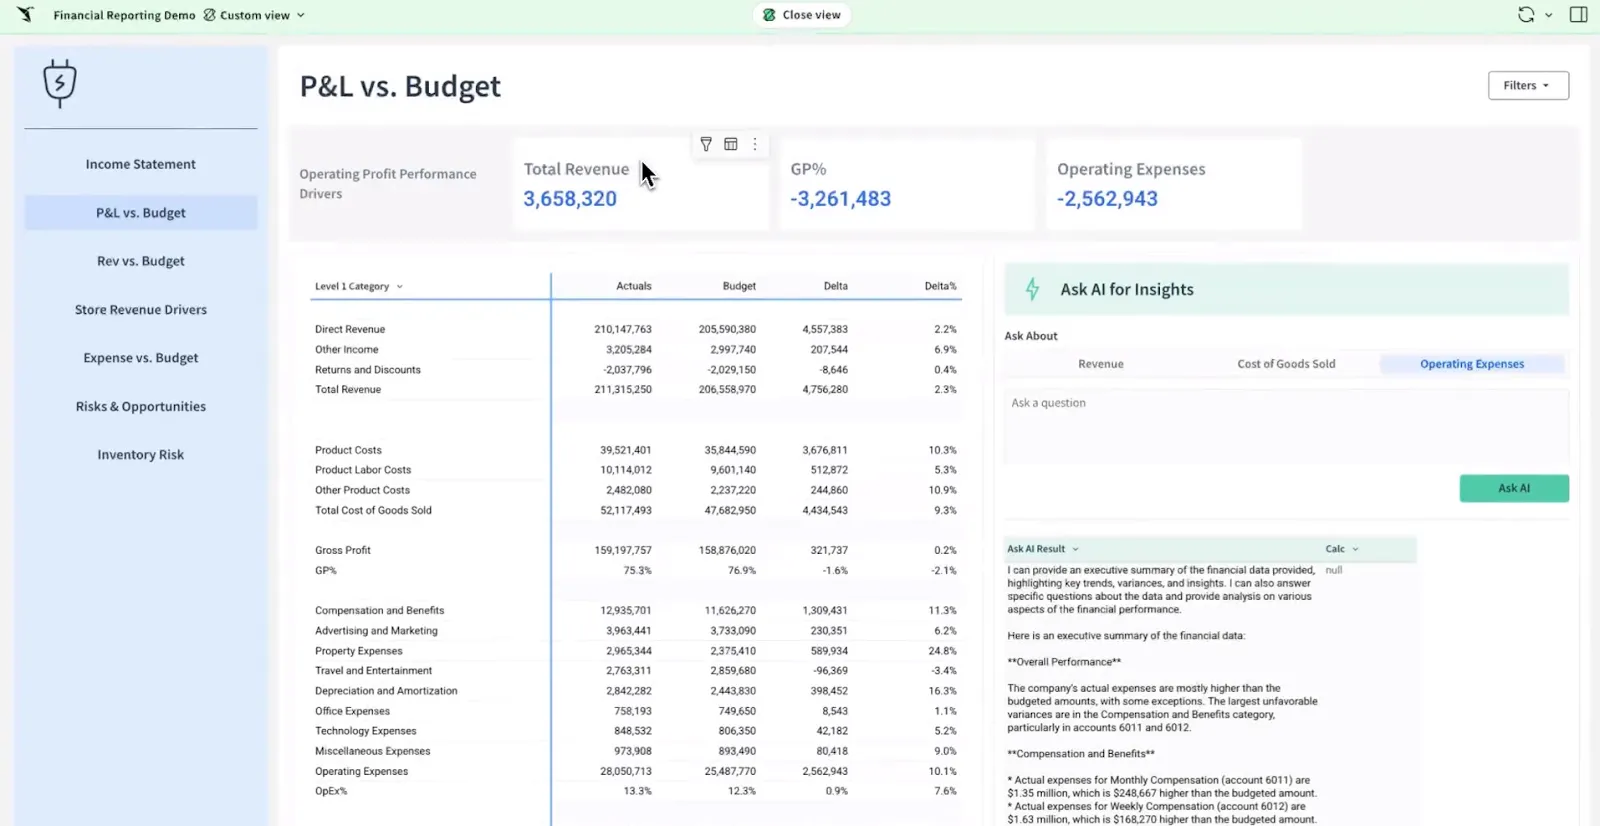
- Warehouse-native grid: Spreadsheet work compiles to SQL and executes on the warehouse, leaving nothing extracted and nothing stale between refreshes.
- Ask Sigma: A written description of what you want to see comes back as drafted workbook content, calculations and charts included.
- AI-built dashboards and reports: Natural language drives dashboard, report, and data-app creation on top of live warehouse tables.
- Operational AI apps: Working apps for a forecast, a budget cycle, headcount capacity, or pipeline review, none of them needing a developer.
Sigma pricing
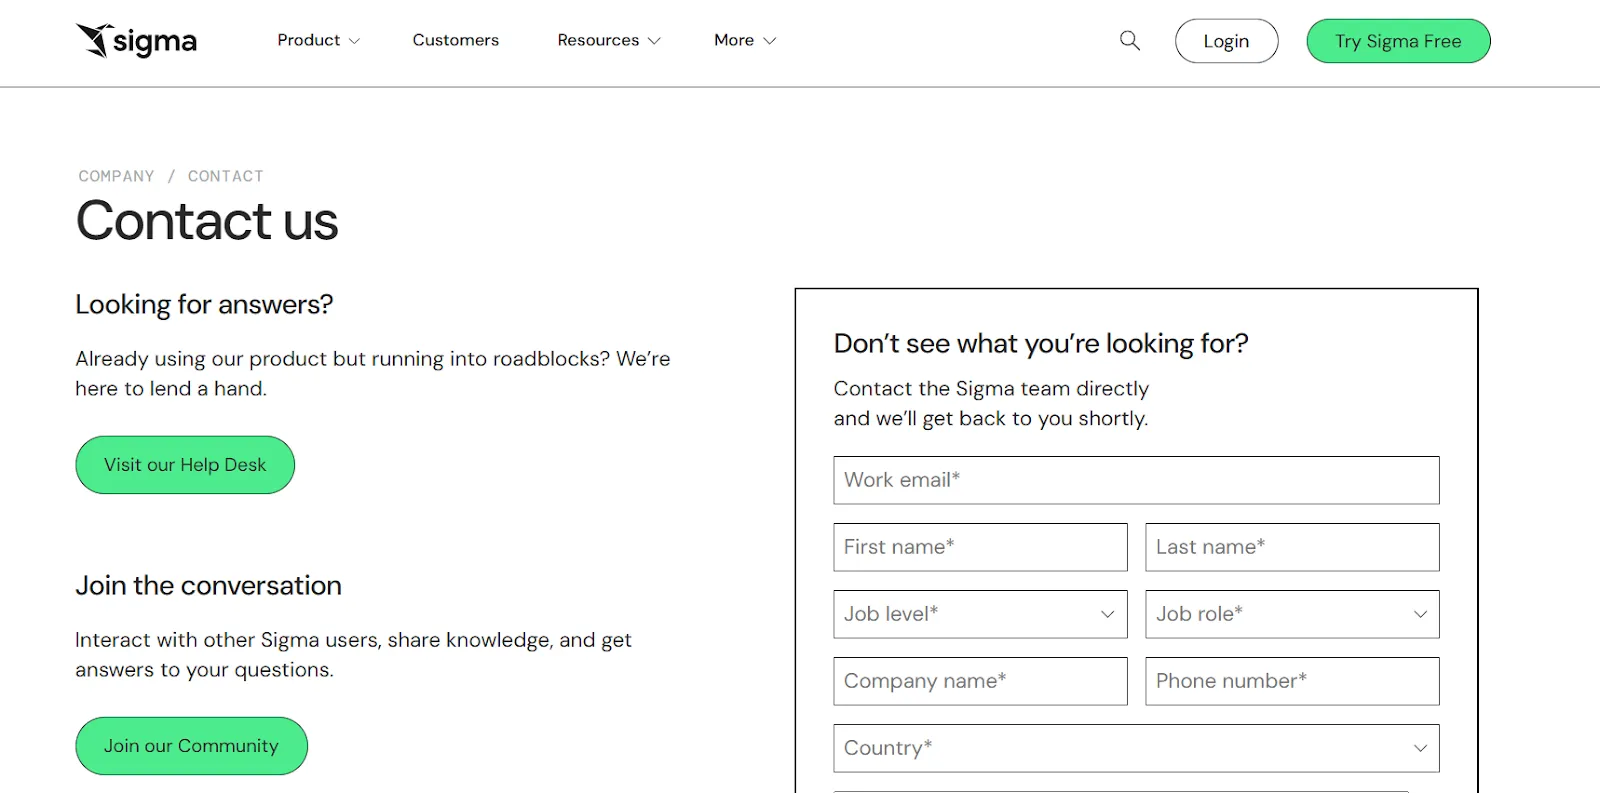
Sigma publishes no prices. Every figure comes out of a scoping call.
Sigma pros and cons
✅ Every interaction hits the warehouse live, so a stakeholder never reads a figure from last night's extract.
✅ Finance and operations partners pick the grid up unaided, which shortens the handoff from analyst to business owner.
#6: Zoho Analytics
Best for: Small and mid-sized teams who want published pricing and AI without a separate contract.
Similar to: Metabase, Microsoft Power BI.
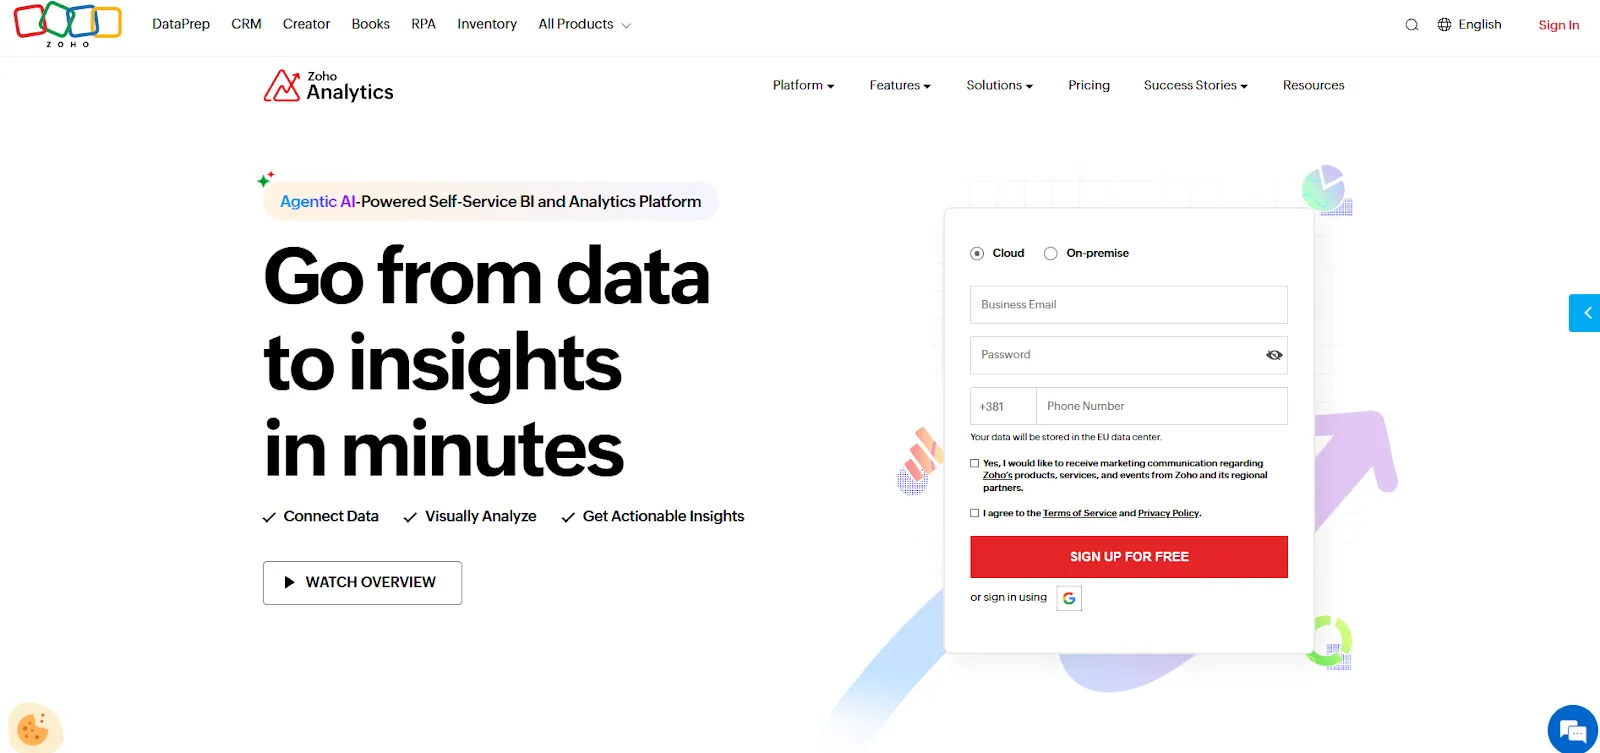
Priced from $30 a month for two users, Zoho Analytics carries the lowest published monthly floor on this list, with an AI assistant included in the plan.
Ask Zia takes questions in natural language and returns driver analysis on what moved a data point, building the reports and dashboards along the way.
Connectivity is the other draw, covering Zoho's own apps, mainstream third-party tools, databases, and warehouses.
Zoho Analytics' top features
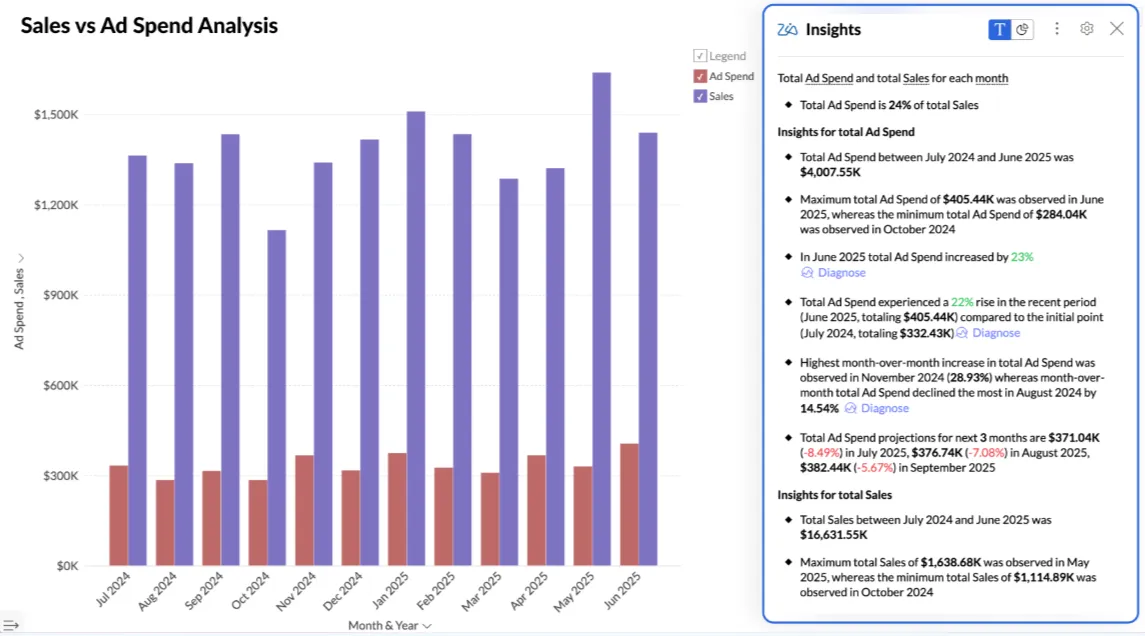
- Ask Zia AI agent: One conversational agent covers analysis, report and dashboard creation, insight generation, and recommended actions.
- Diagnostic insights: The drivers behind a particular data point or trend get identified, the analysis stakeholders want the moment a number changes.
- Data preparation: Cleansing, transformation, enrichment, and modeling run inside the same product, across more than 250 no-code transformations.
- More than 50 visualization types: Charts, themed pivots, summary views, and KPI widgets for the reporting half of the role.
Zoho Analytics pricing
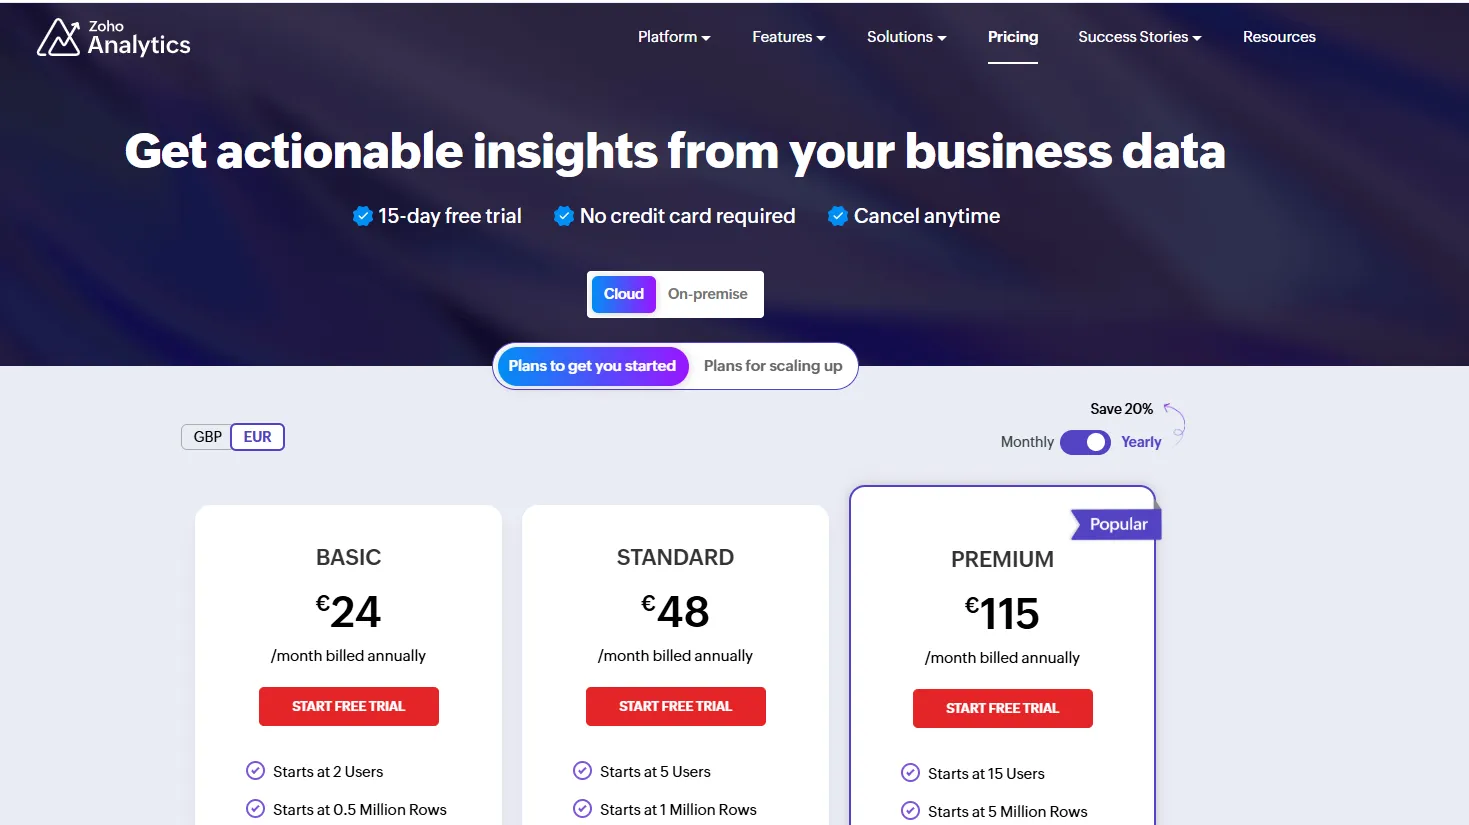
Zoho Analytics runs a permanent free plan and four paid cloud tiers, each priced per account with a set number of users included, and a trial on the paid tiers.
- Free: 2 users, 10,000 rows, 5 workspaces, and unlimited reports and dashboards.
- Basic: $30 a month for 2 users and 500,000 rows.
- Standard: $60 a month buys 5 users, 1 million rows, unlimited workspaces, and the basic AI features.
- Premium: $145 a month for 15 users and 5 million rows, where the LLM-powered Ask Zia agent arrives alongside diagnostic insights and smart recommendations.
- Enterprise: $575 a month at 50 users and 50 million rows, adding advanced governance, activity logs, and AI Studio.
Zoho Analytics pros and cons
✅ Published prices and a permanent free plan let you budget the whole thing before committing to anything.
✅ Connectors into Zoho apps and mainstream SaaS tools cut the setup work when reporting on operational systems.
❌ The user interface is not top-notch, according to a G2 review.
#7: Metabase
Best for: Analysts at startups and product teams who need dashboards and SQL access running inside a week.
Similar to: Zoho Analytics, Sigma.
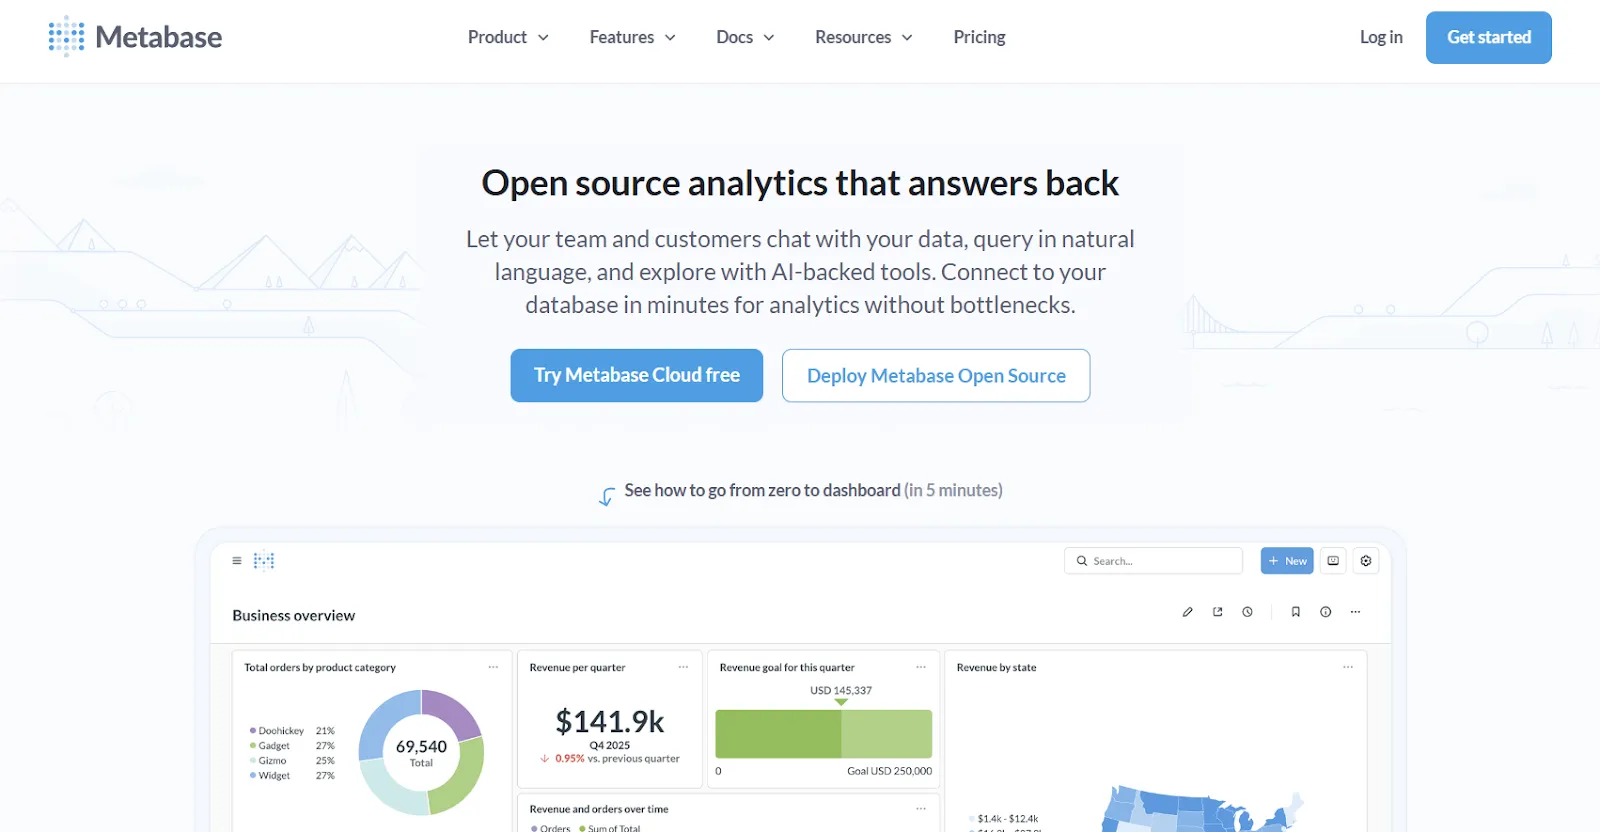
Metabase began as open-source BI and still ships that way, the reason so many analysts meet it before anything else.
A guided question builder covers the self-serve half while a SQL editor covers everything harder, and Metabot, the AI assistant, turns a written request into a query and a chart.
Metabase's top features
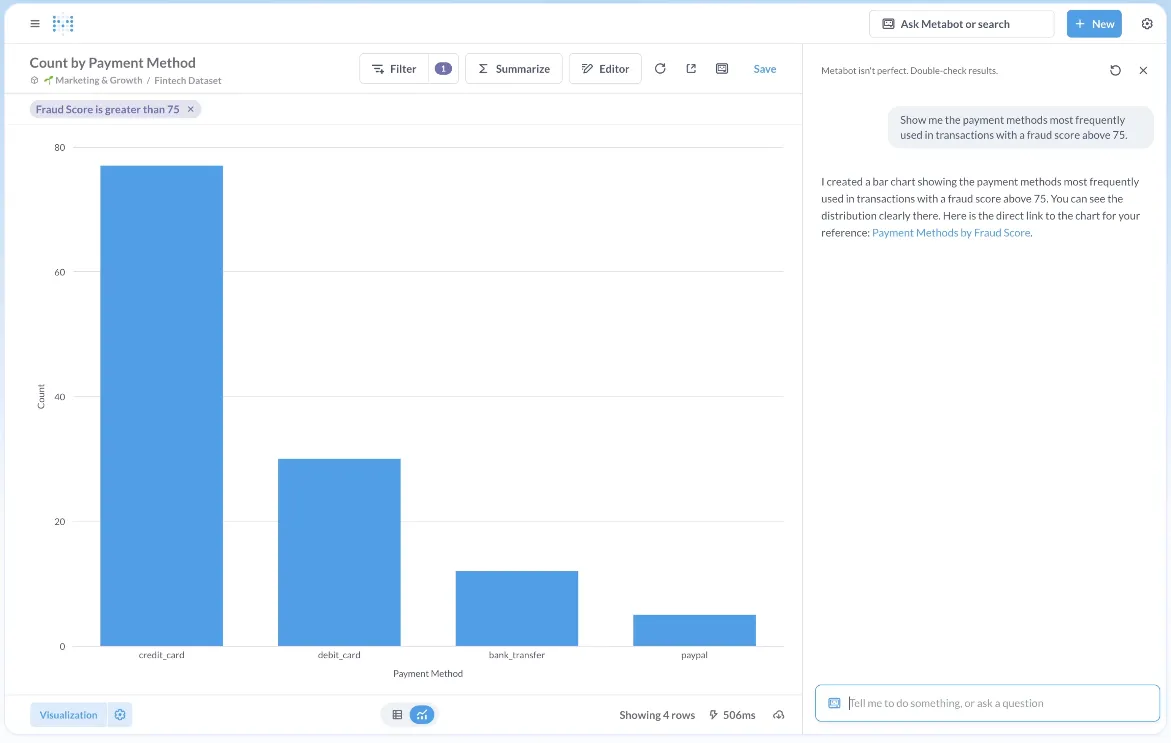
- Question builder: Stakeholders assemble filters, joins, summaries, and breakouts through guided steps, with analysts dropping into SQL for requests those steps cannot reach.
- Metabot: Written requests return SQL plus a visual, offered as an extra-cost option on Cloud plans.
- Click-to-explore: Any chart can be filtered or opened to the underlying rows, cutting down on repeat requests.
- Embedded analytics: Modular embedding, an SDK, or full-app embedding, with row and column security per tenant on the Pro tier.
Metabase pricing
Metabase offers two pricing options depending on how you use the product: internal business intelligence or customer-facing embedded analytics.
- Business Intelligence:
- Open Source (Self-hosted): Free, self-hosted deployment, includes unlimited queries, charts, and dashboards, connects to all supported data sources, basic embedding with “Powered by Metabase” branding, community support only.
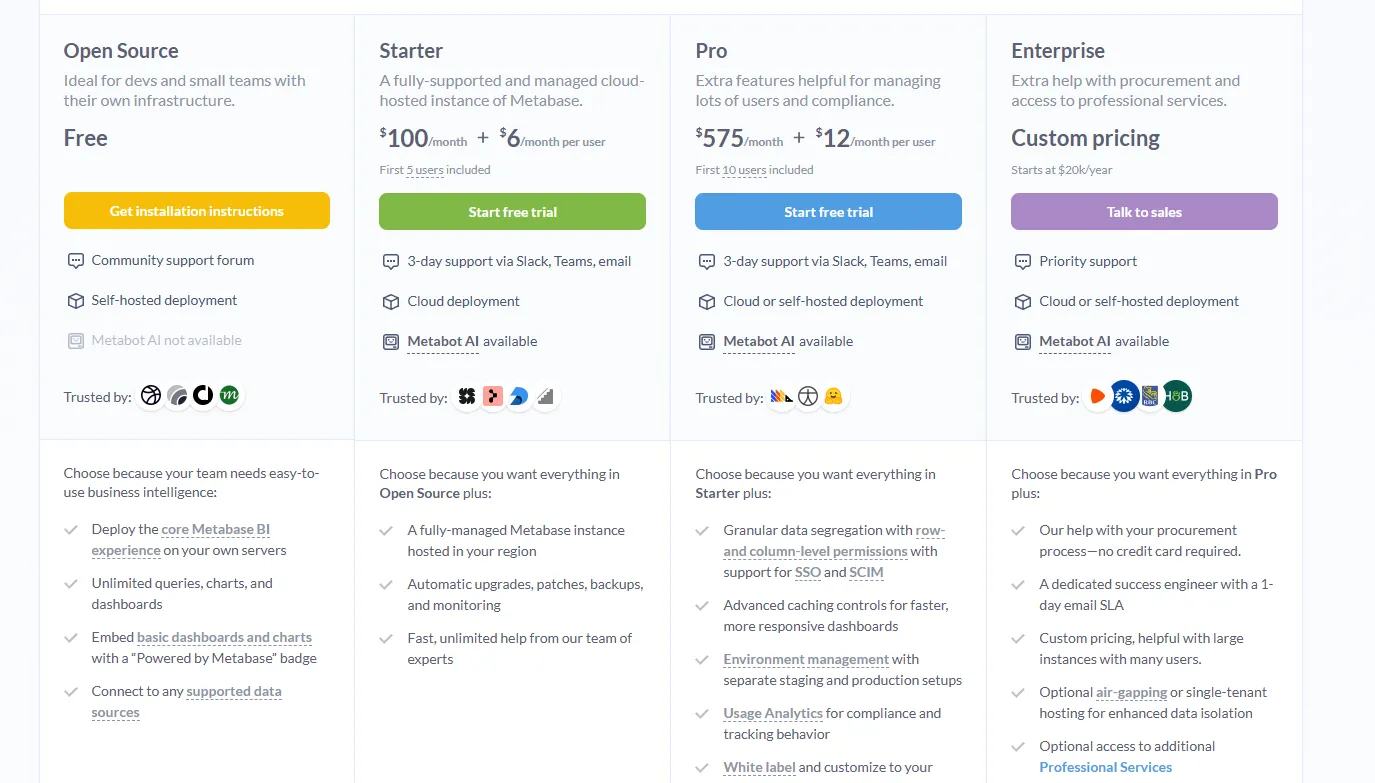
- Starter (Cloud-hosted): $100/month + $6/user/month, first 5 users included, includes everything in Open Source, plus option to include Metabot AI (charged extra), automatic upgrades, backups, and monitoring, support via Slack, Teams, and email (3-day SLA).
- Pro: $575/month + $12/user/month, first 10 users included, cloud or self-hosted deployment, includes everything in Starter, plus row- and column-level permissions, SSO and SCIM support, advanced caching and performance controls, staging + production environments, usage analytics and audit visibility, white-labeling, and embedded analytics capabilities.
- Enterprise: Custom pricing (starts at $20k/year), includes everything in Pro, plus priority support, dedicated success engineer (1-day email SLA), optional single-tenant or air-gapped deployment, and optional professional services.
- Embedded Analytics pricing:
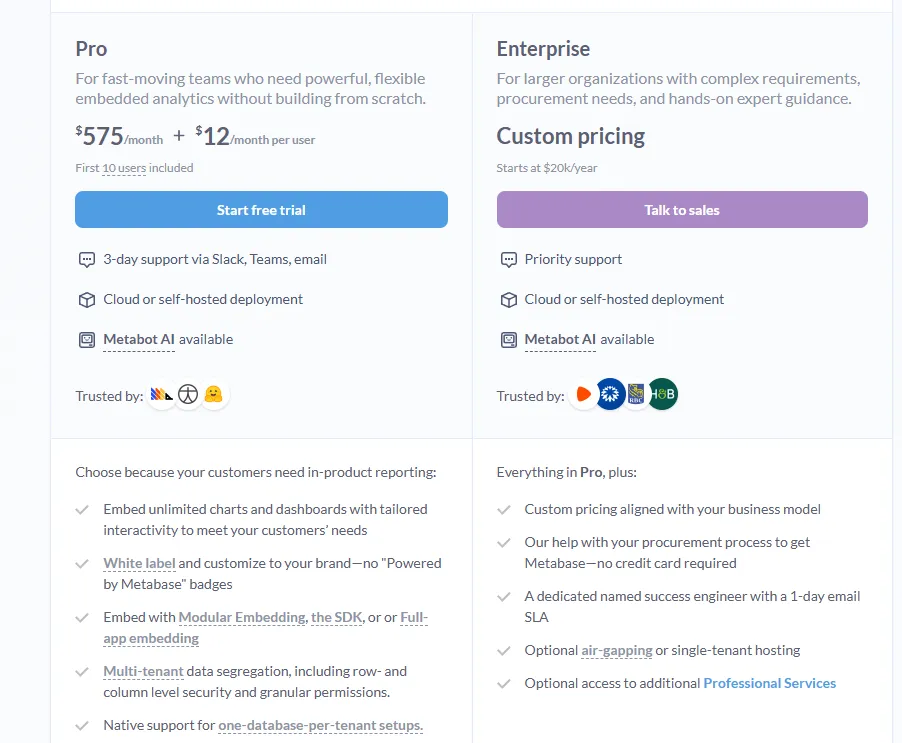
- Pro: $575/month + $12/user/month, first 10 users included, includes unlimited embedded dashboards and charts, full white-labeling, modular embedding, SDK, or full-app embedding, multi-tenant security (row- and column-level), one-database-per-tenant support, staging + production environments, usage analytics, internal BI for your team, and option to include Metabot AI (charged extra).
- Enterprise: Custom pricing (starts at $20k/year), includes everything in Pro, plus a dedicated success engineer, priority support, optional single-tenant or air-gapped hosting, and optional professional services.
Metabase pros and cons
✅ Self-hosting carries no license fee at all, and a small team can begin on infrastructure it already pays for.
✅ A first dashboard on a common database can be live the same afternoon someone installs it.
❌ A user on G2 believes that Metabase could benefit from having an AI assistant that understands the databases and assists in building queries
#8: Microsoft Power BI
Best for: Analysts inside Microsoft 365 organizations who report to a wide internal audience.
Similar to: Tableau, Zoho Analytics.
Most large organizations hold Power BI licenses through Microsoft 365, and that settles the shortlist before an evaluation begins.
Modeling, interactive reports, paginated reports, and enterprise governance arrive in the box, while Copilot drafts summaries and sketches forecasts from inside a report, flagging anomalies as it goes.
Power BI's top features
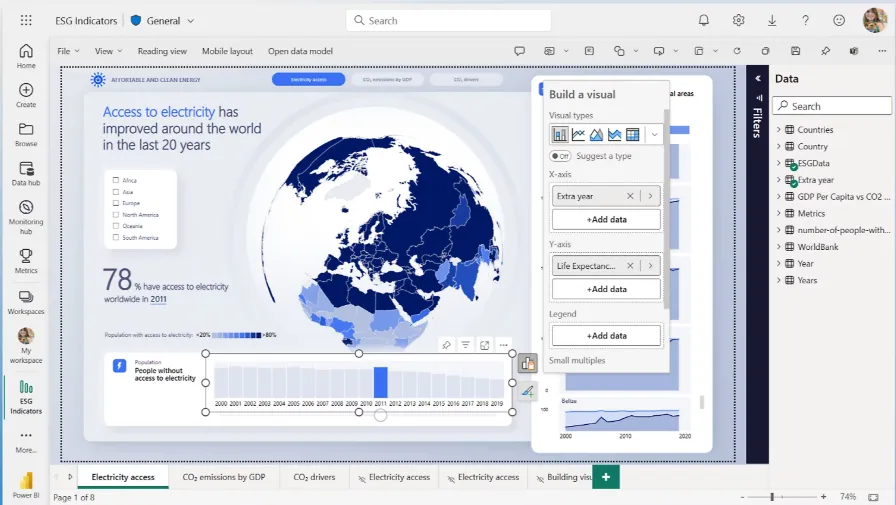
- Report authoring with drill-through: Reports modeled in Power BI Desktop publish with filters, bookmarks, and drill-through, letting stakeholders chase their own follow-ups.
- Copilot: A request for a report summary or an explanation of an outlier gets drafted without anyone leaving the report.
- Paginated reports: Pixel-accurate operational reporting for the print-and-file requirements finance and compliance teams carry.
- Entra ID governance: Row-level security and sensitivity labels get administered through the identity system IT runs, access policies included.
Power BI pricing
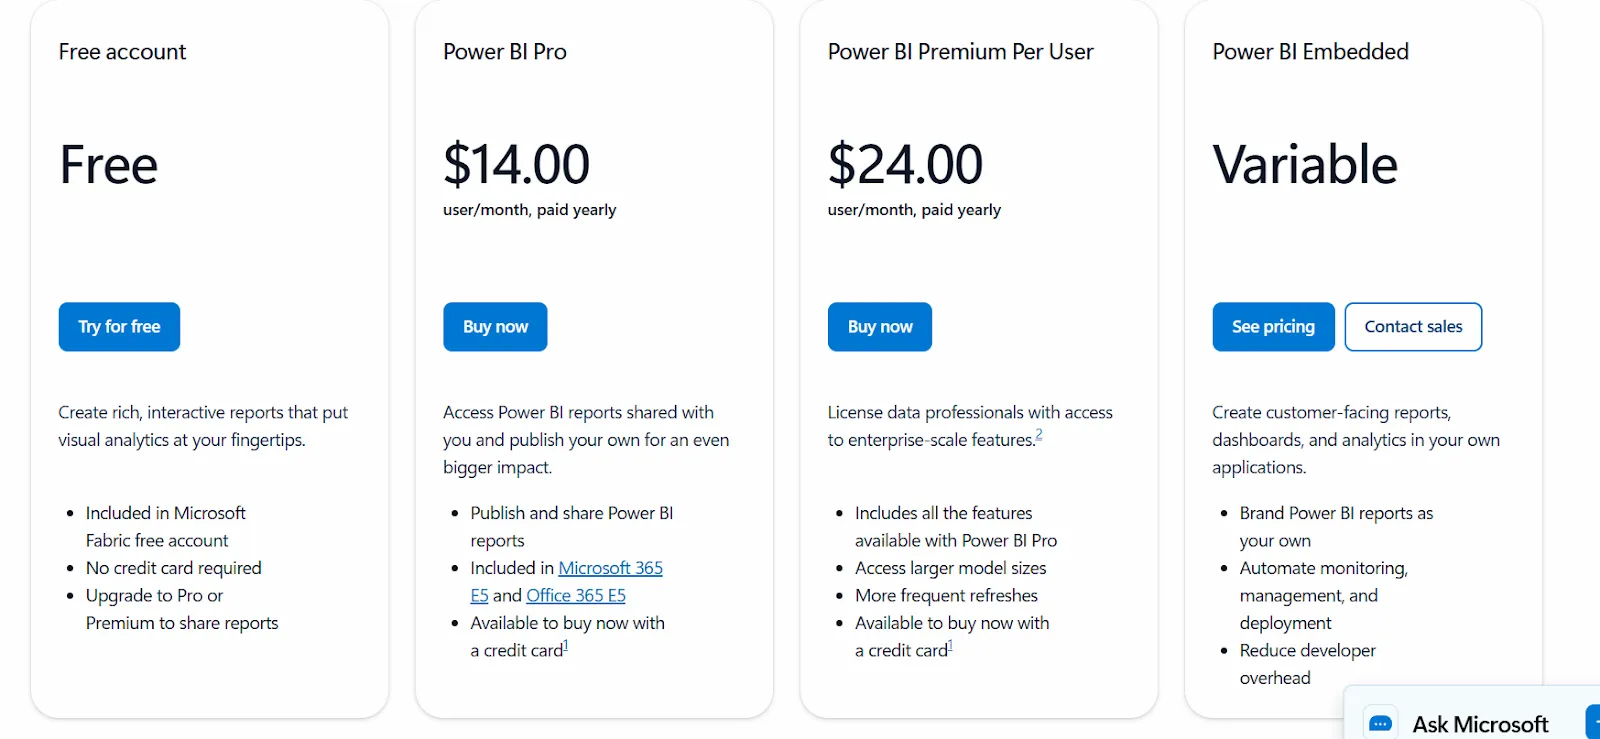
A per-user and capacity-based model:
- Free: Personal reports and dashboards, no sharing.
- Power BI Pro: $14/user/month, includes publishing, sharing, scheduled refresh, and Teams or SharePoint embedding.
- Power BI Premium Per User: $24/user/month, adds larger model sizes, more daily refreshes, paginated reports, and AI features.
- Power BI Embedded: Custom pricing for customer-facing analytics inside applications.
Power BI pros and cons
✅ Getting a report in front of a wide internal audience costs less per seat than almost anything else here.
✅ For a company standardized on Microsoft, the Excel and Teams connections are difficult to argue with.
❌ Each viewer needs a paid license unless the workspace is on Fabric capacity, a calculation we work through in ourPower BI pricing guide.
#9: Tableau
Best for: Analysts whose deliverable is a visual story stakeholders explore for themselves.
Similar to: Microsoft Power BI, Domo.
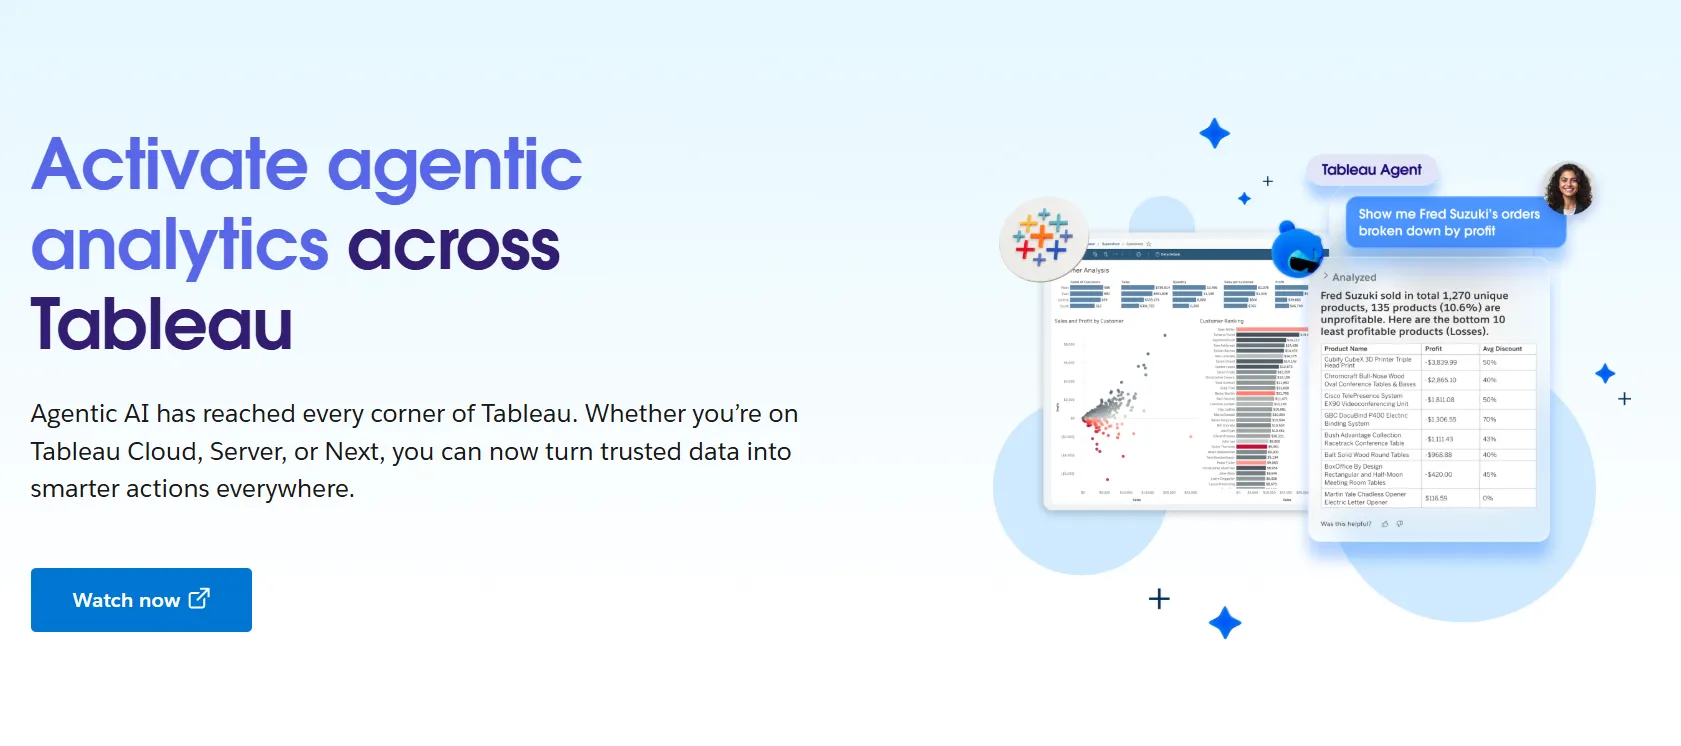
Visual analysis is what Tableau built its name on, and it still sets what stakeholders expect a dashboard to look and feel like.
Tableau Next is the agentic chapter, putting natural-language questions and Agentforce-driven agents over authoring analysts know, while Tableau Pulse carries agreed metric definitions across a wide rollout.
Tableau's top features
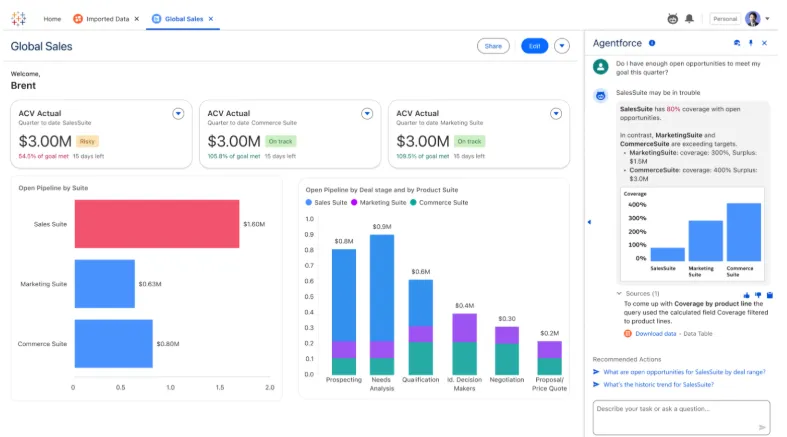
- VizQL authoring: Fields dragged onto a canvas generate the query behind the visual, letting an analyst iterate on a chart while a stakeholder watches.
- Tableau Next and Tableau Agent: Agentforce-powered agents field natural-language questions and surface findings unprompted, reachable from Slack and Salesforce.
- Tableau Pulse: Metric definitions and digests reach stakeholders directly, starting a follow-up conversation from an agreed figure.
- Data Management: Cataloging, lineage, reusable metric definitions, and governance controls for holding a large deployment together.
Tableau pricing
Tableau prices per user each month on annual billing, split by role, and every deployment needs at least one Creator license.
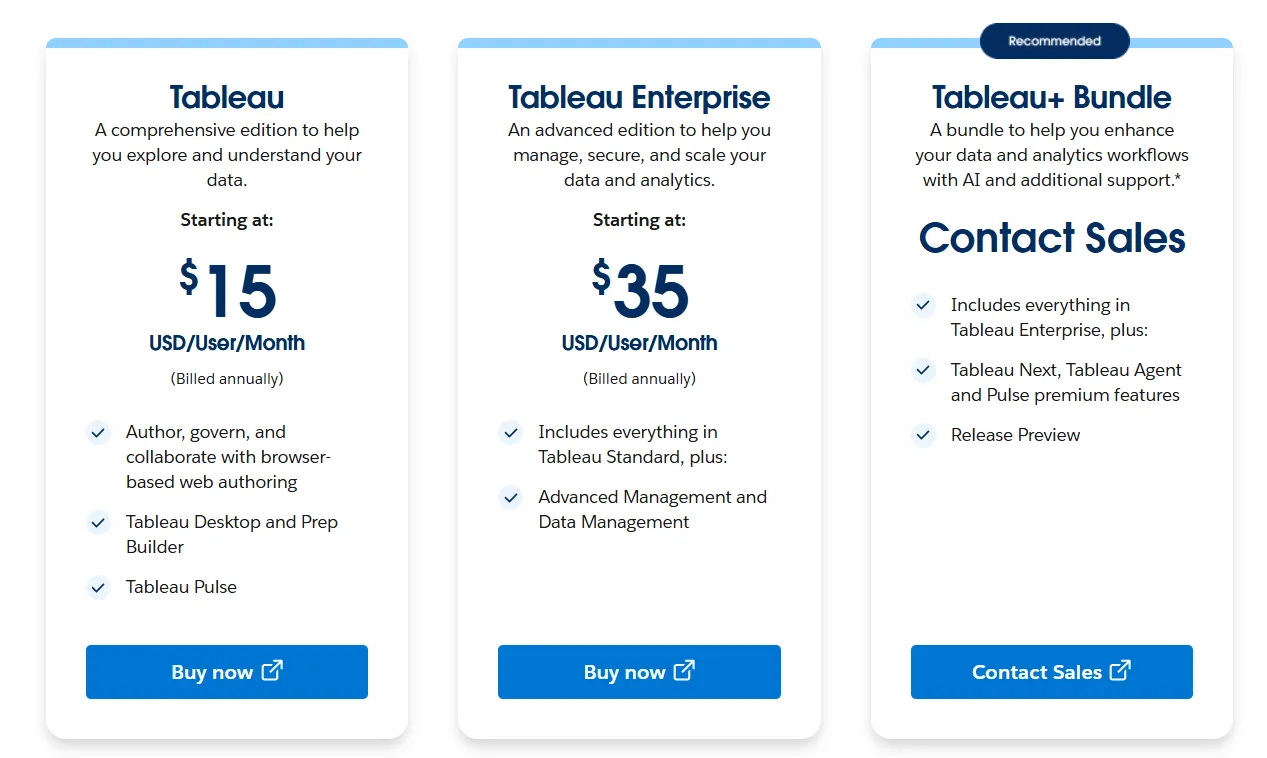
- Tableau Cloud has three pricing plans:
- Tableau Standard: Starts at $15/user/month, which includes browser-based authoring and collaboration, Tableau Desktop and Prep Builder, Tableau Pulse for metrics and insights.
- Tableau Enterprise: Starts at $35/user/month and includes everything in Standard, plus Advanced Management and Data Management for governance and scale.
- Tableau+ Bundle (Cloud + AI): Custom pricing, includes everything in Tableau Enterprise, plus Tableau Next, Tableau Agent, and Pulse premium features, with access to release previews and early AI capabilities.
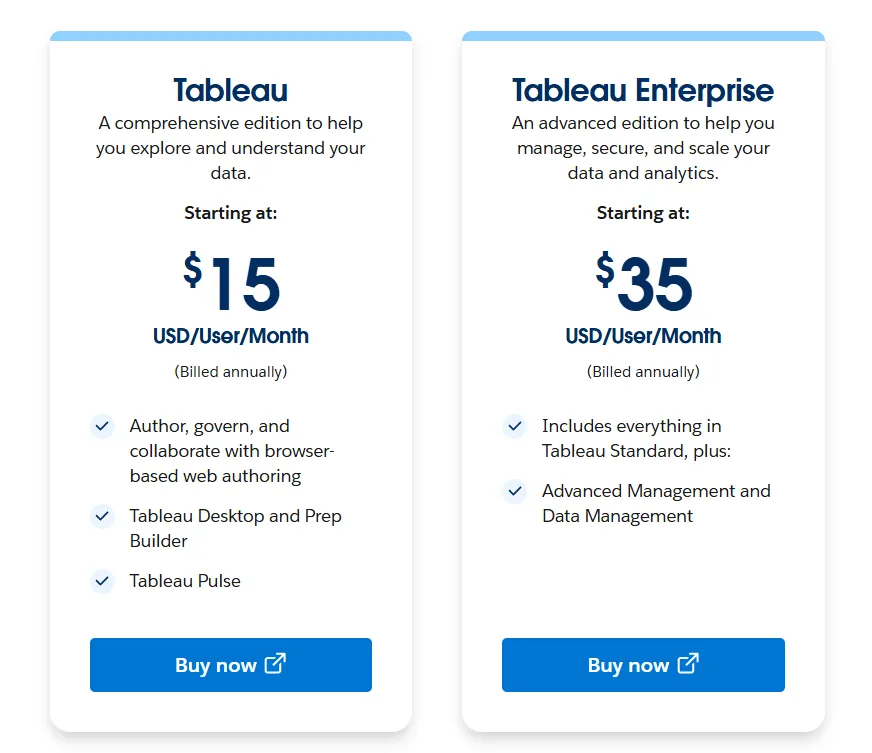
- Tableau Server has two pricing plans:
- Tableau Standard: Starts from $15 per user/month, which includes authoring, governance, and collaboration and Tableau Desktop and Prep Builder.
- Tableau Enterprise: Starts from $35 per user/month, which includes everything in Standard, plus Advanced Management, Data Management, and eLearning.
- Tableau Next (agentic analytics) has 2 plans:
- Tableau Next: Starts from $40/month/seat, and includes Agentforce Tableau, Tableau Semantics, and its Native Slack integration.
- Tableau + Bundle: Custom pricing, which includes everything in Tableau Enterprise, plus Tableau Next, Tableau Agent and Pulse premium features.
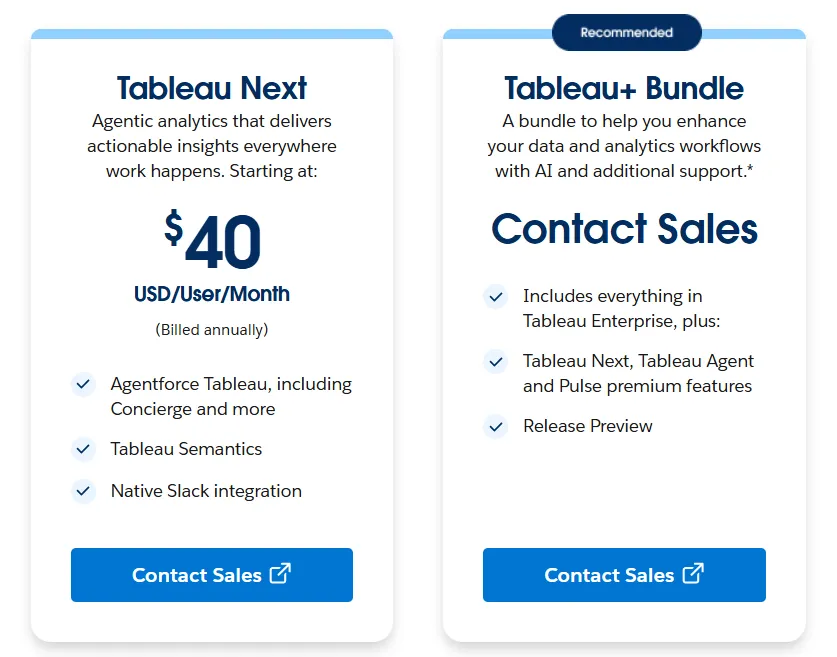
Tableau pros and cons
✅ On visual depth and stakeholder-facing storytelling, very little in the category goes further.
✅ The installed base is enormous, and training, certification routes, and community answers exist for nearly any task.
❌ Per-user pricing can scale fast for organizations rolling out broadly.
#10: Domo
Best for: Analysts who own the pipelines as well as the reporting from a single seat.
Similar to: Microsoft Power BI, Tellius.
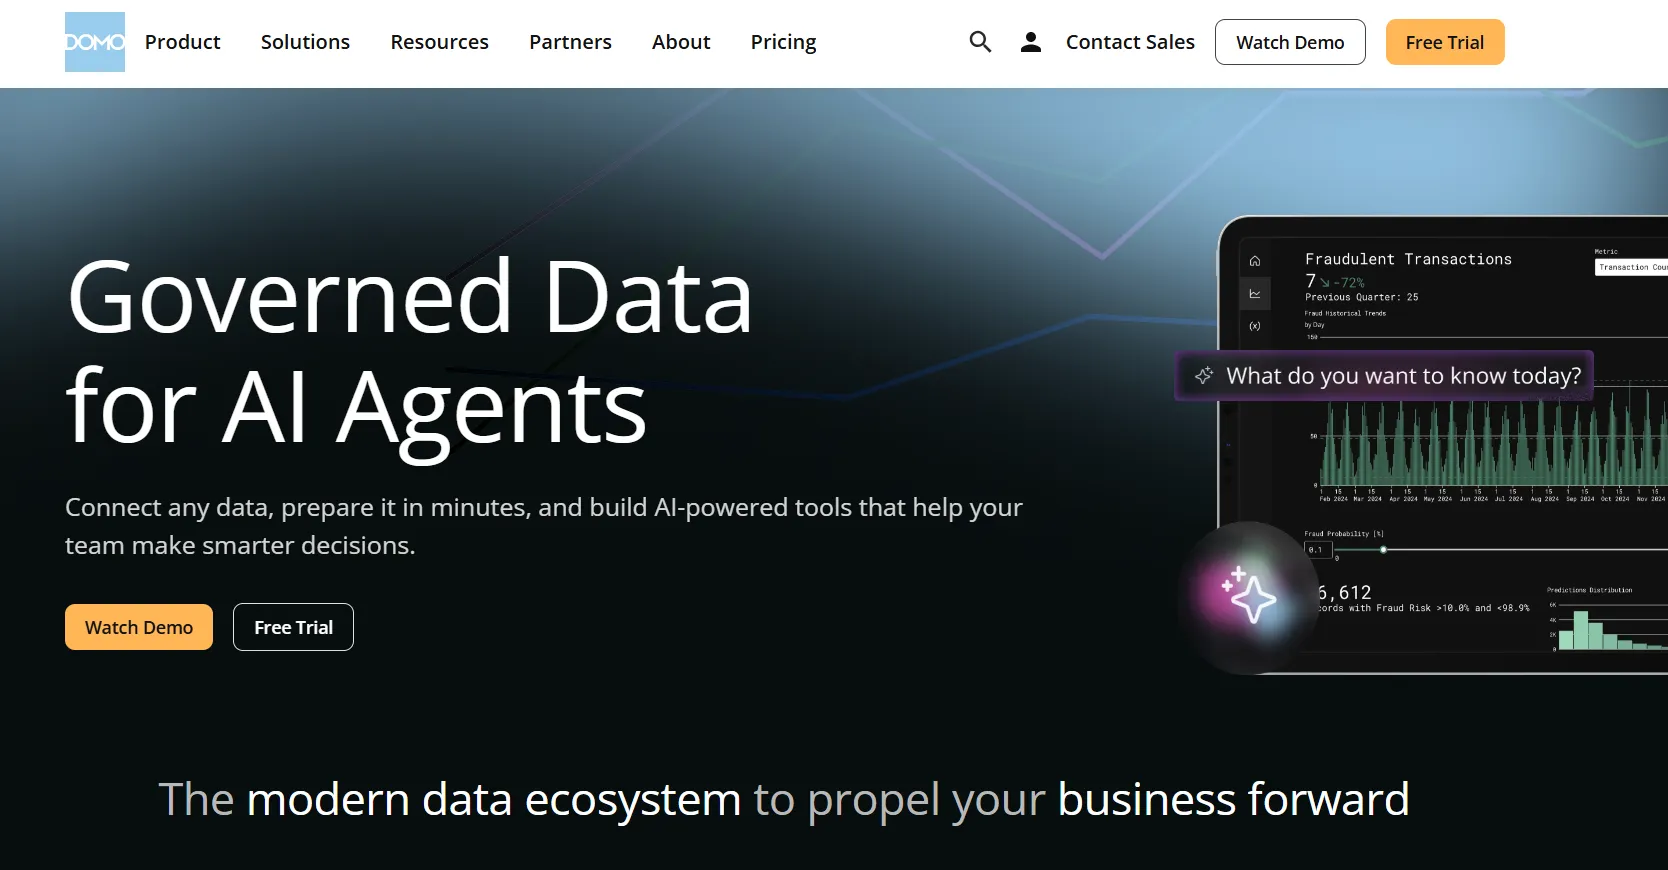
Domo carries the work end to end, from the source connection through transformation to the dashboard and the agent watching it.
For an analyst who owns pipelines as well as reporting, that breadth removes a handoff, and Domo's AI layer answers questions in natural language while putting agents on individual metrics.
Domo's top features
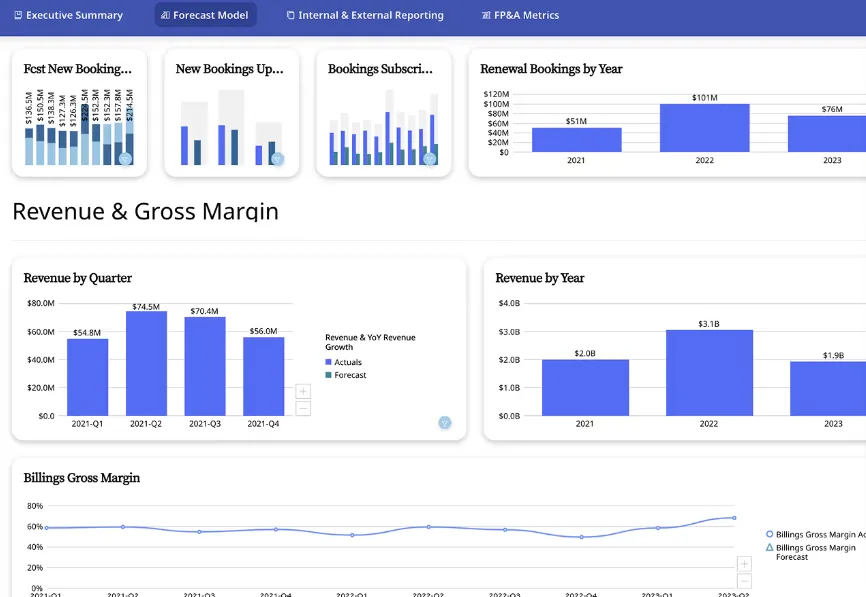
- Interactive dashboards and embedding: Real-time dashboards get shared across teams or embedded into portals and customer-facing apps.
- Cards and low-code apps: Reports assemble from modular Cards, with planning and monitoring apps built over them by people who write no code.
- AI agents on metrics: An agent assigned to a metric raises an alert the moment a threshold breaks, with conversational querying running alongside.
- Connector catalog: Prebuilt source connections run wide enough to shorten ingestion work for a team without data engineers.
Domo pricing
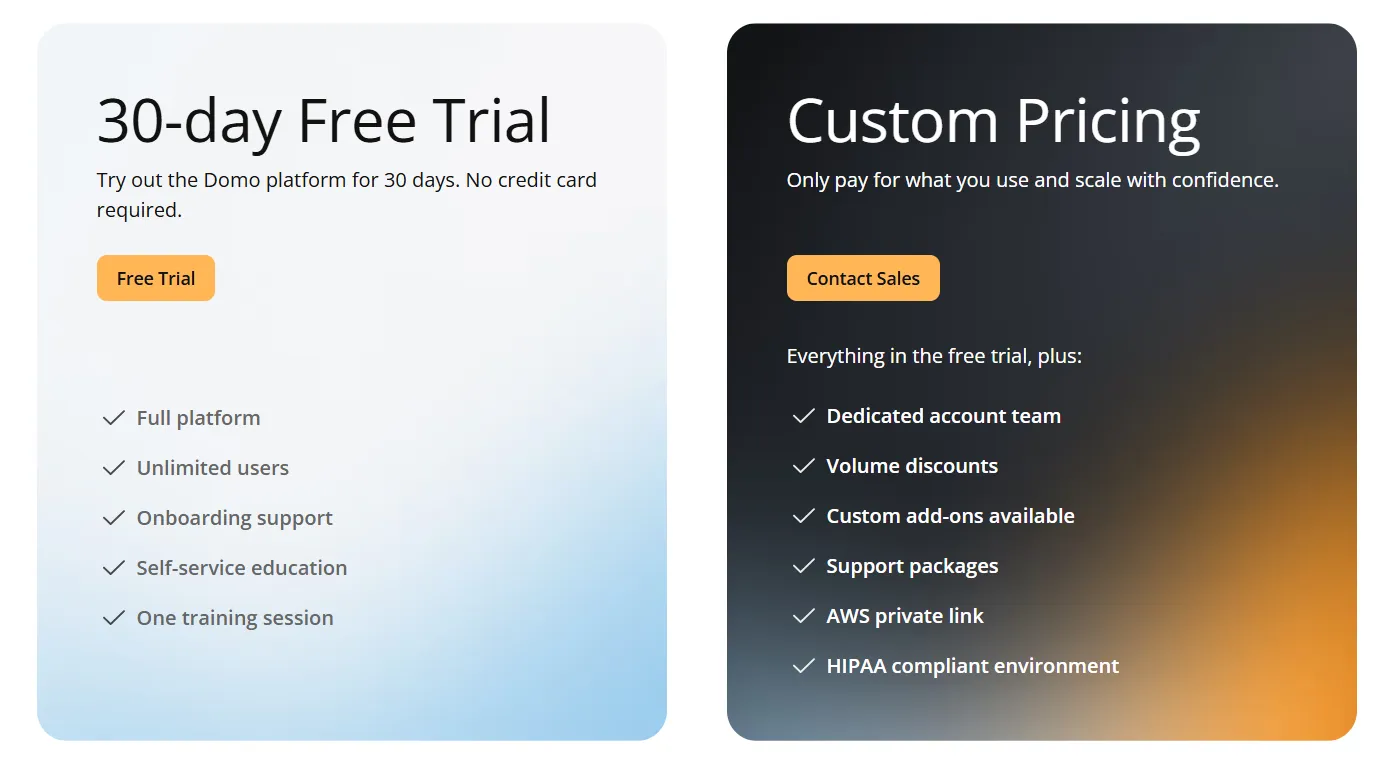
Domo moved to a consumption model and publishes no figures, leaving every contract quoted.
- Free trial: 30 days, no credit card, with the full platform open to unlimited users plus onboarding help and one guided training session.
- Paid plan: metered against a credit pool you buy up front, bringing a dedicated account team, volume rates, support packages, and a HIPAA-compliant environment.
Domo pros and cons
✅ One platform spans ingestion, transformation, dashboards, and alerting, a fit for a small team covering several jobs at once.
✅ The connector catalog is broad, and data ingestion rarely turns into the thing delaying a project.
Get started with Dot for free
Those are the 10 best AI tools for business analysts in 2026, between them covering ad hoc questions, root-cause work, stakeholder reporting, and the governance that keeps a figure defensible six months later.
Dot approaches that work from a different direction.
Our platform hands back the written finding and the recurring review, delivered where your team asks questions, running on the warehouse and dbt models you maintain today.
Here is what a Dot subscription puts in front of your team:
- A written finding and a recommendation returned in the same Slack channel, Teams thread, email, or web session the question came from.
- Deep Analysis for the why questions, with several lines of inquiry run at once.
- Recurring business reviews drafted from live data at whatever frequency you choose.
- A Context Agent holding one agreed definition per metric as your team and your data grow.
- A lineage map beneath every figure that traces it through the SQL and the dbt models to the source tables.
- Unlimited users on every paid plan, so the headcount asking questions stays off the invoice.
➡️ Get started for free with Dot's free plan, or schedule a demo to see how it works with your data.
⚠️ Disclaimer: This article was last updated on August 19 2026. If you spot any inaccuracies, please do contact us, and we'll fact-check it.
Theo Tortorici
Theo writes about AI-powered analytics, data tools, and the future of business intelligence at Dot.