
10 Best Zenlytic Alternatives & Competitors In 2026
Are you exploring Zenlytic alternatives to find an analytics platform that fits your team's specific workflow, data stack, and budget?
Zenlytic does a strong job of combining conversational analytics with a governed semantic layer through its AI agent, Zoë.
But every team's data setup is different.
In this guide, I'll walk through the 10 best Zenlytic competitors in 2026, covering what each does well, where it falls short, and which one fits your team's data workflow.
TL;DR
- The best alternative to Zenlytic on the market is Dot, because it goes beyond conversational querying to deliver automated executive reports, a full audit trail for every insight, and a Context Agent that governs your business definitions without requiring a separate semantic layer build.
- If you need traditional BI with strong visualization, tools like Tableau ($75/creator/month) and Microsoft Power BI ($10/user/month) are established options, though they require more technical setup.
- For AI-native analytics on a tighter budget, Supaboard ($85/month) and Metabase (free open-source option) are worth evaluating, especially for smaller teams or startups.
Factors to consider when evaluating Zenlytic alternatives
Before we get into the list, here are the factors I took into consideration when evaluating each tool:
#1: AI query accuracy and explainability
The whole point of conversational analytics is getting answers you can trust without writing SQL.
But accuracy varies widely between platforms, and if you can't see how an answer was produced, it's hard to act on it with confidence.
Look for tools that show their work, whether that's linking back to the underlying SQL, citing the data source, or breaking down calculations in plain language.
#2: Semantic layer and governance
When multiple people ask the same question, they should get the same answer.
A governed semantic layer locks in metric definitions, business logic, and naming conventions so that "revenue" means the same thing whether it's the CEO or a marketing manager asking.
Some platforms require you to build this layer manually, while others automate it or learn from your existing data models.
#3: Self-serve accessibility for non-technical users
The best analytics tools don't just serve data teams.
If your marketing lead, product manager, or operations director can't get answers without filing a ticket, you're still stuck in the old request-queue model.
Evaluate how easy it is for someone who doesn't know SQL to ask a question, get a meaningful answer, and explore further on their own.
#4: Pricing transparency and total cost of ownership
Some platforms publish clear per-user or flat-rate pricing, while others require a sales call before you know what you'll pay.
Beyond the sticker price, think about setup costs, onboarding fees, training time, and what happens when you add more users or data.
A tool that looks affordable at 10 users might become expensive at 100.
What are the 10 best Zenlytic alternatives and competitors in 2026?
The best Zenlytic alternatives in 2026 are Dot, ThoughtSpot, and Looker.
The rest are as follows:
Tool | Best For | Pricing |
Dot | AI data analyst that delivers narrative insights, automated reports, and a full audit trail directly from your warehouse. | Free plan, paid plans start at $180/month |
ThoughtSpot | AI-powered self-service analytics with natural language search and automated dashboards. | From $25/user/month (billed annually) |
Looker | Governed, warehouse-native BI with a centralized semantic layer for consistent metrics. | Custom pricing (annual contract) |
Tableau | Advanced visual analytics and exploratory data analysis for large, complex datasets. | From $75/creator/month |
Sigma | Spreadsheet-style analytics on live warehouse data for finance and ops teams. | Custom pricing |
Holistics | Governed self-service analytics with a code-based semantic layer and Git version control. | From $960/month |
Supaboard | AI-powered dashboards and natural language analytics for teams that want fast setup without SQL. | From $85/month |
Tellius | Conversational analytics with automated root cause analysis and AI-generated narratives. | Custom pricing |
Metabase | Open-source BI for self-service dashboards and analytics with minimal setup. | Free (open source), Cloud from $100/month |
Microsoft Power BI | Standardized dashboards and reporting for organizations in the Microsoft ecosystem. | Free plan, Pro from $10/user/month |
#1: Dot
Dot is the best alternative to Zenlytic for analytics teams looking for conversational, analyst-grade insights delivered directly where they work, with the flexibility to start on a free plan.
Instead of layering AI on top of a traditional BI interface, Dot is an AI data analyst that connects directly to your data warehouse and does the analysis for you.
It doesn't ask you to build dashboards or configure a separate semantic layer.
You ask a question, and Dot returns an answer with full context, including the SQL it ran, the data sources it used, and the logic behind the numbers.
Our platform was built for data leaders who want to scale analytical capacity without scaling headcount, and for business stakeholders who want real answers instead of another dashboard to interpret.
Let's go over the features that make Dot the right choice for teams looking for a Zenlytic alternative: 👇
Ask questions, get analysis (not just queries)
Most conversational analytics tools translate your question into a single SQL query and return a chart.
Dot goes further.
It plans multi-step analyses, writes and executes code, and produces narrative explanations that tell you what happened, why it changed, and what to look at next.
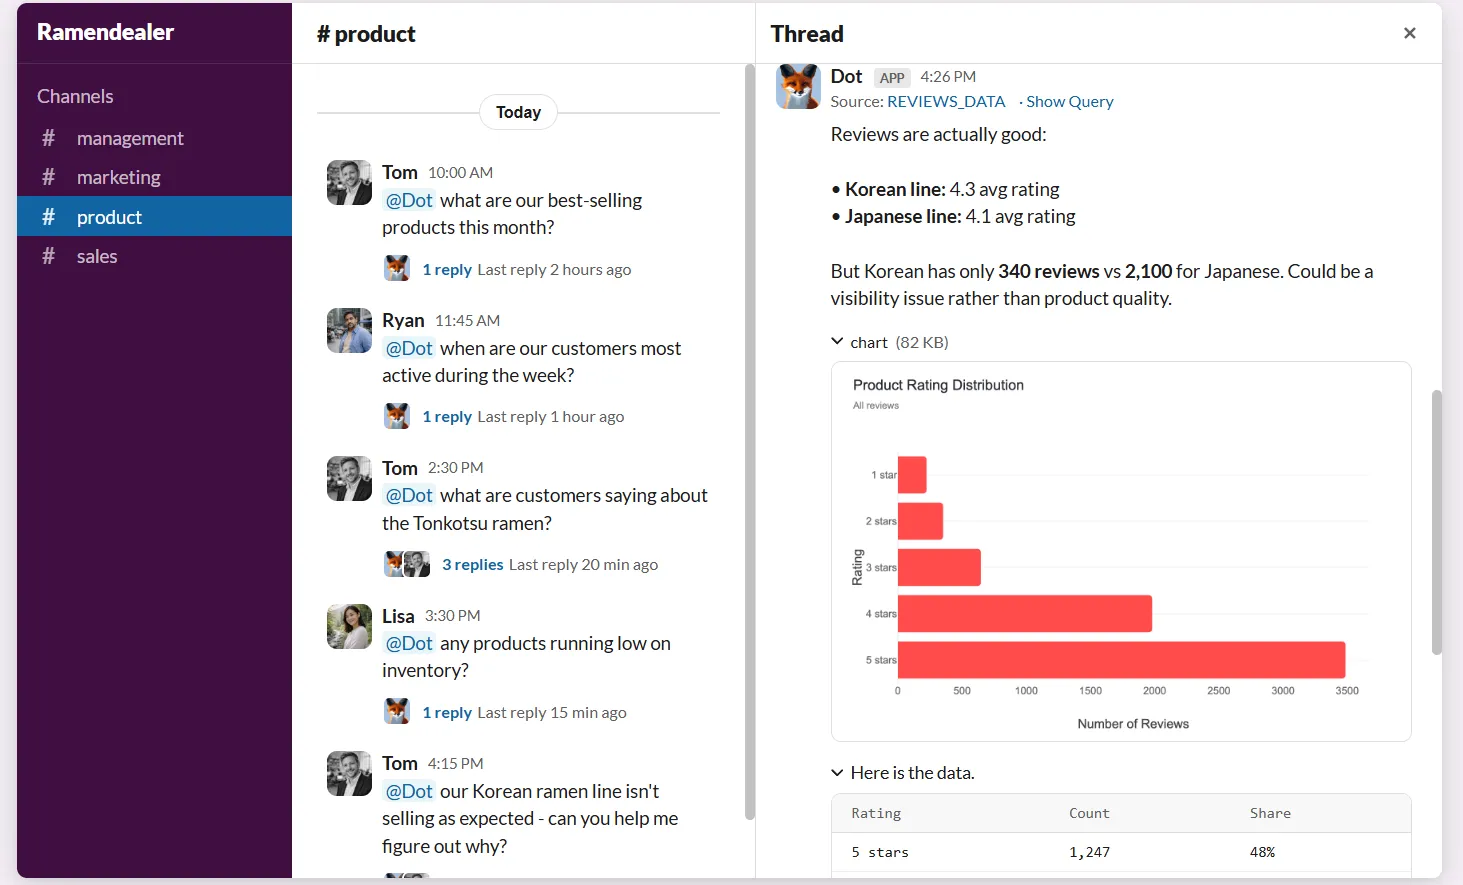
The experience feels less like searching a database and more like working with a senior analyst who already knows your data.
💡 Case Study: Learn how Emerge saved 2,000 hours yearly and achieved 10x ROI by letting team members ask Dot questions in Slack and get trusted answers within seconds.
Automated executive business review reports
One of the biggest time sinks for data teams is producing recurring reports for leadership.
Dot generates executive-ready reports on a set schedule (daily, weekly, or monthly) directly from the data warehouse, and turns raw metrics into a written narrative that explains what happened, what changed compared to previous periods, and where attention is needed.
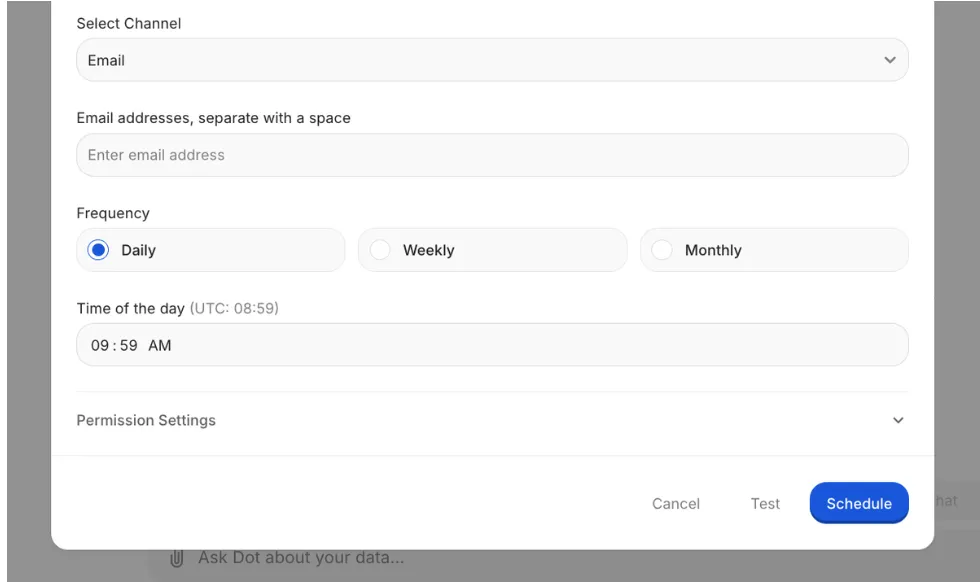
Leadership gets a consistent, easy-to-read business update without needing to interpret dashboards, and data teams stop spending a large portion of their time producing the same reports over and over again.
Context Agent for governed business definitions
Metric drift is a real problem.
When "revenue" means one thing to sales and something else to finance, trust in the data breaks down fast.
Dot's Context Agent maintains shared business definitions, learns from your existing data models and documentation, and makes sure everyone gets the same answer to the same question.
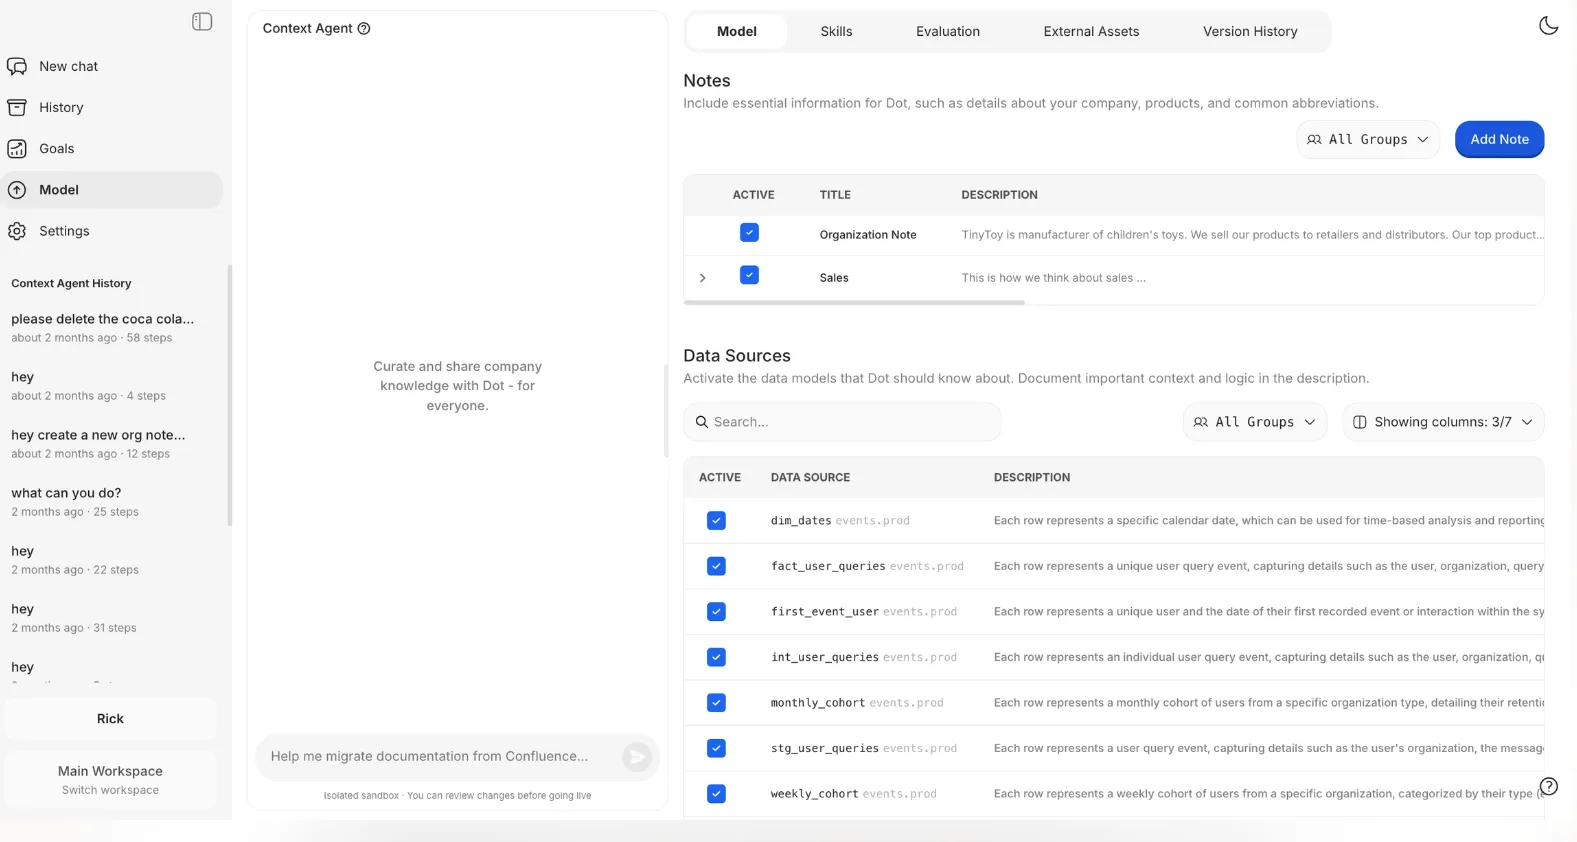
It interviews domain experts, captures tribal knowledge, and keeps your context layer up to date, so you don't need to build and maintain a separate semantic layer from scratch.
Full audit trail for every insight
One common frustration with analytics tools is that they show what the numbers are, but not always how they were produced.
If a metric looks off, teams often have to dig through models, formulas, or refresh logs just to figure out what happened.
Dot attaches a full audit trail to every insight it produces.
Each answer or report links directly back to the underlying SQL queries, Python logic, and datasets used, making it clear exactly where the numbers came from and how they were calculated.
There's no black box. Everything is inspectable.
Dot's Integrations
Dot connects directly to modern data warehouses like Snowflake, BigQuery, Redshift, and Databricks, along with operational databases such as Postgres, MySQL, and SQL Server.
Our platform also integrates with semantic layers and transformation tools like dbt, Looker, Power BI models, and Cube.
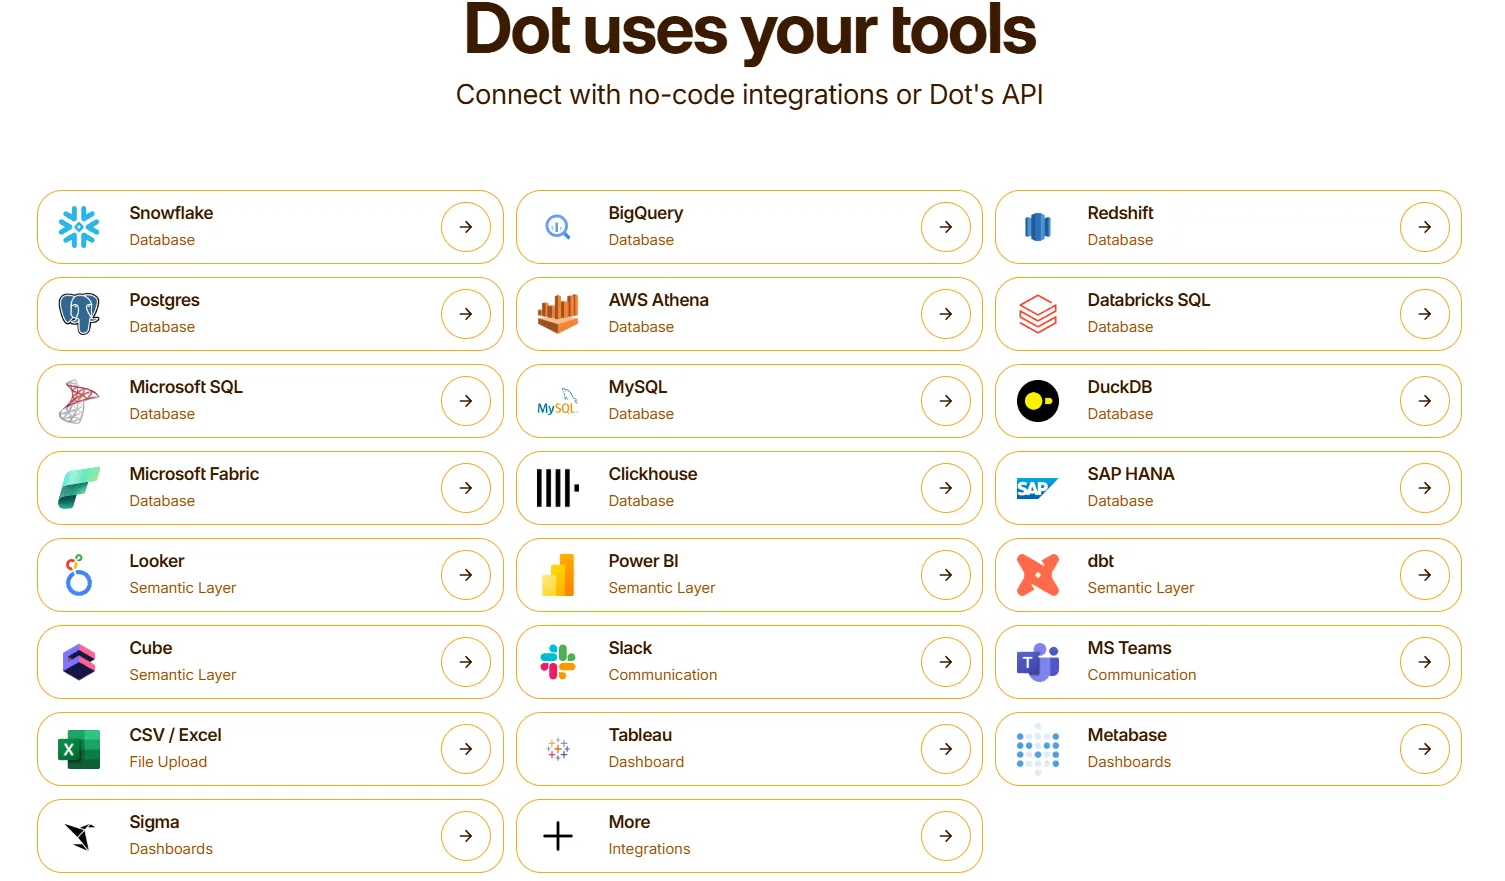
That means it can reuse existing business logic rather than recreating it inside yet another analytics tool.
Insights get delivered through Slack, Microsoft Teams, email, and the web app, so analytics show up where decisions actually happen.
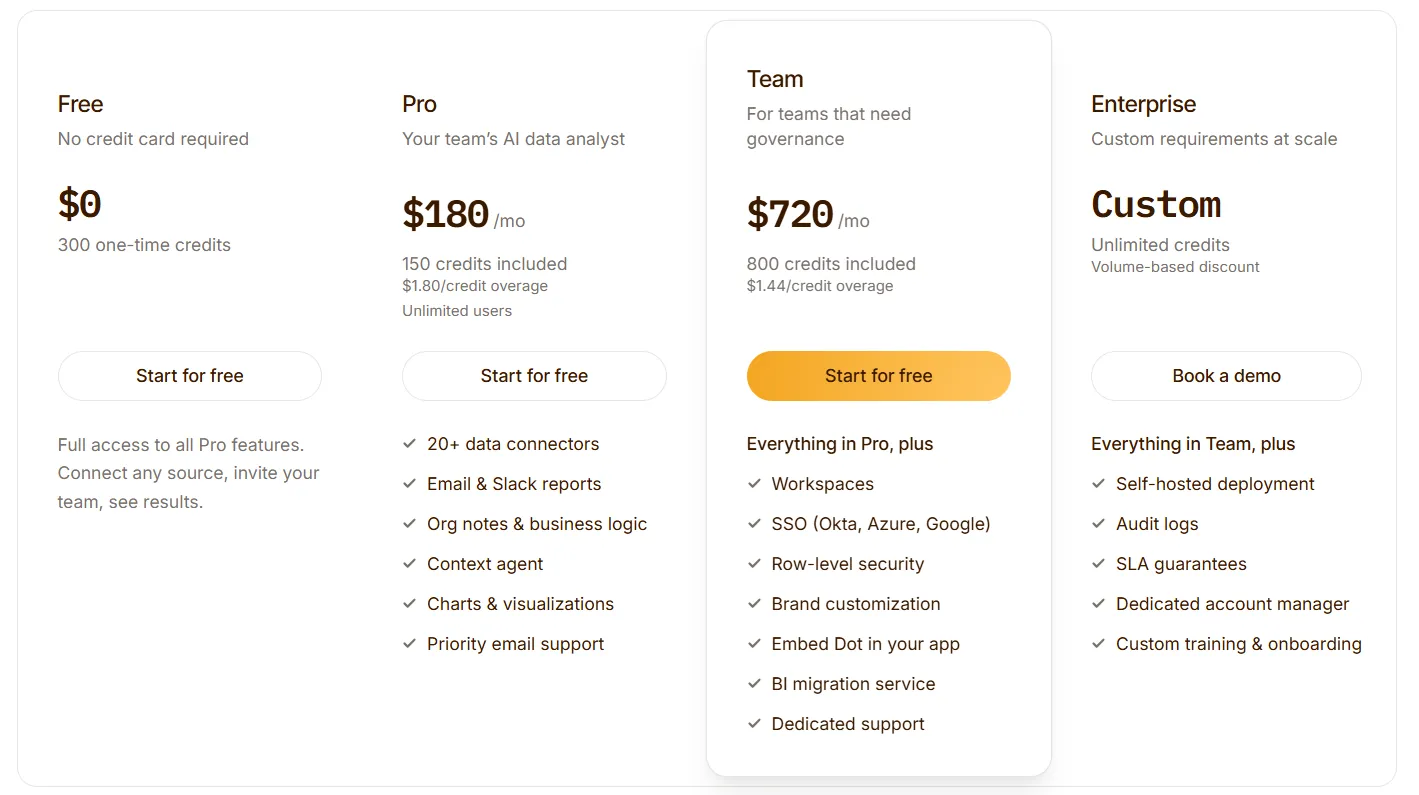
Dot's Pricing
Unlike Zenlytic, Dot offers a free plan with 300 one-time credits and full access to all Pro features, so you can connect any source, invite your team, and see results before committing to a paid tier.
Dot uses simple, usage-based pricing where you only pay for what you use:
- Free: $0 with no credit card required, includes 300 one-time credits, full access to all Pro features, connect any source, and invite your team.
- Pro: $180/month, includes 150 credits with $1.80/credit overage, unlimited users, 20 or more data connectors, email and Slack reports, org notes and business logic, Context Agent, charts and visualizations, and priority email support.
- Team: $720/month, includes 800 credits with $1.44/credit overage, everything in Pro, workspaces, SSO (Okta, Azure, Google), row-level security, brand customization, the ability to embed Dot in your app, BI migration service, and dedicated support.
- Enterprise: Custom pricing, includes unlimited credits with volume-based discount, everything in Team, self-hosted deployment, audit logs, SLA guarantees, a dedicated account manager, and custom training and onboarding.
Pros and Cons
✅ Produces narrative-driven analysis with recommendations, not just charts and numbers.
✅ Automated business reports delivered on schedule, so leadership doesn't have to dig through dashboards.
✅ Full audit trail on every insight, with direct links to the SQL, Python, and datasets behind each answer.
✅ Architecture that works directly on modern data stacks without copying or reshaping data.
❌ Focused on warehouse-connected analytics, so teams without a proper data warehouse won't get the full benefit.
❌ Credit-based pricing requires some upfront estimation of usage.
#2: ThoughtSpot
Best for: Organizations that want AI-powered, self-service analytics with natural language querying and automated dashboards.
Similar to: Zenlytic, Tellius.
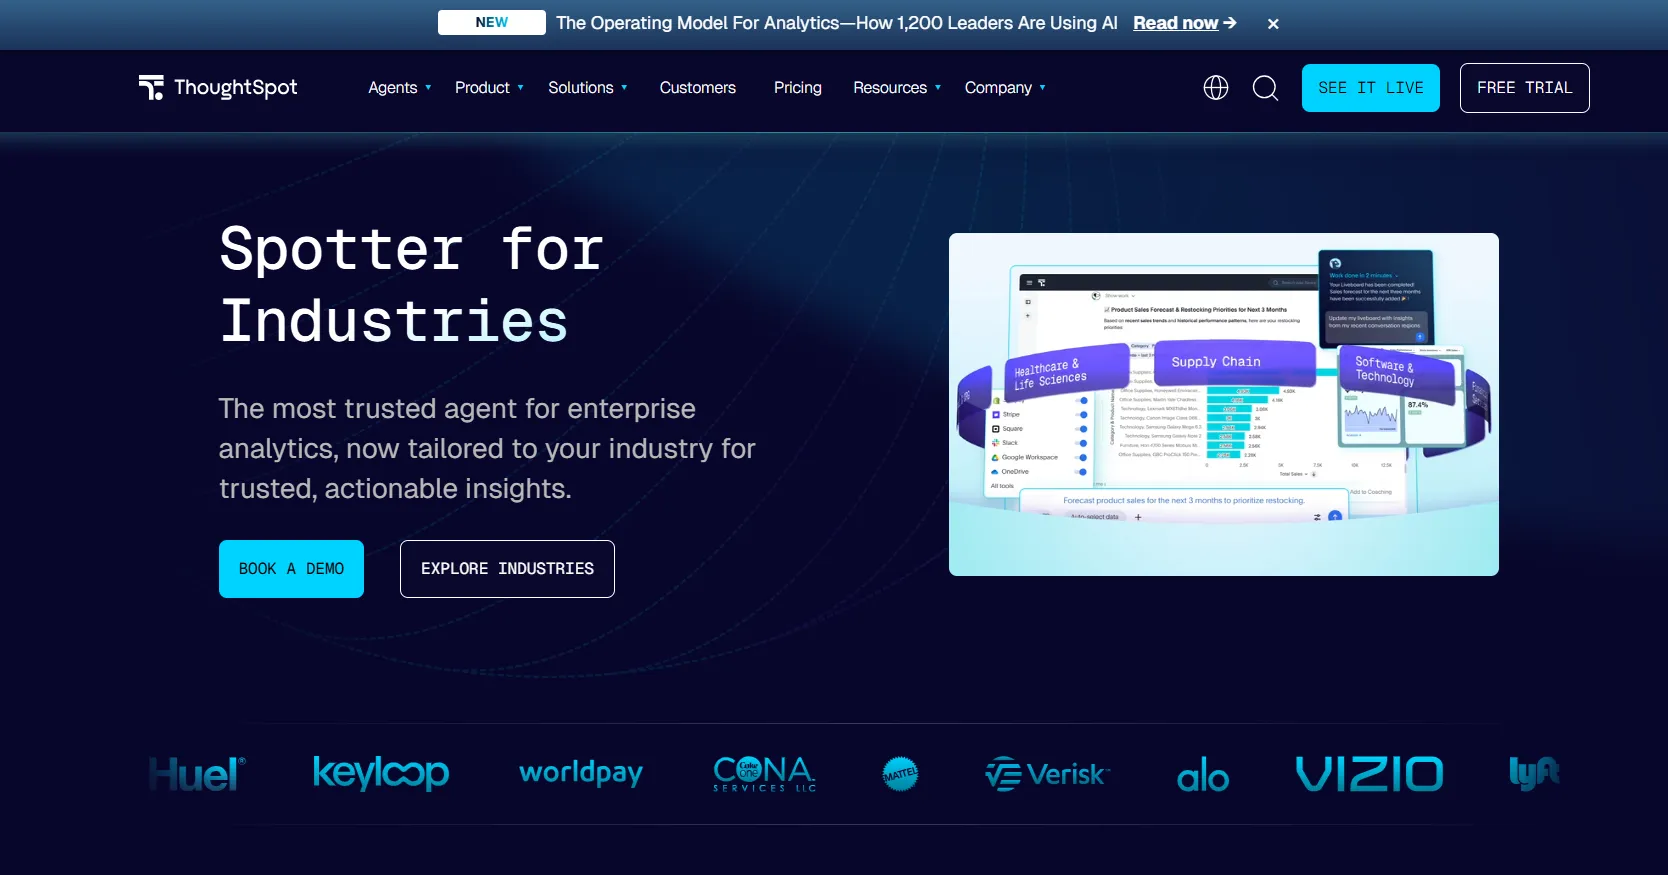
ThoughtSpot is an AI-driven analytics platform designed to help users ask questions in plain language and get instant answers from live data.
It's built for teams that want faster insights and less manual dashboard work, with analytics that show up directly in business workflows, unlike tools likeMindsDB that focus more on in-database machine learning than self-service analytics.
Features
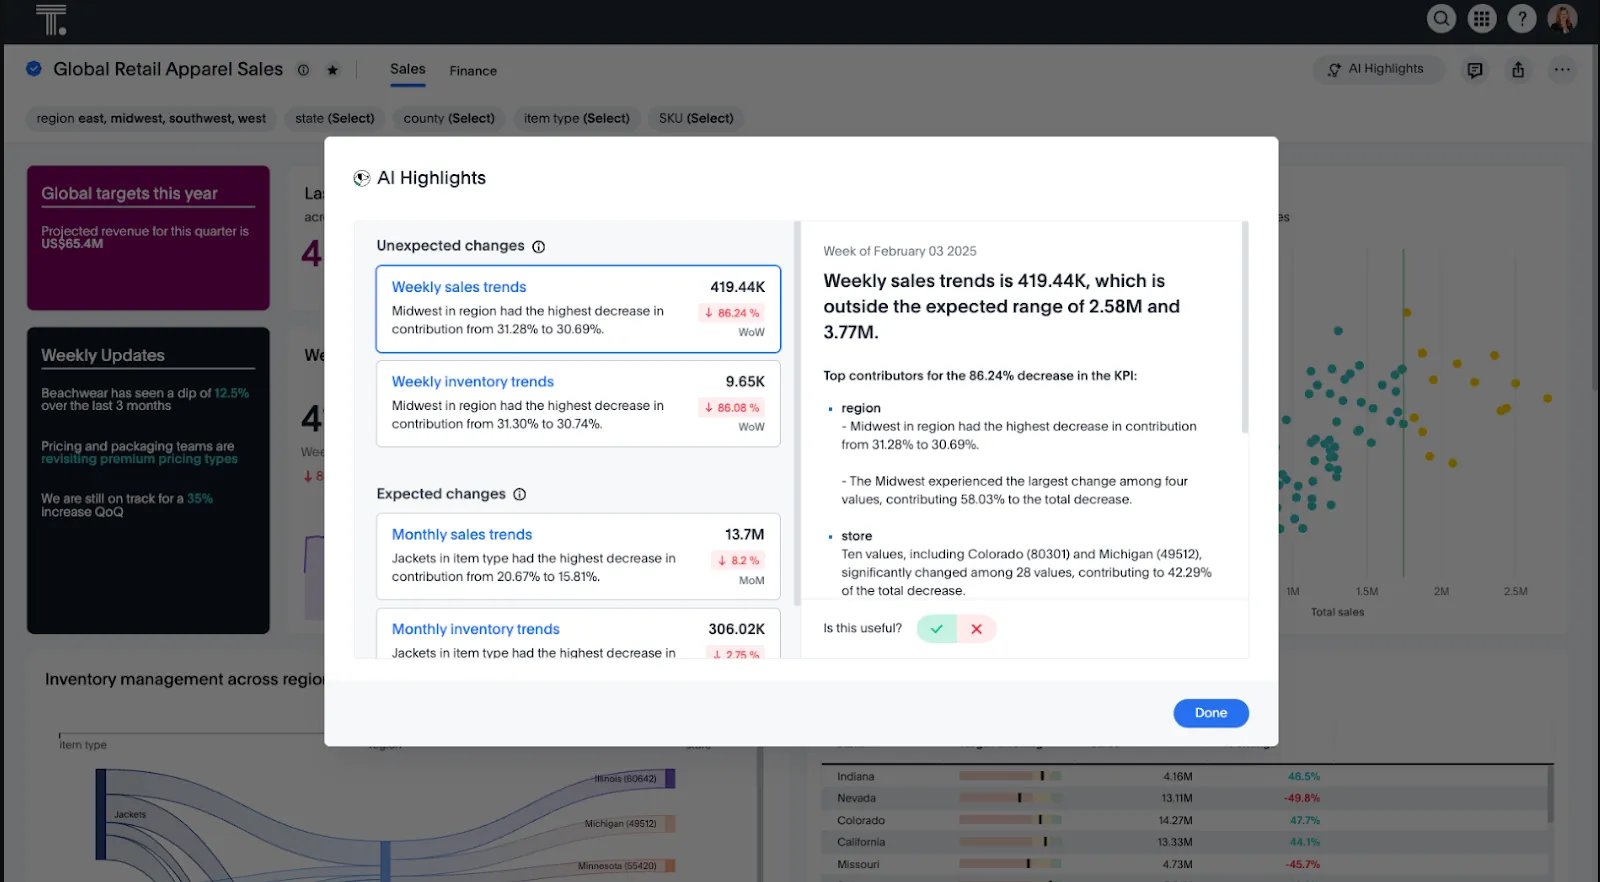
- Natural language analytics: Ask questions in plain English and get instant, governed answers from live data, without building or navigating dashboards.
- AI agents for analytics workflows: Agentic tools like Spotter automatically generate analyses, dashboards, and insights from structured and unstructured data.
- Automated dashboards with SpotterViz: Turn data into complete, styled dashboards that tell a story, without manual layout or chart configuration.
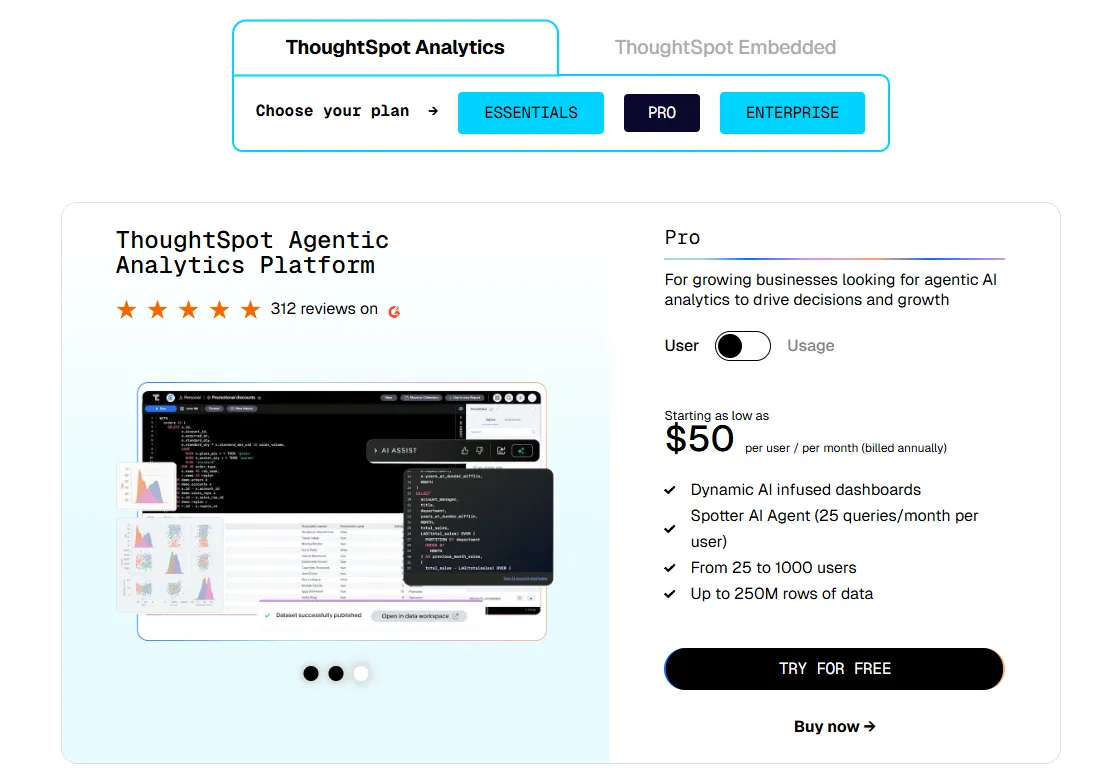
Pricing
ThoughtSpot offers two separate products - ThoughtSpot Analytics for internal BI and ThoughtSpot Embedded for building analytics into applications - each with flexible pricing depending on scale and usage:
- ThoughtSpot Analytics:
- Essentials: From $25 per user per month (billed annually), for teams of 5-50 users, includes dynamic interactive dashboards and AI-powered insights and supports up to 25M rows of data.
- Pro (per user pricing): From $50 per user per month (billed annually), for 25–1,000 users, includes everything in Essentials, plus AI-infused dashboards and Spotter AI Agent (25 queries per user/month), and supports up to 250M rows of data.
- Pro (usage-based): From $0.10 per query, includes everything in Pro per user, and adds Analyst Studio.
- Enterprise (user or usage-based): Custom pricing, includes everything in Pro, plus unlimited users and data.
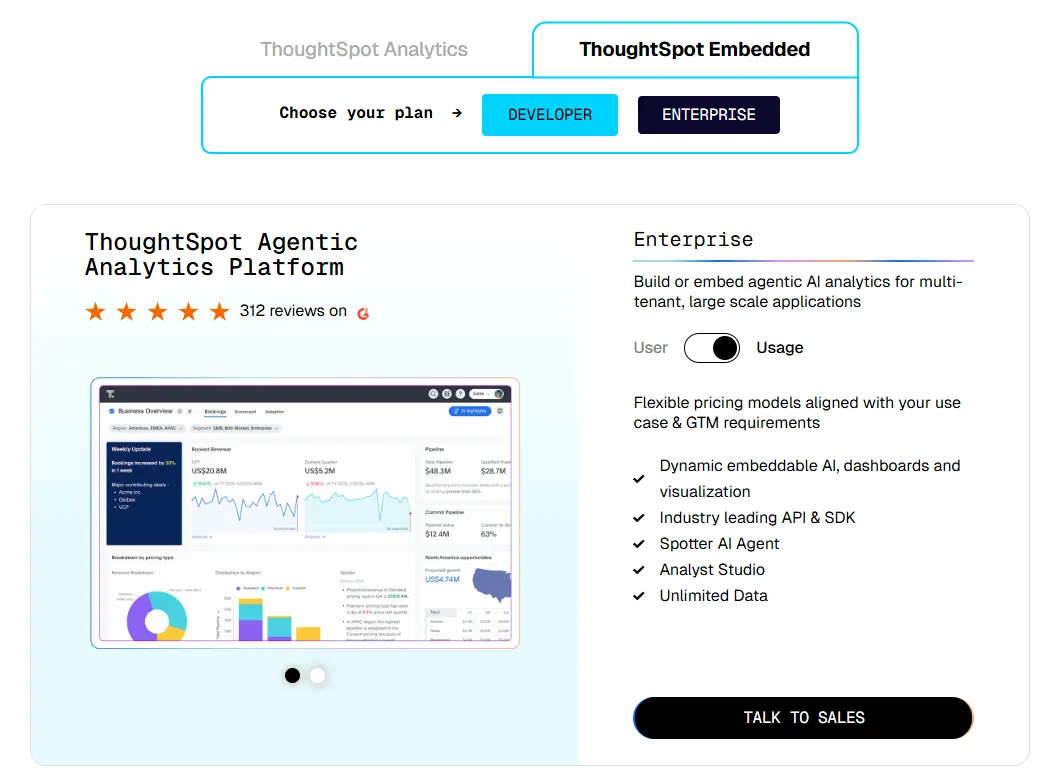
- ThoughtSpot Embedded:
- Developer: Free for 1 year, includes embeddable AI analytics, dashboards, and visualizations, APIs and SDKs, up to 10 users and 25M rows of data.
- Enterprise (user-based): Custom pricing, includes everything in Developer, plus unlimited data.
- Enterprise (usage-based): Custom pricing, everything in Enterprise, plus Spotter AI Agent and Analyst Studio.
Pros & Cons
✅ Accessible for non-technical users through natural language search and guided analytics.
✅ Built-in AI surfaces patterns and trends faster than traditional dashboards.
❌ Custom and usage-based pricing makes costs harder to predict at scale.
❌ Requires a well-modelled semantic layer to produce accurate results.
#3: Looker
Best for: Data teams that want a governed, warehouse-native BI platform with consistent metrics and tight Google Cloud integration.
Similar to: Holistics, Omni.
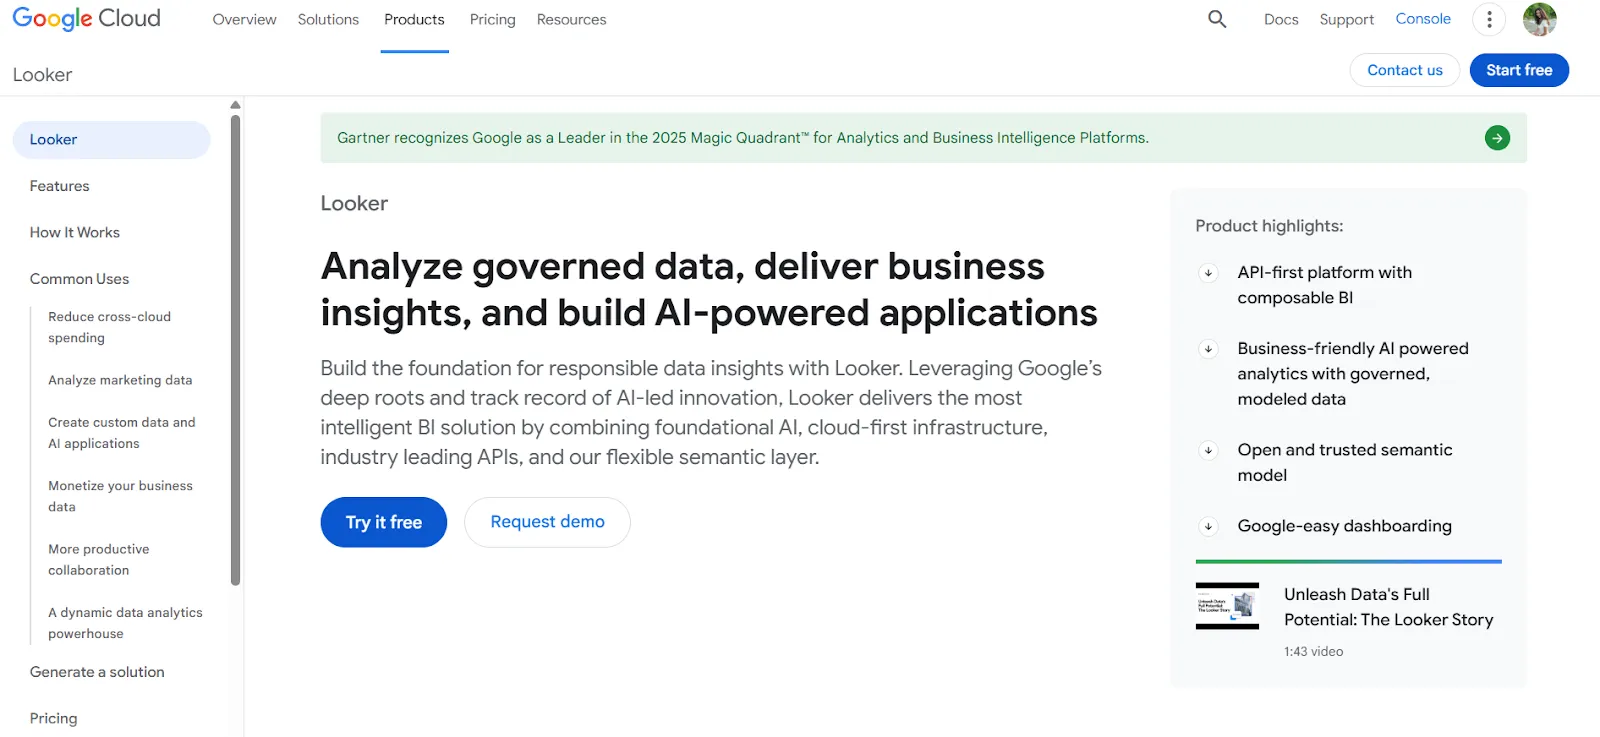
Looker is a BI platform organized around LookML, a centralized modeling language that defines metrics and business rules in one place.
Every dashboard, report, and embedded view pulls from that same governed layer, so numbers stay consistent across teams.
Features
- Centralized semantic modeling with LookML: Define metrics and business rules once, so everyone across the company sees the same numbers in every report and dashboard.
- Conversational analytics powered by Gemini: Users can ask questions about their data in natural language and get answers without navigating dashboards.
- Real-time, governed dashboards: Dashboards pull data live from the warehouse, letting users explore, filter, and drill into trusted metrics without relying on outdated extracts.
Pricing
Looker uses a custom, contract-based pricing model made up of two parts: platform pricing (the cost of running a Looker instance) and user licensing (the cost per user type).
Pricing is annual for all plans.
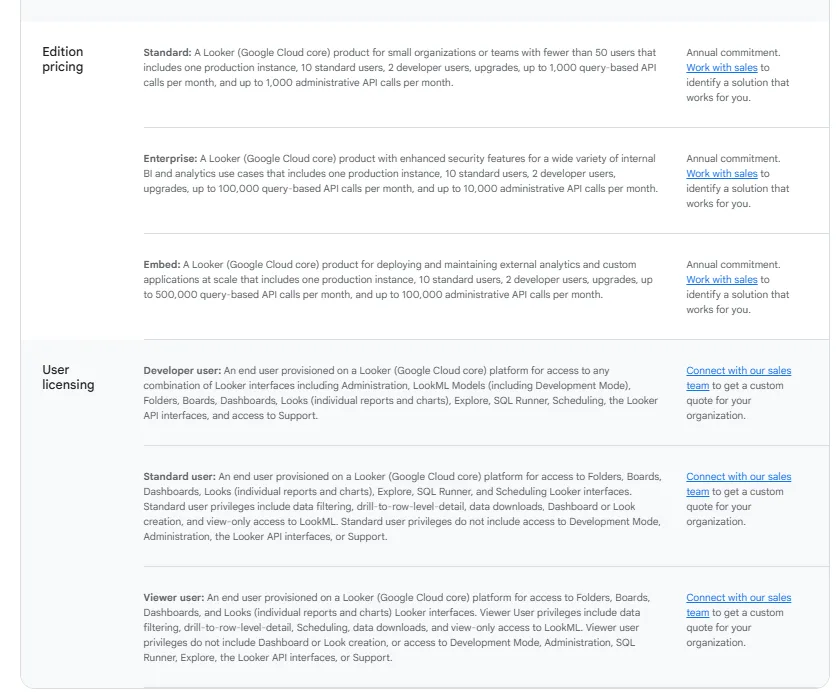
- Platform editions:
- Standard: Designed for small teams or organizations with fewer than 50 users, includes 1 production instance, 10 standard users + 2 developer users, up to 1,000 query-based API calls/month, and up to 1,000 admin API calls/month.
- Enterprise: Built for larger internal BI and analytics use cases, includes everything in Standard, plus enhanced security features, up to 100,000 query-based API calls/month, and up to 10,000 admin API calls/month.
- Embed: Designed for embedding analytics into external products or applications, includes everything in Standard, plus up to 500,000 query-based API calls/month and up to 100,000 admin API calls/month.
- User licensing:
- Developer users: Full access to Looker, including LookML development, administration, APIs, and advanced tooling.
- Standard users: Can explore data, build dashboards and reports, run SQL, and schedule content.
- Viewer users: Read-only access to dashboards and reports, with filtering and drill-down.
Pricing is custom on all plans and varies based on scale, permissions, and usage.
Pros & Cons
✅ Keeps metrics consistent by defining them once and reusing across all dashboards and reports.
✅ Makes it easy to embed reports and dashboards into internal tools or customer-facing products.
❌ Allegedly has a learning curve, especially for teams without LookML experience, which is why some data teams have been looking forLooker alternatives.
❌ Custom pricing.
#4: Tableau
Best for: Data teams and enterprises that need advanced data visualization, exploratory analysis, and flexible deployment options.
Similar to: Qlik Sense, Power BI.

Tableau is a well-established BI platform known for its advanced data visualization and interactive dashboarding capabilities.
It's commonly used by analysts who want to explore large, complex datasets visually and uncover patterns through hands-on analysis.
Features
- Advanced visual analytics and exploration: Build highly interactive dashboards using drag-and-drop analysis, rich visualizations, and drill-downs to explore patterns in complex data.
- Agentic analytics with Tableau Next: AI-powered, agent-based analytics that deliver personalized insights, let users ask natural-language questions, and trigger actions in tools like Slack and Salesforce.
- Strong security and governance: Supports centralized data governance, security controls, and reusable metrics through features like Tableau Pulse and Data Management.
Pricing
Tableau uses per-user, per-month pricing, with separate plans depending on whether you deploy Tableau in the cloud, on your own servers, or as part of its newer AI-driven offering:
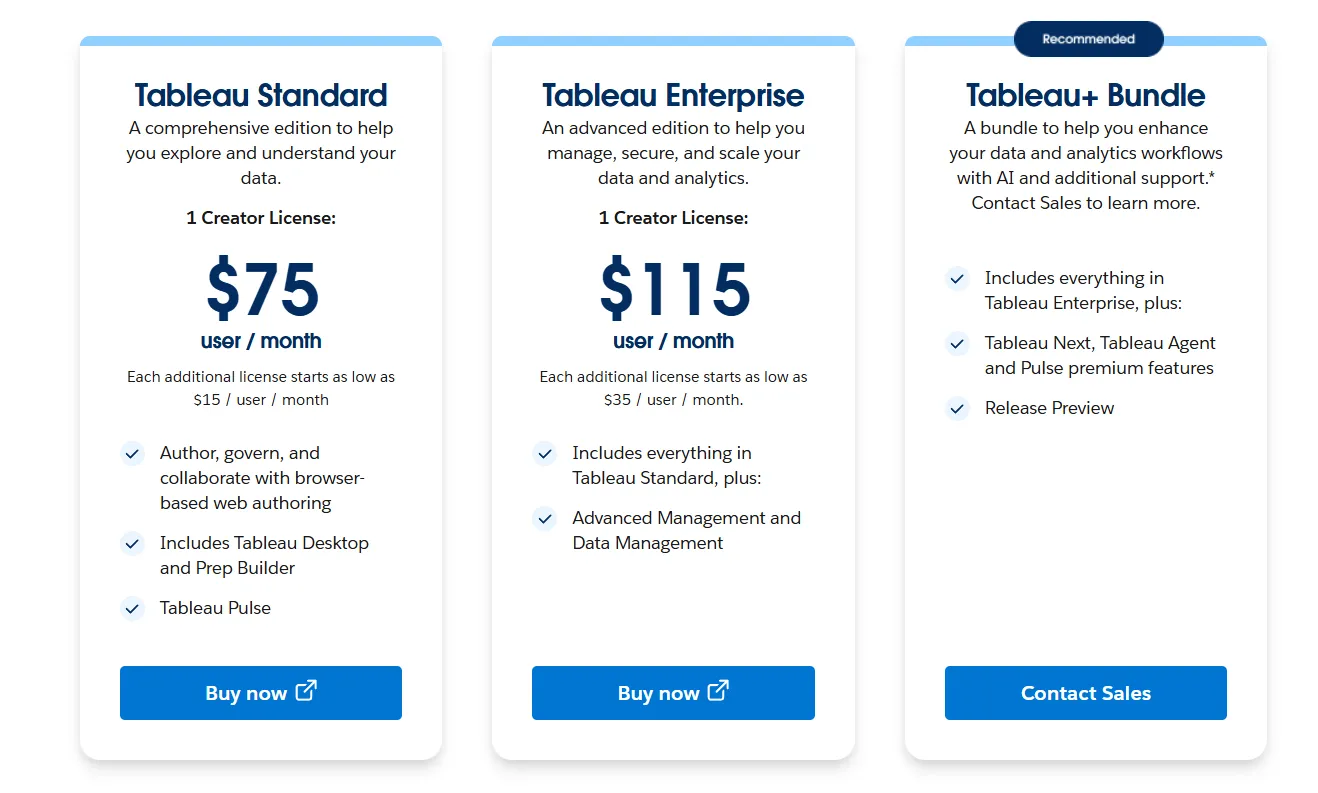
- Tableau Cloud has three pricing plans:
- Tableau Standard: $75 per 1 creator per month, with each additional license from $15 per user/month, includes browser-based authoring and collaboration, Tableau Desktop and Prep Builder, Tableau Pulse for metrics and insights.
- Tableau Enterprise: $115 per 1 creator per month, with each additional license from $35 per user/month, includes everything in Standard, plus Advanced Management and Data Management for governance and scale.
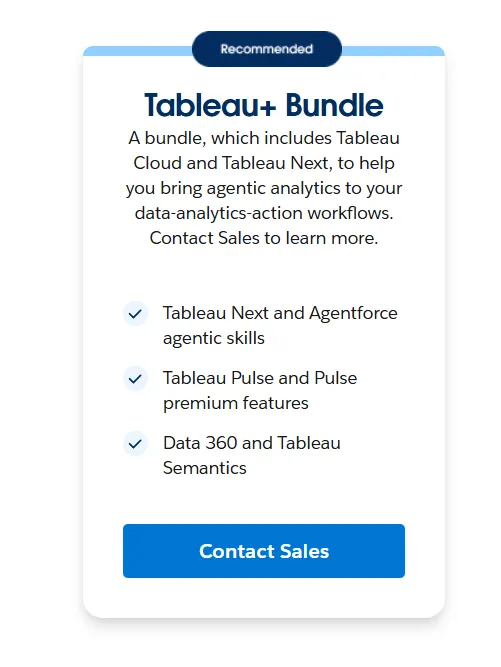
- Tableau+ Bundle (Cloud + AI): Custom pricing, includes everything in Tableau Enterprise, plus Tableau Next, Tableau Agent, and Pulse premium features, with access to release previews and early AI capabilities.
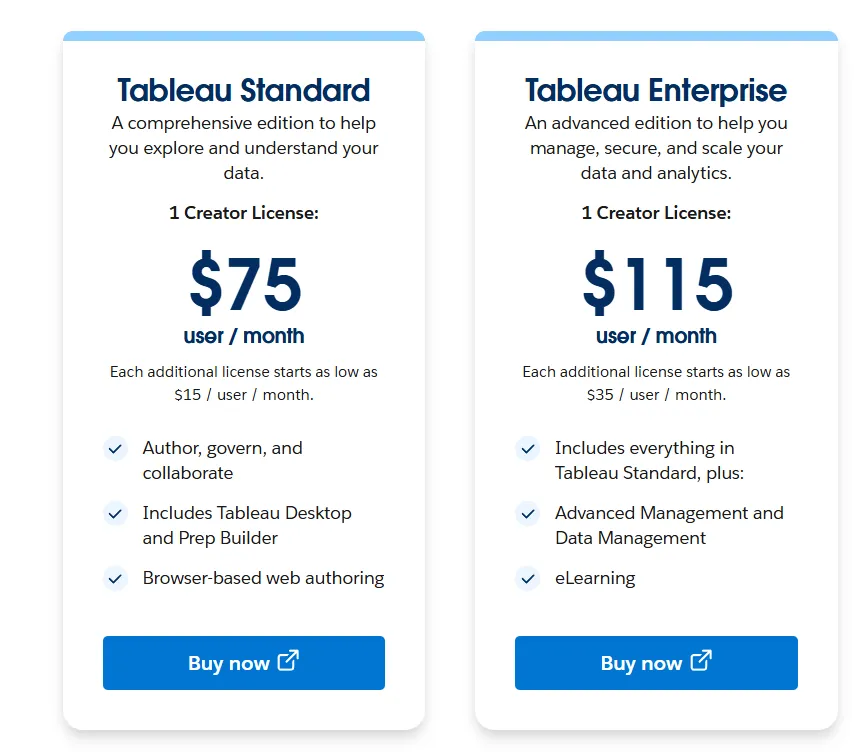
- Tableau Server has two pricing plans:
- Tableau Standard: $75 per 1 creator per month, with each additional license from $15 per user/month, includes authoring, governance, and collaboration and Tableau Desktop and Prep Builder.
- Tableau Enterprise: $115 per 1 creator per month, with each additional license from $35 per user/month, includes everything in Standard, plus Advanced Management, Data Management, and eLearning.
- Tableau Next (agentic analytics): Requires an annual contract, includes agentic analytics via Agentforce, Tableau Semantics, Tableau Pulse (including premium), and Data 360.
Pros & Cons
✅ Excellent data visualization and storytelling capabilities.
✅ Intuitive drag-and-drop analysis that lets users explore data and iterate quickly.
❌ Steep learning curve for advanced features.
❌ Costs scale quickly once you add Viewers, Explorers, and Creators.
#5: Sigma
Best for: Teams that want spreadsheet-style analytics on live warehouse data without complex BI setup.
Similar to: Looker, Omni.
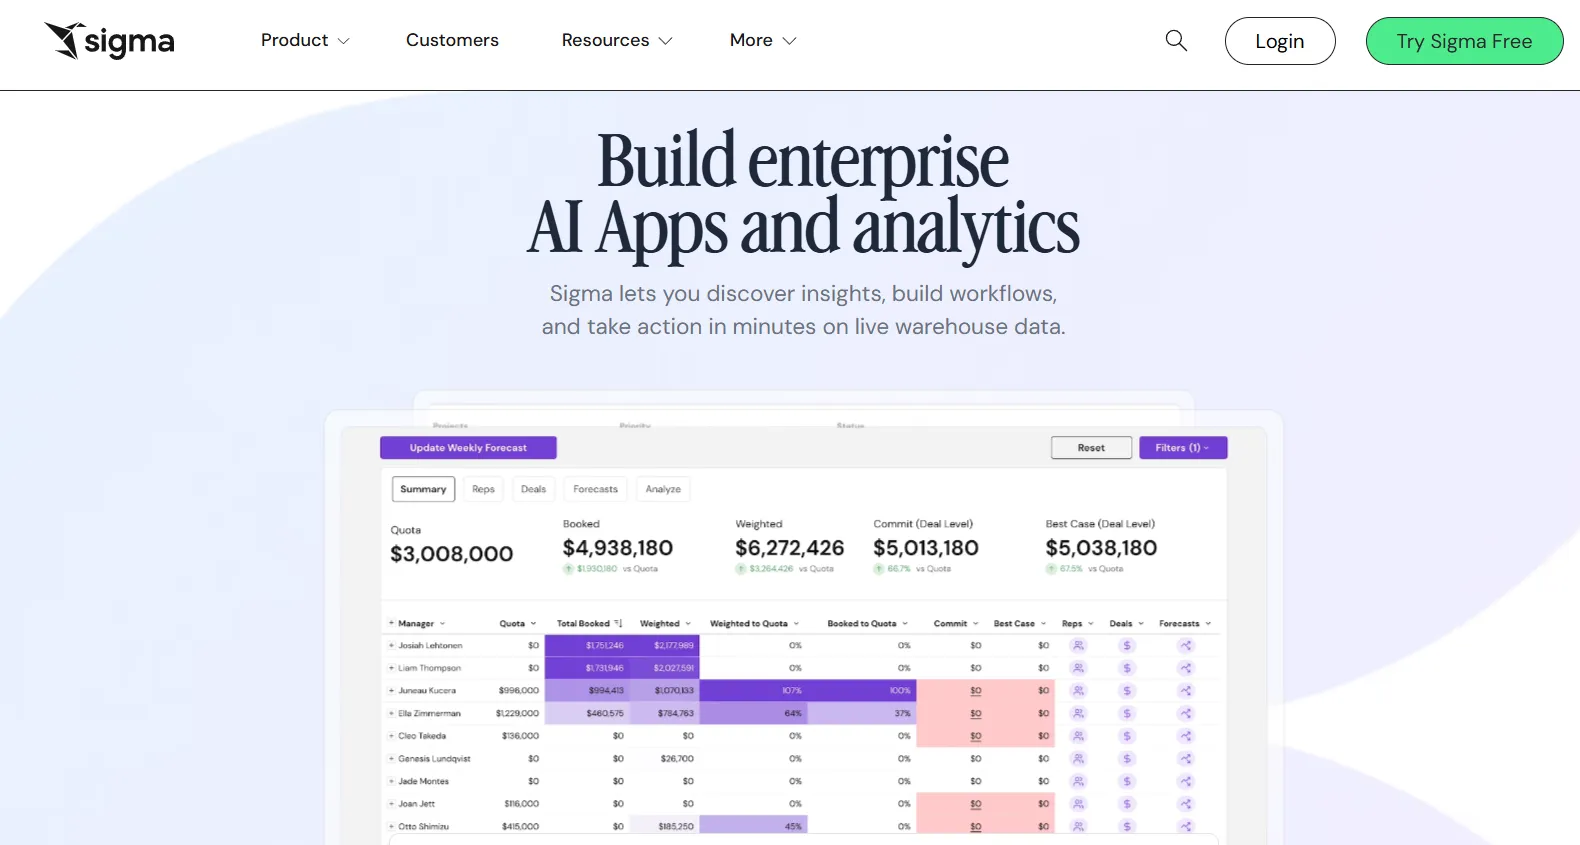
Sigma is a cloud-native analytics platform that lets business users explore live warehouse data through a familiar spreadsheet interface.
Instead of building complex semantic layers or writing SQL, teams can analyze, pivot, and collaborate on data in real time directly on Snowflake, BigQuery, or Databricks.
Features
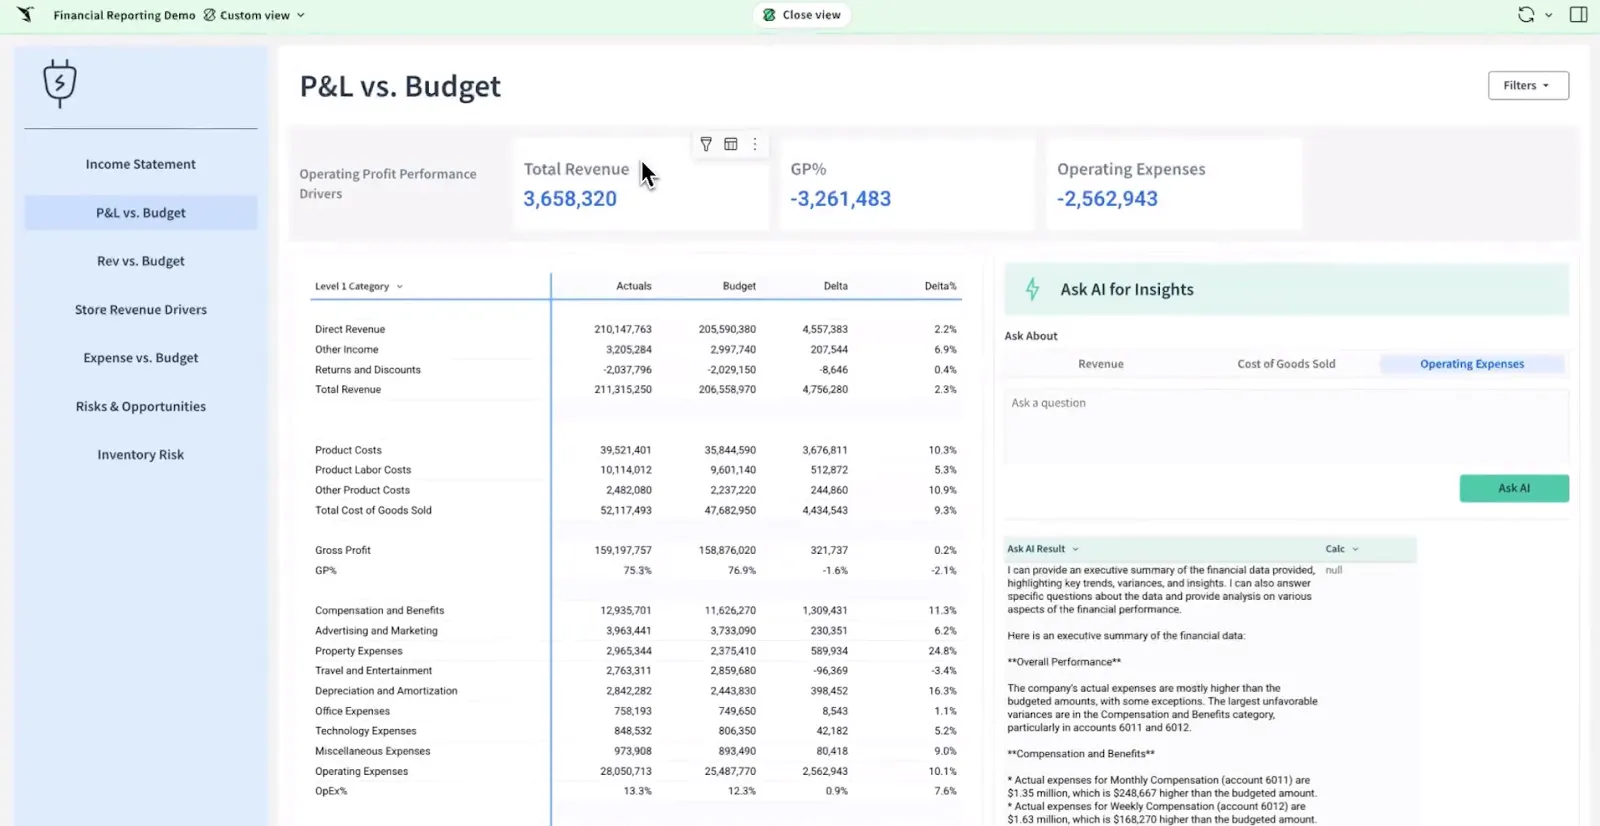
- Spreadsheet-style interface on live data: Analyze data using formulas, tables, and logic that feel familiar to Excel users, making advanced analytics accessible to business teams.
- AI-powered dashboards and apps: Use natural language and AI to build dashboards, reports, and full data apps that support real business workflows.
- Collaborative workbooks: Build interactive analysis in shared workbooks where teams can comment, version, and iterate together, similar to Google Sheets but powered by your warehouse.
Pricing
Sigma doesn't publish its pricing.
You can contact its sales team directly to get a custom quote.
Pros & Cons
✅ Spreadsheet-like interface makes warehouse data accessible to non-technical users, unlike tools likeDomo that can feel more complex to get started with.
✅ Queries data directly from the cloud warehouse, so insights are always up to date.
❌ Limited visual customization with fewer chart types and design controls compared to visual-first BI tools.
❌ Data modeling and complex workflows require careful backend optimization.
#6: Holistics
Best for: Teams that need governed self-service analytics with a flexible semantic layer and strong collaboration between analysts and business users.
Similar to: Looker, Metabase.
Holistics is a cloud-native BI platform that centralizes metric definitions and data modeling while enabling non-technical users to build reports and dashboards without constantly asking the data team.
It brings software engineering practices like Git version control and code-based modeling into the analytics workflow.
Features
- Self-service exploration for business users: Non-technical teams build their own reports and dashboards through a visual, drag-and-drop interface using pre-defined metrics and governed data models.
- Analytics as code: Define business logic, datasets, and metrics using Holistics' declarative DSL or SQL and commit everything to Git for full version control, branching, and code reviews.
- Centralized data modeling: Define metrics, joins, derived tables, and transformations once in Holistics' model layer to enforce consistency across dashboards and reports.
Pricing
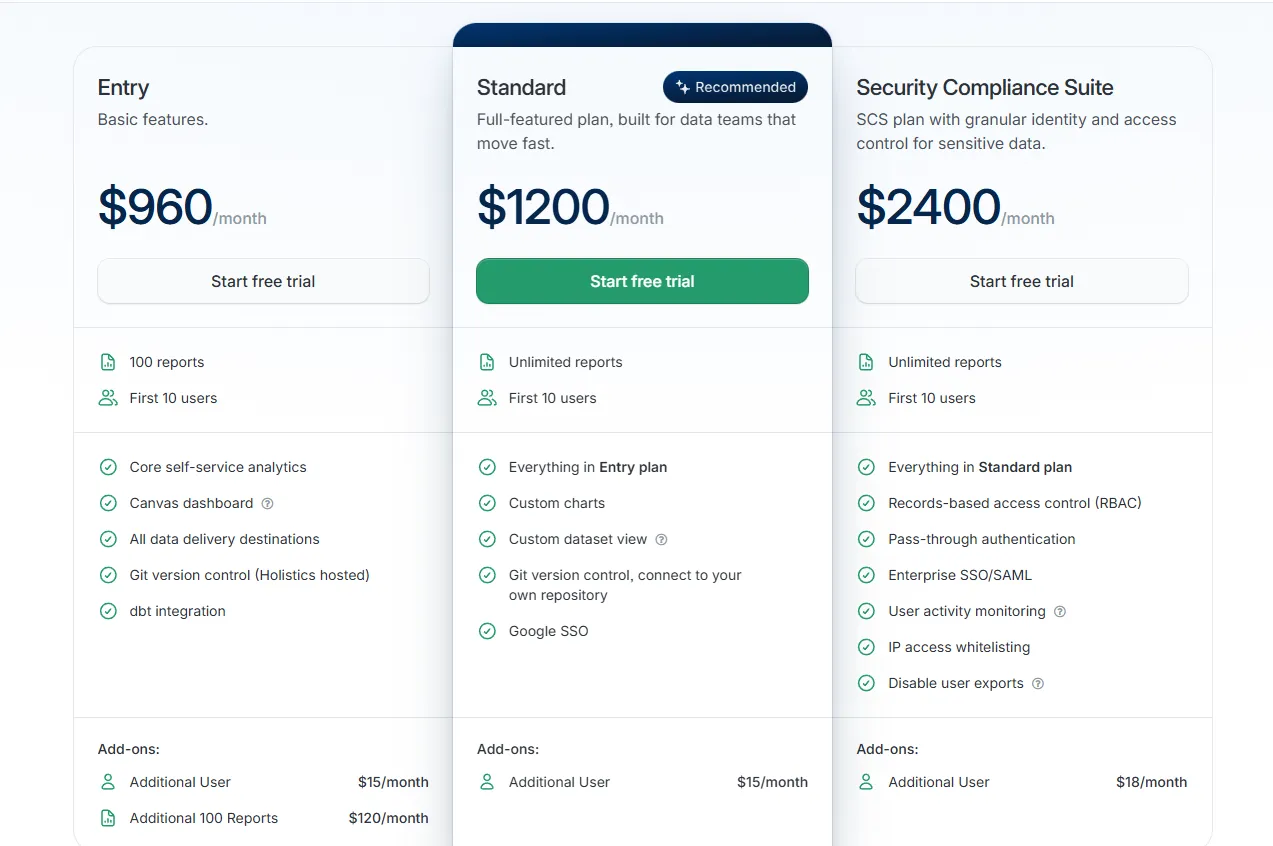
Holistics uses a tiered pricing model based on reports and users, with add-ons for security and scale:
- Entry: $960/month, includes 100 reports, 10 users, core self-service analytics, Canvas dashboards, all data delivery destinations, Holistics-hosted Git version control, and dbt integration, with additional users at $15/month.
- Standard: $1,200/month, includes everything in Entry with unlimited reports, 10 users, custom charts, custom dataset views, Git connected to your own repository, and Google SSO, with additional users at $15/month.
- Security Compliance Suite: $2,400/month, includes everything in Standard with RBAC, pass-through authentication, Enterprise SSO and SAML, user activity monitoring, IP whitelisting, and export controls, with additional users at $18/month.
- Custom Plan: Tailored pricing for enterprise needs such as unlimited users, custom usage monitoring, and advanced compliance requirements.
Pros & Cons
✅ Strong semantic layer with analytics-as-code and Git version control for governed, scalable BI.
✅ Powerful dashboards with deep drill-down capabilities.
❌ Performance can feel slow with certain warehouses or complex datasets.
❌ Pricing starts at $960/month, which may be steep for smaller teams.
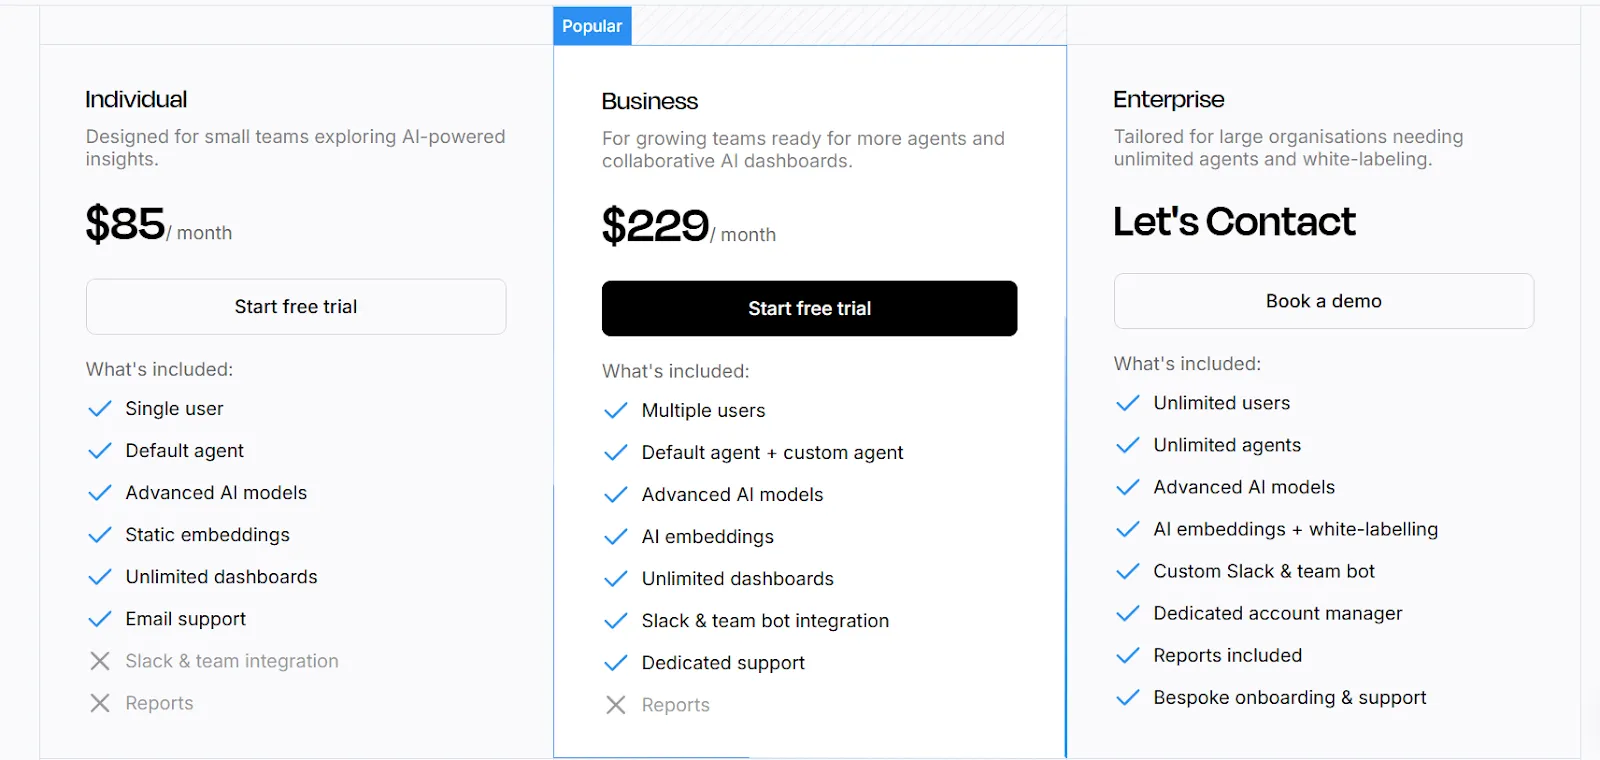
#7: Supaboard
Best for: Teams that want AI-powered BI with natural-language analytics and no-code dashboards instead of traditional modeling workflows.
Similar to: Zenlytic, ThoughtSpot.
Supaboard is an AI-driven analytics platform that connects to your data sources and automatically generates dashboards, insights, and reports without requiring SQL or complex setup.
It focuses on speed and simplicity, allowing business users to ask questions in plain English and get instant visual answers.
Features
- Trainable AI agents: Create AI agents trained on your business logic, rules, and definitions to deliver context-aware insights without building or maintaining data models.
- Natural language data chat: Ask questions in natural language and instantly receive metrics, charts, explanations, and recommended actions.
- AI-generated real-time dashboards: Describe what you need and Supaboard automatically builds interactive dashboards, KPIs, and tables that update live.
Pricing
Supaboard offers tiered pricing designed to scale from individual users to large enterprises:
- Individual: $85/month, includes a single user, default AI agent, advanced AI models, static embeddings, unlimited dashboards, and email support.
- Business: $229/month, includes everything in Individual with multiple users, custom agents, AI embeddings, Slack and team bot integration, and dedicated support.
- Enterprise: Custom pricing, includes everything in Business with unlimited users and agents, AI embeddings with white-labeling, custom integrations, a dedicated account manager, and bespoke onboarding.
Pros & Cons
✅ Easy to connect data sources and get started quickly.
✅ Natural-language querying makes data analysis accessible to non-technical team members.
❌ Limited dashboard customization compared to traditional BI tools.
❌ Relatively new platform, so the feature set is still maturing.
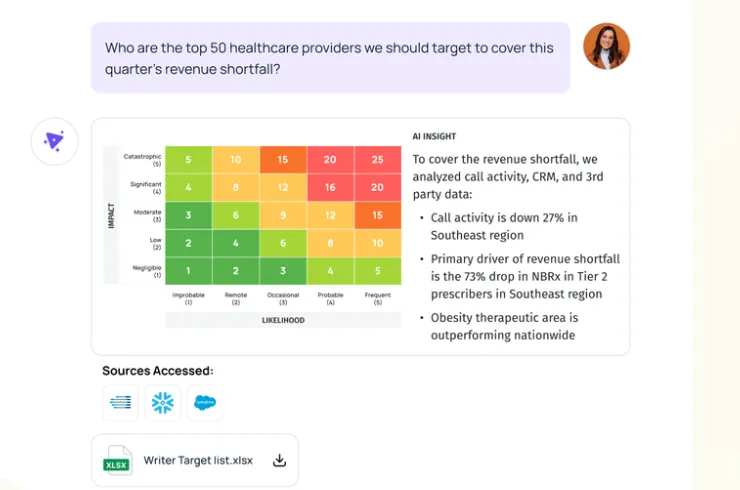
#8: Tellius
Best for: Business and analytics teams that need fast, explainable answers to complex business questions without relying on dashboards or constant analyst support.
Similar to: ThoughtSpot, DataGPT.
Tellius is an AI-powered analytics platform that lets anyone ask natural-language questions across enterprise data and get instant answers backed by automated root cause and key driver analysis.
It combines conversational analytics with explainable AI insights to move teams from dashboards to decisions faster.
Features
- Conversational interface: A ChatGPT-like interface on top of governed enterprise data that lets users ask complex business questions in natural language and receive context-aware answers.
- AI insights: Automatically uncovers root causes, key drivers, trends, cohorts, and anomalies across billions of data points, delivering explainable insights and proactive alerts.
- Visualizations and narratives: Turns complex analyses into interactive visualizations and AI-generated narratives that let teams explore, drill down, and share insights without building traditional dashboards.
Pricing
Tellius has two pricing plans, both with custom pricing:
- Premium: Custom pricing for up to 10 users, includes conversational analytics, guided insights, search-driven ad-hoc visualizations, Vizpads for sharing insights, live queries to cloud data warehouses, data prep across cloud apps and databases, up to 50M rows in live mode, 10GB storage, and fully hosted deployment.
- Enterprise: Custom pricing with unlimited users, includes everything in Premium with automated machine learning modeling, SAML and SSO, API access, embedding and white-labeling, unlimited data scale, and flexible deployment options.
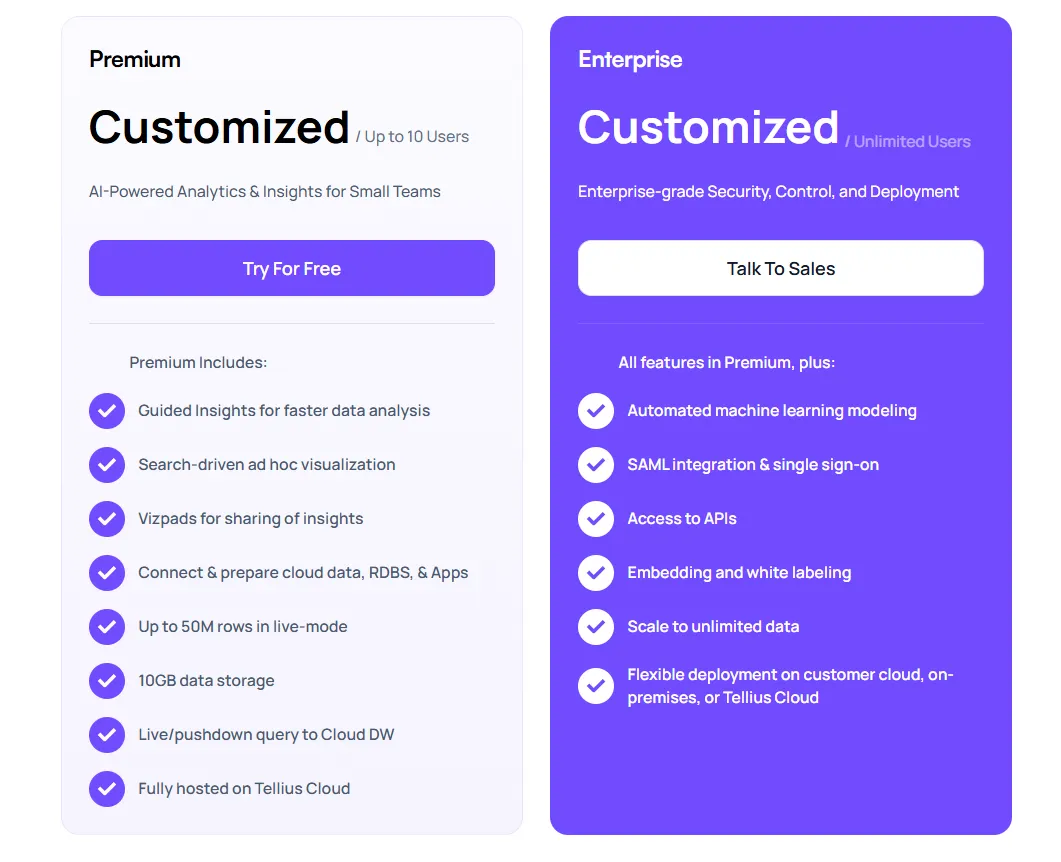
You must contact Tellius sales for actual pricing numbers.
Pros & Cons
✅ Intuitive, visual-first interface.
✅ Strong AI-powered insights and advanced analytics capabilities.
❌ Pricing can be prohibitive for smaller teams.
❌ Requires clean, well-structured data to produce reliable automated insights.
#9: Metabase
Best for: Startups, product teams, and data-lean organizations that want fast, self-serve analytics without enterprise BI complexity.
Similar to: Holistics, Mode.
Metabase is an open-source analytics platform that makes it easy for teams to explore data, build dashboards, and share insights without deep technical expertise.
It supports both no-code query building and SQL for advanced users, making it flexible across skill levels.
Features
- Visual query builder: Explore data through a step-by-step visual interface that lets users filter, join, summarize, and visualize data without writing SQL.
- AI-assisted data querying: Metabot AI lets users ask questions in plain English and generates queries and visualizations to speed up data exploration.
- Drill-through exploration: Click directly on charts to zoom in, filter, break out data, or view underlying records, so users can explore why something changed without writing a new query.
Pricing
Metabase offers two pricing options depending on how you use the product: internal business intelligence or customer-facing embedded analytics.
- Business Intelligence:
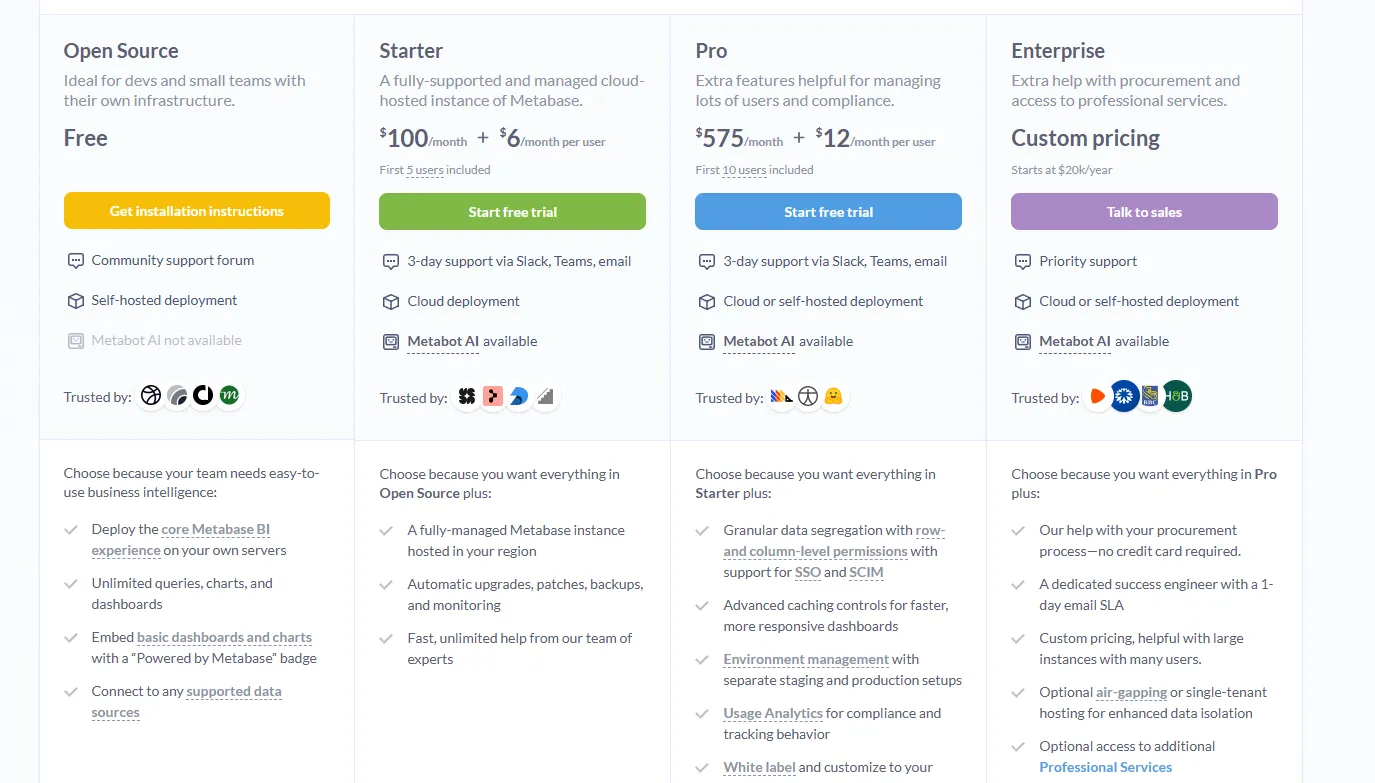
- Open Source (Self-hosted): Free, self-hosted deployment, includes unlimited queries, charts, and dashboards, connects to all supported data sources, basic embedding with “Powered by Metabase” branding, community support only.
- Starter (Cloud-hosted): $100/month + $6/user/month, first 5 users included, includes everything in Open Source, plus option to include Metabot AI (charged extra), automatic upgrades, backups, and monitoring, support via Slack, Teams, and email (3-day SLA).
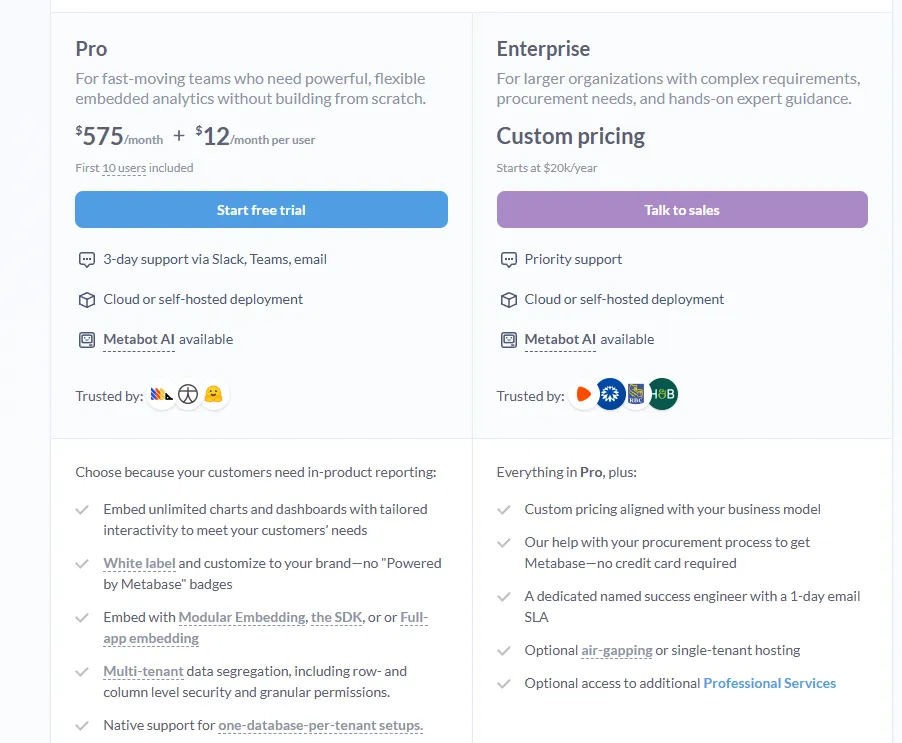
- Pro: $575/month + $12/user/month, first 10 users included, cloud or self-hosted deployment, includes everything in Starter, plus row- and column-level permissions, SSO and SCIM support, advanced caching and performance controls, staging + production environments, usage analytics and audit visibility, white-labeling, and embedded analytics capabilities.
- Enterprise: Custom pricing (starts at $20k/year), includes everything in Pro, plus priority support, dedicated success engineer (1-day email SLA), optional single-tenant or air-gapped deployment, and optional professional services.
- Embedded Analytics pricing:
- Pro: $575/month + $12/user/month, first 10 users included, includes unlimited embedded dashboards and charts, full white-labeling, modular embedding, SDK, or full-app embedding, multi-tenant security (row- and column-level), one-database-per-tenant support, staging + production environments, usage analytics, internal BI for your team, and option to include Metabot AI (charged extra).
- Enterprise: Custom pricing (starts at $20k/year), includes everything in Pro, plus a dedicated success engineer, priority support, optional single-tenant or air-gapped hosting, and optional professional services.
Pros & Cons
✅ Easy to use for both technical and non-technical users.
✅ Fast setup and lightweight deployment, especially the open-source version.
❌ AI assistance is still basic compared to purpose-built conversational analytics platforms.
❌ Advanced security and governance features are locked behind the Pro and Enterprise tiers, which is why some lower-budget teams have been looking for Metabase alternatives.
#10: Microsoft Power BI
Best for: Organizations already invested in the Microsoft ecosystem that want standardized dashboards, reporting, and self-service analytics at scale.
Similar to: Tableau, Qlik Sense.
Power BI is a BI platform for creating interactive dashboards, reports, and visualizations on top of structured data sources.
It focuses on standardized reporting and broad organizational adoption, with analytics built around predefined models and visual dashboards.
Features
- Interactive dashboards and reports: Build interactive dashboards and reports that combine multiple visuals, filters, and drill-downs to explore data across teams.
- Enterprise governance and security: Role-based access control, row-level security, data sensitivity labels, and Microsoft Entra ID integration help organizations manage access and compliance at scale.
- AI-assisted insights: Offers AI features such as Copilot, quick insights, forecasting, and anomaly detection to help surface patterns and trends within reports.
Pricing
Power BI uses a per-user and capacity-based pricing model, with different tiers depending on how reports are created, shared, and scaled across the organization.
There’s a Free plan, best for individual users exploring data on their own, that includes building reports and dashboards for personal use, but no sharing or collaboration features.
The paid options include the following:
- Power BI Pro: $14/user/month, includes report publishing, sharing dashboards, collaboration in workspaces, and embedding in Microsoft Teams and SharePoint.
- Power BI Premium Per User: $24/user/month, includes everything in Pro, plus larger model sizes, more frequent refreshes, paginated reports, and advanced AI features.
- Power BI Embedded: Custom pricing, which lets you create customer-facing reports, dashboards, and analytics in your own applications.
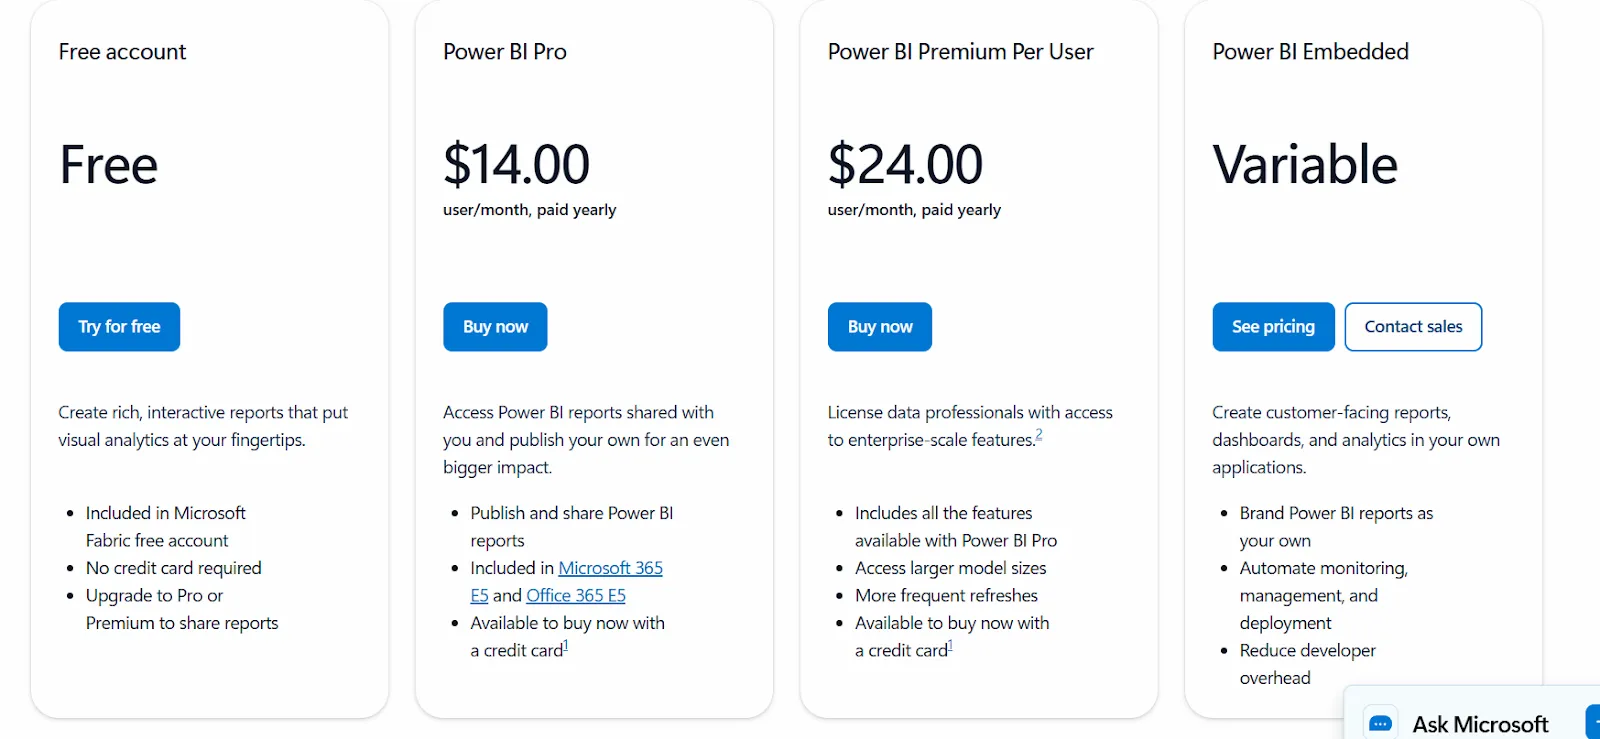
All plans are annual.
Pros & Cons
✅ Strong dashboarding and visualization at an accessible price point.
✅ Deep Microsoft ecosystem integration with Excel, Teams, Azure, and SharePoint.
❌ Key features like sharing and advanced capabilities are locked behind Premium tiers, which is why some organizations have been looking forPower BI alternatives.
Make faster, more confident decisions with Dot
If you've been evaluating Zenlytic alternatives, chances are you want analytics that go beyond dashboards and actually help your team make decisions.
Dot was built for exactly that.
Instead of asking your data team to build another report, you ask Dot a question and get a full analysis, with context, narrative, and a clear audit trail.
Here's what you'll get when you sign up:
- Access to a free plan with 300 one-time credits, full Pro features, and the ability to connect any data source and invite your team.
- Automated executive business review reports delivered on your schedule, directly from your warehouse.
- Ad-hoc analysis through Slack, Microsoft Teams, email, or the web app so insights show up where decisions happen.
- A Context Agent that maintains shared business definitions and prevents metric drift across teams.
- Full audit trail on every insight, with transparent links to underlying SQL, Python logic, and datasets.
- Unlimited users on every paid plan, so you never pay more just because more people need answers.
➡️ Get started for free with Dot's Starter plan, or schedule a demo to see how it works with your data.
Theo Tortorici
Theo writes about AI-powered analytics, data tools, and the future of business intelligence at Dot.