
10 Best Data Analysis Tools & Software In 2026
Data analysis software runs from spreadsheet grids sitting over your warehouse to modeling languages your analysts maintain, and what separates the options is how much has to exist before anyone gets an answer.
I'll review the 10 best data analysis tools of 2026, covering what each one analyzes, what it costs, who it suits, and the point where it stops being the right fit.
TL;DR
- Dot is the best data analysis tool in 2026 for teams who would sooner receive a finished written investigation than build one, delivered wherever they already work, with metric definitions governed in a single reviewable place and no seat charge on the invoice.
- Microsoft Power BI, Tableau, Qlik Sense and Zoho Analytics are packaged platforms, each bringing its own authoring environment and a large connector library, and each suiting an organization that wants its reporting from one vendor.
- Looker and Holistics both assume a data function, and Apache Superset assumes an engineering one, so someone has to define the models and the joins, or stand up the infrastructure, before business users can serve themselves.
- Sigma and Metabase ask the least of you up front: Sigma through a spreadsheet grid over live warehouse data and Metabase through a database connection and a visual query builder.
What are the best data analysis tools in 2026?
The best data analysis tool in 2026 is Dot, which investigates a question against your warehouse and returns written findings through Slack, Microsoft Teams, email or its own web app, followed by Microsoft Power BI for organizations already licensed for it and Tableau for depth of visual analysis.
The table below pairs each tool with its buyer and its price:
Tool | Use case | Price |
Dot | Turns a business question into an investigation across your warehouse and reports back in prose with recommendations. | Free plan; Pro from $180/month. |
Microsoft Power BI | Reporting and analysis inside a stack a Microsoft-licensed organization already pays for. | Free tier; Pro at $14/user/month. |
Tableau | Exploratory visual analysis for trained analysts, with a large read-only audience served cheaply. | From $15/user/month (Viewer), annual. |
Looker | One governed metric definition that every dashboard and embedded view resolves against. | Quoted by sales; annual commitment. |
Qlik Sense | Free-form exploration through an associative engine, billed on data volume above the entry tier. | Starter from $300/month, annual. |
Sigma | A spreadsheet grid running live on warehouse data for finance and operations teams. | Pricing not published. |
Metabase | Fast self-serve dashboards for teams without a dedicated data engineer. | Open source free; Starter $100/month plus $6/user. |
Zoho Analytics | Published, low-cost BI with a deep library of business app connectors. | Free plan; Basic from $30/month. |
Apache Superset | Self-hosted, license-free BI with a full SQL IDE for engineering-led teams. | Free (Apache 2.0); Preset hosting from $0. |
Holistics | A semantic layer written as code and reviewed through pull requests before release. | Entry from $960/month ($800 annually). |
I applied four filters when building the shortlist:
- It has to run on your own company data: Charting a one-off uploaded spreadsheet didn't qualify, and every product here connects to your databases or warehouse, whether it queries them live or syncs on a schedule.
- Charting alone didn't qualify: Drawing the chart is the easy half of analysis, so each tool here supports modeling, drill-down, statistical work or written findings on top of the visualization.
- The cost has to be explainable: Published rates won out, though a meter I could document honestly also passed.
- Availability had to be real: Nothing here is a roadmap promise, and where a specific feature is still in beta I've said so in the relevant section.
➡️ A note on scope: I left spreadsheet software and programming libraries off the list.
#1: Dot
Dot offers the best data analysis tool on the market for data teams buried under ad-hoc requests, as what comes back is a finished written investigation, the definitions it reasons from are maintained in one place your team controls, and the invoice counts analysis performed, never headcount.
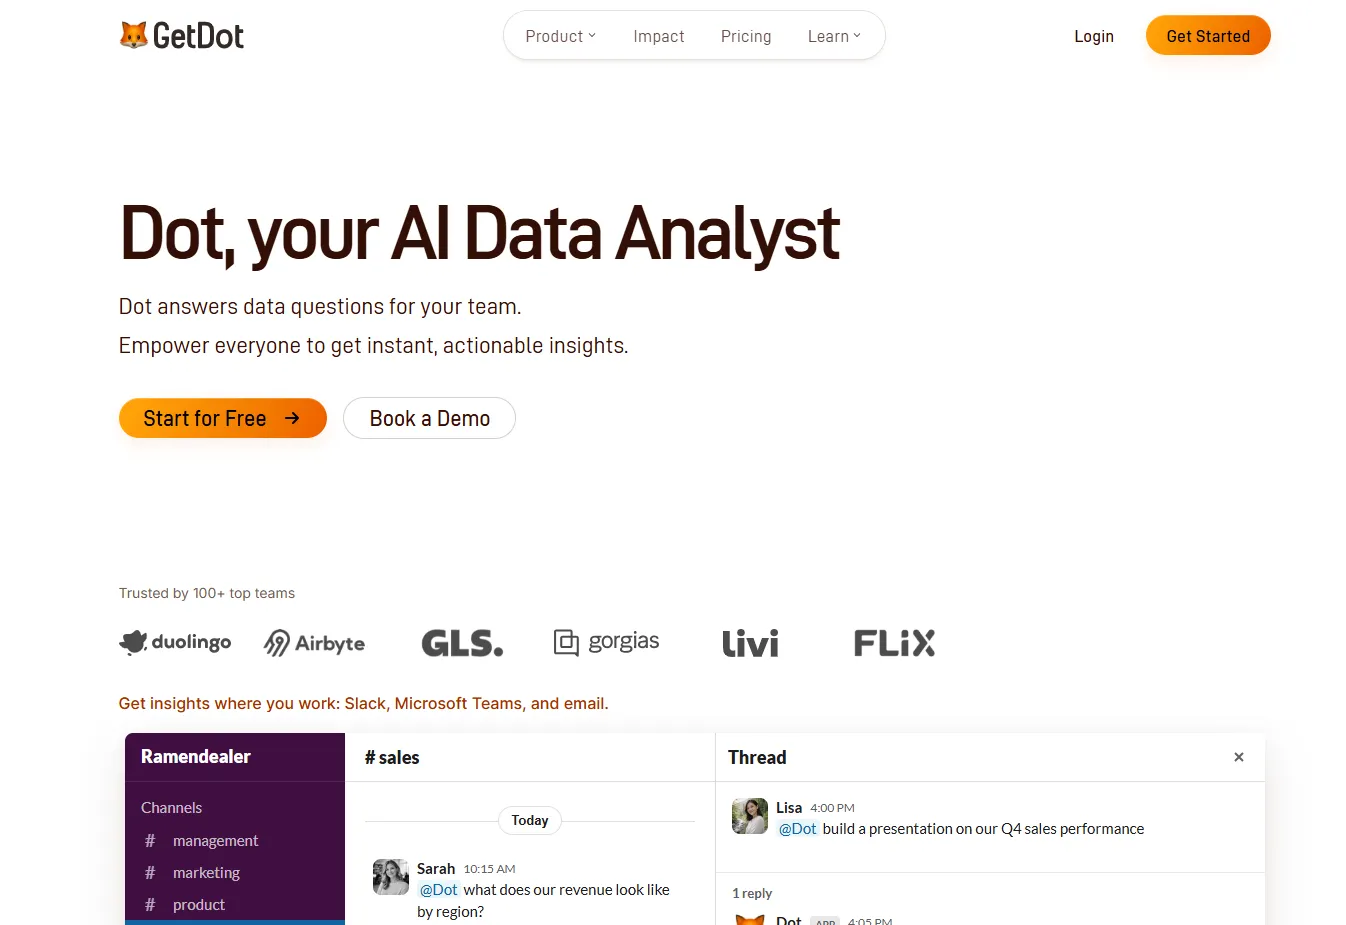
Disclaimer: This is our own product, so weigh the section accordingly, though the case for the top spot still has to be argued, and that is what follows.
Every other product on this list hands you somewhere to do the analysis yourself, whether that turns out to be a grid, a canvas, a modeling language or a SQL editor, and all of them assume you will show up to use it.
We built Dot on the opposite assumption, which is that most of the people with questions are never going to open any of those tools, so your data team describes the business once and Dot writes the analysis for everybody else.
Four parts of the product carry that: 👇
Dot connects to your warehouse and learns your definitions before it answers anything
Setup begins under Settings and Connections, where you point Dot at the systems already holding your numbers.
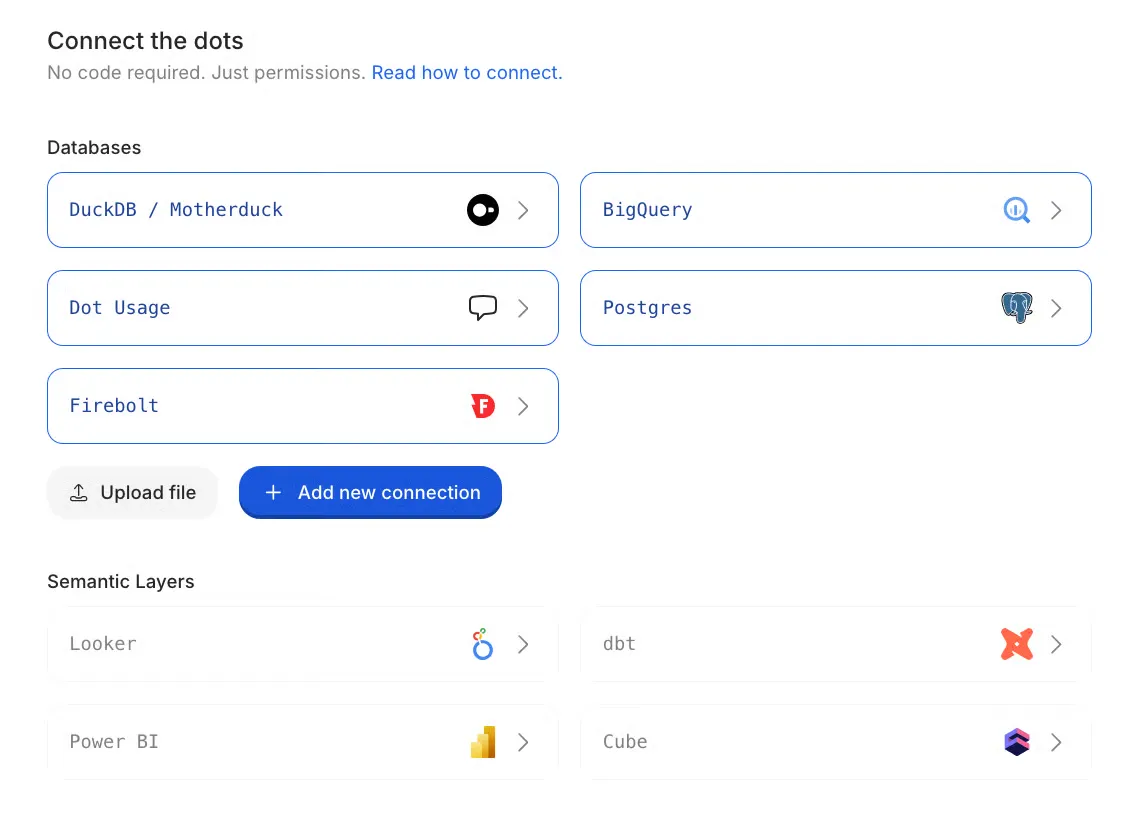
More than a dozen databases are well-documented, with Snowflake, BigQuery, Redshift, Databricks, Postgres and ClickHouse among them, alongside Oracle, SAP HANA, Microsoft Fabric, Firebolt and MotherDuck.
Seven semantic layers connect too: dbt, Power BI, Azure Analysis Services, Looker, Malloy, Steep and Cube.
Permissions are the only prerequisite, and no code changes hands.
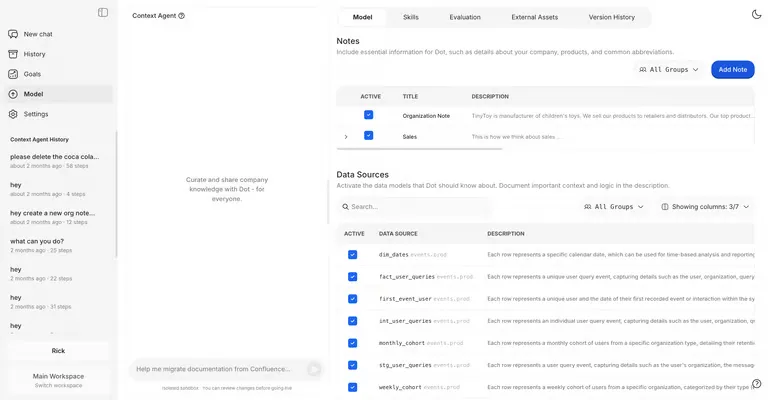
From there, your data team shapes what Dot is allowed to know on the Model page:
- Pick the tables and the fields: Dot searches only what you select, table by table and column by column.
- Generate the descriptions: A suggest button drafts documentation and pulls real sample values, which your analysts then correct.
- Declare the relationships: Foreign key references get specified per table, composite keys included, keeping Dot clear of join fan-outs and the chasm trap when a question crosses several tables.
- Write down what the schema can't hold: Four note types cover that: organization background, agent operating principles phrased as hard rules such as "always filter out internal users", playbooks capturing how your team reviews a recurring analysis, and a metric glossary tying each KPI to the query that produces it.
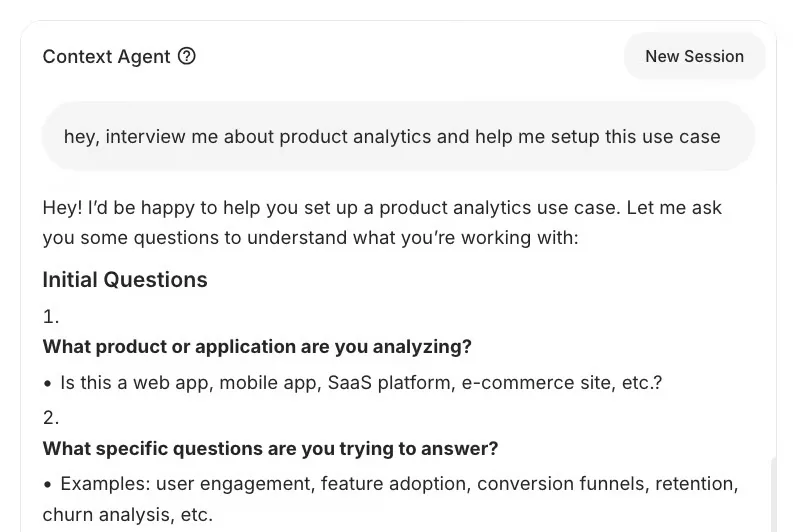
Almost nobody writes that documentation by hand, which is what Root exists for.
Root is our Context Agent, and it drafts the knowledge base by reading systems you already have.
It runs SELECT queries against your databases and reads your BI dashboards through their APIs.
Past Dot conversations give it usage patterns to learn from, and it can edit your existing notes in place.
Given access to the five Metabase dashboards your team trusts most, Root will produce a metric glossary from them, lifting the calculations and filters buried inside into standardized definitions.
And the best part? All of that happens inside a sandbox.
You approve each tool call as Root works, read the diff at the end, then merge or throw the session away, with git versioning underneath so nothing is lost if you stop halfway.
Questions get answered in Slack, Microsoft Teams, email or the Dot web app
Quick lookups and full investigations start the same way, since Dot reads the question and decides how much work it needs, wherever the question arrives.
A question about supplier revenue in euros for July 2024 across regions two and three returns the figure, a chart where the question called for one, and the SQL Dot wrote to get there.
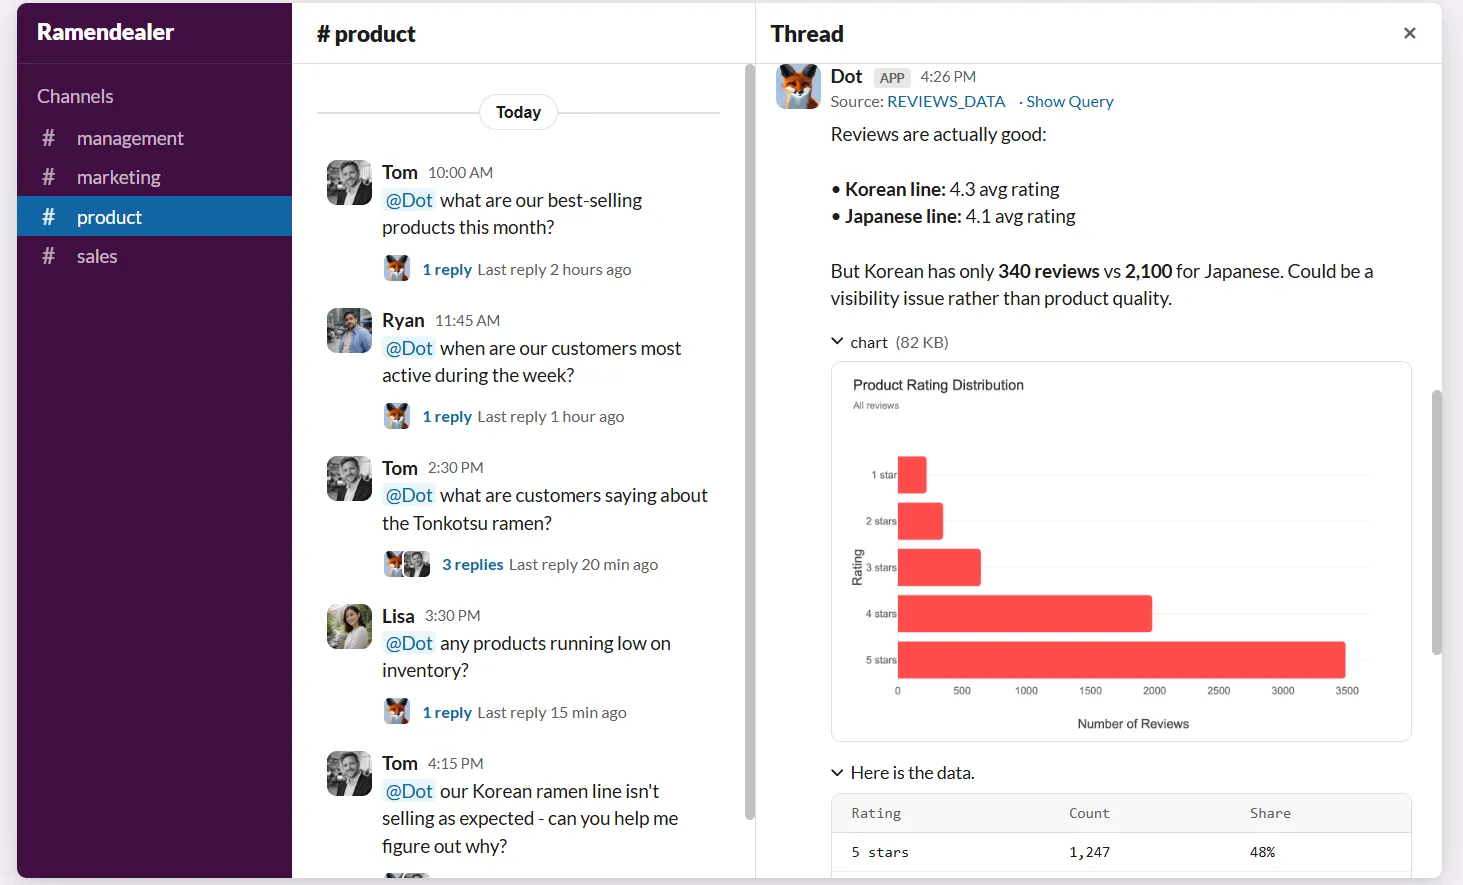
What counts here is the grounding, not the speed, because every number Dot reports traces back to a query on your connected data that you can open and check.
Misses do happen, and the recovery path is worth knowing.
Two words, "try again", push Dot down a different route, because the models underneath are statistical and a second attempt frequently succeeds.
The feedback buttons then do real work:
- Thumbs up promotes a query: The generated SQL gets stored for reuse on similar questions, pending an admin selecting it on the Model page.
- Thumbs down marks a gap: Admins learn which part of the knowledge base came up short.
- History keeps the tally: Conversations carrying a dislike are labeled problems and liked ones are labeled successes, so admins see where Dot is weak without reading every thread.
Deep Analysis returns a written investigation with the queries attached
Deep Analysis is our research mode, and it replaces one query with an autonomous multi-step investigation.
For a question about what's driving an increase in churn, Dot plans a sequence of queries, checks what each one returns, and only then writes.
Nothing is hidden while that runs, since every query and tool call appears on screen as it happens, and most investigations close inside one to five minutes.
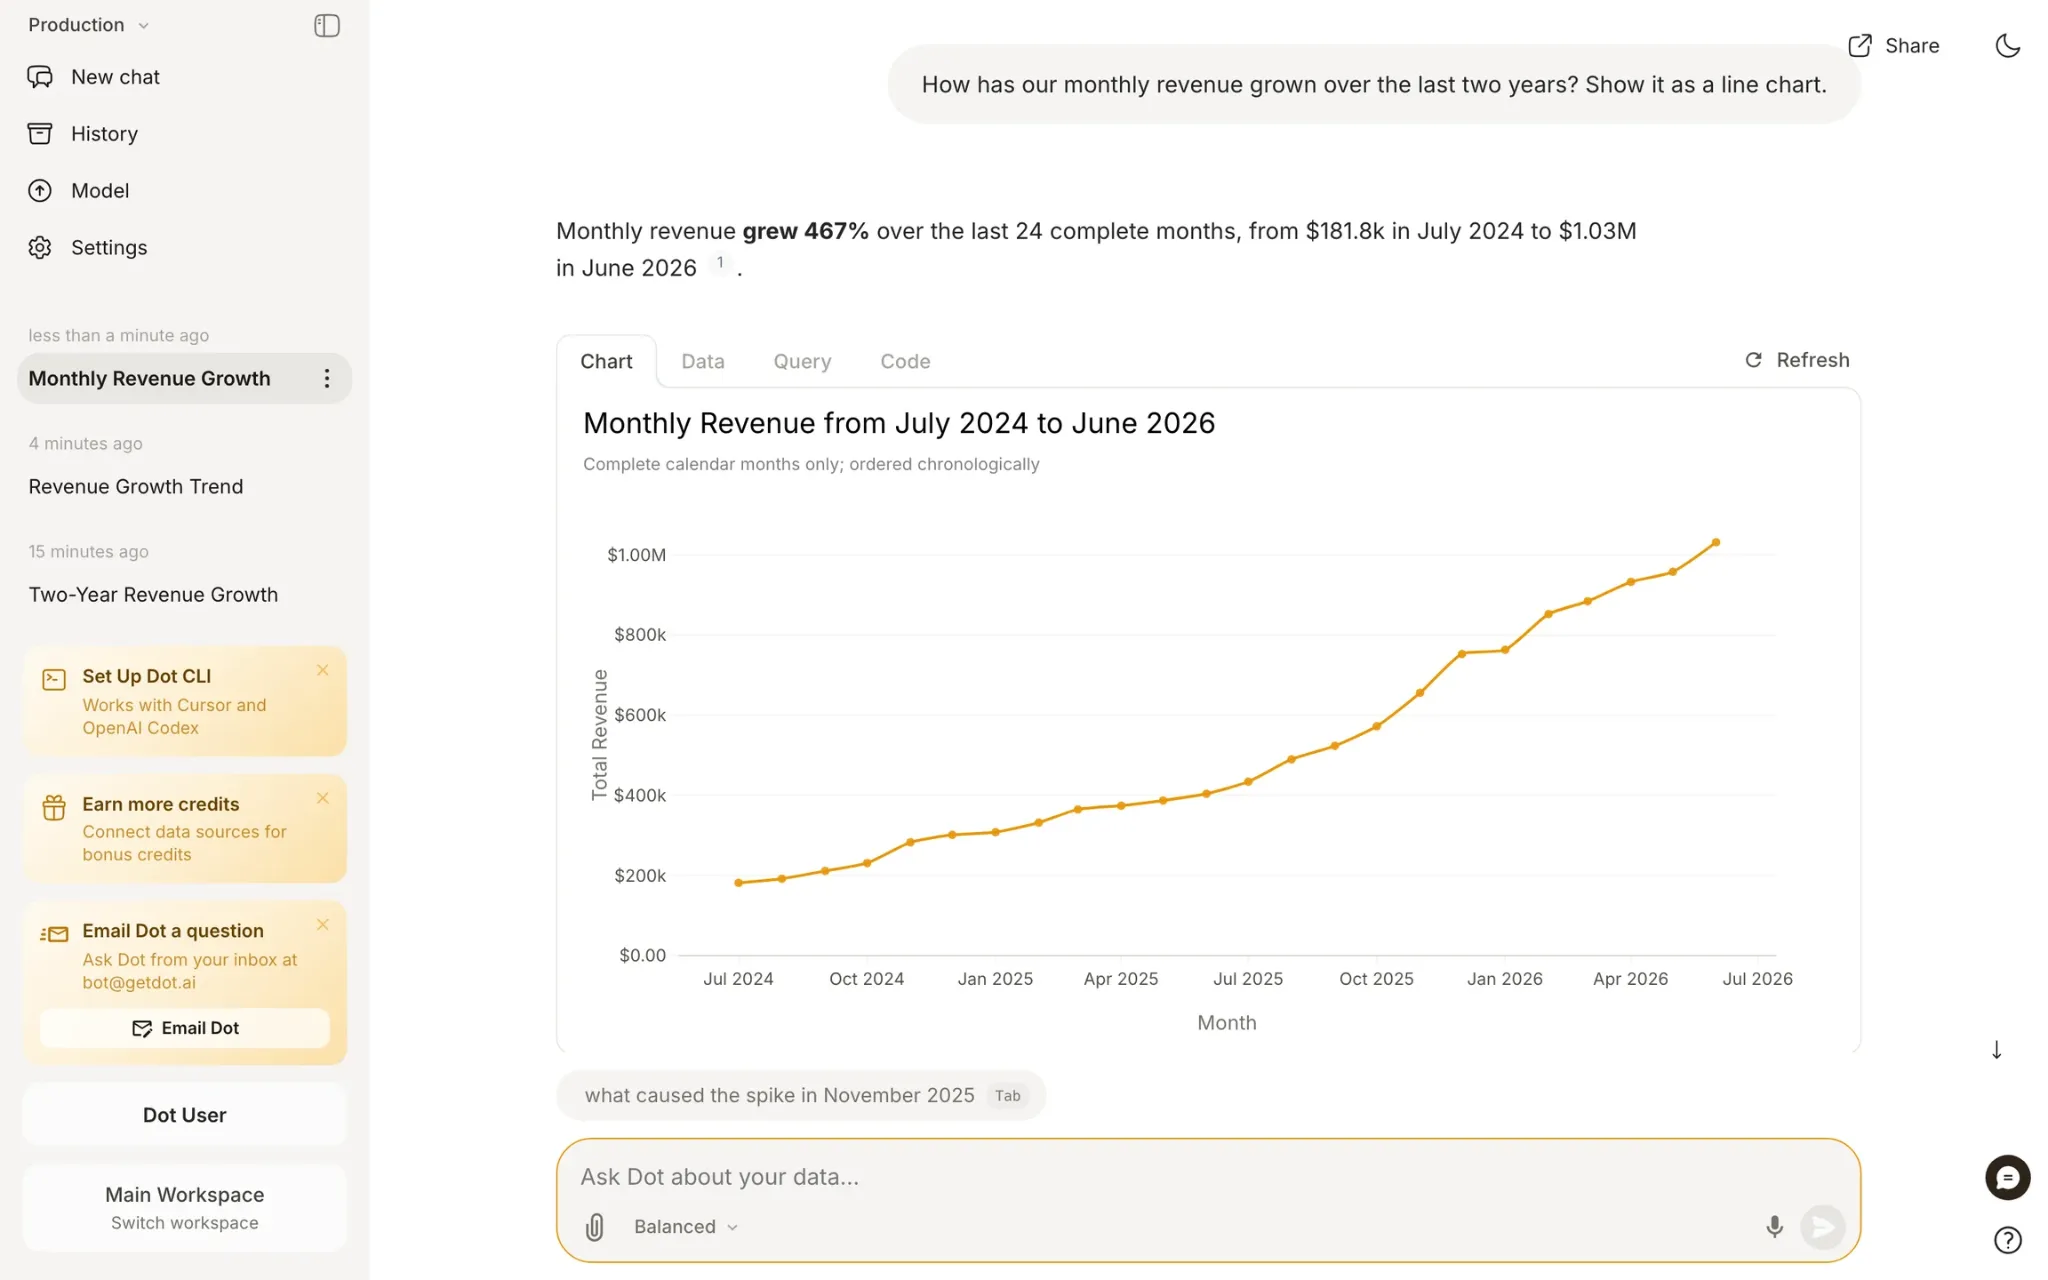
The report follows the same structure every time:
- The finding: One quantified result leads the report, with an executive summary of the key insights underneath it.
- Supporting sections: Charts and tables carry the detail, each claim footnoted to the data behind it, so a skeptical reader checks a number without emailing anyone.
- Recommendations: Written as next steps, not as observations left for somebody else to act on.
- Assumptions: A closing block naming the periods and definitions applied, with the caveats attached to them.
Follow-up questions continue the same investigation, which means "drill deeper into EMEA" restarts nothing.
Finished analyses leave as PowerPoint through a Download as Presentation button, or as a shareable link for colleagues who'd sooner read in a browser.
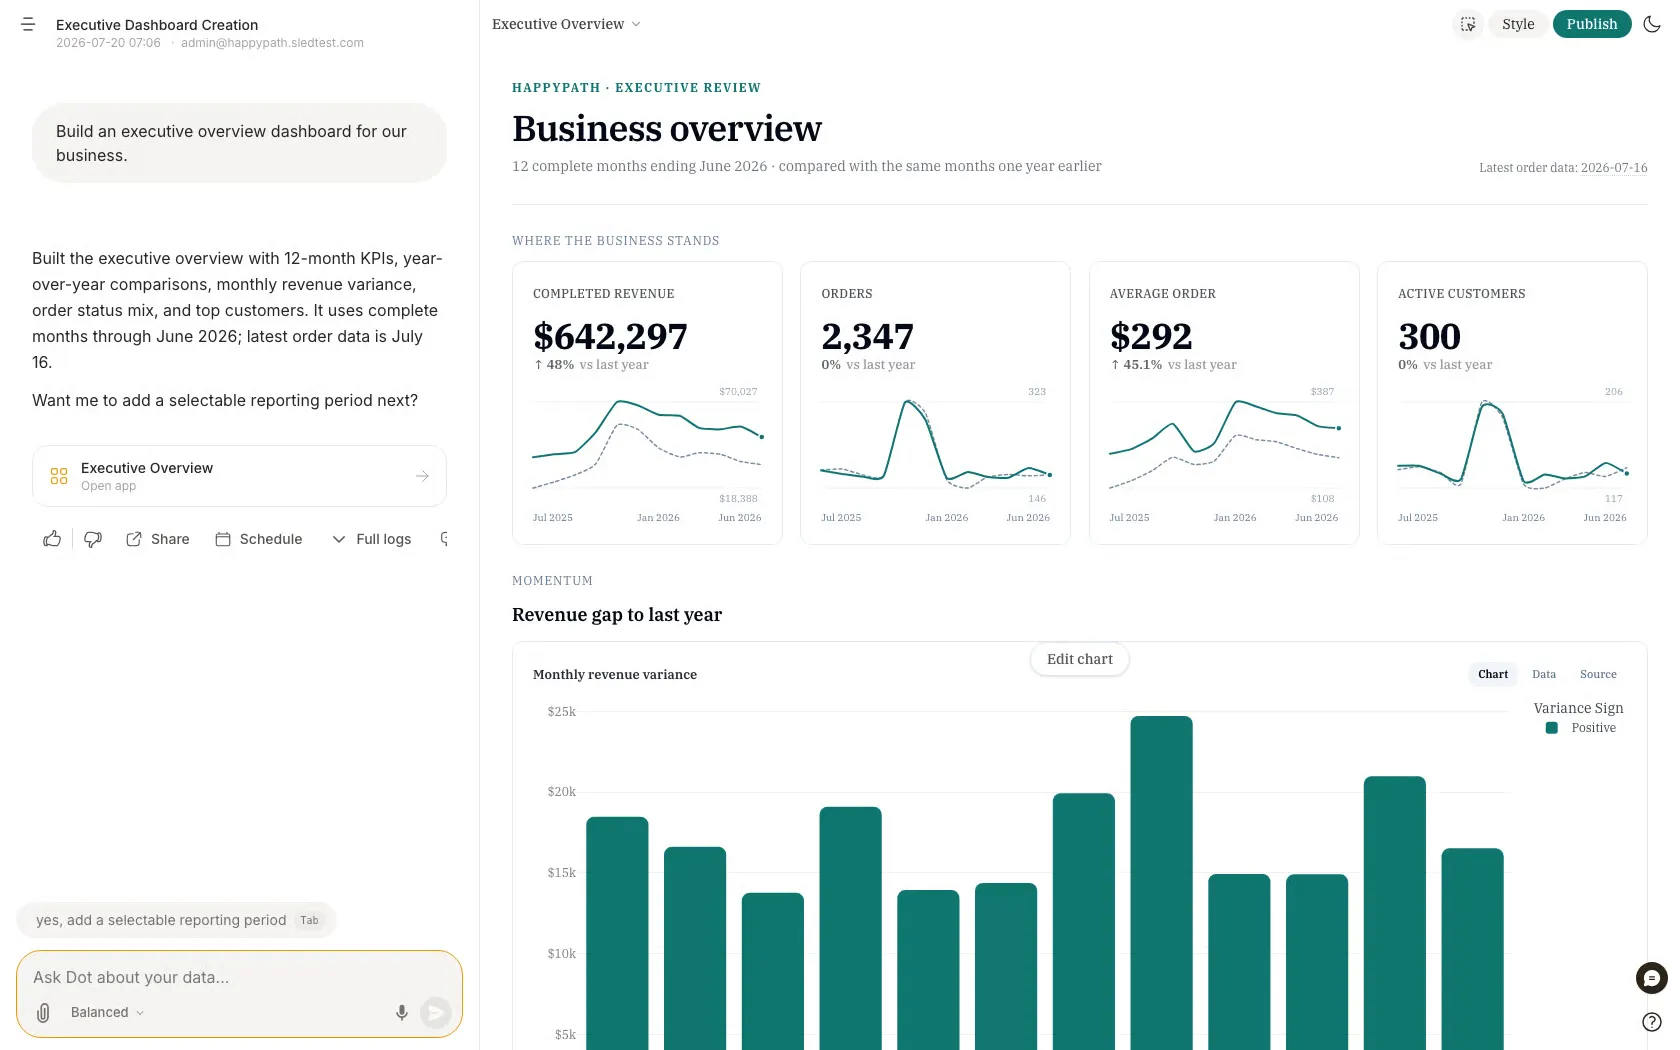
Admins can set the workspace's default Energy Mode, from Economy up to Frontier, and lock it for everyone, while a custom appendix on the Model page adds your own disclaimer to every answer.
💡 Custom Skills can put your own Python inside an investigation, which covers the cases where an answer needs a system your warehouse doesn't contain.
Recurring delivery and who is allowed to see what
Scheduling promotes a Deep Analysis you've already run into a recurring one.
Email is one destination, and Slack and Microsoft Teams are the others.
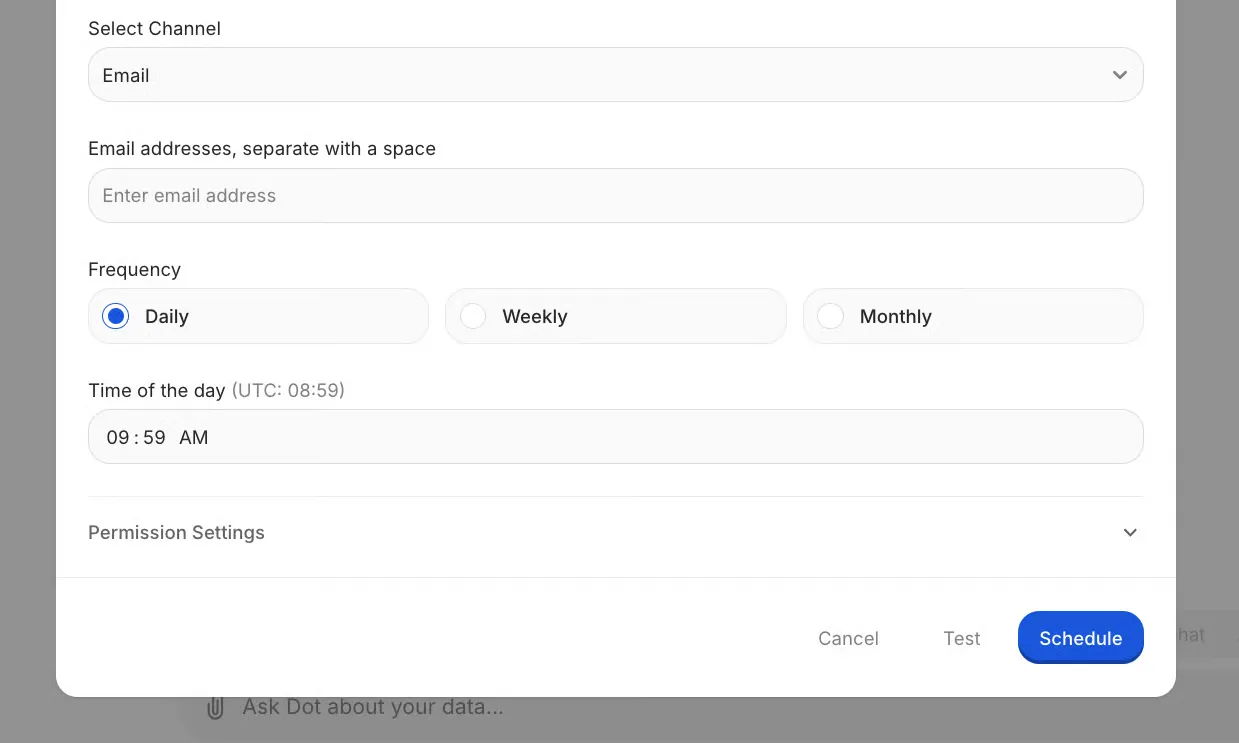
Frequencies run daily through monthly; weekly deliveries land on a day you nominate, and a Test button shows you the output before anyone else sees it.
Each run draws 1 Agent Compute Credit, and twice a day is the ceiling.
Admins can also run a schedule as a particular user, in which case the report obeys that person's data permissions and not the scheduler's.
Access itself is governed through groups:
- Membership is what grants access: if a table belongs to a group you're in, you can query it.
- New tables and new users both default into all_users, and an admin can switch that automatic assignment off for a need-to-know organization. Those same groups drive row-level filtering, which is a Team tier feature.
- Switched on for a table, the filter takes a where clause holding the ${groupname} placeholder, which gets swapped for the requesting user's group when the query runs.
- Workspaces take separation further, isolating users and connections from one another while billing stays in one place, and Slack or Microsoft Teams channels can be pointed at a specific workspace.
The security posture behind all of it includes SOC 2 Type II, role-based access, row-level security, and a full SQL audit trail on every answer.
What makes Dot different from the other data analysis tools?
Dot differs in two places: the rest of this list bills for inputs while Dot bills for output, and the rest give you somewhere to build an analysis while Dot returns the analysis already written.
When compared against a traditional data analysis tool, the contrast runs like this:
Dimension | A traditional data analysis tool | Dot |
What comes back | A chart, dashboard, workbook or report you interpret yourself. | A written investigation with a quantified finding and recommendations, its assumptions stated. |
Who performs the analysis | A person fluent in the tool, usually an analyst. | The agent, with your data team governing the context it works from. |
Where the answer appears | Inside the tool, once somebody opens it. | Slack, Microsoft Teams, email or the web app. |
What the bill counts | Seats, capacity, rows or reports. | Analysis performed, with people uncounted on paid tiers. |
How definitions are held | Modeled per tool, then repeated wherever a second tool needs them. | One reviewable context layer, versioned and approved before production. |
Checking a figure | Open the workbook and retrace the logic yourself. | Each number links to the SQL and the model underneath it. |
What has to exist first | A dashboard or model built for the question being asked. | A connected warehouse and documented business context. |
Recurring reporting | A refreshed dashboard carrying new numbers. | A scheduled write-up explaining what changed and why. |
Dot pricing
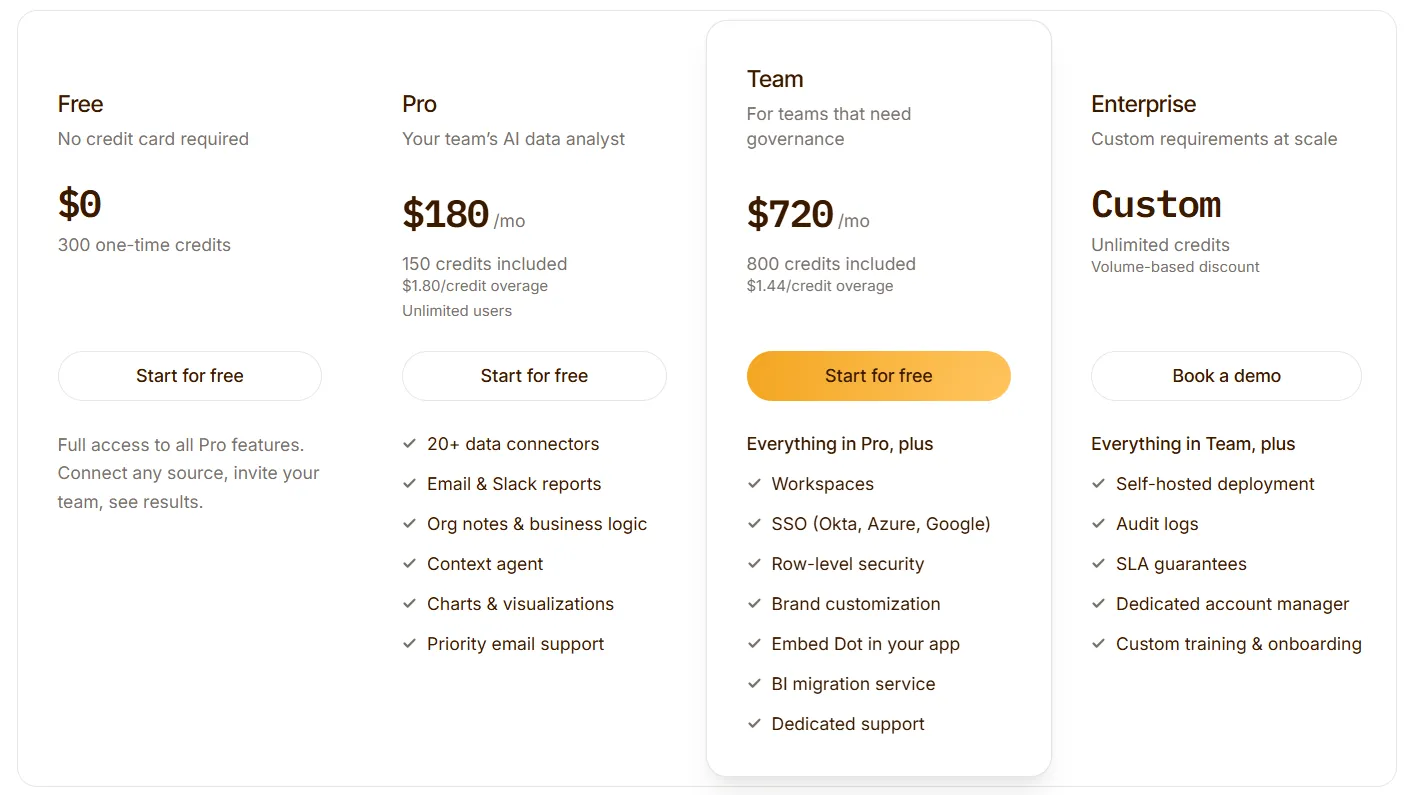
Dot's cheapest paid tier is Pro at $180 a month, and a free plan carrying 300 one-time credits comes before it.
What credits buy is analysis performed, and headcount changes nothing about the invoice.
- Free: $0, with 300 credits issued once and the full Pro feature set behind them, enough to connect a real warehouse and judge the product yourself.
- Pro: $180 a month covering 150 credits, with further credits at $1.80 each. You get the Context Agent, every documented database and semantic layer connection, scheduled delivery into email and Slack, priority support by email, and an unlimited number of users.
- Team: $720 a month covering 800 credits, with overage down to $1.44. Governance features begin with Team: single sign-on, row-level security, embedding, your own branding, a dedicated support contact, and hands-on help moving existing BI reports across.
- Enterprise: Quoted individually, with no ceiling on credits and volume rates on top. Self-hosting, audit logs, a service level agreement and a named account manager are all unlocked for Enterprise buyers.
Dot pros and cons
✅ The deliverable is a written investigation carrying a recommendation, so nobody has to interpret a chart to find the point.
✅ Any number in a report opens onto the SQL that produced it.
✅ Paid tiers count analysis, not people.
✅ Root drafts the metric glossary out of BI dashboards you already rely on, and nothing it writes reaches production without a diff and an admin approving it.
✅ A schedule can run under a colleague's permissions, so their weekly report arrives filtered the way their own access already works.
✅ 35+ data connectors including Snowflake, BigQuery, Redshift and Databricks, plus seven semantic layers such as dbt, Looker and Cube.
❌ No warehouse, no Dot.
#2: Microsoft Power BI
Best for: Organizations whose Microsoft 365 agreement already covers the analytics budget.
Similar to: Tableau, Qlik Sense.
Microsoft Power BI turns semantic models into interactive reports and dashboards, with Copilot writing DAX for authors and fielding business questions against those same models.
Microsoft Power BI's top features
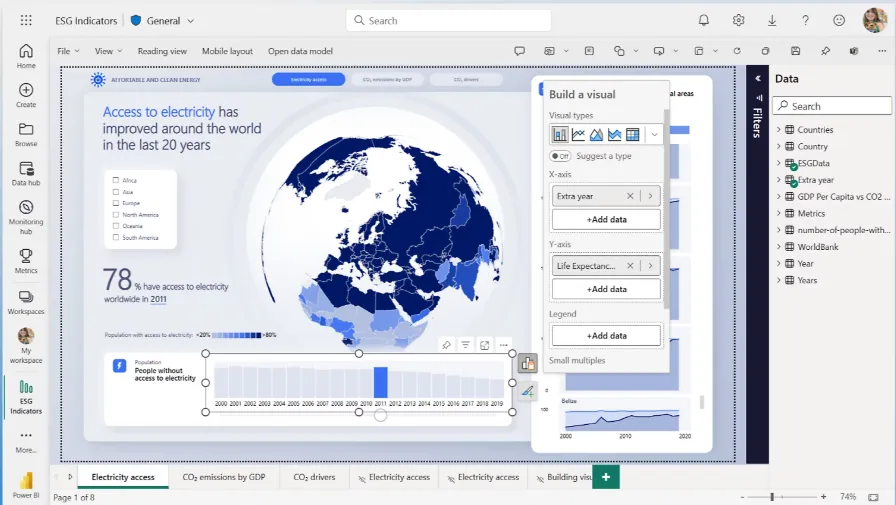
- Semantic models and DAX: Measures and hierarchies are defined once in the model, along with the field descriptions, and how carefully that work is done decides the quality of everything downstream, Copilot included.
- Copilot: Both summaries and answers resolve through the semantic model. Reaching it takes admin, member or contributor access to a workspace on F64 capacity or higher, so a Pro license on its own doesn't unlock Copilot.
- Power Query: Data gets cleaned and reshaped before it reaches the model, using the same engine Excel users already know.
- Governance at scale: Who sees which rows is set at the model, data gets tagged with sensitivity labels, and identity runs through Microsoft Entra ID.
Microsoft Power BI pricing
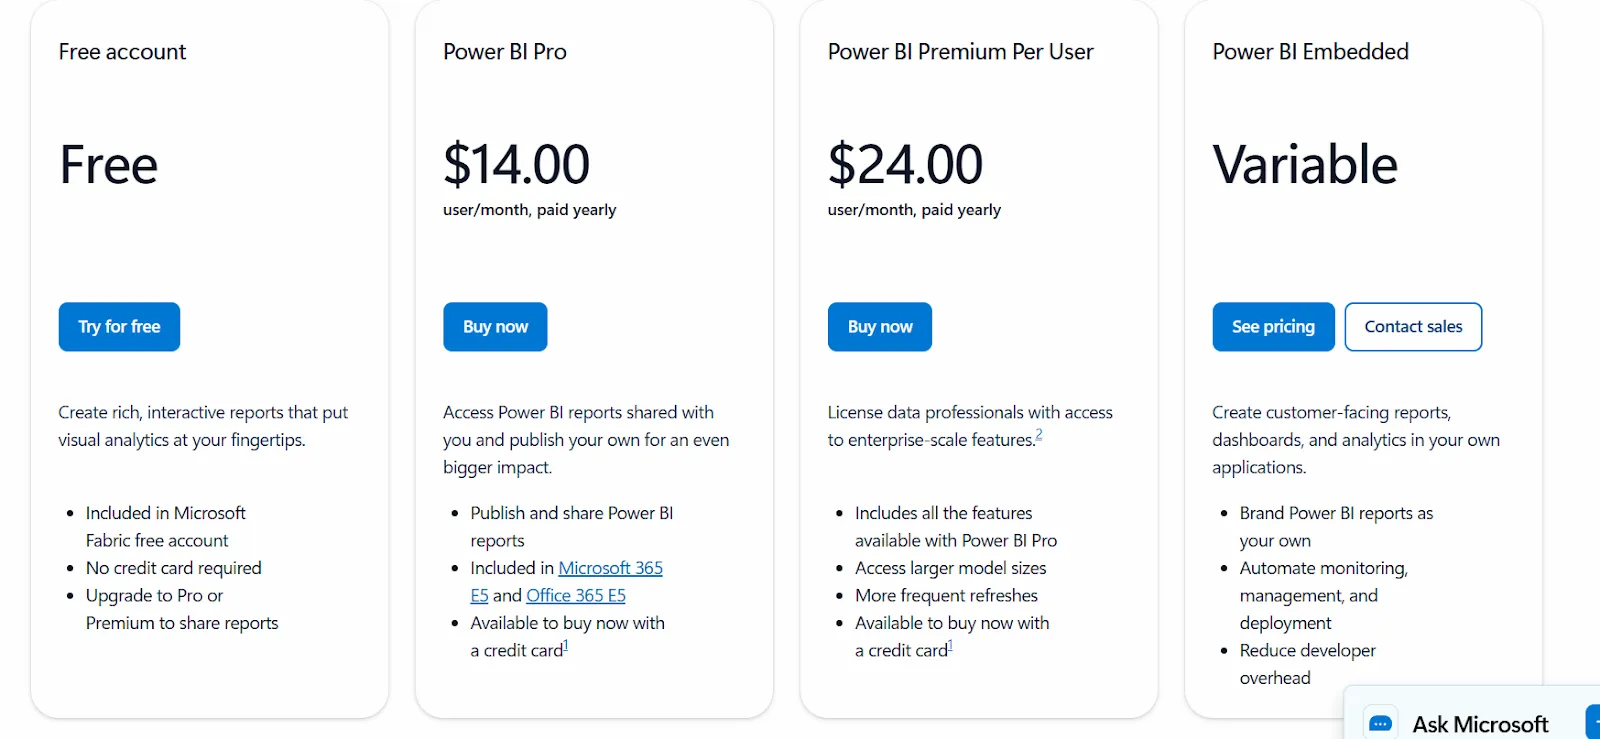
Microsoft Power BI's cheapest paid seat is Pro at $14 per user per month billed yearly, and a free tier covers one person authoring in Power BI Desktop.
- Free: Personal report building in Power BI Desktop, with nothing shareable.
- Power BI Pro: $14 per user per month, which is the tier that lets you publish, collaborate in shared workspaces and embed reports into Microsoft Teams or SharePoint.
- Power BI Premium Per User: $24 per user per month, which raises model size limits, takes refreshes up to 48 a day, and opens up paginated reports and deployment pipelines.
- Microsoft Fabric capacity: Priced on reserved compute through the F SKUs, starting near $262 a month at F2.
- Power BI Embedded: Priced separately for analytics you build into your own customer-facing software.
➡️ Our Power BI pricing guide runs the seat math on a real deployment.
Microsoft Power BI pros and cons
✅ Microsoft 365 E5 already includes a Pro license, so plenty of organizations own it without raising a purchase order.
✅ Nothing else here works as closely with Excel.
✅ Power BI Desktop is a real authoring tool at no cost.
❌ Every viewer of a shared report consumes a paid seat below Fabric F64.
❌ Copilot's usefulness depends heavily on model documentation your team has to write first.
#3: Tableau
Best for: Enterprises with trained analysts who explore data visually and a large audience that only reads the result.
Similar to: Microsoft Power BI, Qlik Sense.
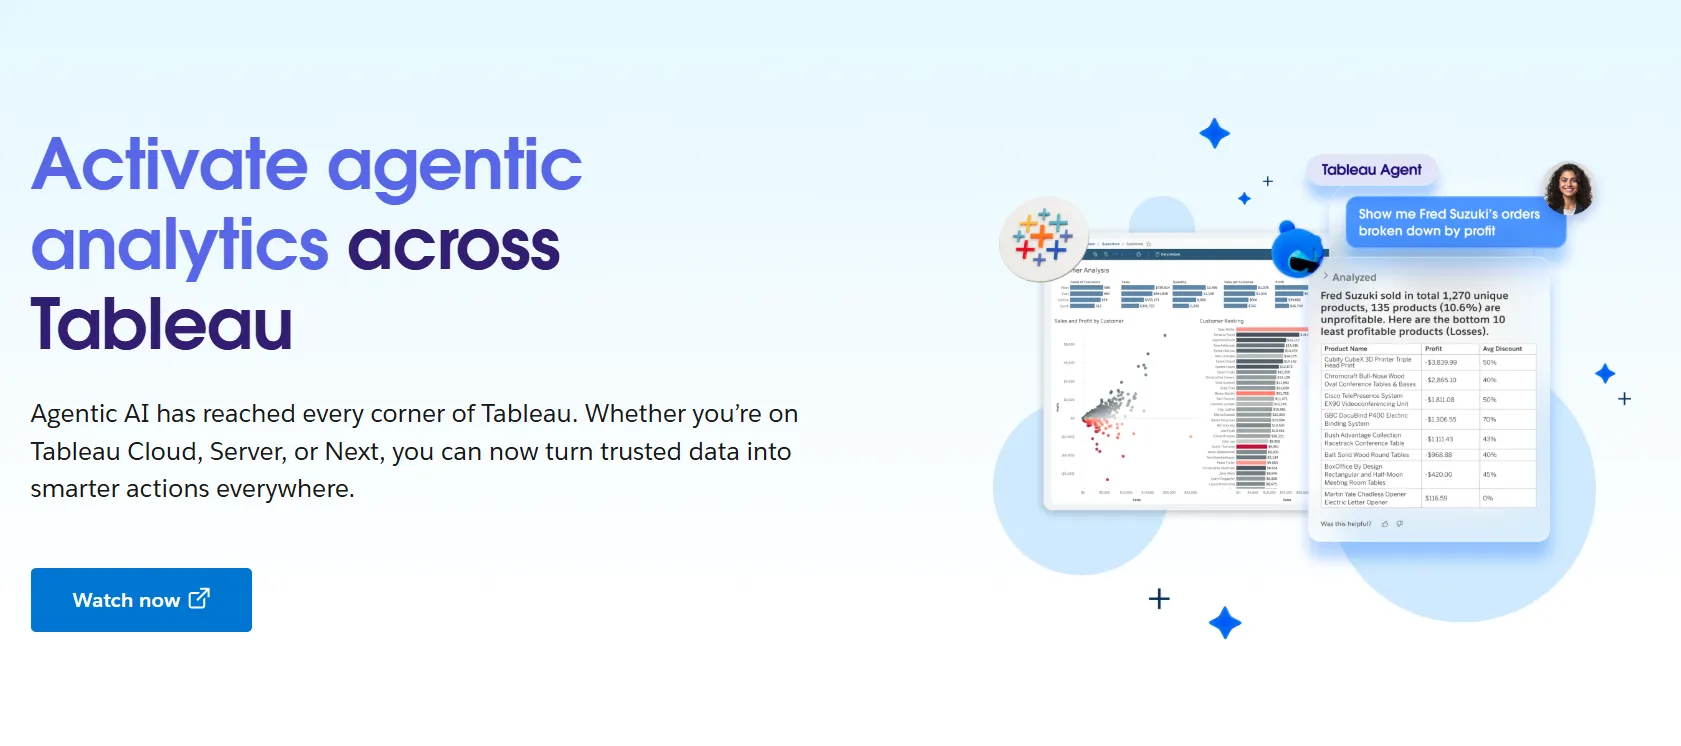
Tableau handles exploratory visual analysis through drag-and-drop authoring, with Prep for data shaping and Pulse for metric digests.
Tableau's top features
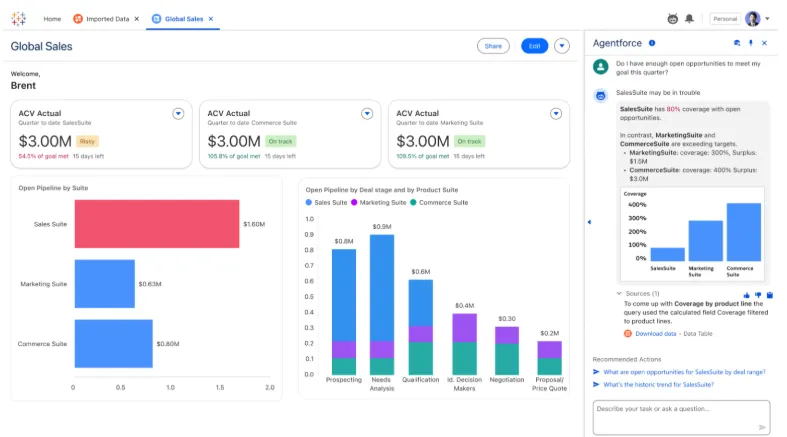
- VizQL authoring: Drag-and-drop exploration generates the query underneath, letting analysts iterate through chart types and drill-downs without writing code.
- Tableau Prep: Cleaning and joining happen in a visual flow before the data reaches a workbook.
- Tableau Pulse: Digests go out to licensed users describing movement in the numbers they follow, reaching people who seldom open a dashboard themselves.
- Tableau Semantics and Tableau Agent: A shared metric layer feeds the agentic components across Prep, Catalog, Pulse and browser authoring.
Tableau pricing
Tableau uses per-user, per-month pricing, with separate plans depending on whether you deploy Tableau in the cloud, on your own servers, or as part of its newer AI-driven offering:
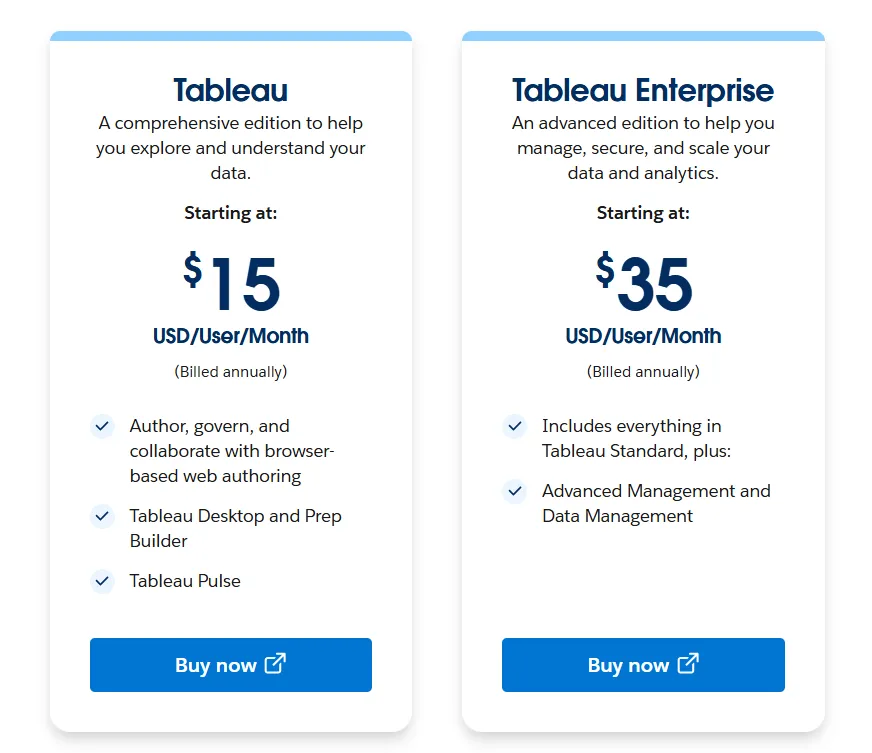
- Tableau Cloud has three pricing plans:
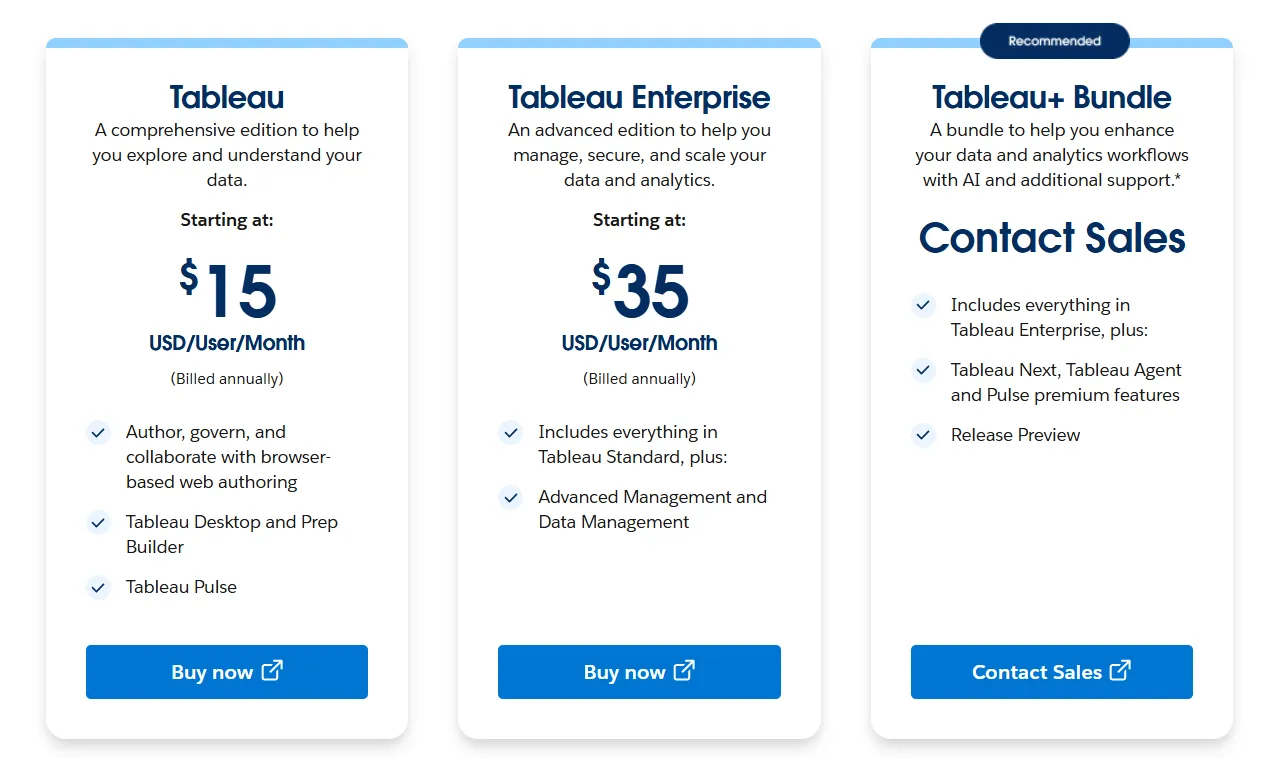
- Tableau Standard: Starts at $15/user/month, which includes browser-based authoring and collaboration, Tableau Desktop and Prep Builder, Tableau Pulse for metrics and insights.
- Tableau Enterprise: Starts at $35/user/month and includes everything in Standard, plus Advanced Management and Data Management for governance and scale.
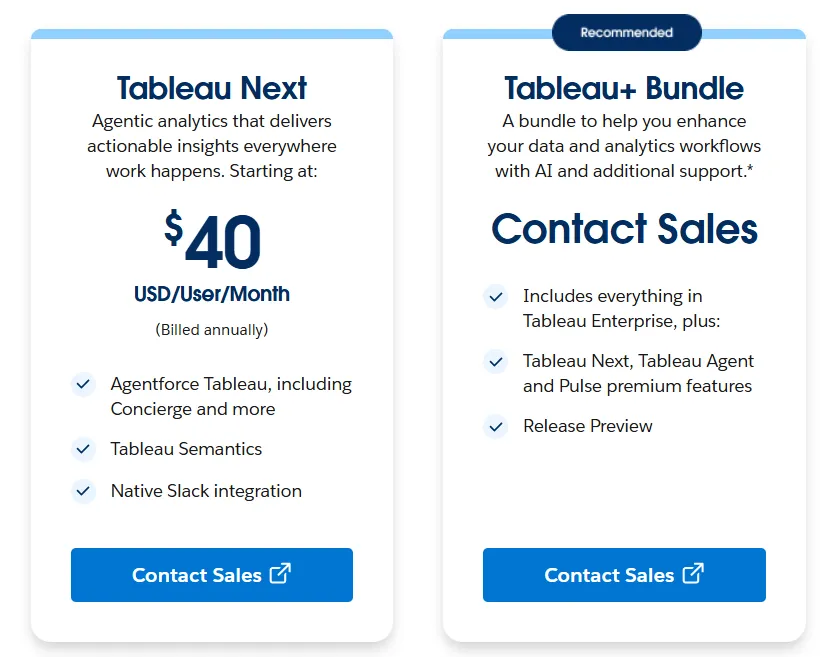
- Tableau+ Bundle (Cloud + AI): Custom pricing, includes everything in Tableau Enterprise, plus Tableau Next, Tableau Agent, and Pulse premium features, with access to release previews and early AI capabilities.
- Tableau Server has two pricing plans:
- Tableau Standard: Starts from $15 per user/month, which includes authoring, governance, and collaboration and Tableau Desktop and Prep Builder.
- Tableau Enterprise: Starts from $35 per user/month, which includes everything in Standard, plus Advanced Management, Data Management, and eLearning.
- Tableau Next (agentic analytics) has 2 plans:
- Tableau Next: Starts from $40/month/seat, and includes Agentforce Tableau, Tableau Semantics, and its Native Slack integration.
- Tableau + Bundle: Custom pricing, which includes everything in Tableau Enterprise, plus Tableau Next, Tableau Agent and Pulse premium features.
➡️ The two-axis licensing model gets worked through properly in ourTableau pricing guide.
Tableau pros and cons
✅ A large read-only audience costs $15 a head, well under the Creator rate.
✅ Exploratory charting depth that little else here matches, plus a hiring pool that already knows the product.
✅ Self-hosted Tableau Server is still on sale for teams that can't put data in someone else's cloud.
❌ Per-user pricing can scale fast for organizations rolling out broadly.
#4: Looker
Best for: Data teams that want one definition of every metric feeding many downstream tools.
Similar to: Holistics, Sigma.
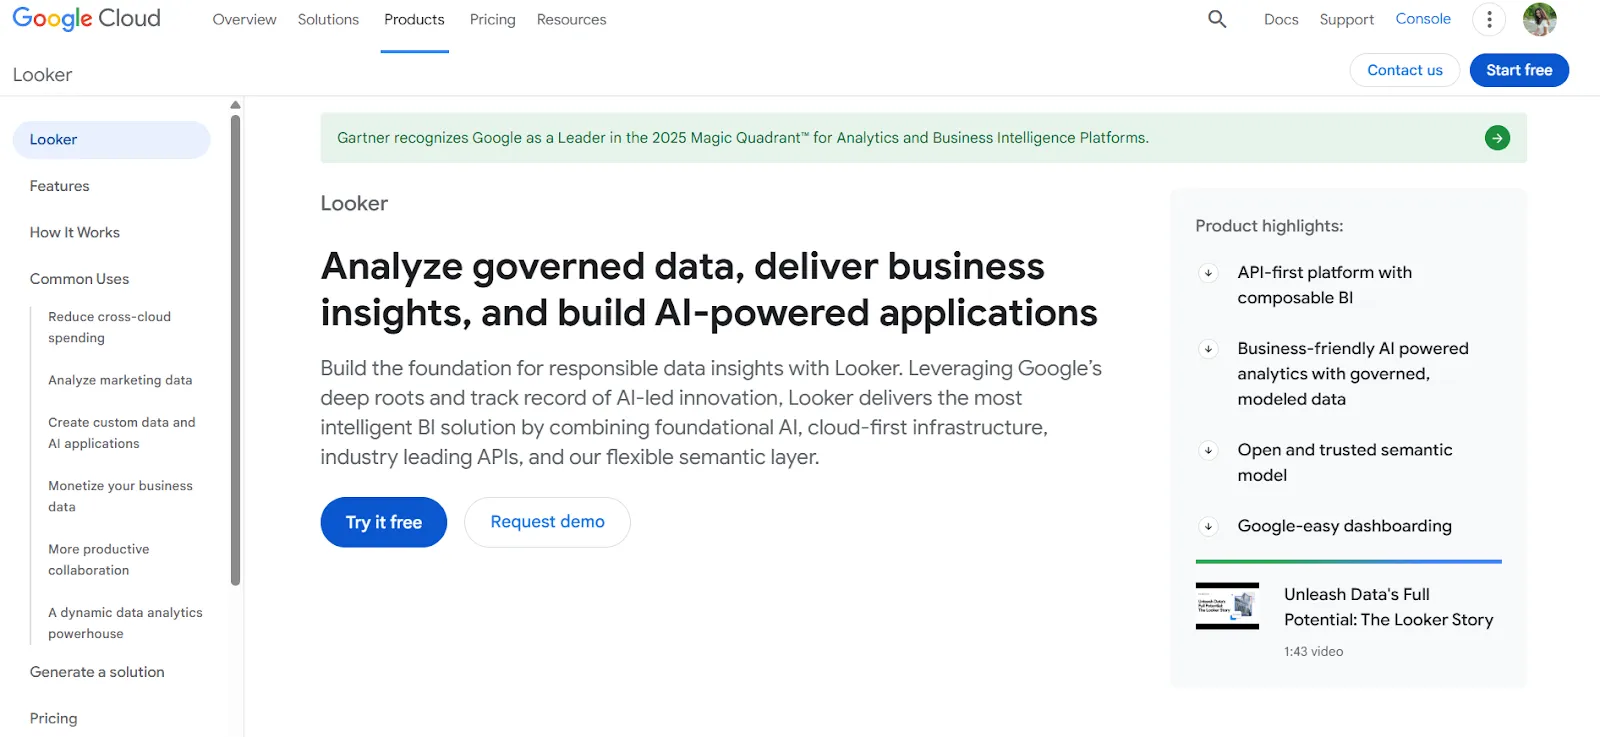
Looker, sold as Looker (Google Cloud core), models metrics and business rules in LookML so that every dashboard and embedded view resolves against one definition.
Looker's top features
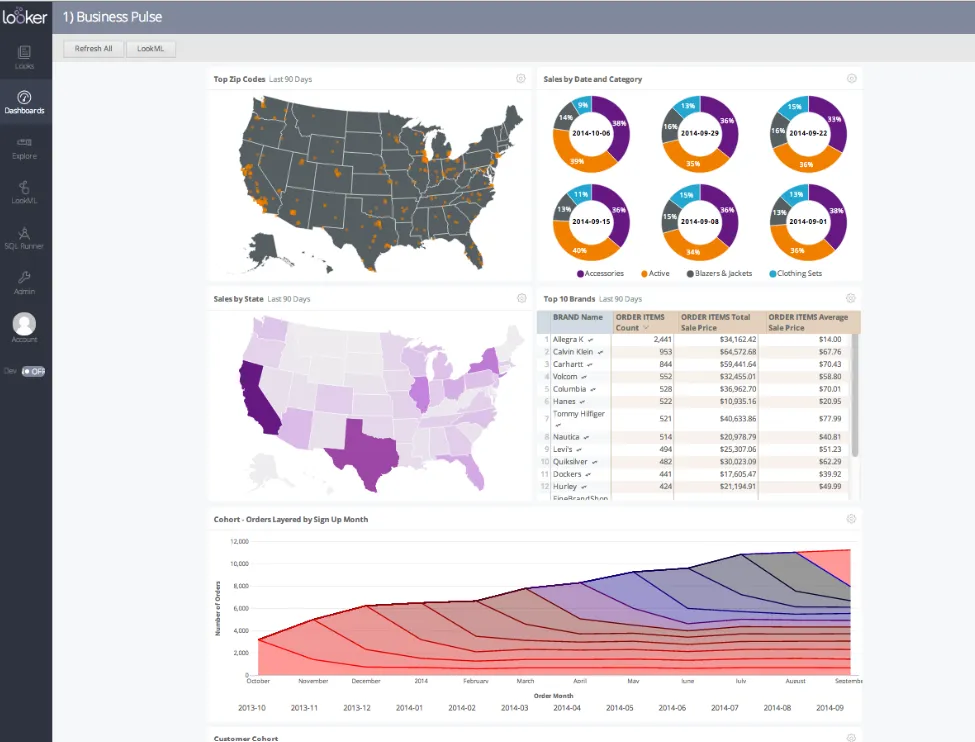
- LookML modeling: Metrics and business rules are defined once in code, so when finance and marketing each pull revenue, the two numbers agree by construction.
- Conversational analytics with Gemini: Someone can type a question in everyday language and get an answer that still resolves through the governed model.
- Live warehouse queries: Dashboards query the warehouse directly, so what a reader sees reflects the current state and not a refreshed extract.
- Embedded delivery: The Embed edition carries the highest API allowances for putting analytics inside customer-facing applications.
Looker pricing
Looker uses a custom, contract-based pricing model made up of two parts: platform pricing (the cost of running a Looker instance) and user licensing (the cost per user type).
Pricing is annual for all plans.
- Platform editions:
- Standard: Designed for small teams or organizations with fewer than 50 users, includes 1 production instance, 10 standard users + 2 developer users, up to 1,000 query-based API calls/month, and up to 1,000 admin API calls/month.
- Enterprise: Built for larger internal BI and analytics use cases, includes everything in Standard, plus enhanced security features, up to 100,000 query-based API calls/month, and up to 10,000 admin API calls/month.
- Embed: Designed for embedding analytics into external products or applications, includes everything in Standard, plus up to 500,000 query-based API calls/month and up to 100,000 admin API calls/month.
- User licensing:
- Developer users: Full access to Looker, including LookML development, administration, APIs, and advanced tooling.
- Standard users: Can explore data, build dashboards and reports, run SQL, and schedule content.
- Viewer users: Read-only access to dashboards and reports, with filtering and drill-down.
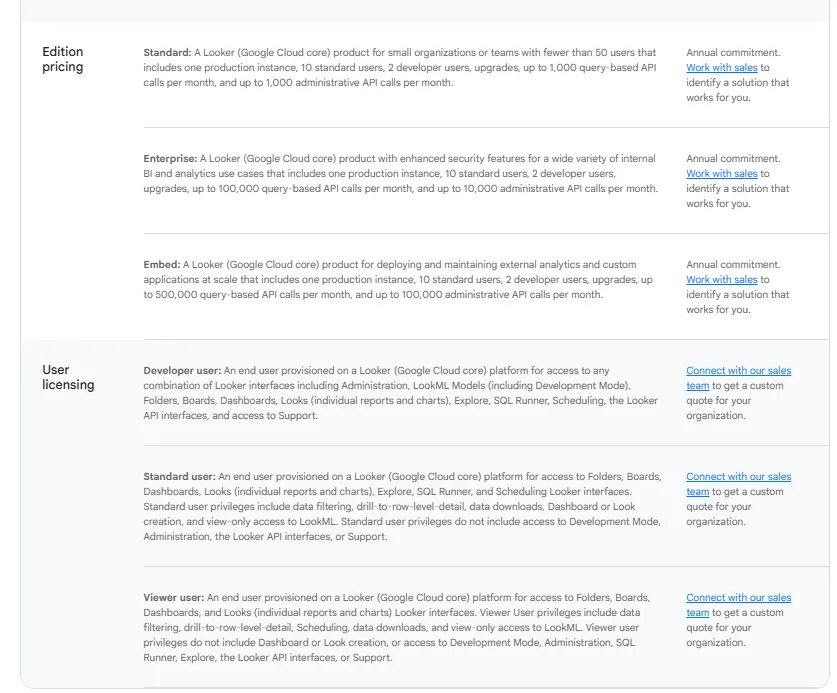
Pricing is custom on all plans and varies based on scale, permissions, and usage.
➡️ We pull apart the platform-plus-seats structure in our Looker pricing guide.
Looker pros and cons
✅ One metric definition serves every dashboard and every embedded view.
✅ The AI token meter carries exact published rates, unusual disclosure for a product with no public seat price.
❌ There's a bit of a learning curve at first, which can require a bit more education upfront to maximize all of its capabilities, according to a G2 review.
#5: Qlik Sense
Best for: Companies with a wide internal audience and moderate data volumes, where headcount would otherwise drive the bill.
Similar to: Microsoft Power BI, Tableau.
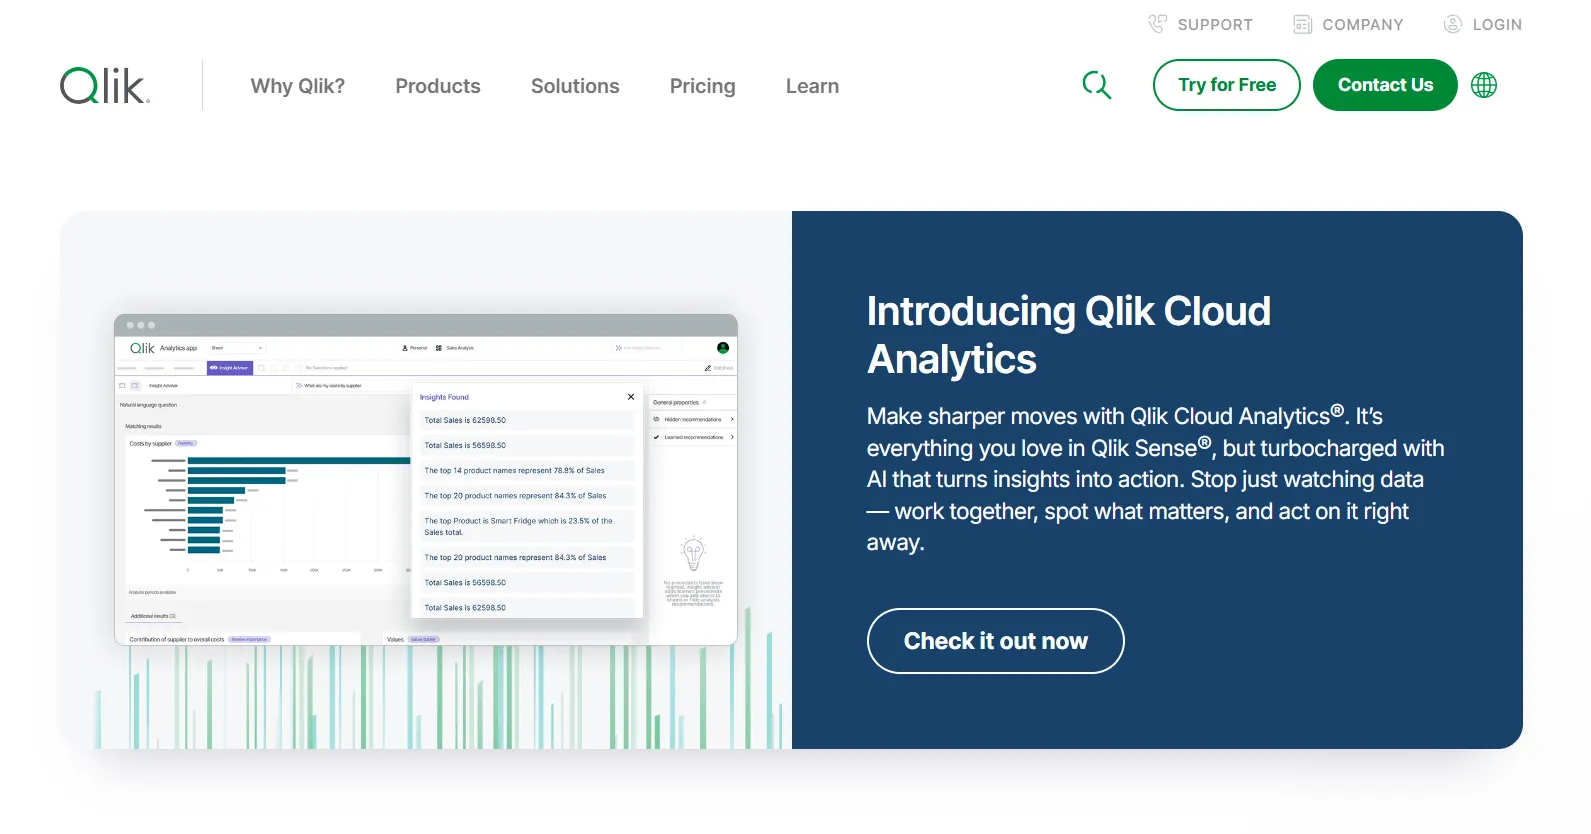
Qlik Sense explores data through an associative engine that recalculates every selection in context, keeping unselected and excluded values visible as you go.
Broad internal access is the use case here, as headcount stops driving the bill above the entry tier.
Qlik Sense's top features
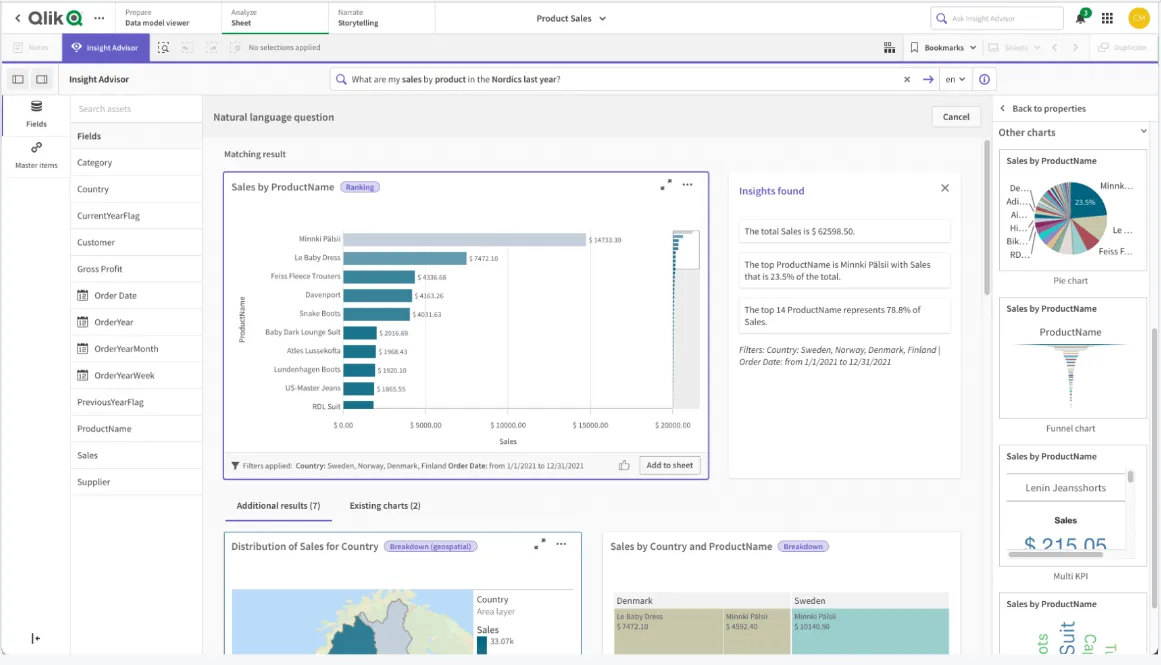
- Associative engine: Selecting values across charts and tables recalculates everything instantly and keeps the relationships between fields visible, so exploration isn't limited to paths somebody predefined.
- Qlik Answers agents: Conversational access reaches unstructured sources alongside modeled data, with agent allowances rising by tier.
- Qlik Predict: Automated machine learning covers predictive work at Premium and above, with no limit on how many models you train.
- Qlik Automate and MCP server: No-code automation triggers actions across systems, and MCP server access exposes Qlik data to AI clients.
Qlik Sense pricing
Qlik Cloud Analytics starts at $300 a month for Starter billed annually, covering 10 users and a fixed 10 GB of Data for Analysis.
- Starter: $300 a month, with 10 users, 10 GB, standard connectors, dashboards and community support.
- Standard: $825 a month, starting at 25 GB, adding managed spaces, generative AI over unstructured data and 24x7 severity 1 support. Additional users carry no cost from this tier upward.
- Premium: $2,750 a month, starting at 50 GB, adding Qlik Predict, anonymous public access, data lineage connectors and guided onboarding.
- Enterprise: Quoted, starting at 250 GB, with multi-region tenants and larger app sizes.
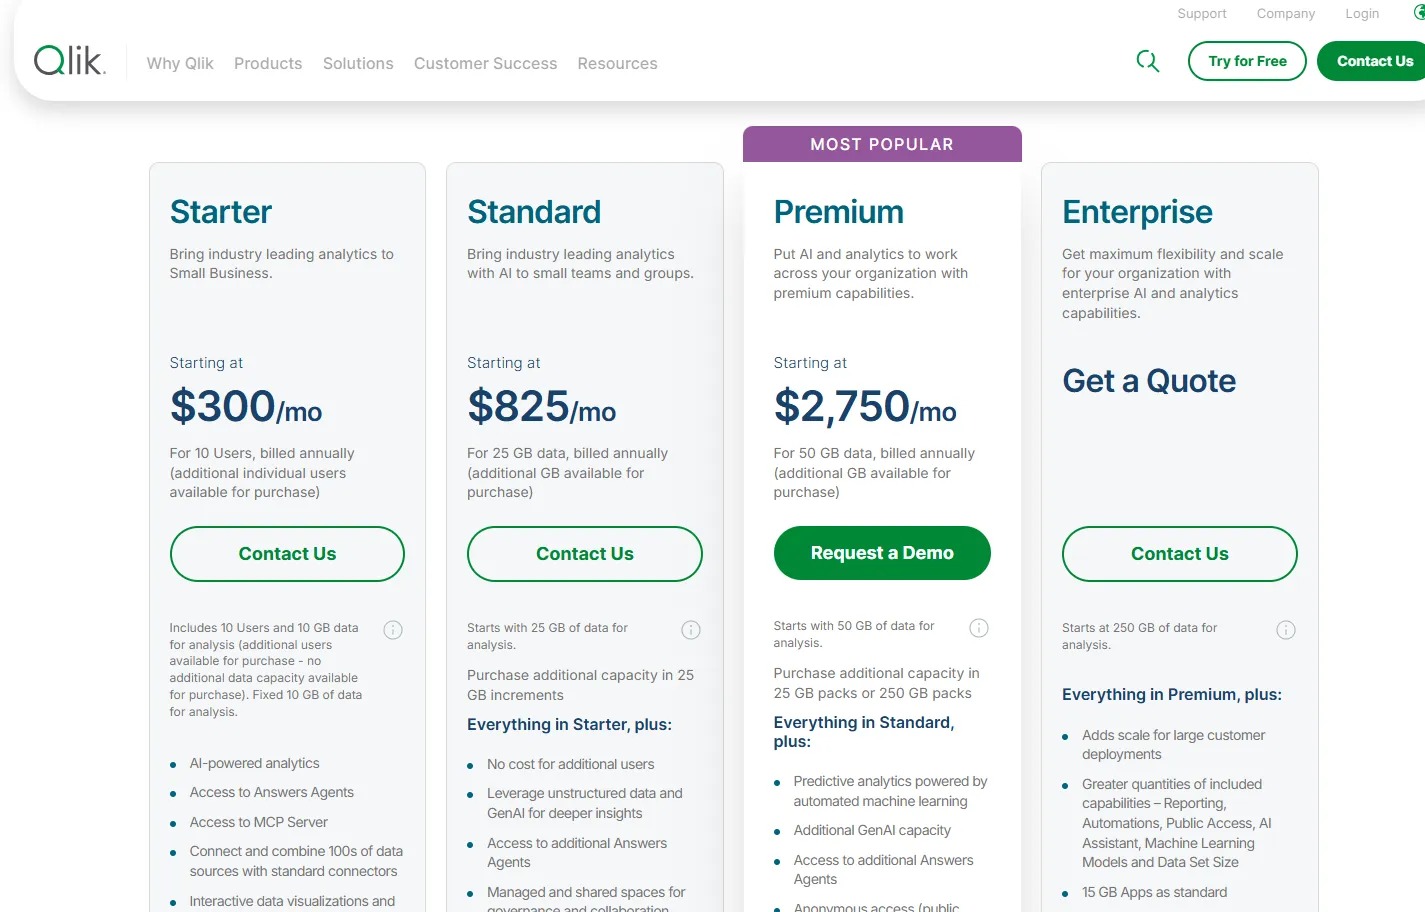
Capacity expands in 25 GB or 250 GB packs, and every tier bills annually.
Qlik Sense pros and cons
✅ Additional users cost nothing from the Standard tier up, which is the opposite of how most of this list works.
✅ Capacity is fixed for the year, so the bill is predictable in a way consumption pricing isn't.
✅ On-premises data sources stay reachable through an encrypted outbound connection.
❌ A G2 review mentions that sometimes there are loading issues, especially when business intelligence is running updates.
#6: Sigma
Best for: Finance and operations teams who would sooner work in a spreadsheet grid than a chart builder.
Similar to: Looker, Metabase.
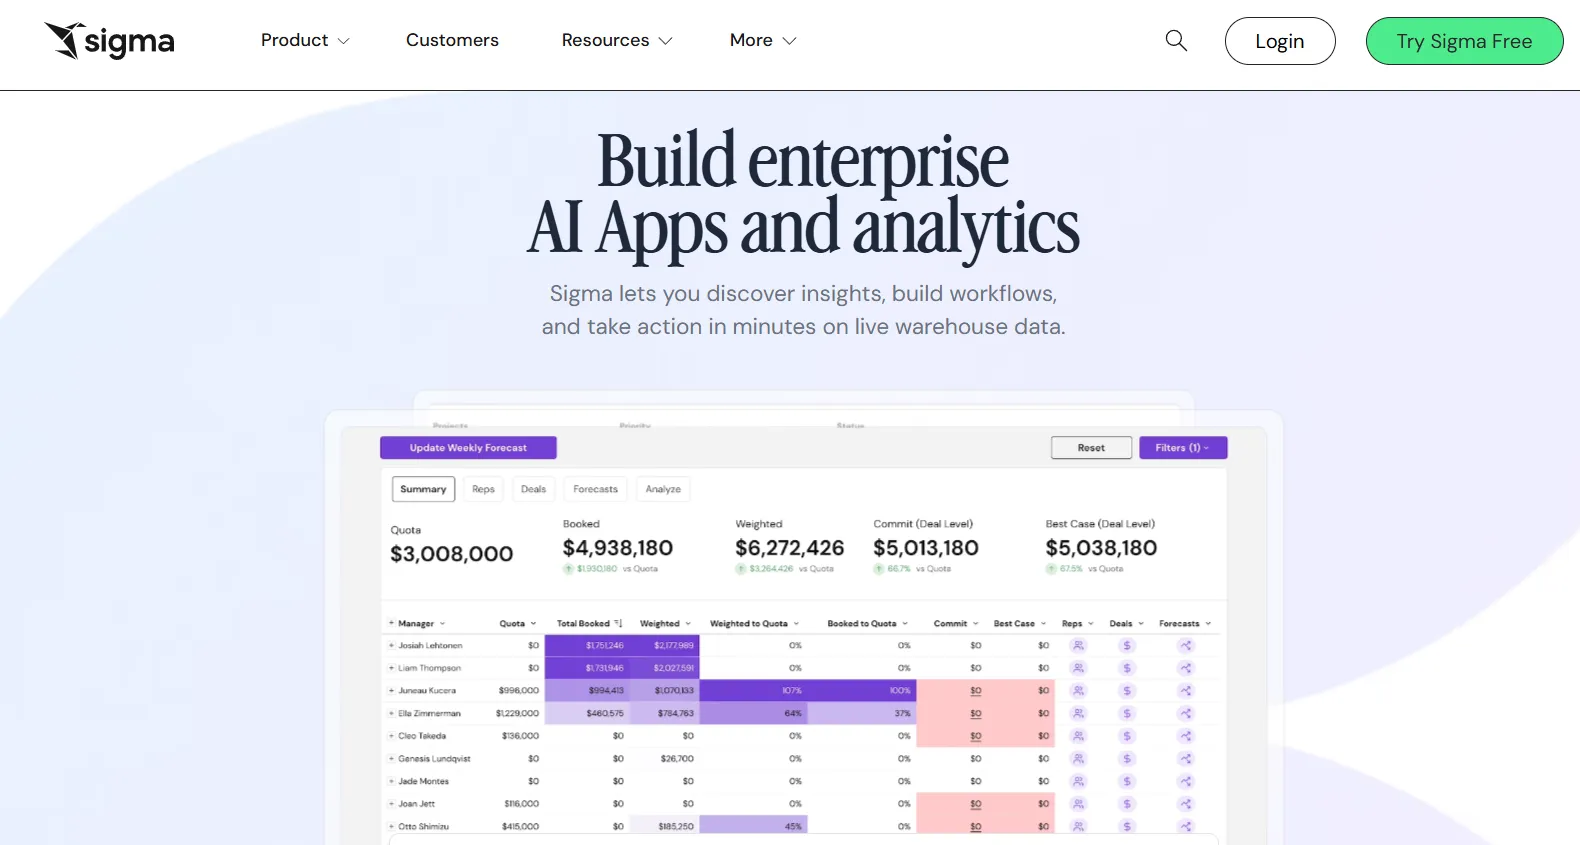
Sigma presents live warehouse data through a spreadsheet grid, where formulas and pivots execute over billions of rows with no extract involved.
Finance and operations teams fluent in Excel are the target, with that fluency pointed at data the company governs centrally.
Sigma's top features
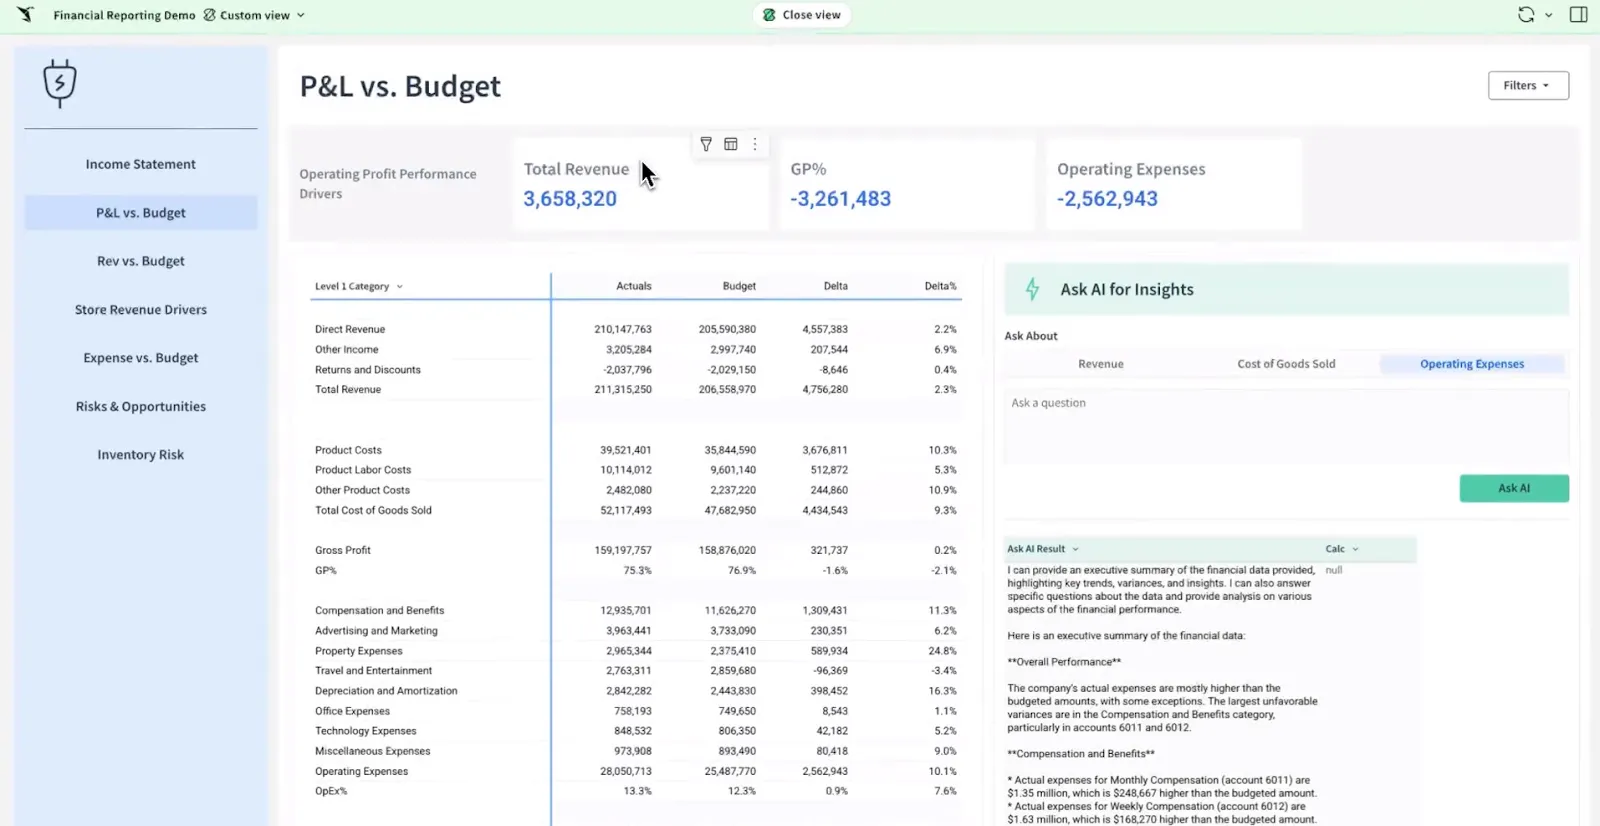
- Spreadsheet interface on live data: Familiar formulas and pivots execute against your cloud warehouse itself, with no extract taken and no data moved.
- Ask Sigma: The agentic interface exposes its own reasoning step by step, naming the analytical method it picked and the reason for picking it.
- AI Columns: A prompt in everyday language runs down every row to classify or enrich it, cached and governed, currently in beta on Snowflake and Databricks.
- Warehouse-native inference: The AI models Ask Sigma calls can be the ones already running in your Snowflake or Databricks account, with no external API key required.
Sigma pricing
Sigma publishes no rates, and its pricing page routes to a contact form, so every evaluation includes a scoping conversation.
What the structure looks like is documented: four license tiers named View, Act, Analyze and Build, introduced in March 2025, with selected usage events consuming credits on top.
Three events draw down those credits: input table updates, API calls, report exports.
Credit pricing comes from an account executive.
Sigma pros and cons
✅ Spreadsheet fluency transfers on day one.
✅ The reasoning behind an answer is inspectable, not just the answer.
✅ Inference can stay inside your existing warehouse contracts.
#7: Metabase
Best for: Startups and product teams that want dashboards running this week without hiring a data engineer first.
Similar to: Apache Superset, Zoho Analytics.
Metabase connects to a database and gives non-technical users a visual query builder alongside a full SQL editor for analysts.
Startups wanting analytics running before a modeling project has even started are the typical buyer.
Metabase's top features
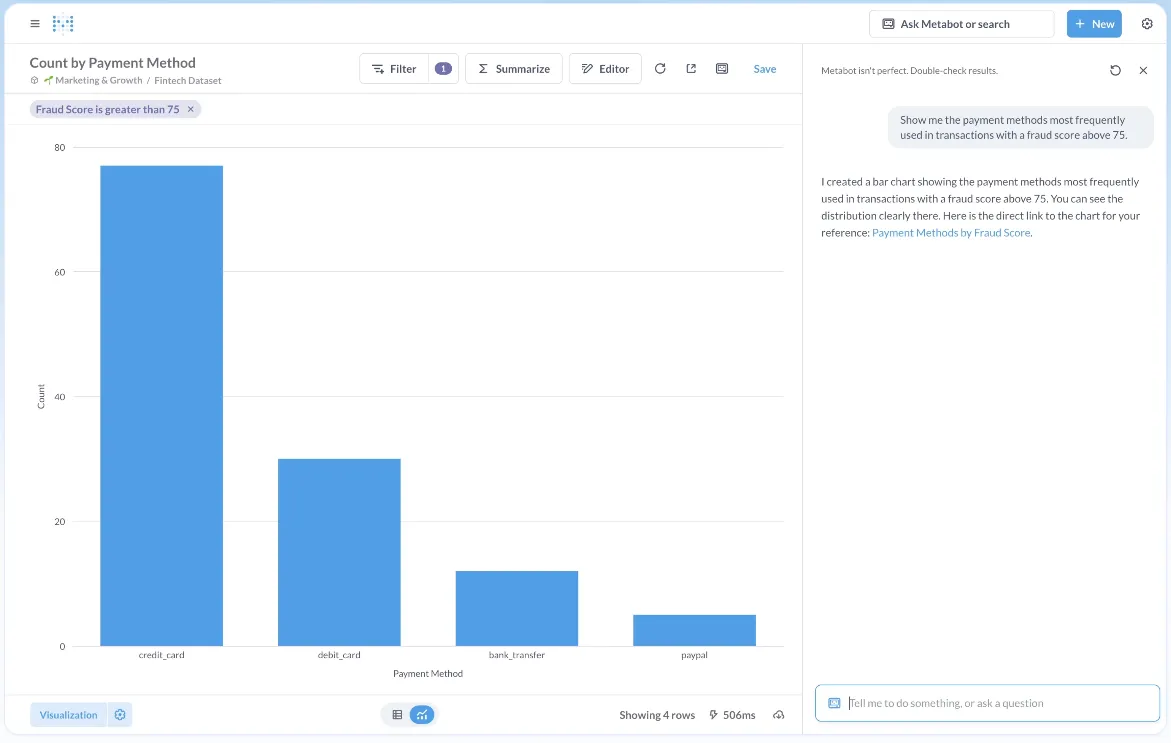
- Visual query builder: Filtering, joining, summarizing and visualizing all happen through a step-by-step interface, with raw SQL available whenever someone needs more control.
- Drill-through: Clicking a chart zooms in, breaks out data, views underlying records or generates a follow-up report, so exploring why something changed doesn't require writing a new query.
- Metabase AI: Natural language questions and SQL generation are included on every plan, including the open-source edition, with most teams connecting their own provider key.
- Data Studio: A semantic layer workbench added in v59, covering three jobs: curating datasets, managing dependencies, running transforms.
Metabase pricing
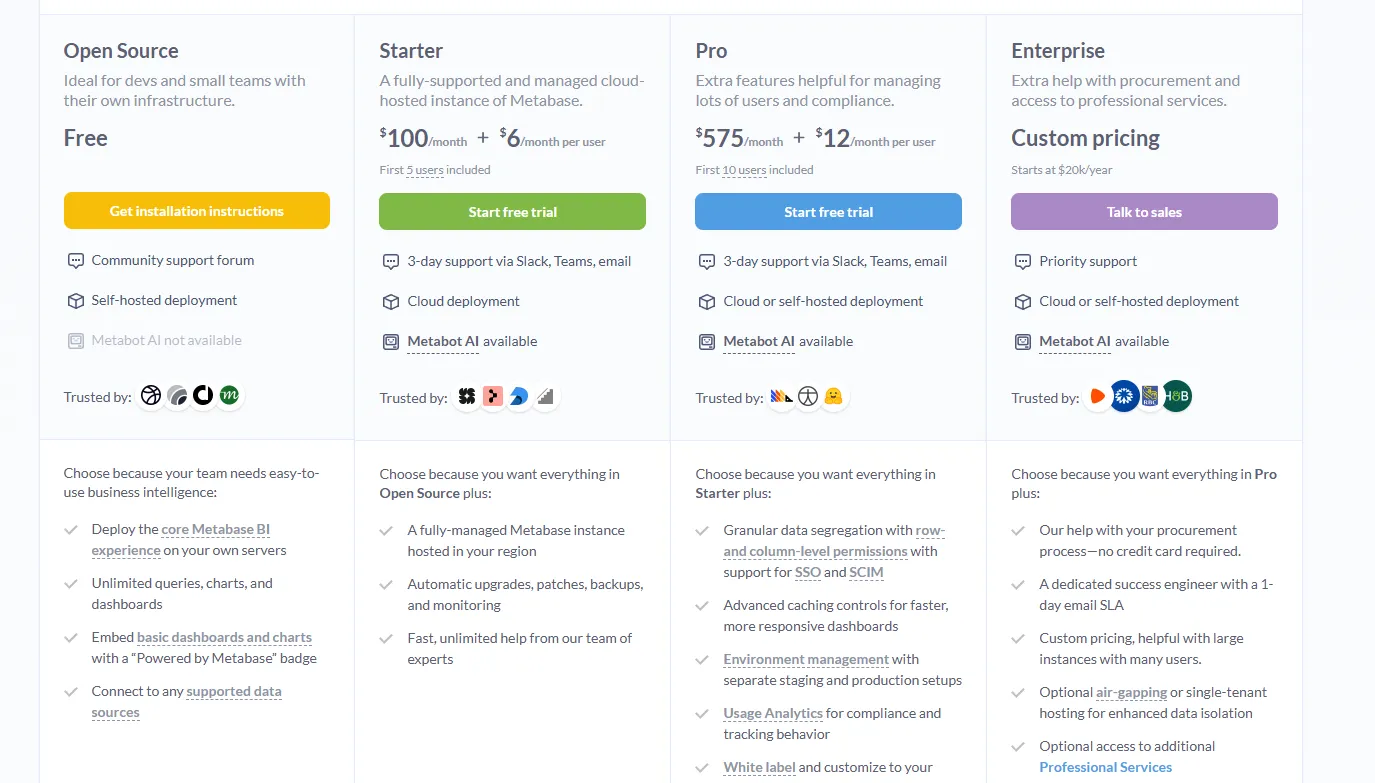
Metabase's open-source edition is free to self-host, and the cheapest hosted plan is Starter at $100 a month plus $6 per user beyond the first five.
- Open Source: Free under AGPL v3 and self-hosted, with unlimited questions and dashboards across 20-plus data sources, plus community support.
- Starter: $100 a month ($1,080 yearly) plus $6 per user monthly, first 5 users included, with managed hosting, backups and 3-day support.
- Pro: $575 a month ($6,210 yearly) plus $12 per user monthly, first 10 users included, adding row and column permissions, SSO, caching controls, usage auditing and multi-tenant embedding.
- Enterprise: Custom, starting at $20,000 a year, adding a dedicated success engineer and a 1-day SLA, with air-gapped deployment available.
- Two further meters are optional: Metabase's managed AI service bills $3.75 per million tokens with the first million free each month, and transforms include 1,000 runs before charging $0.01 apiece.
A yearly plan runs 10% below the monthly equivalent.
Metabase pros and cons
✅ Among the quickest here to get from a database connection to a working dashboard.
✅ AI features carry no seat surcharge and no separate tier.
✅ The open-source edition is a genuine product, not a crippled trial.
❌ A user on G2 believes that Metabase could benefit from having an AI assistant that understands the databases and assists in building queries
#8: Zoho Analytics
Best for: Small and mid-sized teams wanting published prices and a deep library of business app connectors.
Similar to: Metabase, Microsoft Power BI.
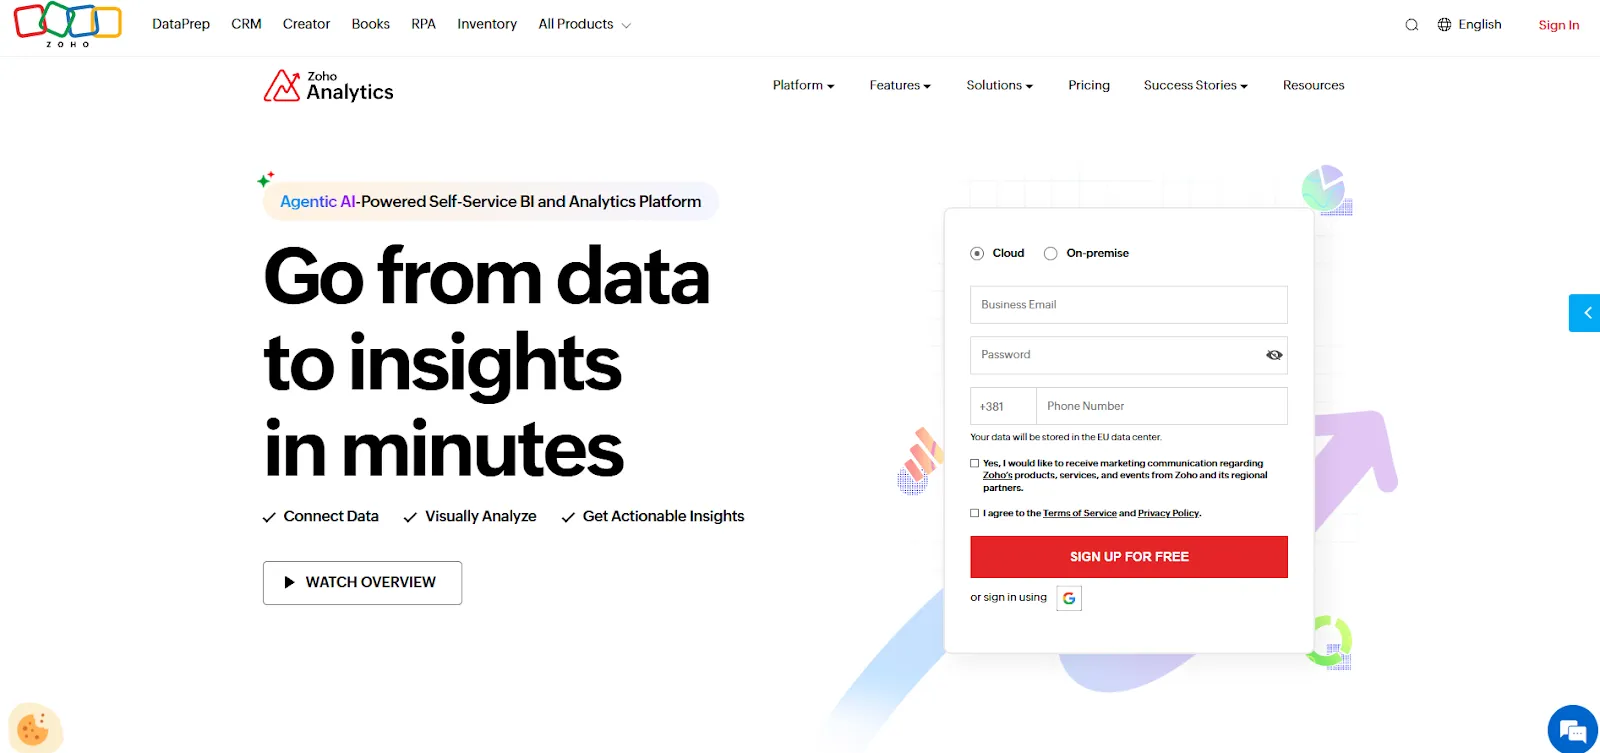
Zoho Analytics imports data from business applications, files, databases and cloud drives, then turns it into dashboards with 80-plus visualization options and conversational analysis through Ask Zia.
Zoho Analytics' top features
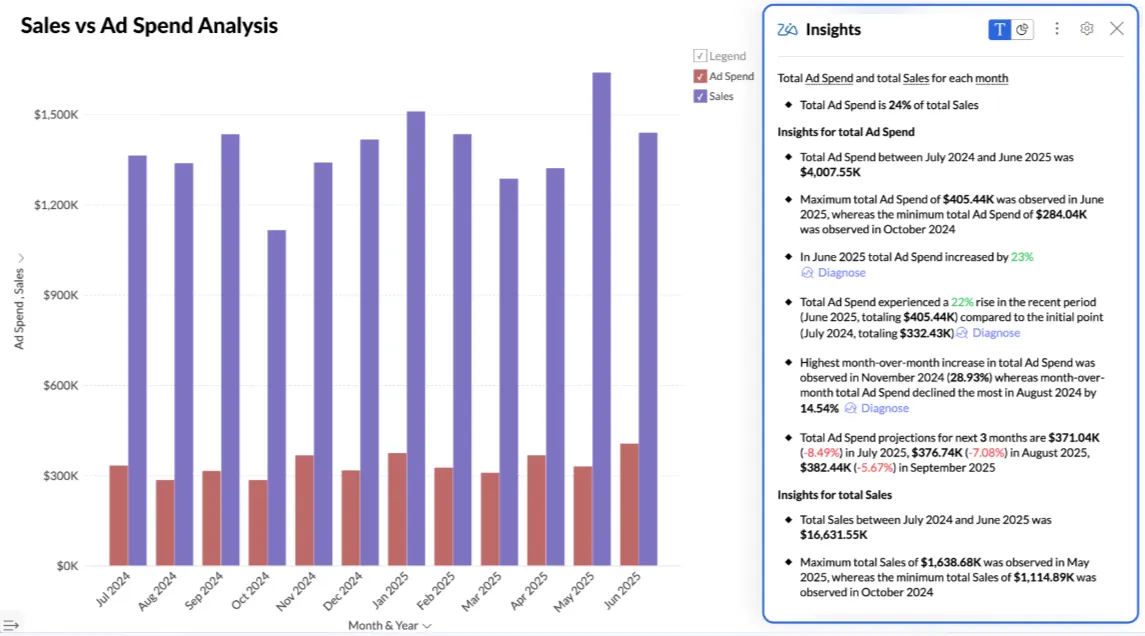
- Ask Zia: The AI agent builds reports and dashboards from requests in everyday language, produces diagnostic insights into what drove a change, and returns recommendations, available on Premium and Enterprise.
- Business app connectors: More than 50 connectors span sales, marketing, finance, e-commerce, help desk and HR tools, each arriving with pre-built reports.
- Data preparation: Zoho DataPrep handles cleansing and transformation inside the same product, with visual pipelines covering the steps between and volumes rising by tier.
- Statistical analysis: Anomaly detection uses RPCA and other statistical models, alongside what-if analysis and forecasting, with cluster analysis running on K-means.
Zoho Analytics pricing
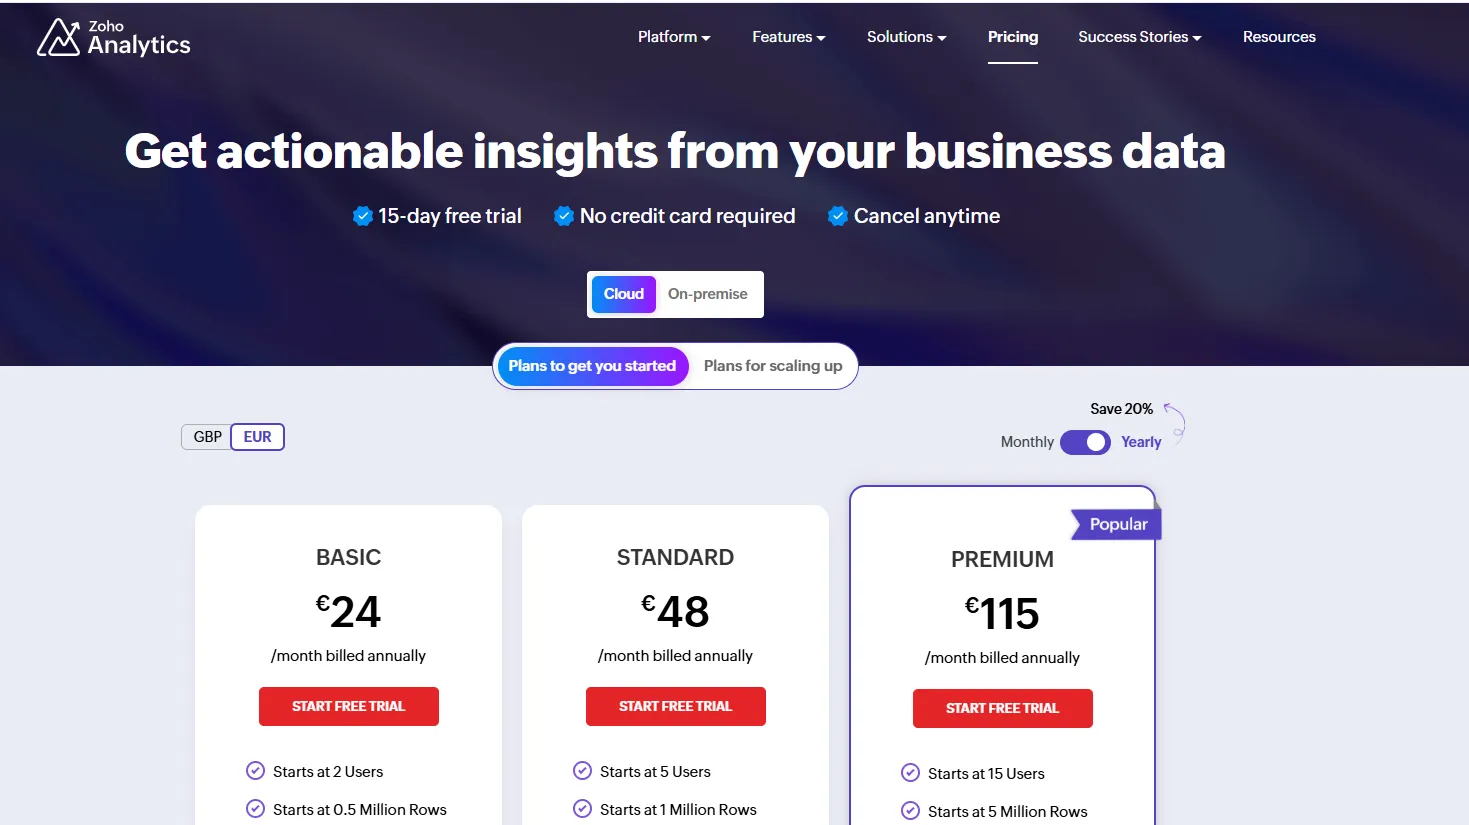
Zoho Analytics starts at $30 a month for Basic on monthly billing, and a permanent free plan covers 2 users and 10,000 rows.
- Basic: $30 a month, with 2 users and 0.5 million rows.
- Standard: $60 a month, with 5 users, 1 million rows and 8 daily data refreshes.
- Premium: $145 a month, with 15 users, 5 million rows, Ask Zia and diagnostic insights.
- Enterprise: $575 a month, with 50 users, 50 million rows, custom roles, activity logs and AI Studio.
- Dedicated Compute: Quoted, starting at 50 users and 500 million rows on an isolated cluster.
Zoho Analytics pros and cons
✅ Every standard tier carries a published rate, with a calculator on the pricing page.
✅ Read-only viewers are priced separately from full users, and far lower.
✅ The free plan is permanent, not a trial.
❌ Ask Zia's agent is a Premium feature, $145 a month.
#9: Apache Superset
Best for: Engineering-led teams that want license-free BI and full control of the infrastructure under it.
Similar to: Metabase, Holistics.
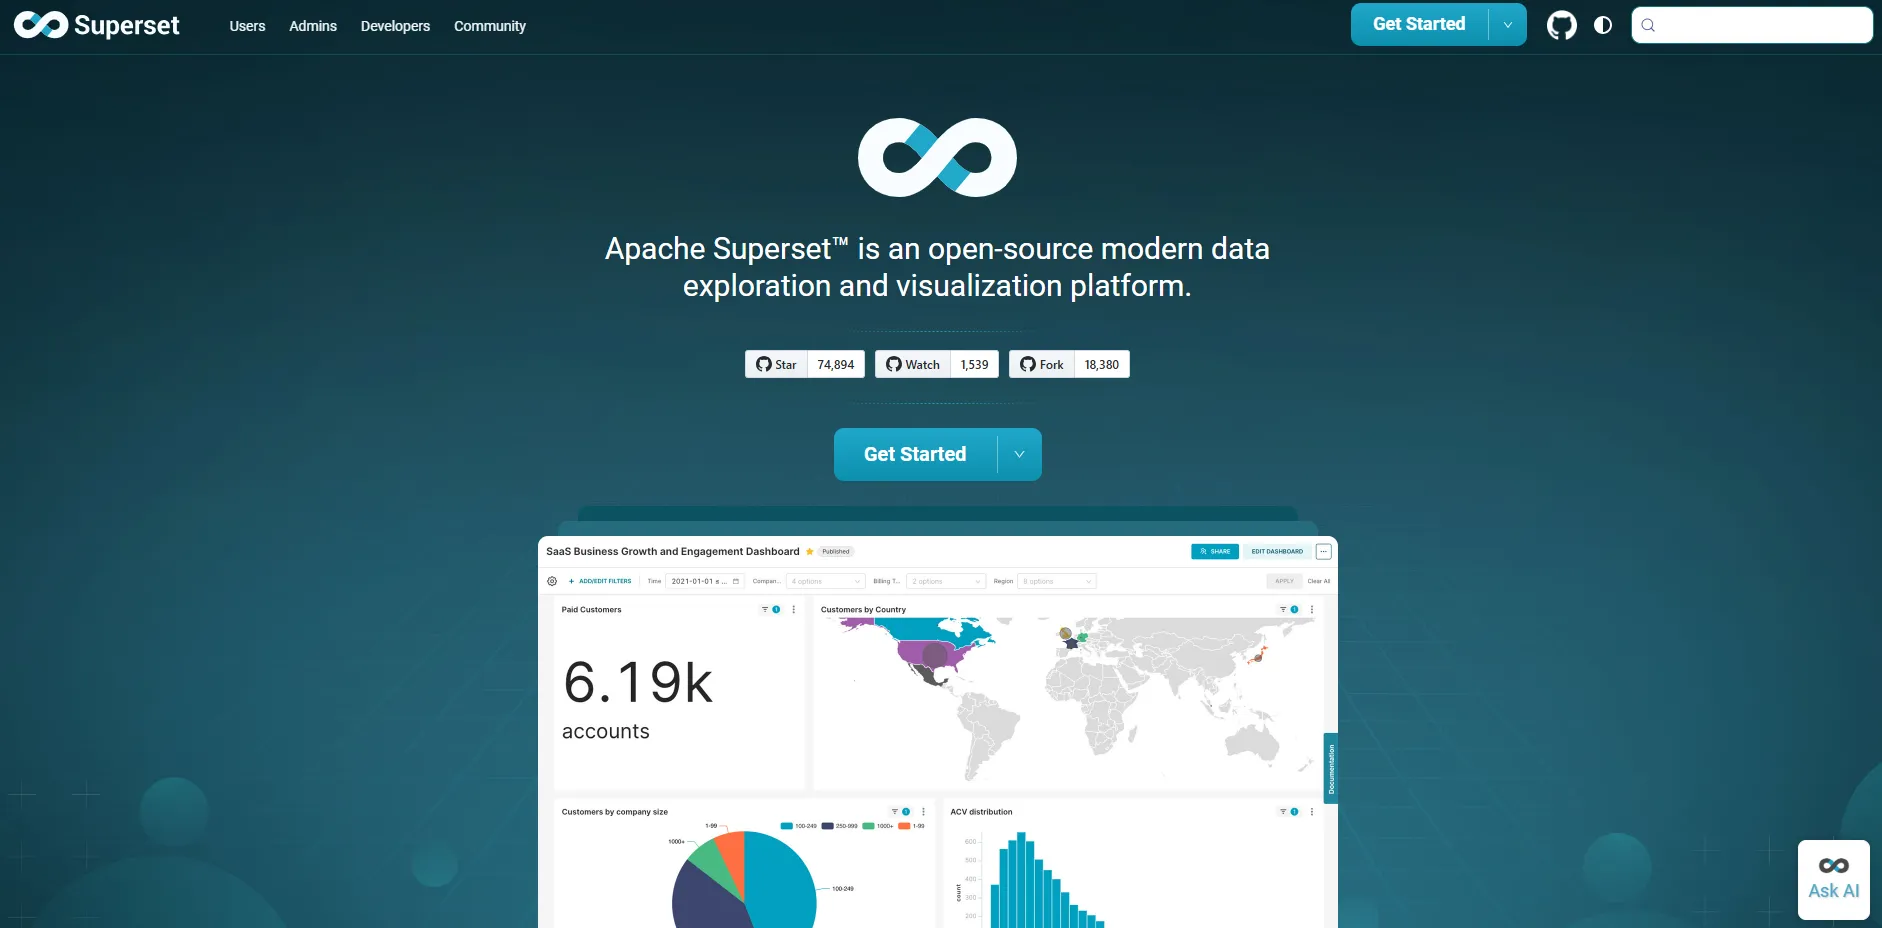
Apache Superset gives technical teams a full SQL IDE, a library of more than 40 chart types and a semantic layer for publishing reusable metrics, all under the Apache 2.0 license.
Engineering capacity is the prerequisite, because you run and upgrade the deployment yourself.
Apache Superset's top features
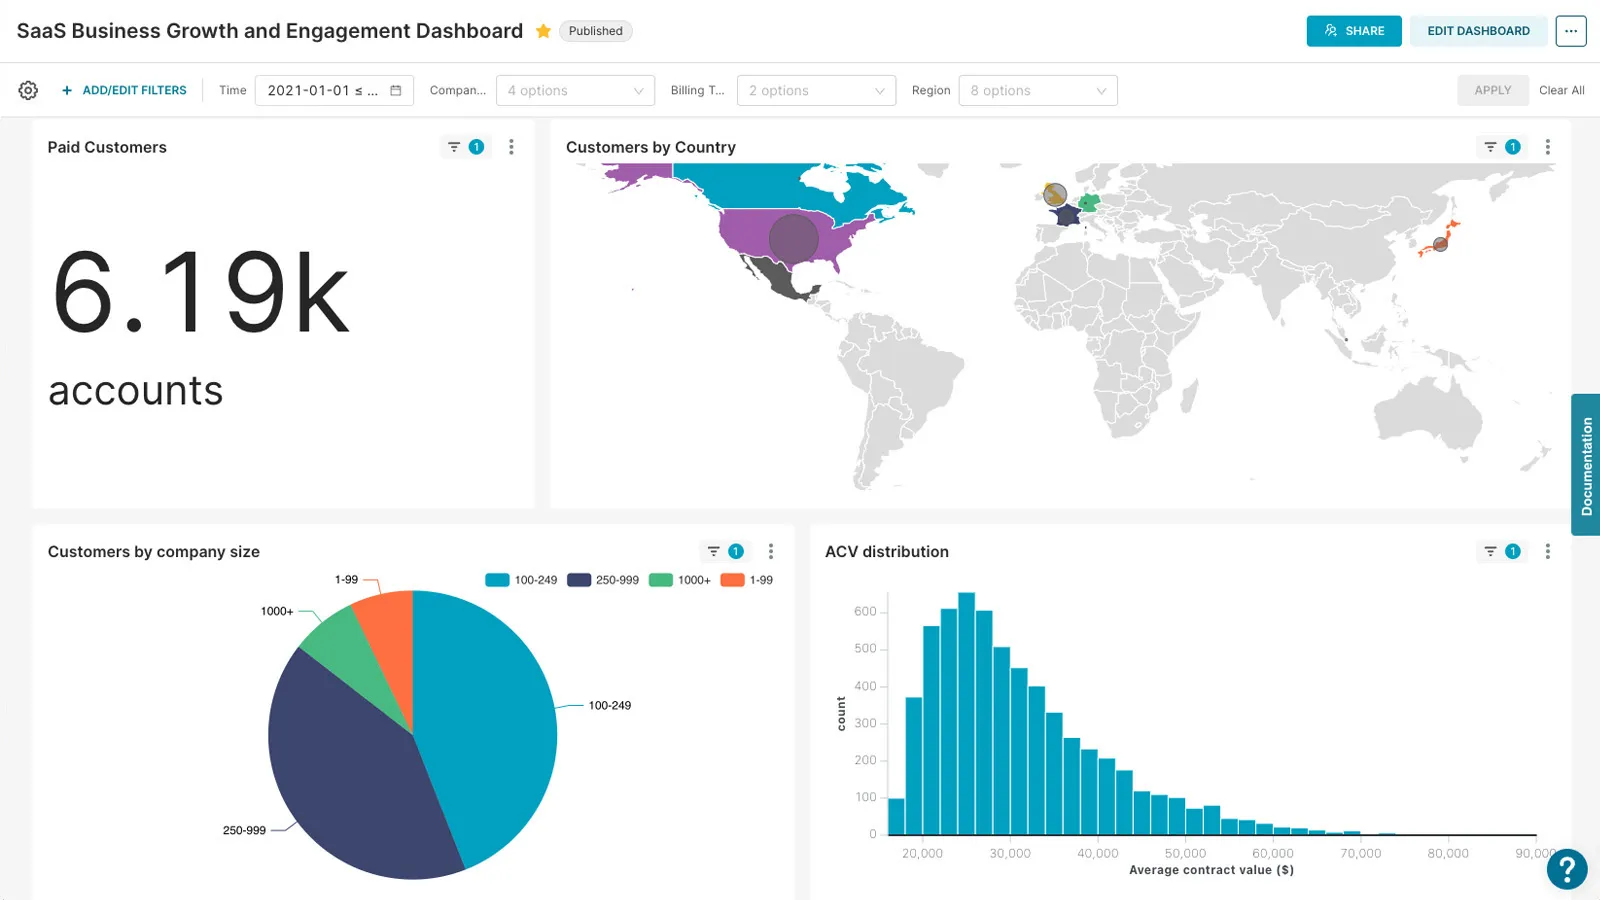
- SQL Lab: A SQL IDE with a metadata browser and autocomplete, saved queries alongside them, where any result set converts straight into a visualization.
- No-code exploration: The Explore interface builds charts by selecting a dataset and dragging dimensions and metrics, with no SQL required.
- Semantic layer: Definitions are held centrally and reused across every chart, covering metrics and columns, plus the virtual datasets built on top of them.
- Jinja templating and custom plugins: Dashboards take dynamic parameters through Jinja, and teams can build and import their own visualization plugins.
Apache Superset pricing
Apache Superset costs nothing to license under Apache 2.0, and the managed route through Preset starts free for up to 5 users.
Self-hosting carries no software fee, though you take on the cloud infrastructure, the engineering time for setup and upgrades, and the security configuration.
Preset, founded by Superset's original creator, sells the hosted version:
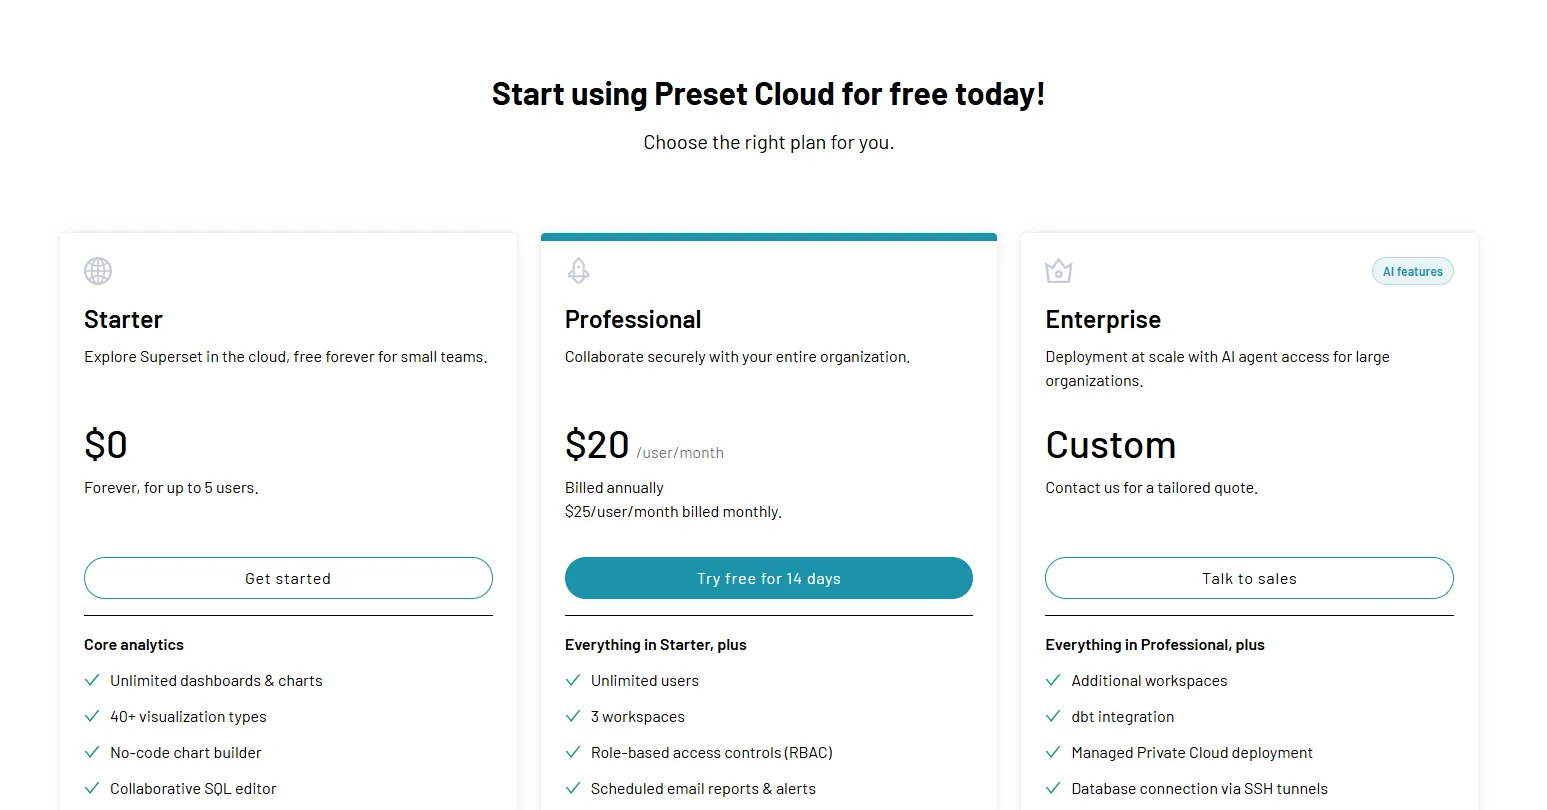
- Starter: Free forever for up to 5 users and 1 workspace, with unlimited dashboards, 40-plus visualization types and the semantic layer.
- Professional: $20 per user monthly billed annually ($25 billed monthly), with unlimited users, 3 workspaces, role-based access controls, scheduled reports and Slack alerts.
- Enterprise: Custom, adding SSO and SCIM, plus managed private cloud.
Apache Superset pros and cons
✅ No license fee and no feature gating, since the whole project is Apache 2.0.
✅ 40-plus database connectors and one of the widest chart libraries available.
✅ Preset's free tier is genuinely usable for a team of five.
❌ SQL fluency is assumed for anything past the basic Explore view.
❌ Self-hosting relocates the cost onto your own engineers.
#10: Holistics
Best for: Analytics engineers who want business logic written as code and reviewed through pull requests before it ships.
Similar to: Looker, Apache Superset.
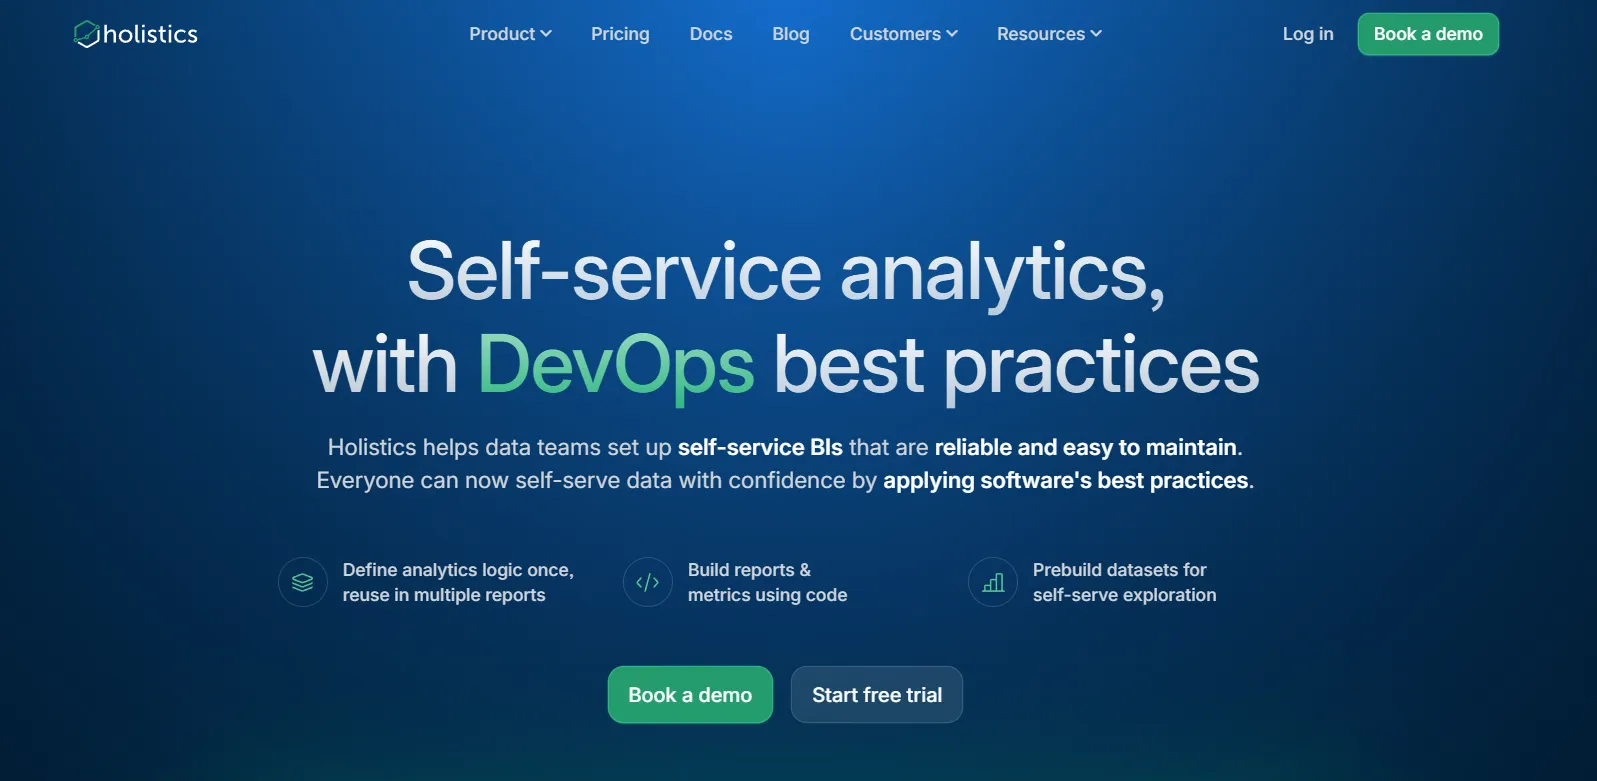
Holistics defines metrics and models in AML, its markup language, and queries them with AQL, with the whole layer version-controlled in Git.
Data teams that want software engineering practice applied to their metric definitions are who Holistics is built for.
Holistics' top features
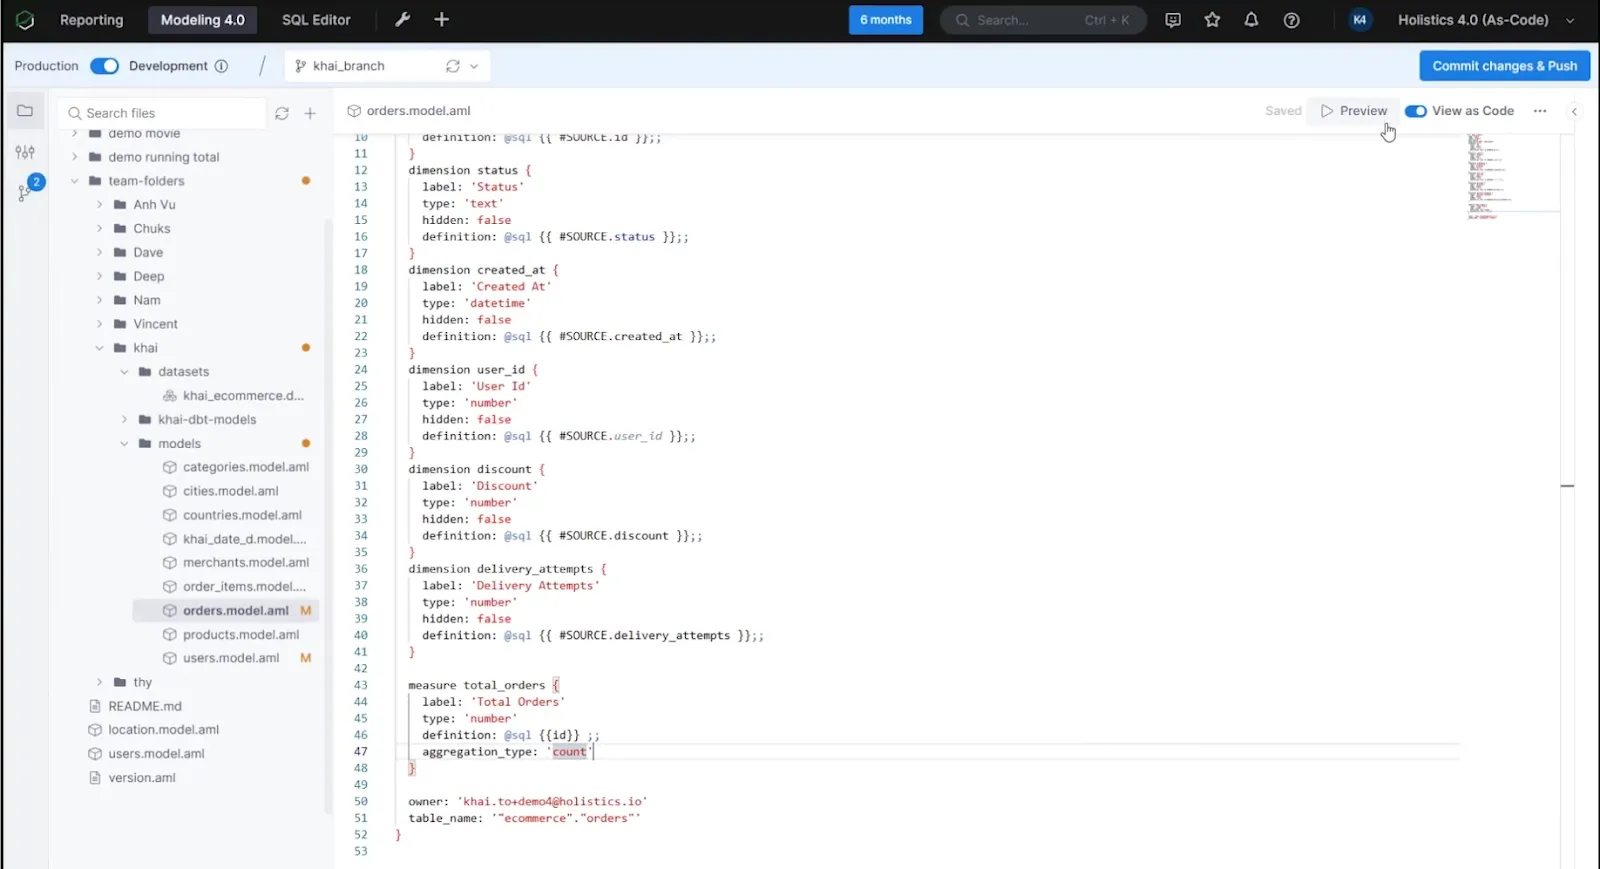
- Analytics as code: Datasets and metrics are declared in AML alongside the rest of your business logic, then committed to Git, so changes pass through branching and code review before production sees them.
- Drag-and-drop for business users: People who don't write SQL assemble their own reports on top of the governed models, drilling down into the underlying rows when they need detail.
- Centralized modeling: The model layer holds three things defined once and enforced across every report: joins, derived tables, transformations.
- Embedded analytics: White-labeled embedding carries per-tenant isolation, with row-level access controlled through JWT or SQL filters.
Holistics pricing
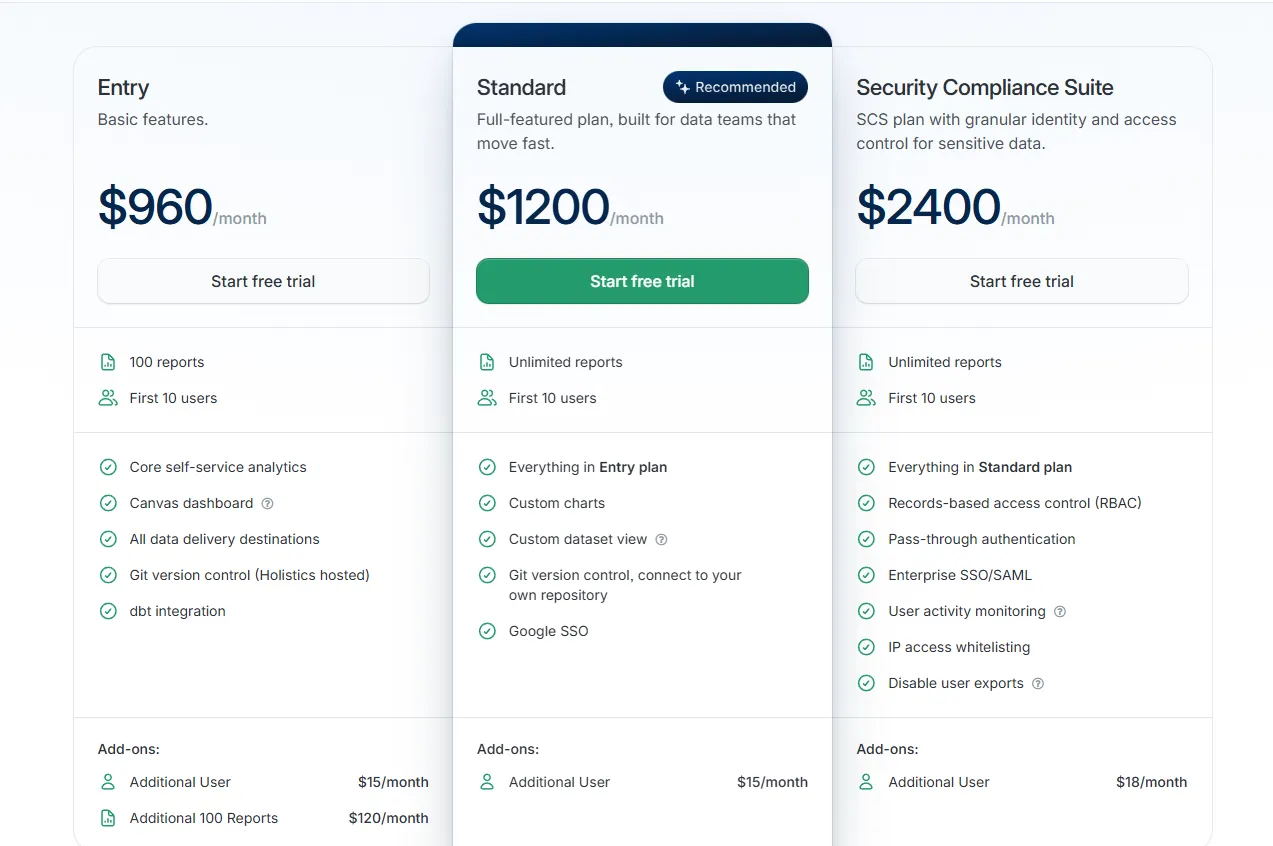
Holistics starts at $960 a month for the Entry plan on monthly billing, or $800 a month billed annually, covering 100 reports and the first 10 users.
- Entry: $960 monthly ($800 annually), with 100 reports, 10 users, Canvas dashboards, Holistics-hosted Git and dbt integration. Extra users run $15 a month, and another 100 reports costs $120 a month.
- Standard: $1,200 monthly ($1,000 annually), adding unlimited reports, custom charts, your own Git repository and Google SSO.
- Security Compliance Suite: $2,400 monthly ($2,000 annually), adding RBAC, enterprise SSO with SAML, pass-through authentication, IP allowlisting and export controls.
- Custom and Embedded: Quoted, for unlimited users and dynamic row-level permissions, with white labeling included.
Holistics pros and cons
✅ Metric changes go through review before reaching production, the same way application code does.
✅ Published rates at three tiers, which most semantic-layer products don't offer.
✅ dbt integration and Git version control are included from the entry plan.
❌ $960 a month is the highest published entry price on this list.
Get started with Dot for free
Those are the 10 data analysis tools I'd put on a 2026 shortlist, running from open-source projects you host yourself up to platforms carrying a six-figure annual commitment.
Nine of them will serve a data team well, and several do things we've deliberately left alone.
Where Dot begins is further down the chain.
The analysis arrives complete, in whichever tool your colleagues already have open, assembled out of models your data team maintains.
What a team gets out of that:
- Deep Analysis taking a question about why churn moved and coming back with a quantified finding, recommendations, and every assumption it made written down.
- Answers returned to whichever surface the question came from, Slack thread or Microsoft Teams channel, inbox or browser tab.
- A metric glossary Root assembles by reading the BI dashboards you already rely on, where no edit ships until an admin has read the diff.
- Scheduled write-ups that explain a change to the named people who need it, filtered by the permissions each of them already holds.
- Connections covering Snowflake, BigQuery, Redshift, Databricks, Postgres and ClickHouse among a dozen databases, plus semantic layers for dbt, Power BI, Looker and Steep.
- SOC 2 Type II underneath it, row-level security from the Team tier, a full SQL audit trail on every answer, and no per-seat charge on any paid plan.
➡️ Get started for free with Dot's free plan, or schedule a demo to see how it works with your data.
⚠️ Disclaimer: This article was last updated on September 23, 2026. If you spot any inaccuracies, please do contact us, and we'll fact-check it.
Theo Tortorici
Theo writes about AI-powered analytics, data tools, and the future of business intelligence at Dot.