
Sisense vs. Microsoft Power BI vs. Dot: Which One Is Better?
Comparing Sisense vs. Microsoft Power BI puts two very different takes on business intelligence side by side.
This buyer guide runs through each tool's features and integrations, then breaks down pricing so you can pick the one that fits.
➡️ I'll also introduce a third option, Dot (that's us), an AI data analyst that reads your warehouse and sends the written answer into Slack, Teams, email, or the web app.
TL;DR
- Sisense grew up as an embedded analytics platform, the kind you wire into your own product so customers get dashboards inside your app.
It pairs that with a self-service side, where the Sisense Intelligence assistant builds analytics from a natural-language brief and narrative writes short summaries of what a chart is showing.
➡️ Choose Sisense if you're a software team shipping customer-facing analytics, or you want a customizable BI layer you can white-label and shape to match your product.
- Power BI is a reporting layer you put on top of a data model you build first, and it shines inside a Microsoft stack.
It ties into Excel, Teams, SharePoint, and Azure, and now runs inside Microsoft Fabric next to OneLake.
➡️ Choose Power BI if your company already runs on Microsoft 365 and needs governed reporting spread across many teams.
- Dot works from the other direction.
Our conversational analytics software connects to your warehouse, runs the analysis itself, and delivers a written answer with recommended next steps into Slack, Microsoft Teams, email, or the web app.
➡️ Choose Dot if your data is already in a warehouse and what's holding you back is analyst capacity, plus the effort of turning charts into calls you can act on.
Sisense vs. Microsoft Power BI vs. Dot: features
Here's the short version of how the three compare on features:
- Sisense is built to embed, so its Compose SDK and Sisense Intelligence assistant, backed by the ElastiCube engine, suit product teams putting analytics inside their own apps.
- With Power BI, the draw is the Microsoft tie-in and a well-developed visualization toolkit.
- Dot suits teams whose data already lives in a warehouse, handing back the answer itself so there is nothing to build or decode first.
Let's go through each tool's features, starting with Sisense: 👇
Sisense's features
Embedded analytics and Compose SDK
Compose SDK is the toolkit that gives Sisense its identity.
It drops dashboards, charts, widgets, and filters straight into your own application, with control over how each component looks, and an iframe embed is there when you want a faster path.
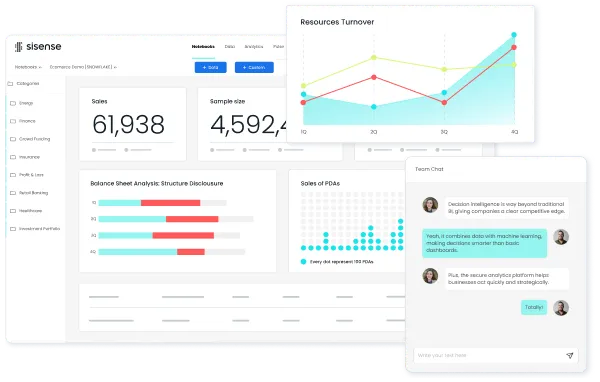
The point is customer-facing analytics that feel native to your product, not a bolted-on report.
Sisense Intelligence
Sisense Intelligence is the AI layer, and it runs on two features.
The assistant turns a natural-language request into a working visualization, so a business user can query a dashboard without SQL, while narrative writes a short summary of what a chart is showing.
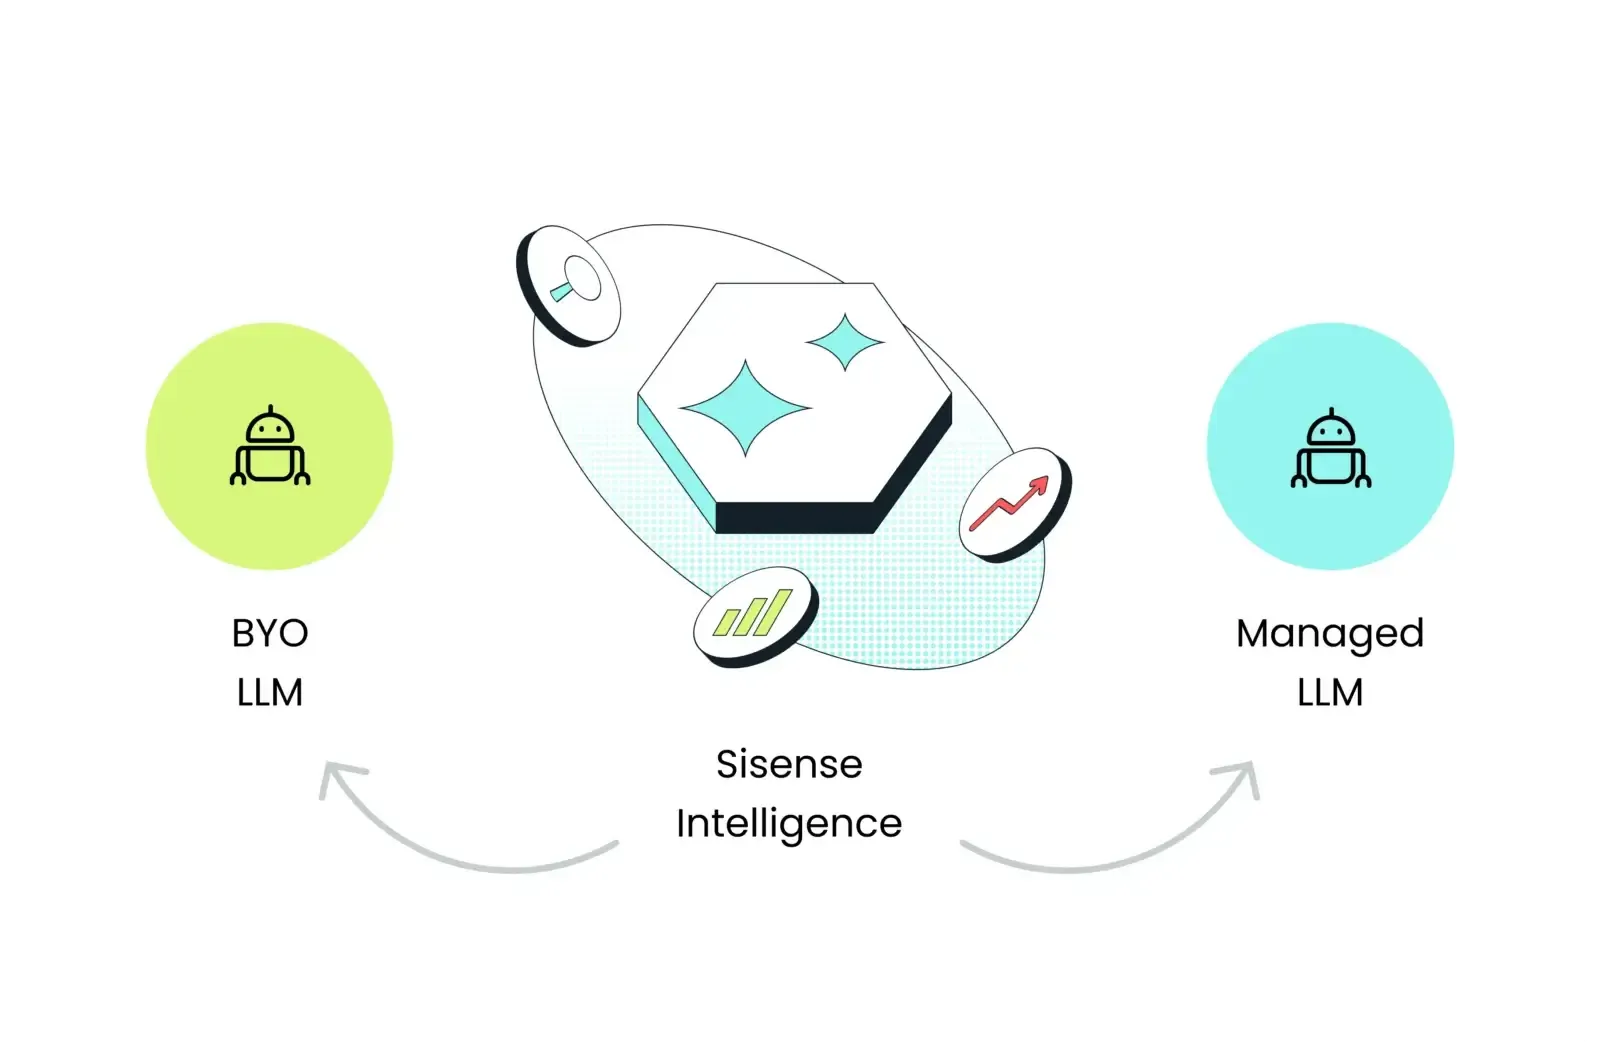
Together they lower the bar for people who want answers without learning the query language.
ElastiCube and data connectivity
ElastiCube is the analytical engine that combines sources and runs fast queries over big datasets.
You can cache data for speed or keep a live connection to your warehouse for freshness, with a hybrid option between the two, and more than 200 connectors cover the usual warehouses and databases.
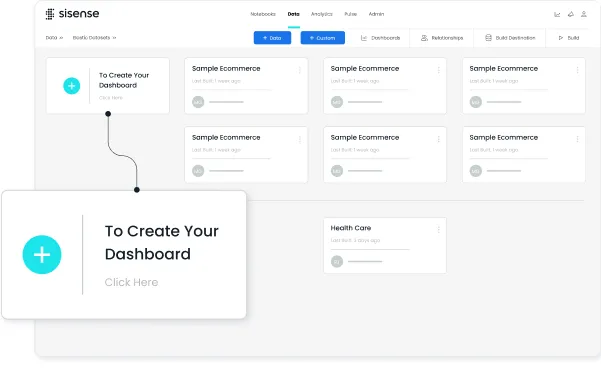
Recent additions let external AI agents reach governed models in Sisense through MCP.
Low-code visualization
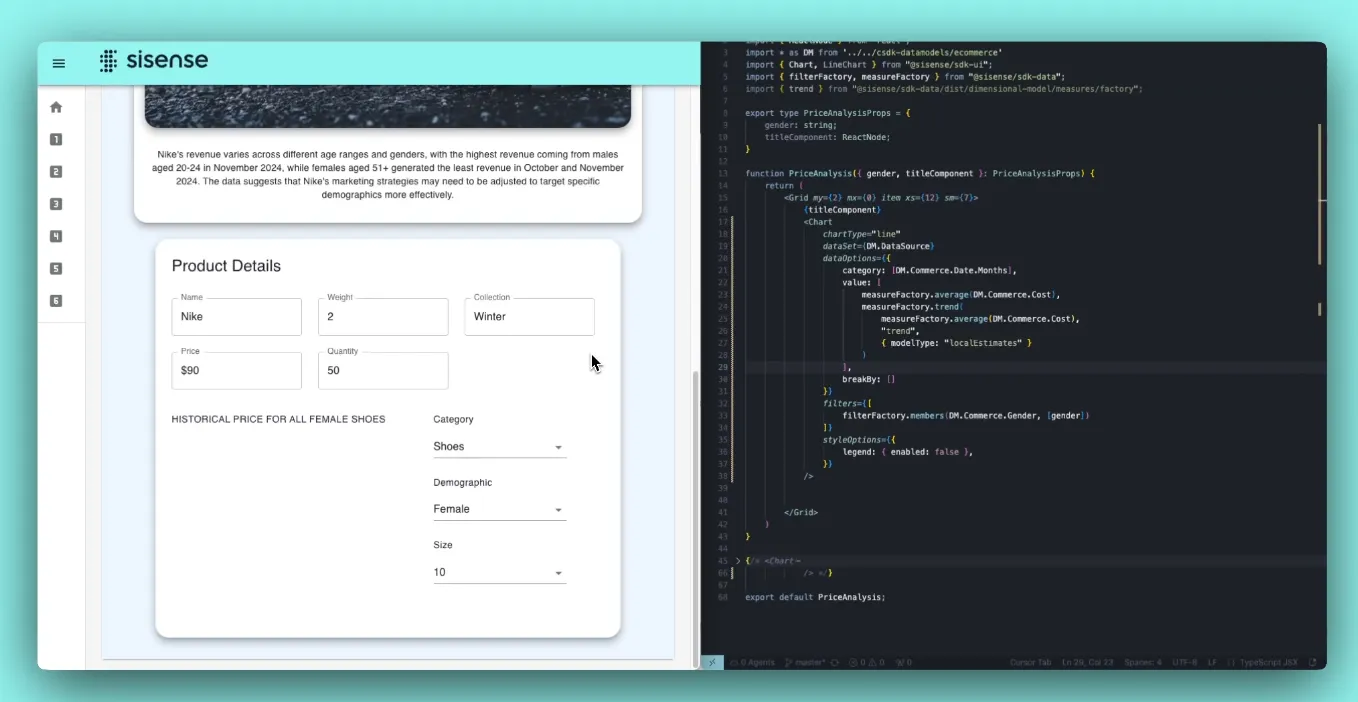
On visualization, Sisense offers a stocked library of chart types and map visuals that you can assemble into dashboards without code.
The AI assistant can also spin up visuals from a prompt.
Sisense is best suited if:
✅ You're a software team embedding analytics into your own product and want control over the UX.
✅ You need white-label, multi-tenant dashboards for customers, not just internal reporting.
✅ You want a data engine that can cache, live-connect, or run a hybrid of both.
✅ You work in a regulated industry that needs certifications, SSO, and granular access control.
Sisense may not be ideal if:
❌ You want a fast start.
❌ You have no engineering support to build and maintain it.
❌ Predictable pricing matters.
Microsoft Power BI's features
Interactive dashboards and reports
Power BI is, at its core, a report builder.
Once your data is connected and modeled, you build reports on a drag-and-drop canvas, adding filters and letting readers drill into the detail.
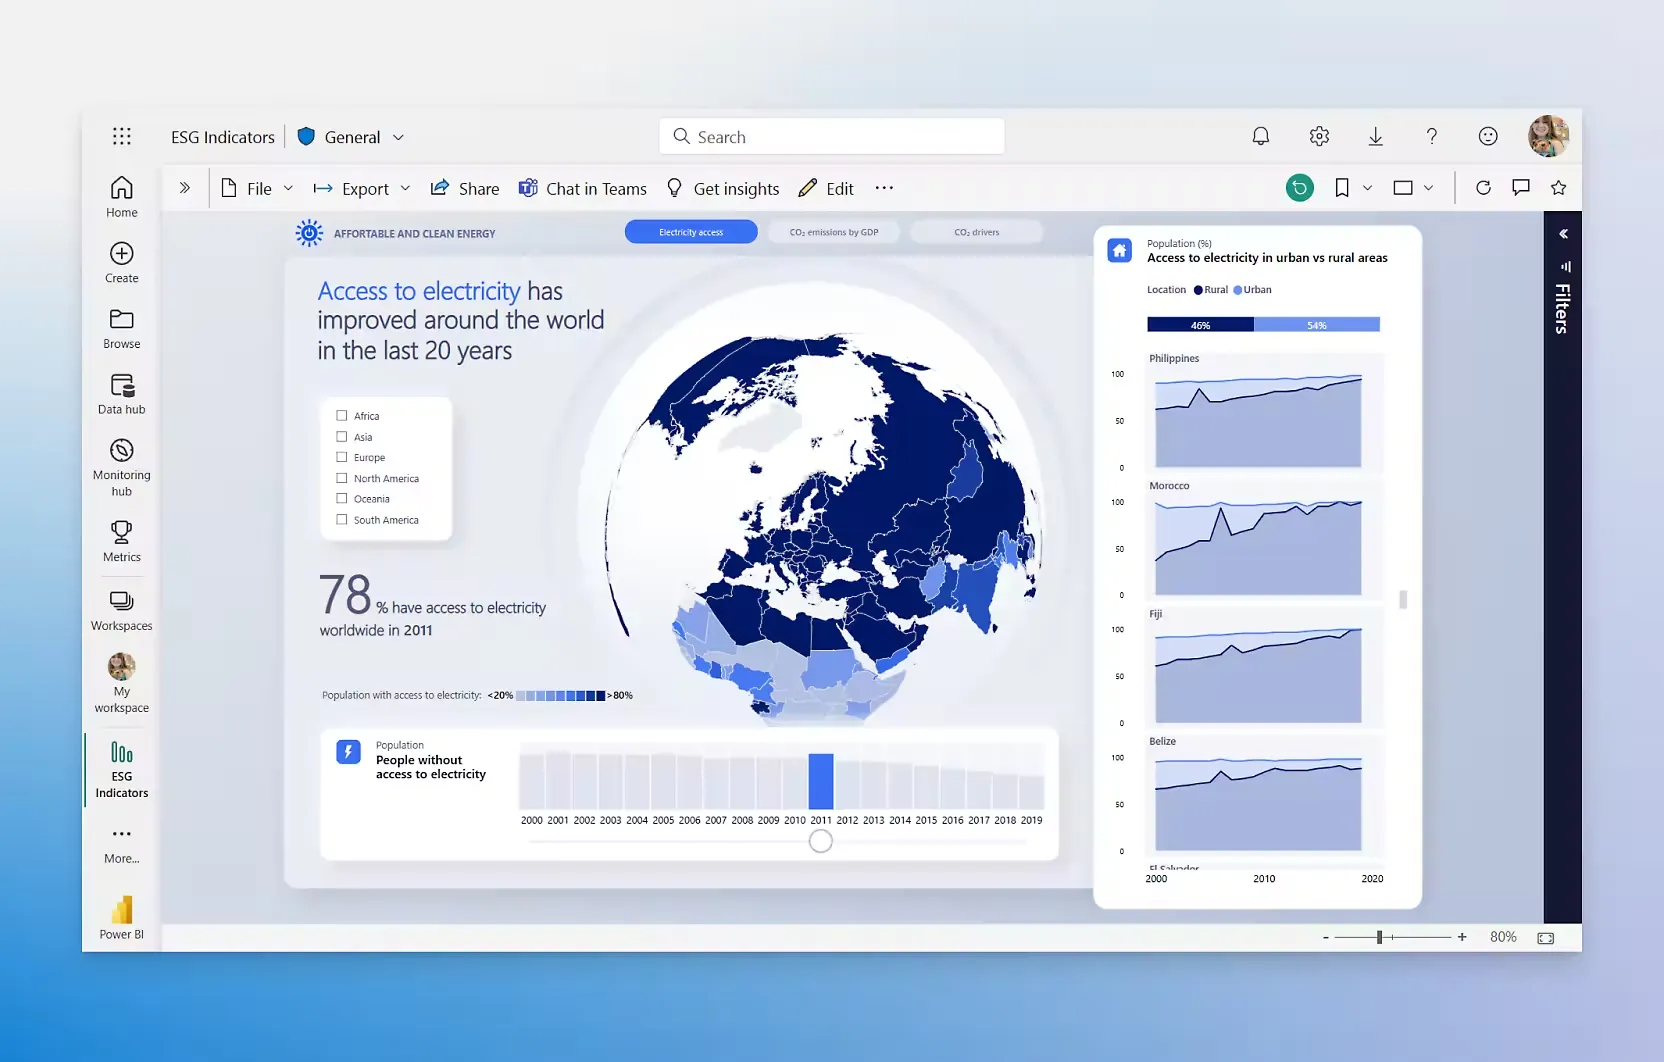
The output looks sharp, and a non-technical user can put a clean report together without writing code.
The Microsoft ecosystem and Fabric
The Microsoft tie-in is Power BI's real advantage.
Reports flow into Teams and SharePoint, Excel connects both ways, and the product now runs inside Microsoft Fabric next to OneLake and the wider Azure estate.
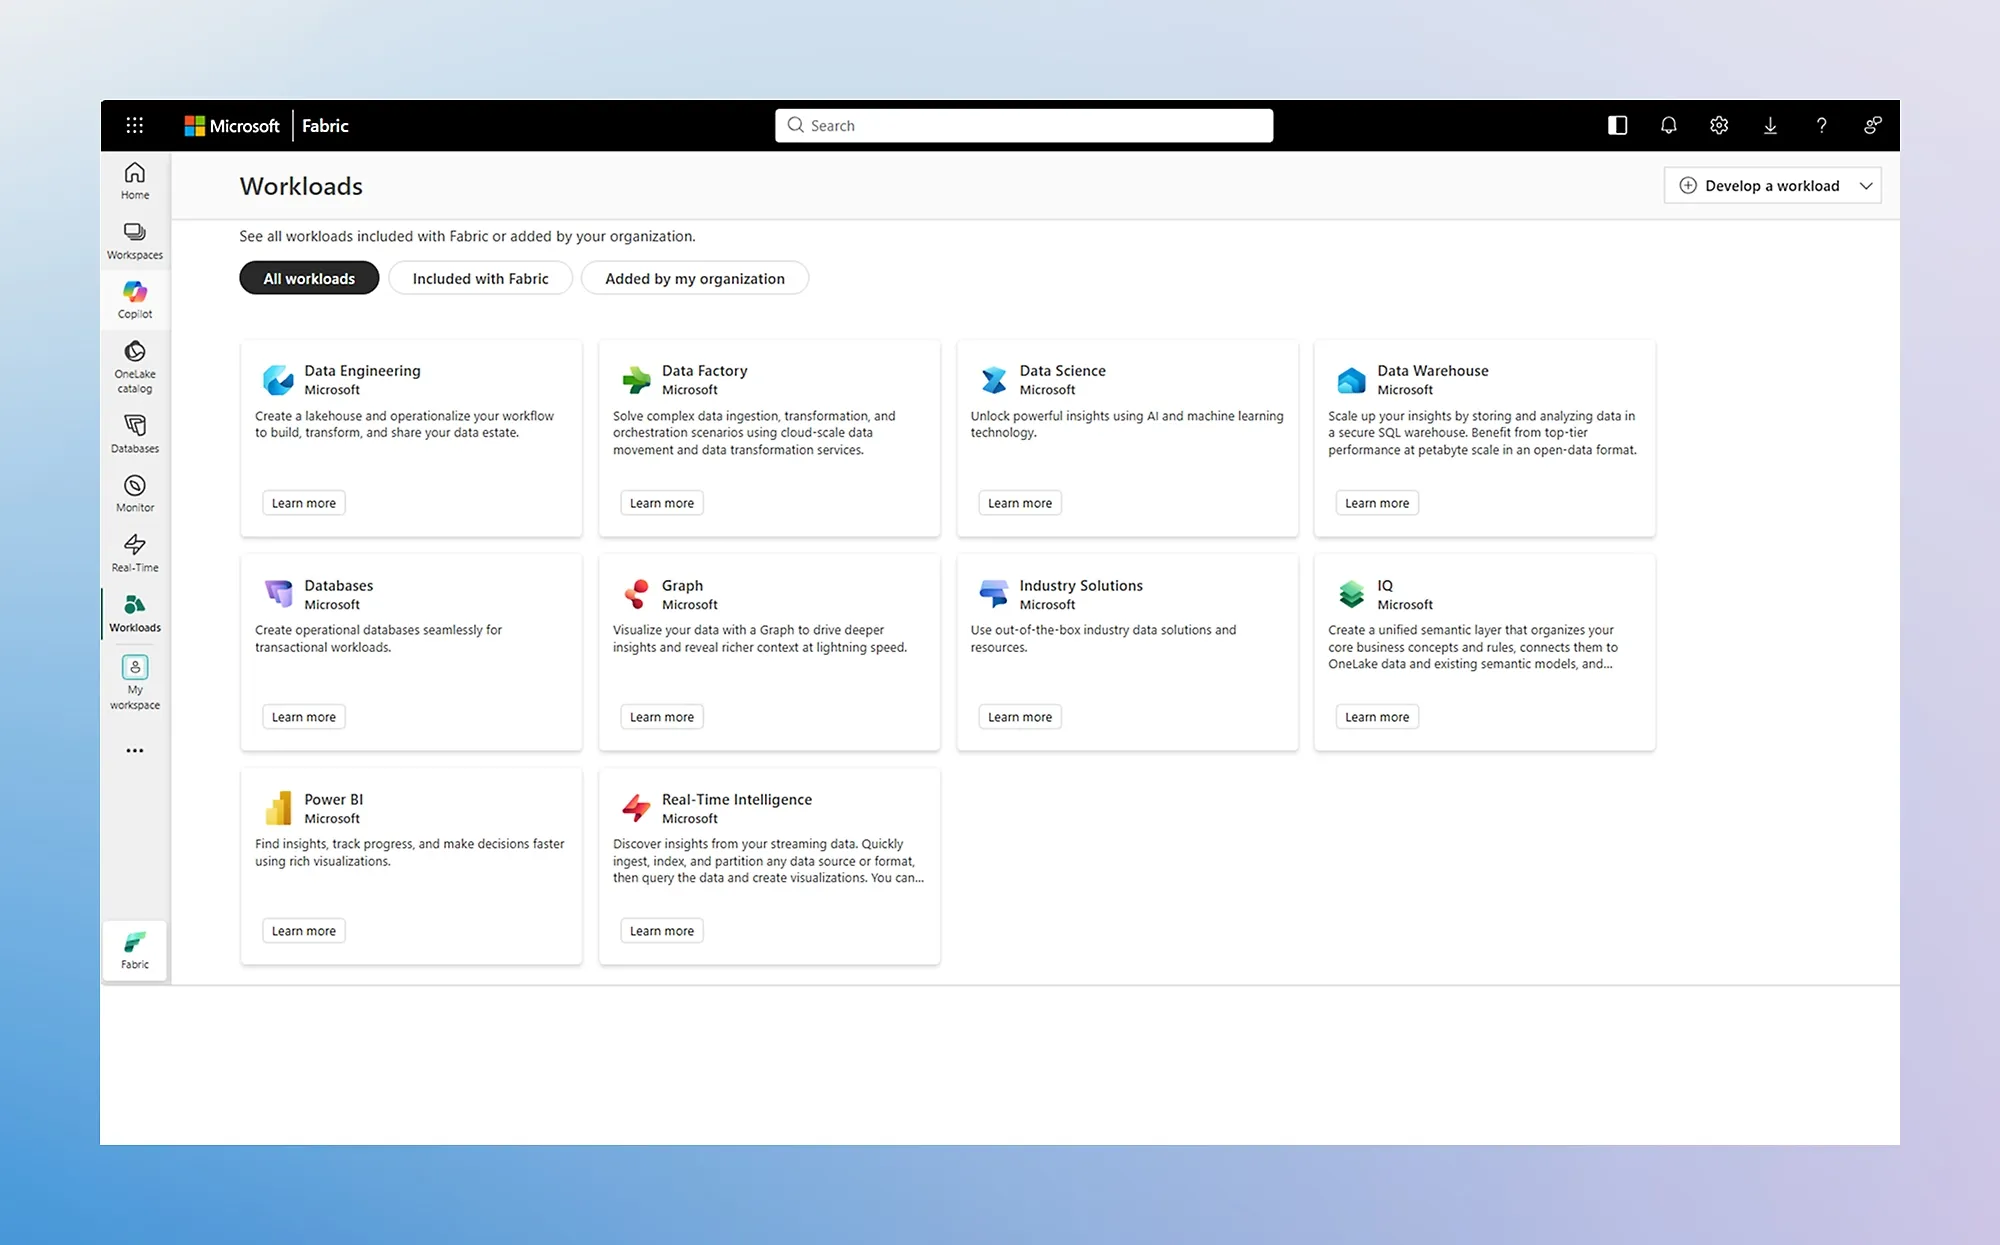
For a shop already standardized on Microsoft 365, nothing else on the shortlist connects as tightly.
AI-assisted insights with Copilot
Copilot layers onto your reports inside Microsoft Fabric.
Ask a question conversationally, and it returns forecasting or anomaly detection, plus a written recap of what the numbers show, without a separate visual for each one.
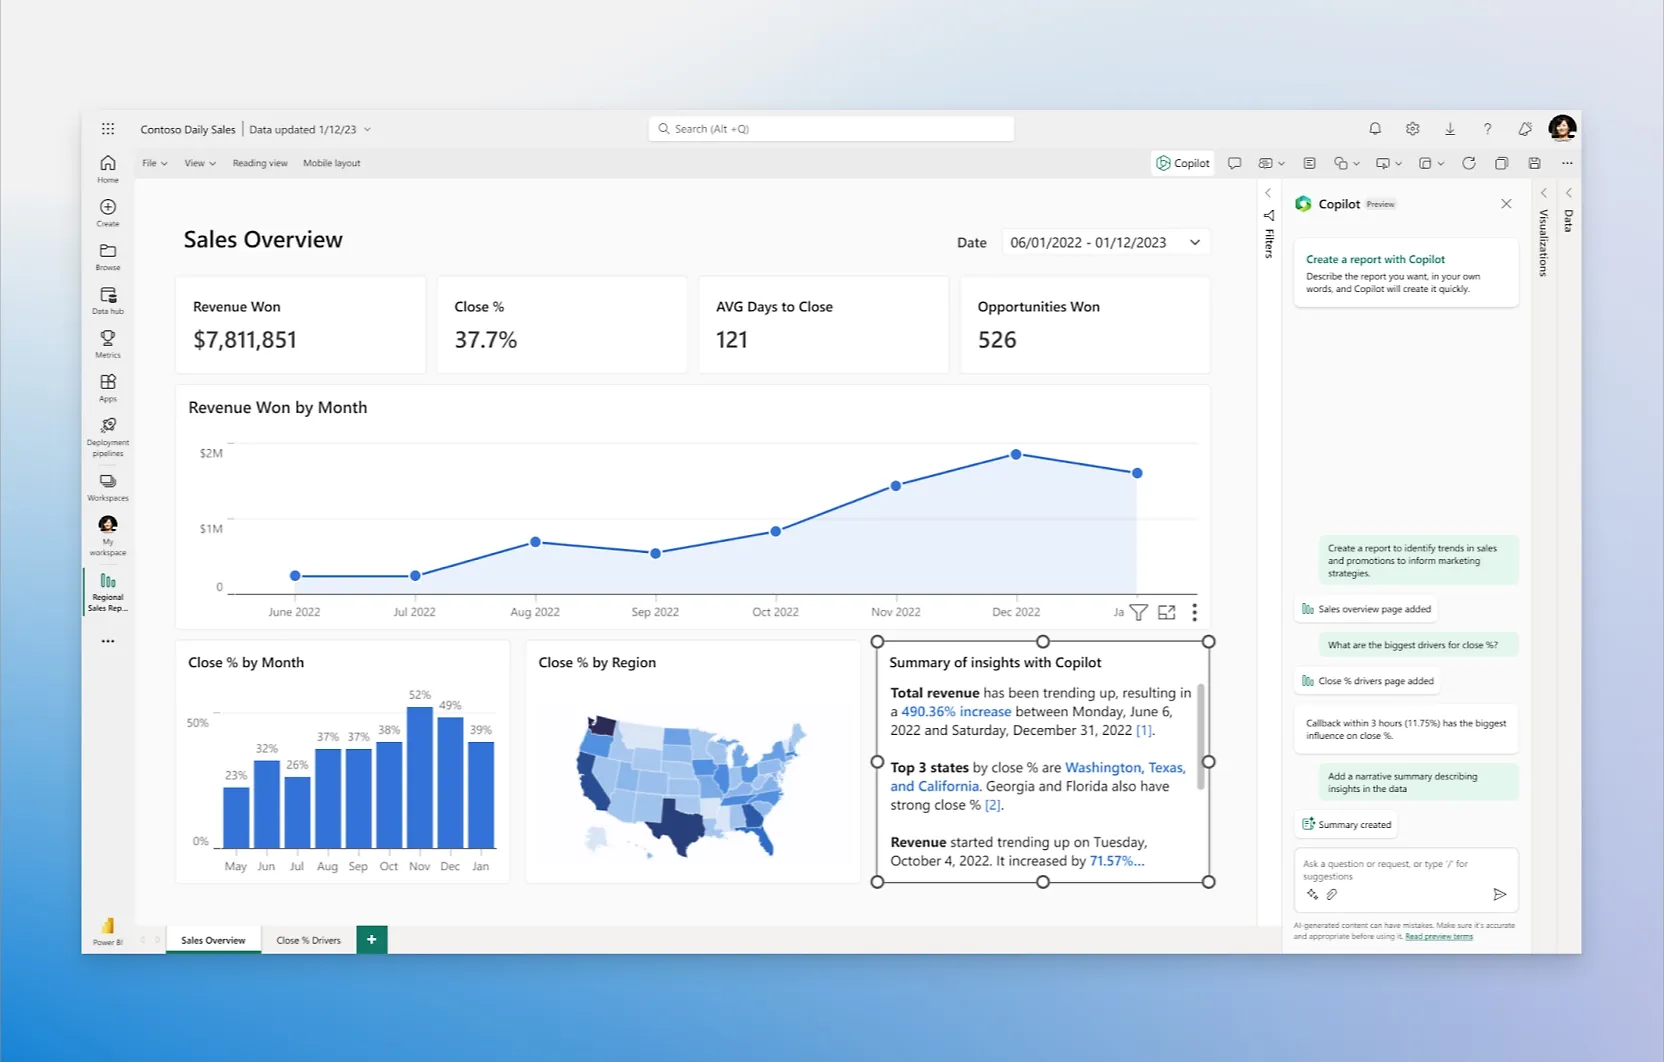
How much it can explain still tracks how carefully your underlying model was built.
Power BI is best suited if:
✅ You're already invested in Microsoft 365 and Azure.
✅ You want standardized reporting rolled out across a lot of teams.
✅ Your analysts don't mind building and owning the data model.
✅ Controls like row-level security and sensitivity labels are non-negotiable for you.
Power BI may not be ideal if:
❌ Your team has to build the models, not just read the reports.
❌ You work with very large or complex datasets, where models can slow down or bump into size and memory limits.
❌ You want a simple platform with no learning curve, as for beginners, the learning curve can feel steep, according to a G2 review.
❌ You have Mac users who need to author reports, since Power BI Desktop is Windows-only.
Dot's features
Sisense and Power BI both put their effort into showing you data.
You build the model, they draw the charts, and reading them is left to you.
Dot goes the other way, doing the analysis and handing back the finding in words.
Adding one more dashboard tool to a crowded category was never the goal.
What we're after is giving teams whose data is already in a warehouse an AI data analyst that works out what happened and why, then says what to do next.
Natural language analysis in Slack and Teams
Real questions from real people are messy.
Someone wants to know why sign-ups slipped over the past two weeks, or how this quarter's pipeline stacks up against the same stretch last year, and answering it means bouncing between dashboards or waiting in the analyst queue.
Your team can ask Dot in Slack, Microsoft Teams, email, or the web app, and a full answer comes back in minutes.
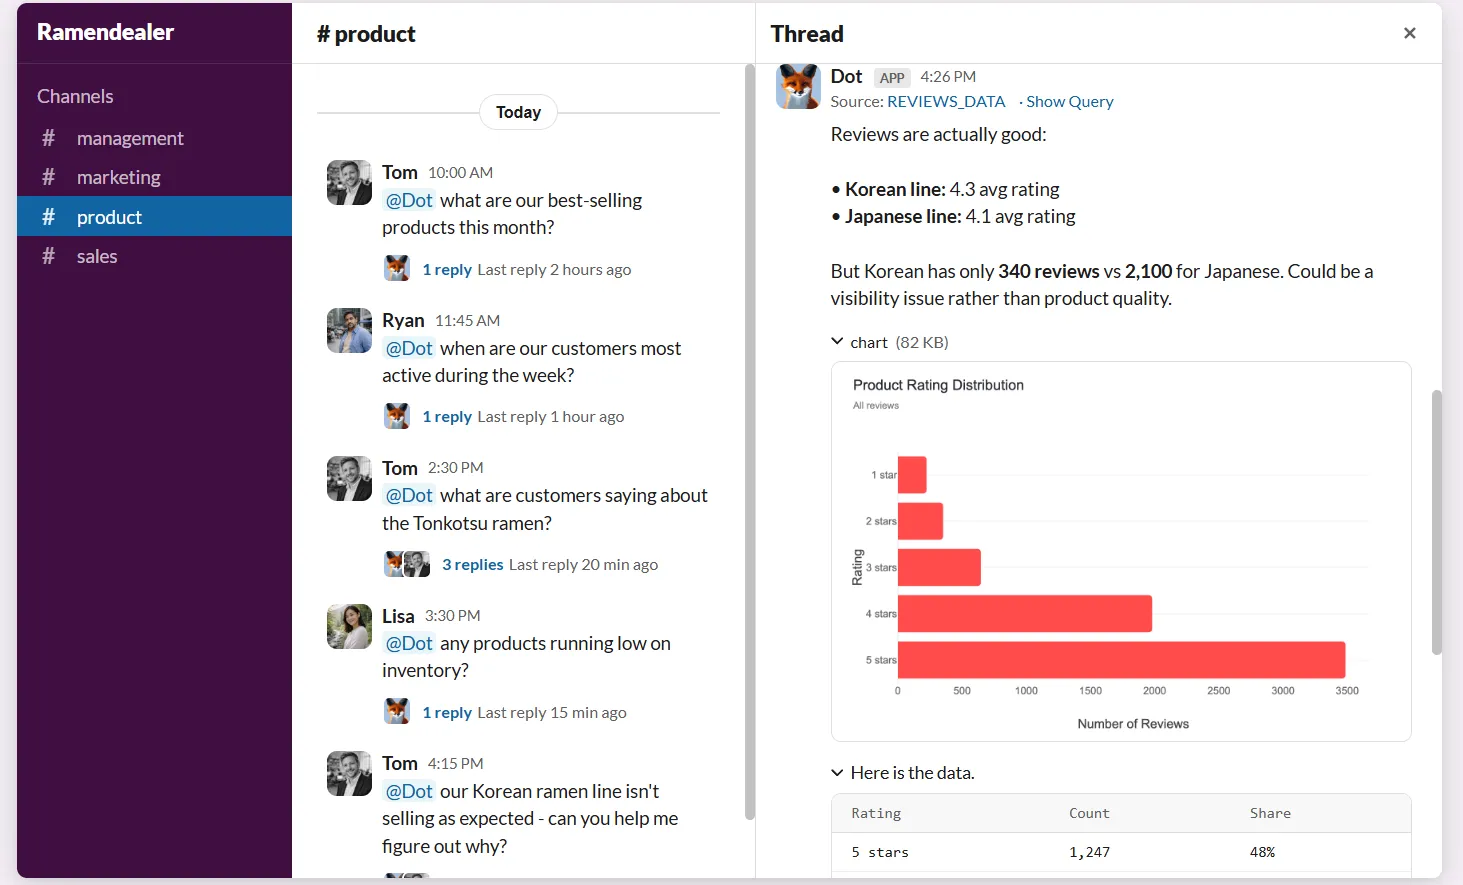
It won't be a lone number.
Dot lays out what moved and the likeliest cause, down to the segments doing the pulling.
For the data team, the steady drip of small requests handles itself, which frees analysts for the work that needs a person.
Deep Analysis for the harder questions
A quick lookup and a real investigation are not the same job.
Deep Analysis is Dot's research mode, an autonomous analyst that runs a chain of queries and pressure-tests its root-cause answers before settling on one.
Recent updates pushed it into high-dimensional data it used to skip, and it now attaches a confidence level to every driver it flags.
You watch the investigation unfold query by query, and what lands is a structured report: one quantified takeaway, a short summary, the charts that support it, and the actions to take next.
Every figure links back to its source, and the finished report exports to PowerPoint in one click.
Where a dashboard assistant can only recap what's already on screen, Deep Analysis goes and works the question from the data up.
Business reviews that run themselves
Every reporting cycle, the leadership review simply shows up.
Dot builds it from the warehouse on the cadence you set, written as a narrative that covers what changed and where attention should go.
The chunk of someone's week that used to go into pulling numbers and writing the summary now runs on its own.
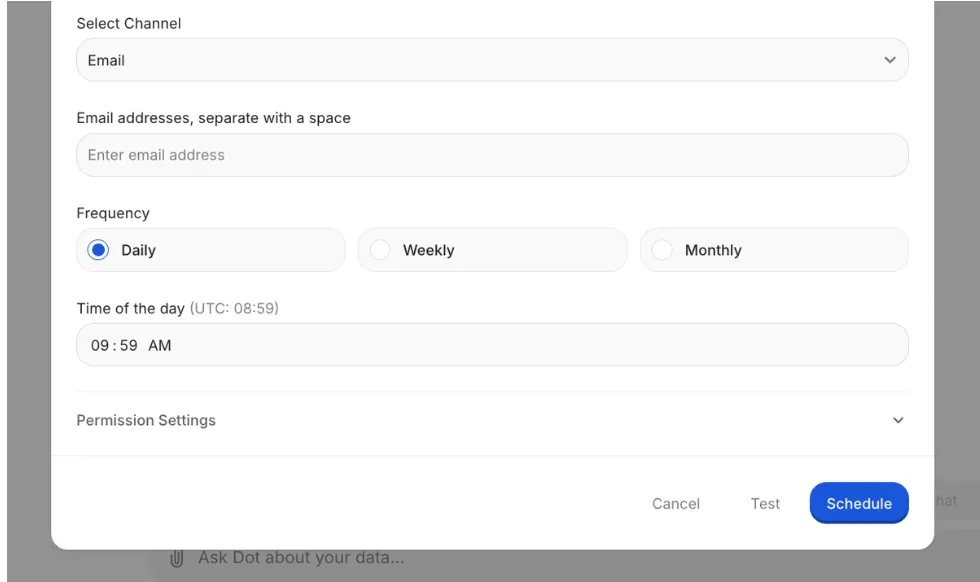
Those schedules have grown into a background agent.
Add a work gate so it only runs when new orders came in today, and a result gate so it only pings you when revenue drops more than five percent, and it stays quiet until something is worth your attention.
The Context Agent and shared definitions
Finance calls an account active while product means something narrower, and the weekly meeting stalls on whose number is right.
The Context Agent settles that.
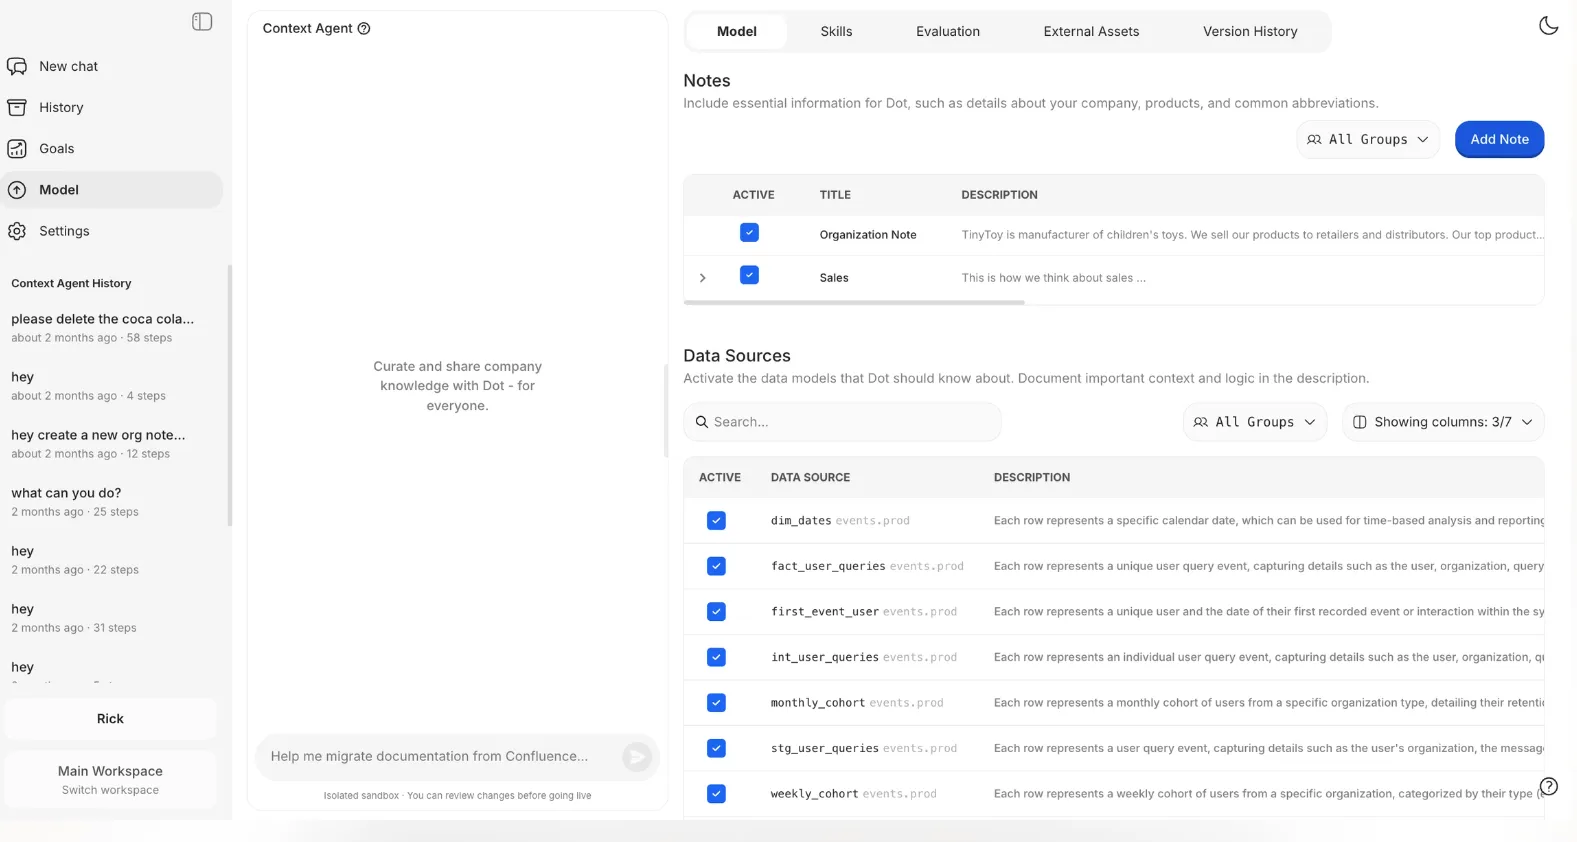
Running on Dot's DotML semantic layer, it holds your KPIs and definitions and applies them to every query, so answers agree no matter who asked.
And it won't rewrite your model on a whim.
Flag in chat that a table was renamed or a metric looks off, and Dot raises a proposal, then only after an admin reviews the full diff does the change merge.
Dashboards built from a brief
When a dashboard is what you actually want, Dot assembles one from a short description.
Say what belongs on it, and you get an interactive board of KPIs, charts, tables, and filters to tweak, then publish and share by link.
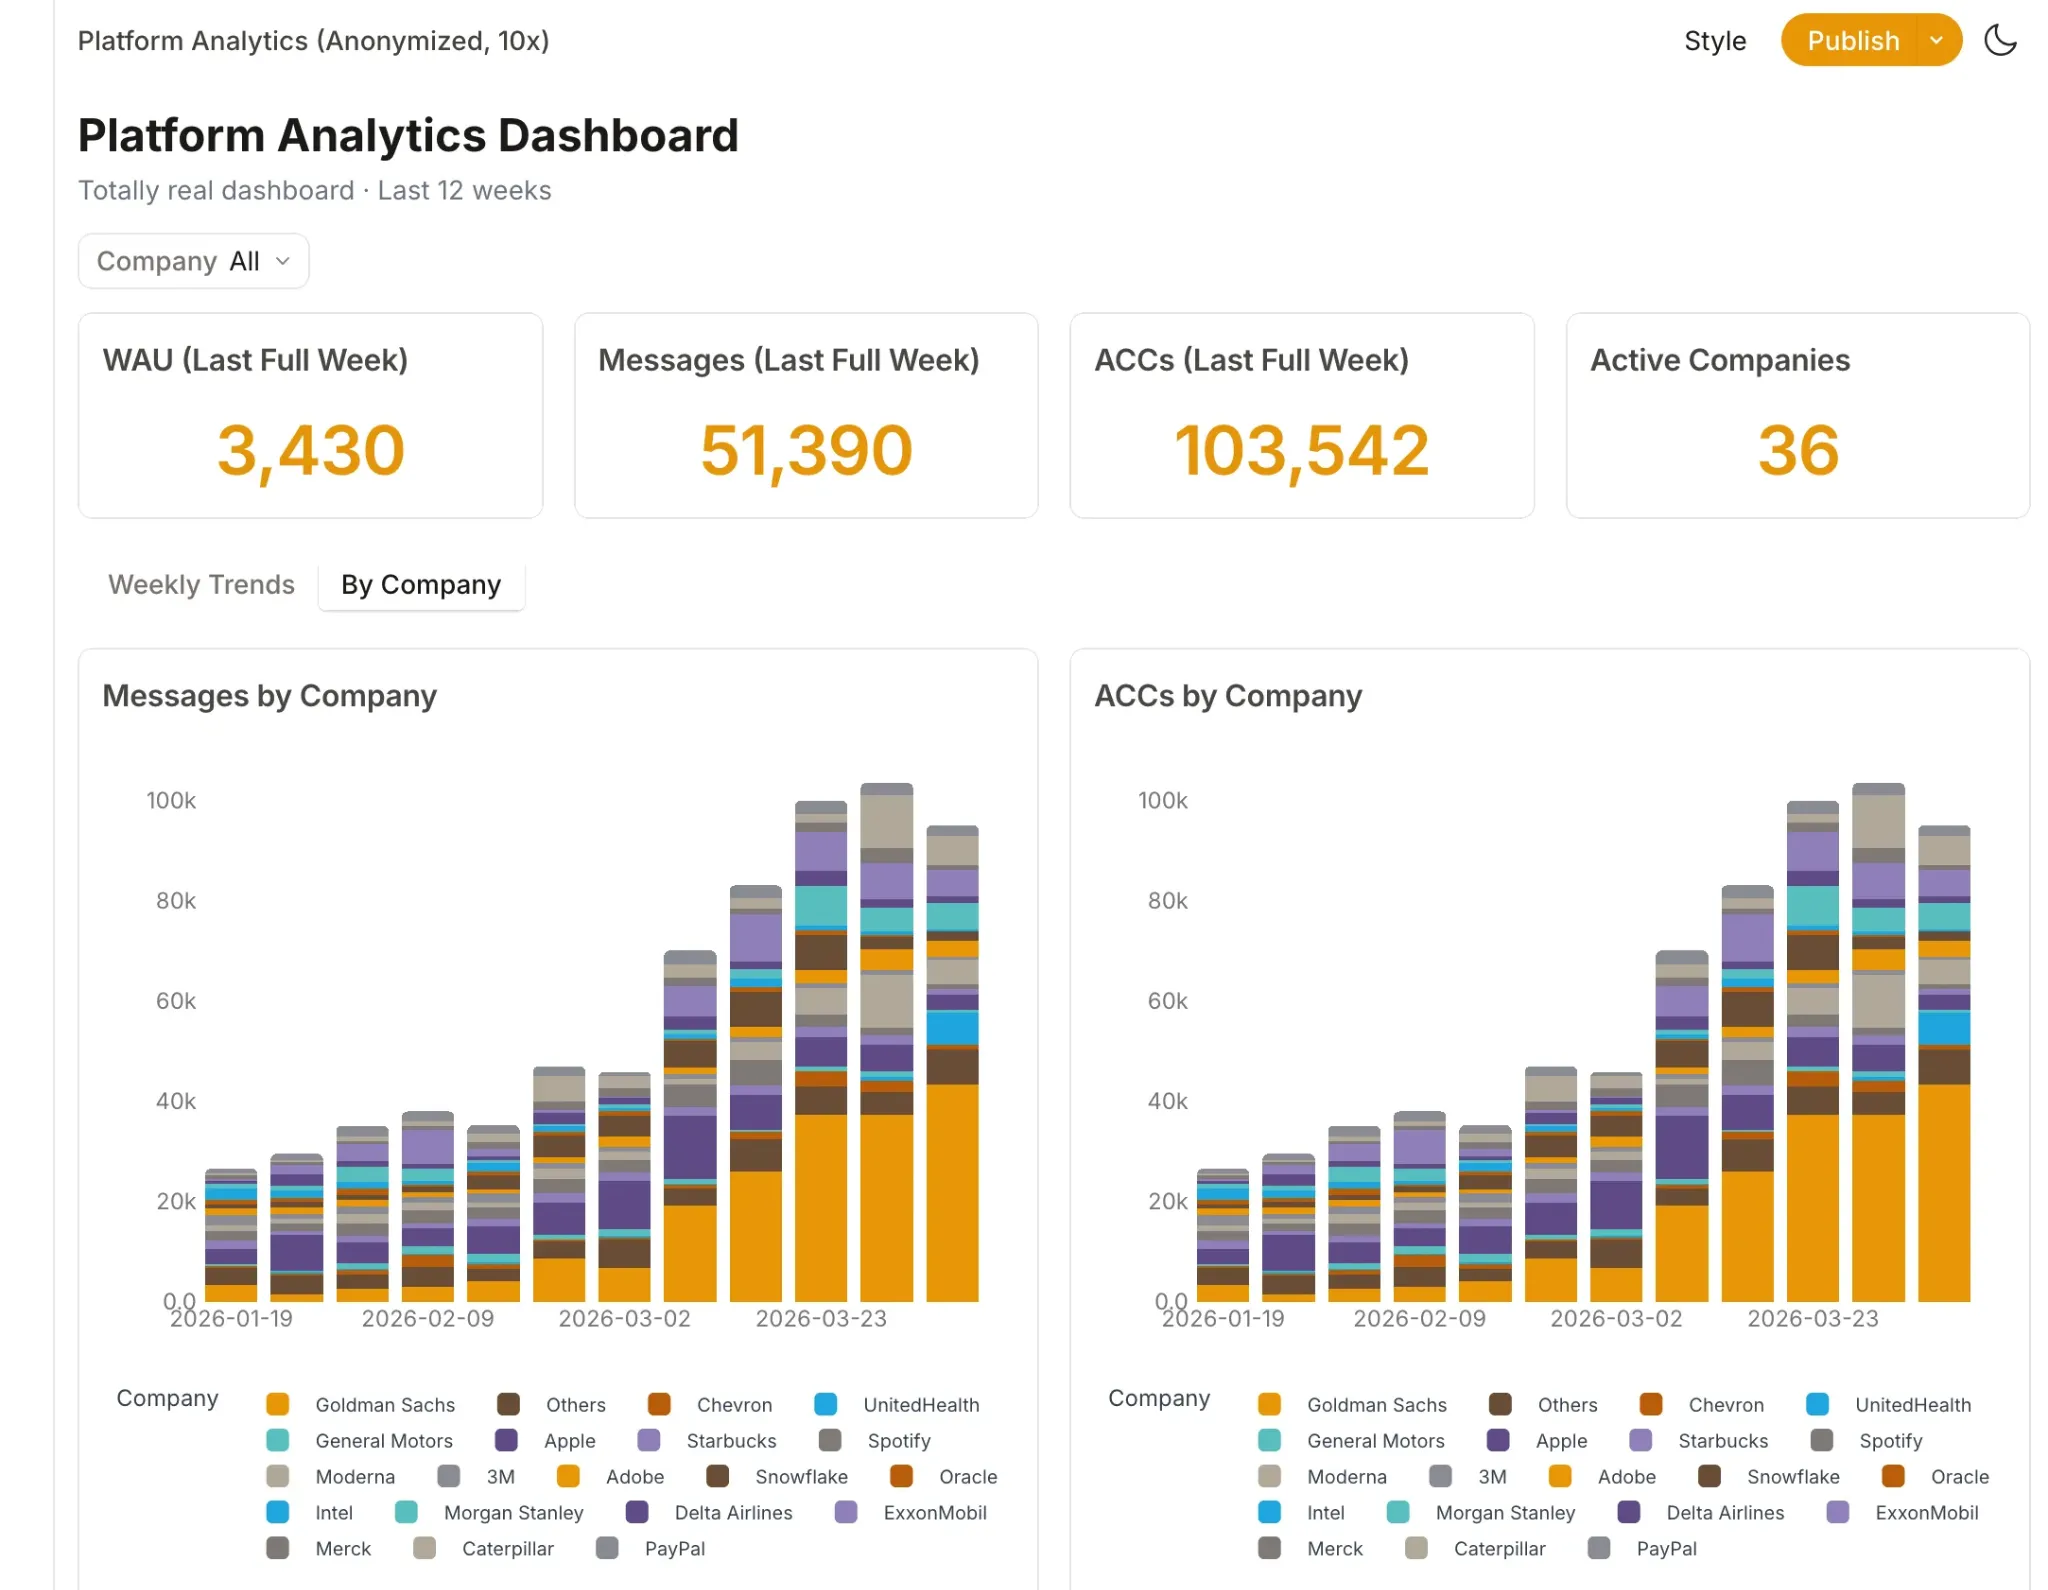
It reloads data every time it opens and handles relative date ranges and refresh on its own, so the visual layer shows up without you wiring it together by hand.
Dot is the right choice if you:
✅ Keep your data in a warehouse like Snowflake, BigQuery, Redshift, or Databricks and want answers, not one more board to keep alive.
✅ Keep fielding the same Slack questions and want an analyst-level reply within minutes.
✅ Lose hours every cycle assembling the executive review by hand.
✅ Want governed answers you can audit, with every number tied to the query that produced it.
Dot isn't the best option if you:
❌ Don't have a cloud warehouse running yet, because Dot reads from one and won't stand in for it.
❌ Need a heavy, pixel-perfect visualization suite as your main output, since Dot puts the written answer ahead of the dashboard.
Integrations: Sisense vs. Microsoft Power BI vs. Dot
Sisense integrations
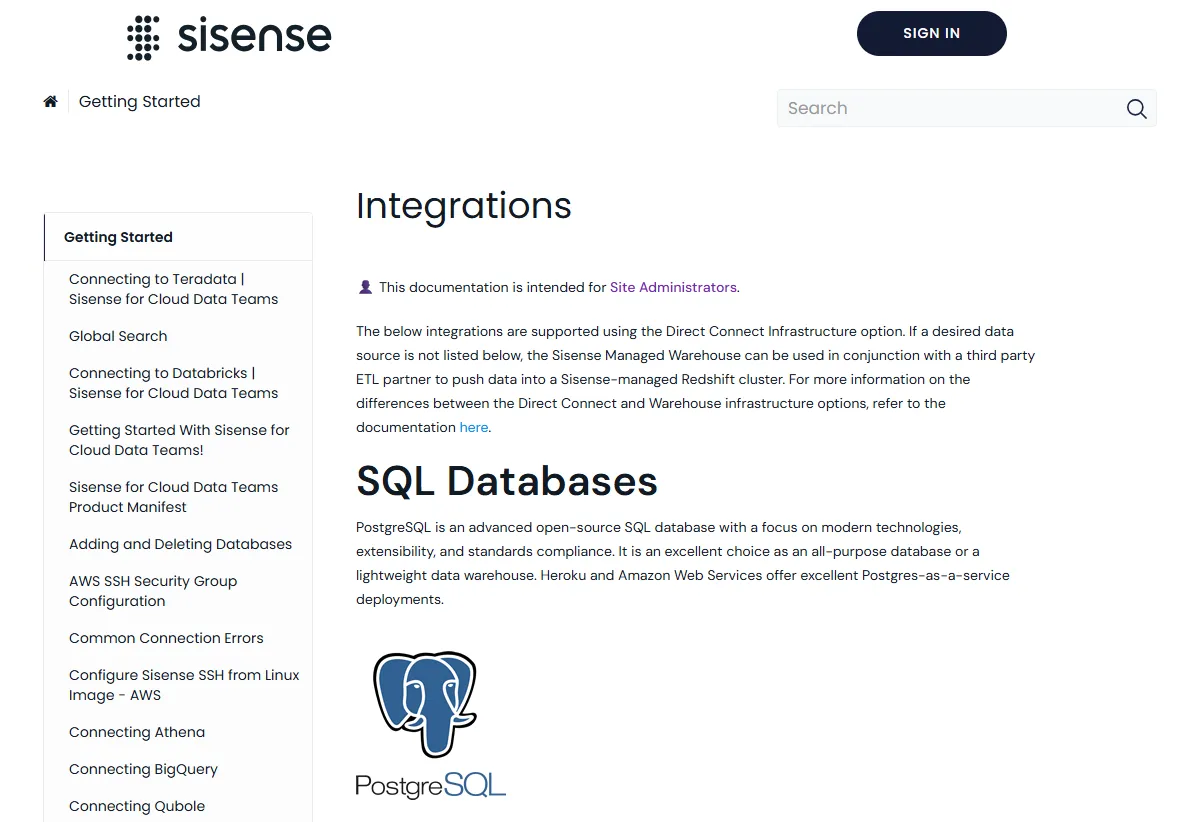
Sisense connects through a large library of connectors and a flexible engine that can run live, cache in ElastiCube, or do both.
A short list of notable connections:
- Snowflake and Amazon Redshift.
- Google BigQuery.
- PostgreSQL and MySQL.
- Salesforce.
- External AI agents like Claude and ChatGPT through MCP.
Microsoft Power BI integrations
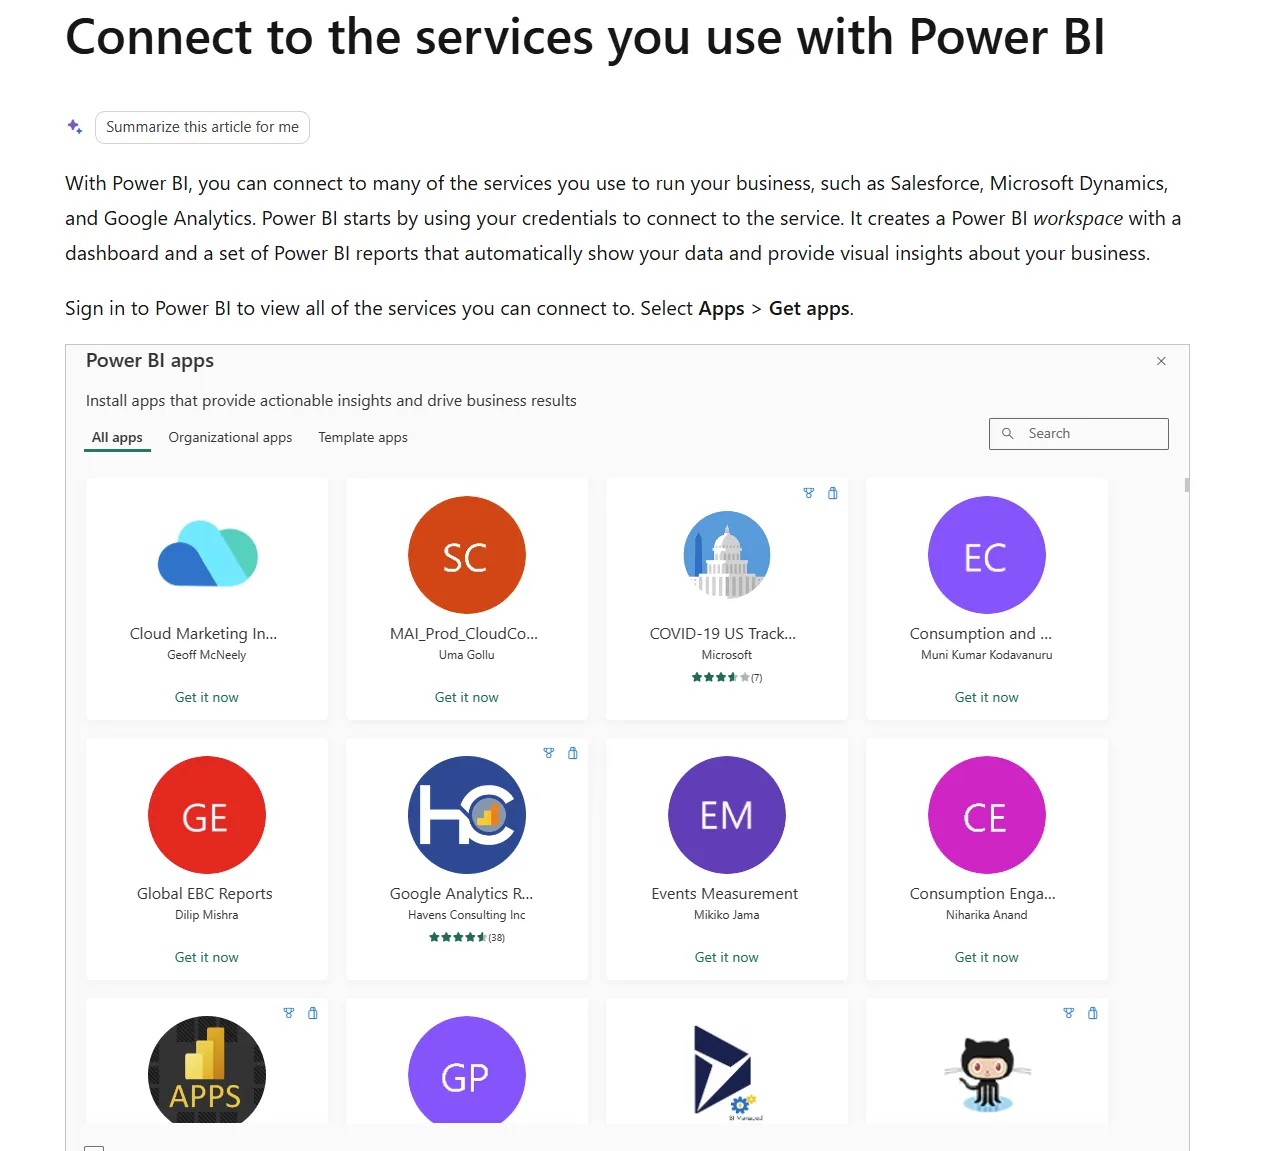
For Power BI, integrations mean the Microsoft stack first, with hundreds more connectors reaching outside databases and services.
A short list of notable connections:
- Excel and Microsoft 365.
- Azure and OneLake.
- SQL Server.
- SharePoint and Teams.
- Dynamics 365.
- Snowflake.
Dot integrations
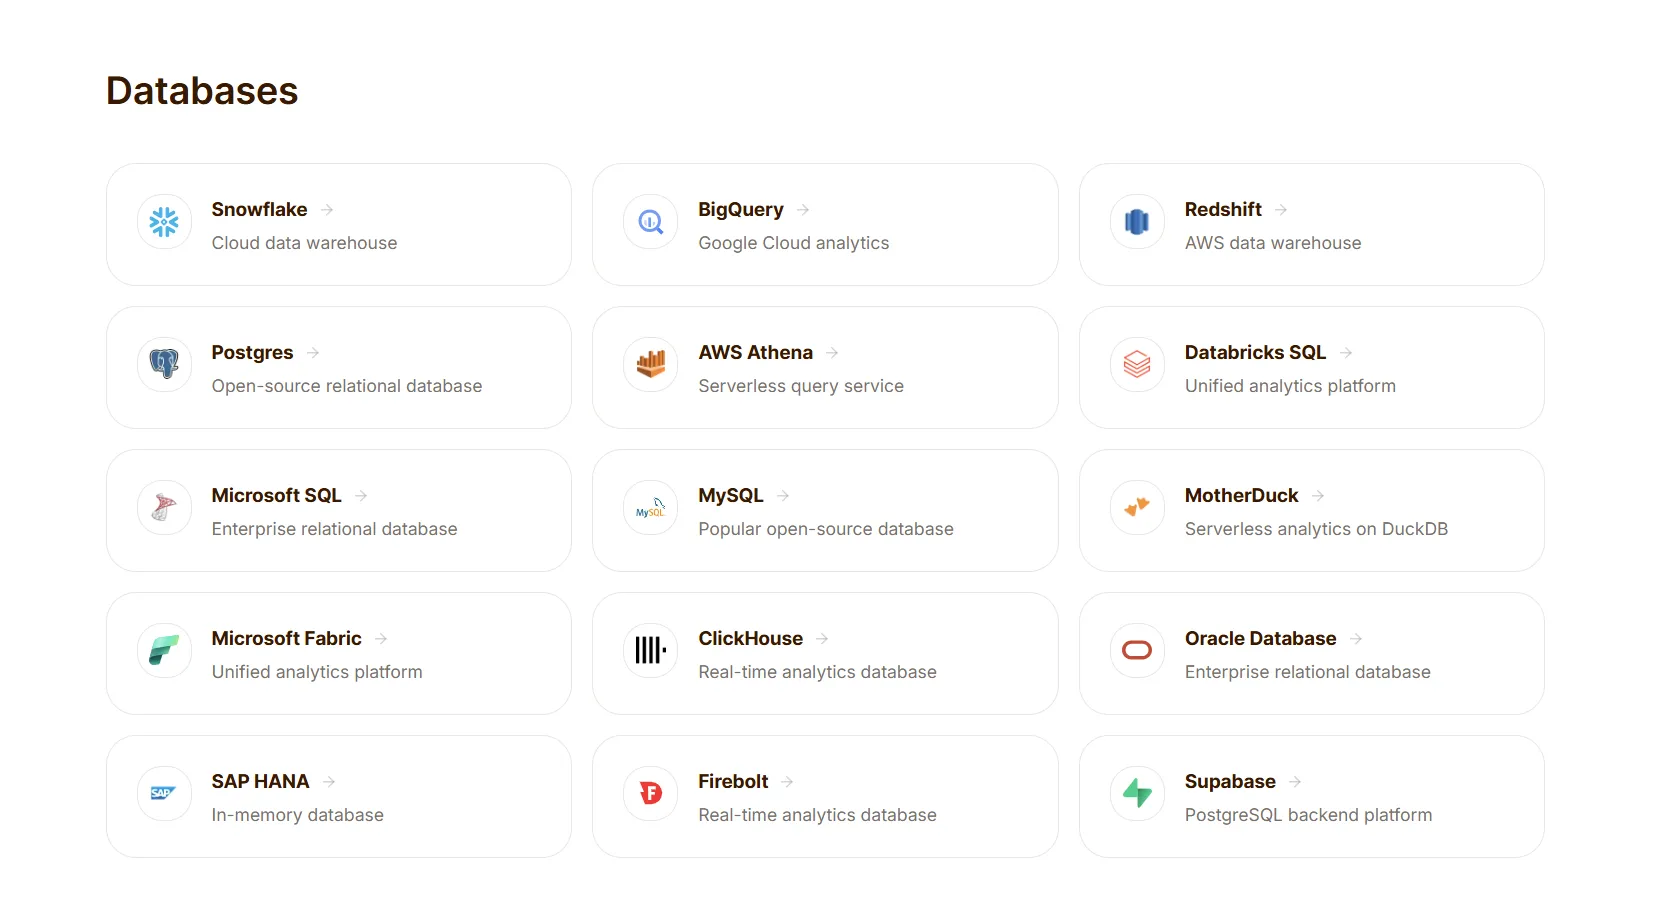
Dot reads from the warehouse you already run, and it picks up the modeling you've done in dbt and Looker, so that work carries over untouched.
It also uses MCP to reach the tools your team works in, wiring Dot into platforms such as Claude and ChatGPT.
A short list of notable connections:
- Snowflake and BigQuery.
- Redshift and Databricks.
- PostgreSQL and MySQL.
- dbt and Looker.
- Slack and Microsoft Teams.
Pricing: Sisense vs. Microsoft Power BI vs. Dot
Sisense pricing
Sisense has not disclosed its pricing publicly, so you'd have to contact them for a quote.
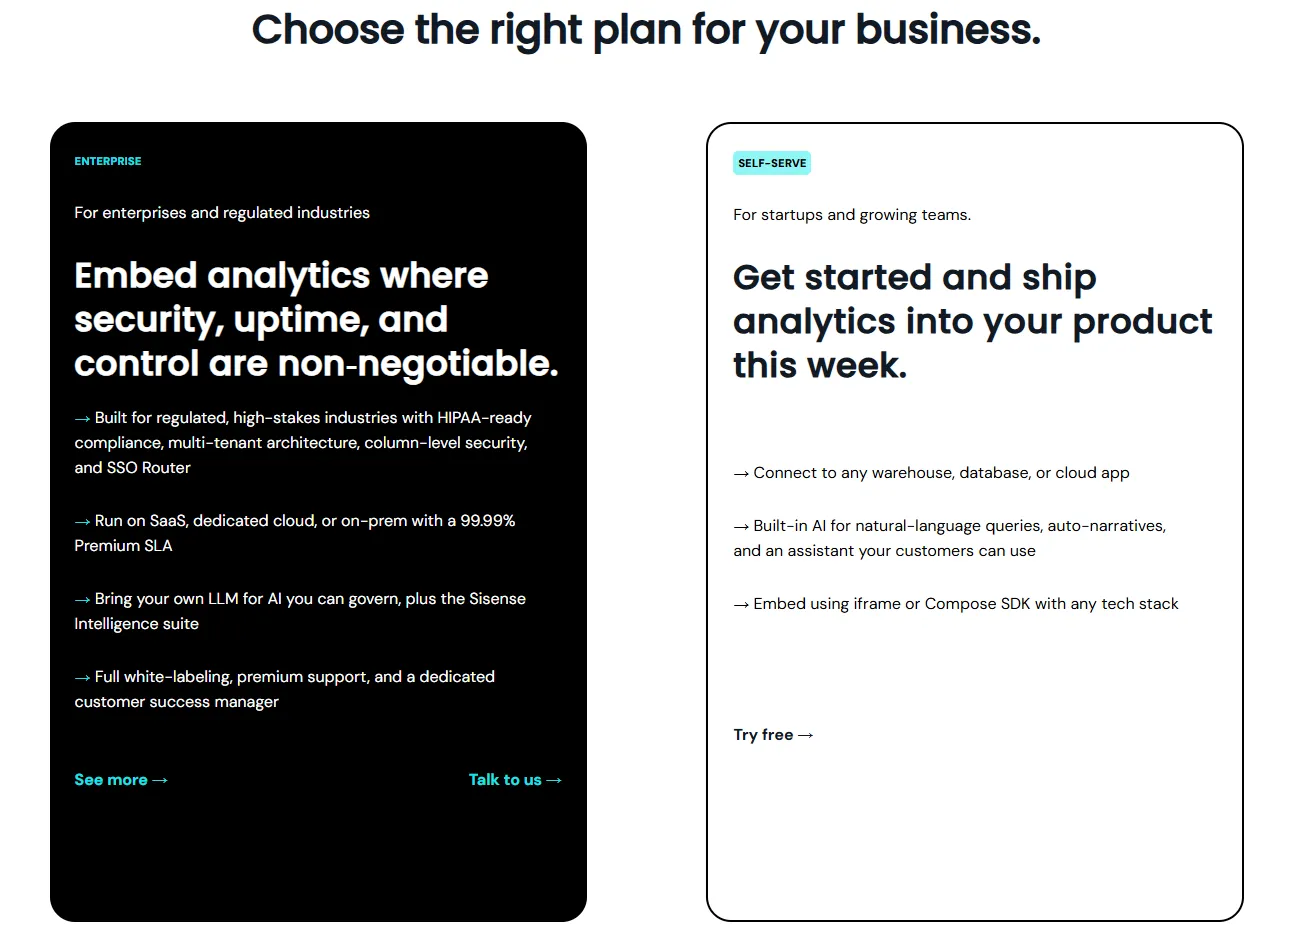
Its plans page lists two tracks:
- Self-Serve: aimed at startups and growing teams shipping analytics into a product, with a full-featured 7-day trial to start.
- Enterprise: a custom, built-to-spec plan for regulated and high-stakes deployments, with an SLA, deployment choice, and dedicated support.
Microsoft Power BI pricing
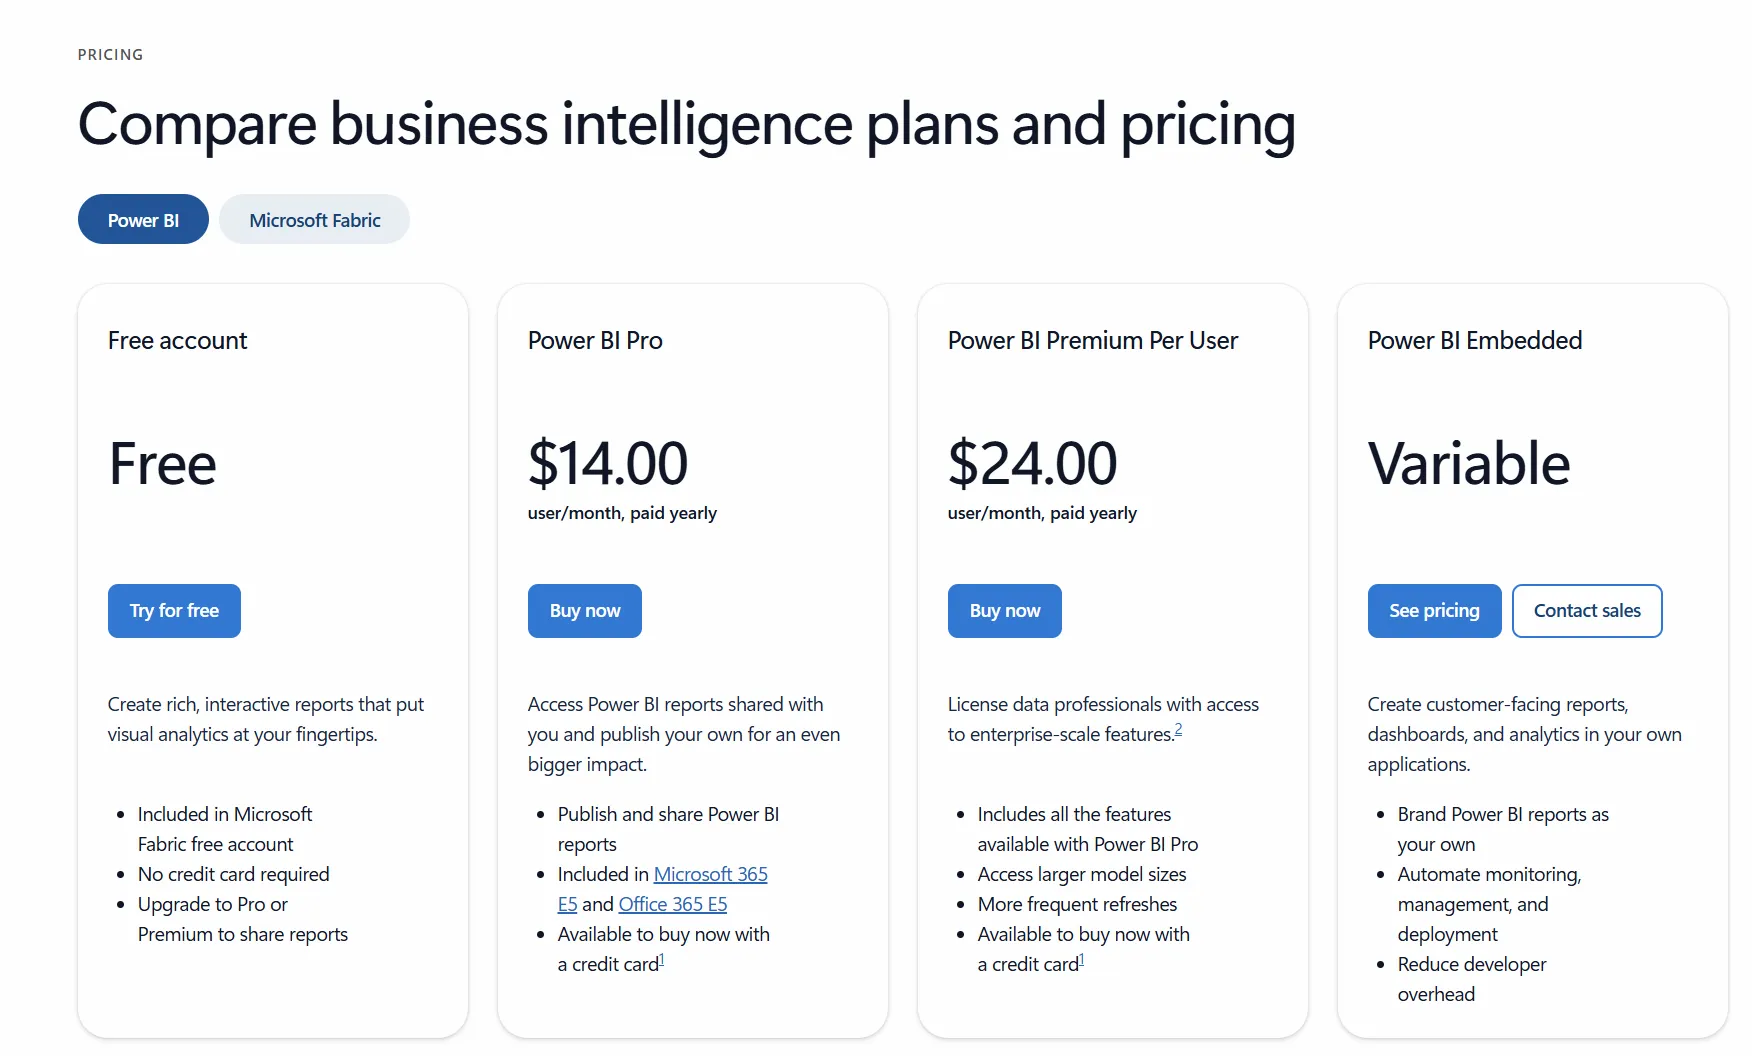
Power BI prices two ways, per user and per capacity, plus a free option for one person that can't share.
- Free: build reports in Power BI Desktop on your own machine, with no sharing.
- Power BI Pro: $14/user/month on annual billing, which unlocks publishing and sharing, shared workspaces for collaboration, and report embedding in Teams and SharePoint.
- Power BI Premium Per User: $24/user/month on annual billing, stepping up to much larger data models, refreshes that run more often, paginated reporting, and the heavier AI features.
- Fabric capacity and Embedded: variable, compute-based pricing for scaling reports and license-free viewing above an F64 capacity.
Dot pricing
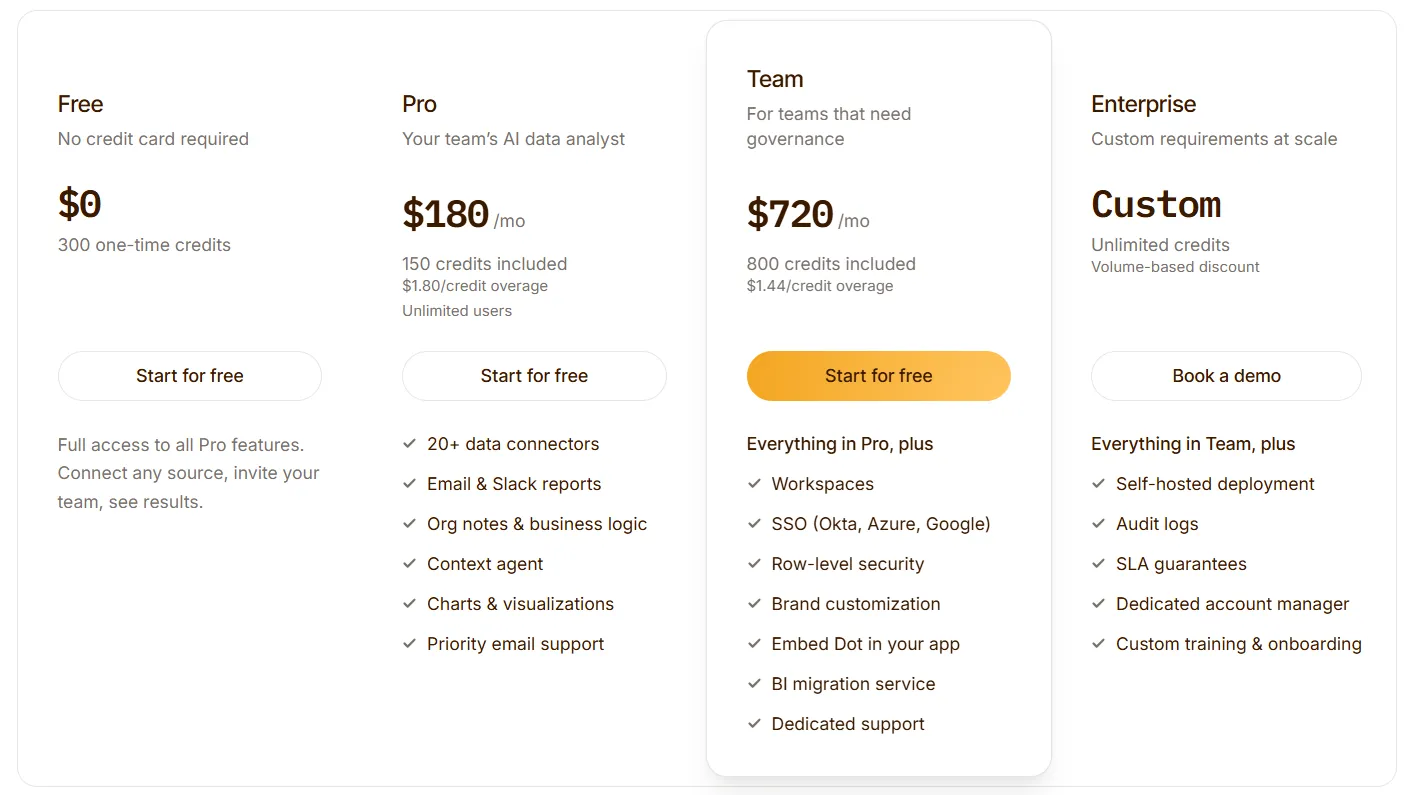
The free plan comes with 300 one-time credits and the complete Pro feature set, which is enough to test Dot on live work before paying.
Past that, there are three paid tiers:
- Pro: $180/month, with 150 credits a month, $1.80 per extra credit, and unlimited users.
- Team: $720/month, with 800 credits a month, a $1.44 overage rate, and SSO, row-level security, embedding, BI migration help, and dedicated support.
- Enterprise: custom pricing, with unlimited credits, a volume discount, self-hosted deployment, audit logs, an SLA, and a dedicated account manager.
Sisense, Microsoft Power BI, or Dot: summary
Here's how the three BI tools for data visualization stack up:
Sisense | Microsoft Power BI | Dot | |
Best for | Product teams and developers embedding analytics, plus teams wanting a customizable BI layer | Microsoft-heavy orgs that want standardized dashboards at scale | Warehouse teams that want answers, not another dashboard to maintain |
Standout feature | Embeddable analytics through Compose SDK | Native Microsoft and Excel integration | Answers-first AI analysis delivered in Slack, Teams, email, and the web app |
Integrations | More than 200 connectors, with live, cache, or hybrid modes and MCP | Hundreds of connectors and the full Microsoft stack | Warehouse-native, reuses dbt and Looker, MCP support |
Free tier? | No (7-day free trial) | Yes (personal use, no sharing) | Yes (300 credits, full Pro features) |
Starts from | Custom (contact sales) | $14/user/month | $180/month, unlimited users |
Get started with Dot for free today
Dot takes a different route than Sisense and Microsoft Power BI.
All you have to do is connect Dot to the warehouse you're already running, put your question in normal language, and the answer comes back written up in Slack, Teams, email, or the web app, ready for whoever needs it.
Here's what your team gets with Dot:
- A free plan with 300 credits and every Pro feature, and no cap on how many people use it.
- Everyday questions answered where your team already talks, across Slack, Microsoft Teams, email, and the web app.
- Root-cause investigations from Deep Analysis, with the drivers behind a move and clear next steps.
- Leadership reviews that write themselves on your schedule and arrive as ready-to-share slides.
- Metric definitions kept consistent by the Context Agent, so numbers stop drifting between teams.
- A traceable line from any figure back to the exact SQL and dataset behind it.
➡️ Get started for free with Dot's free plan, or schedule a demo to see how it works with your data.
⚠️ Disclaimer: This article was last updated on July 23, 2026. If you spot any inaccuracies, contact us, and we'll fact-check it.
Theo Tortorici
Theo writes about AI-powered analytics, data tools, and the future of business intelligence at Dot.