
10 Best Sisense Alternatives & Competitors In 2026
I’ll go over the 10 best Sisense alternatives in 2026, grouped by the job you're actually hiring a tool to do, with honest notes on pricing and fit.
TL;DR
- Dot is the best Sisense alternative in 2026 for data and analytics teams that want the answer itself, written and delivered into Slack or Teams, with scheduled reports, a shared definition layer through its Context Agent, and an auditable trail on every figure.
- ThoughtSpot, Supaboard, and Zenlytic are the AI-native picks, each one built to turn a typed question into a real analysis and not just a chart you still have to read.
- Sigma, Omni, and Metabase cover self-service straight on the warehouse, handing business and data teams governed access without a months-long modeling effort first.
- Looker, Microsoft Power BI, and Qlik Sense round out the enterprise reporting and embedding group, the platforms most large organizations already have in place.
What are the best Sisense alternatives in 2026?
The best alternatives to Sisense in 2026 are Dot with its AI data analyst that non-technical teams can put to work on day one on Slack and Microsoft Teams, ThoughtSpot, and Supaboard.
Here's the shortlist at a glance, with who each one suits and where pricing opens up.
Tool | Use case | Price |
Dot | An AI data analyst that writes the analysis and the recommendation, then delivers both through Slack, Teams, and email. | Free plan; paid from $180/month. |
ThoughtSpot | Agentic, search-led analytics where the Spotter agent answers typed questions and builds the dashboard around them. | From $25/user/month (annual). |
Supaboard | No-code AI dashboards and a chat agent (Stella) for teams that want something live the same day. | From $85/month. |
Zenlytic | An AI analyst (Zoë) that answers with citations and spins up decks and models tied to live data. | Pricing not public. |
Sigma | Warehouse-scale analysis inside a spreadsheet interface, aimed at finance and ops. | Pricing not public. |
Omni | A governed metrics layer with quick exploration and AI help inside the workbook. | Pricing not public. |
Metabase | Open-source BI that gets simple dashboards and typed queries running cheaply. | Free (open source); Cloud from $100/month. |
Looker | Warehouse-native BI with a central LookML model and Gemini for conversational questions. | Pricing not public. |
Microsoft Power BI | Reporting and self-service for teams already standardized on Microsoft 365. | Free plan; Pro from $14/user/month. |
Qlik Sense | An associative engine for exploring tangled data relationships, common in governed and on-prem setups. | From $300/month (Starter). |
#1: Dot
Dot is the best alternative to Sisense in 2026 for data and analytics teams that want the analysis done for them, and not a dashboard handed over with a blank stare.
The way our platform works is that you connect it to your data warehouse, ask questions in Slack or Teams, and it writes back the findings and the recommendation with the option to go back and forth on what has happened.
And the best part? Setup is a connection and not a project.
Disclaimer: Yes, Dot is our platform. However, I’ll still build an argument into why our AI data analyst is the best Sisense alternative on the market in 2026.
Let’s go over some of the key features that make Dot a powerful AI-native Sisense alternative:
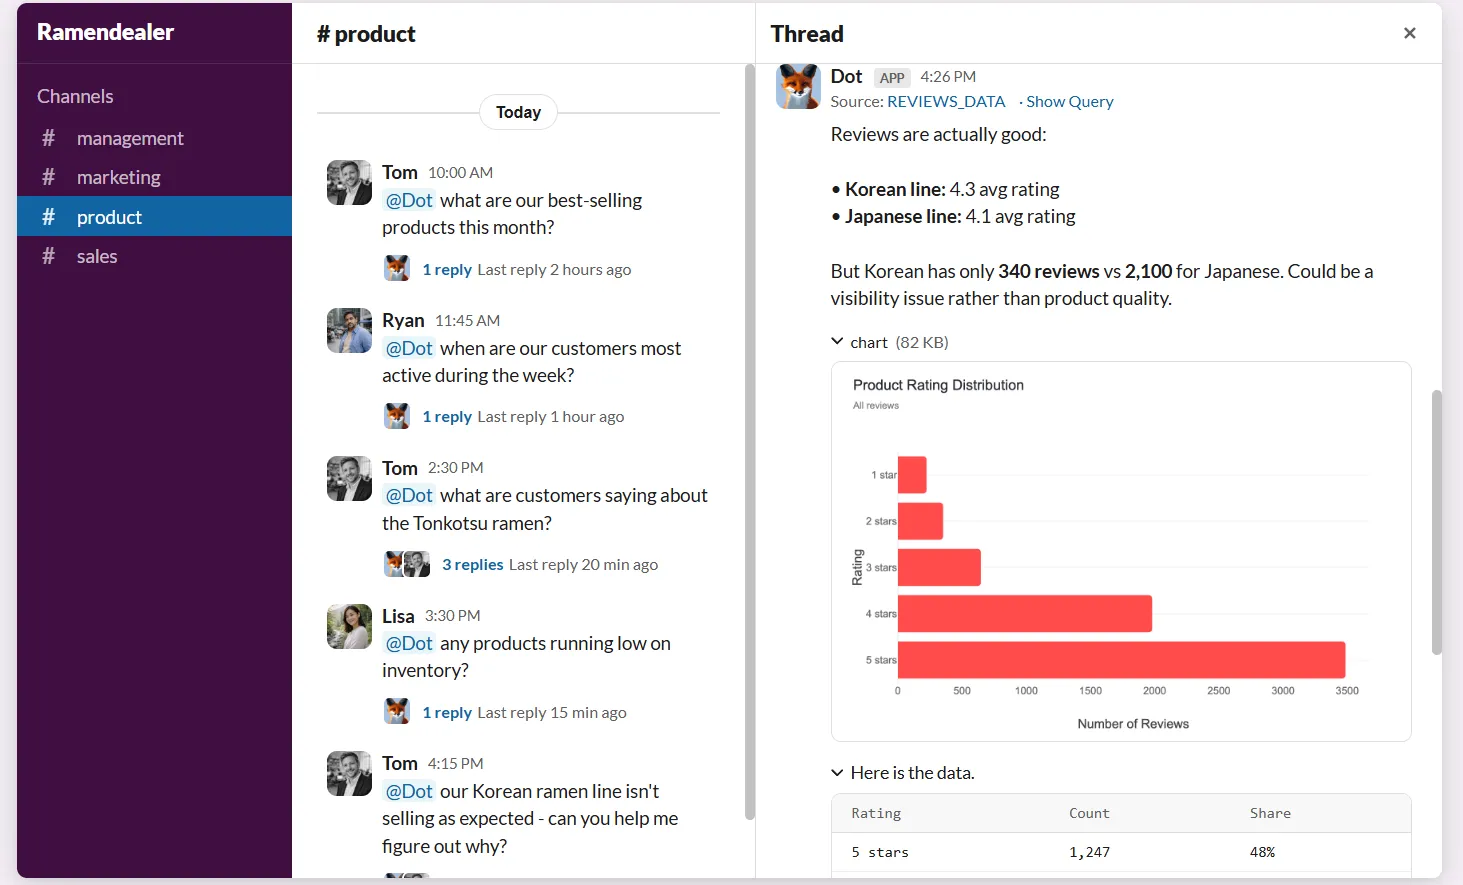
Ask in the channel, get the analysis back
Dot lets your team ask complex questions in Slack and/or Microsoft Teams, and our conversational analytics software replies directly.
Say your head of support pings the channel on a Tuesday because the ticket backlog is climbing and nobody can say why.
Normally that kicks off a thread and a wait while an analyst pulls numbers between other tasks.
With Dot, the question goes in as a message and the answer comes back as one, covering which queue grew and whether it's more tickets or slower handling, with the accounts behind the jump.
No chart to open, and no SQL to write. And nobody on the data team has to drop what they were doing.
However, our team knew that a written answer is worth nothing if you can't verify it.
So every figure Dot returns carries its working underneath, and you’ll be able to see the query that produced the number along with the rows it ran against.
When something looks off, you can confirm it yourself in seconds, with no one to chase.
The recurring report that builds itself
Most recurring reporting is a short list of chores done by someone who'd rather be doing real work.
Refresh the numbers, retype last period's notes, export the slides, hope the room reads them.
Dot runs that loop for you.
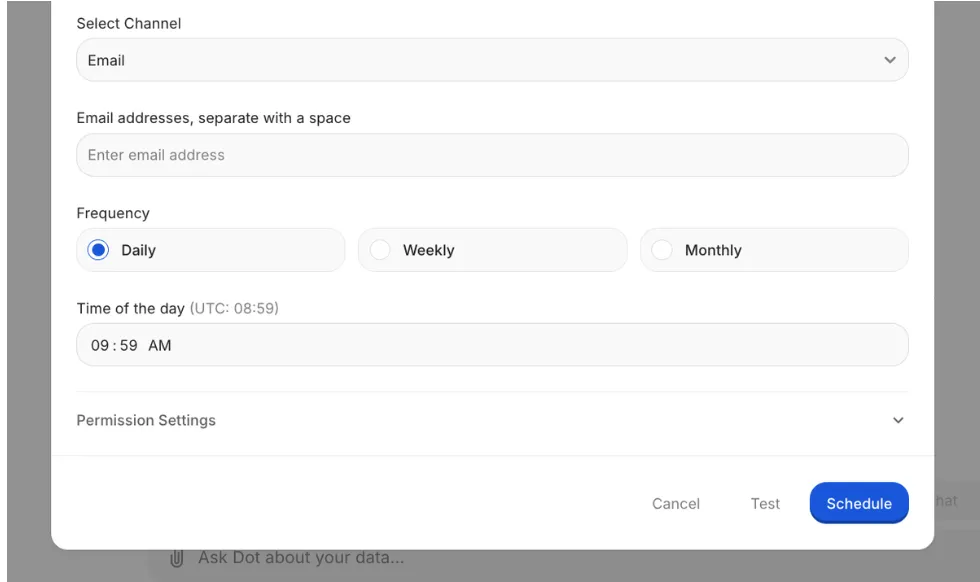
You can set the schedule and the source once, and each period it pulls live data and sends out a finished PowerPoint, period-over-period figures, and a short written read on what shifted and why.
One definition of a metric, not five
Metrics drift the moment two people define them in two places.
One report counts free trials as customers, another doesn't, and a planning meeting turns into a standoff over which dashboard to believe.
Dot's Context Agent reads the dbt models and the metric docs you point it at, learns how your business labels things, then answers from that one shared definition every time.
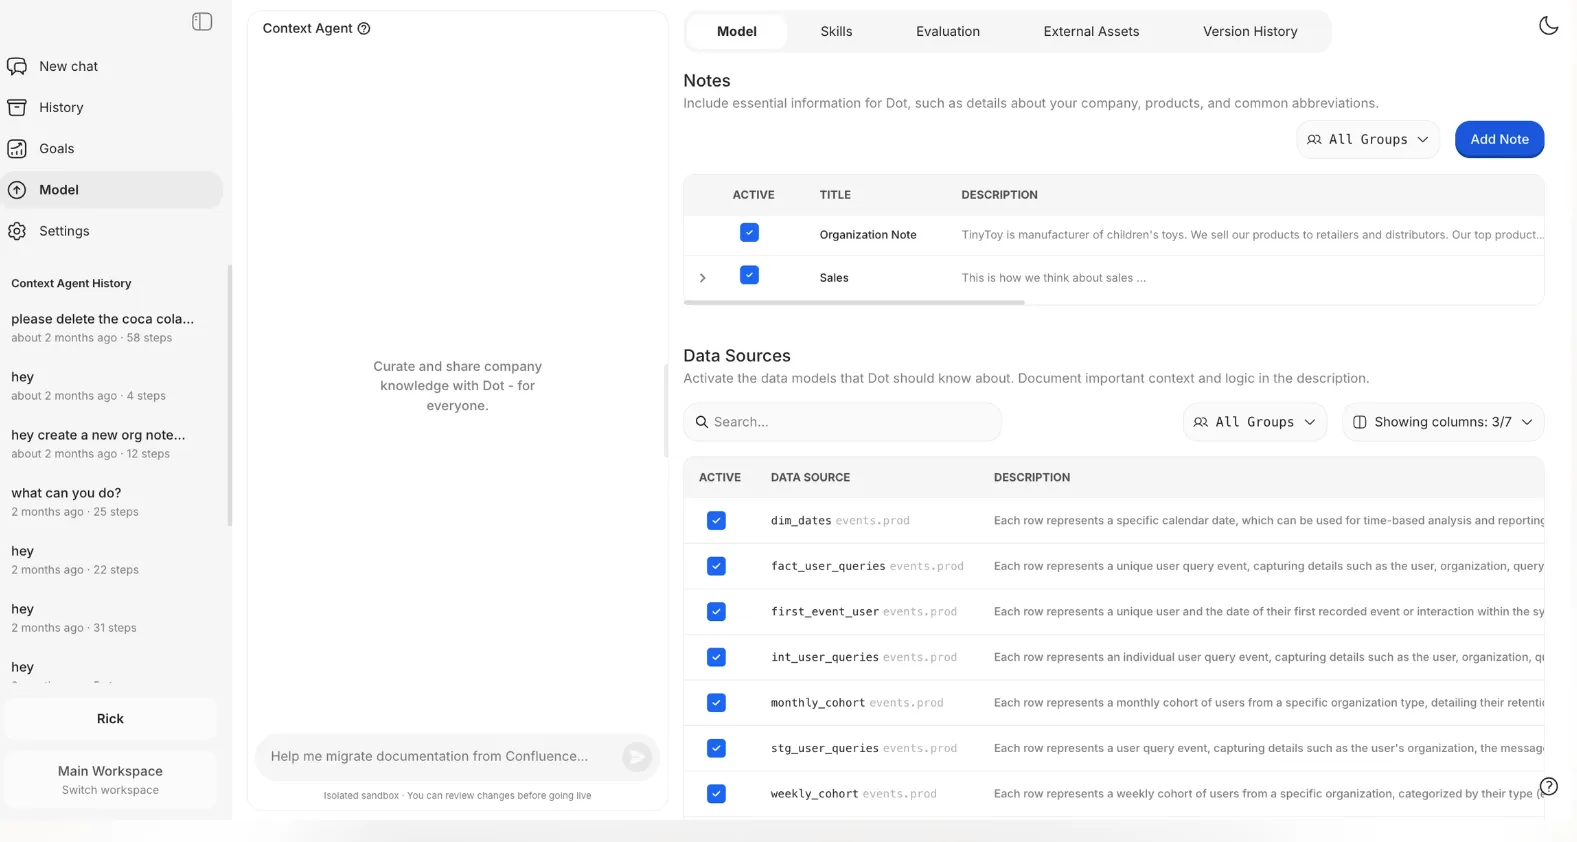
Where a definition is missing, it drafts one for you to confirm, and where two sources (inevitably) disagree, it surfaces the conflict and leaves the decision with you.
How Dot fits the stack you already run
Unlike some of the other Sisense alternatives, Dot doesn't replace anything you've already built.
Our decision intelligence software connects to the usual warehouses, Snowflake, BigQuery, Redshift, Databricks, and to operational databases like Postgres and SQL Server, so analysis happens against your data already set up in place.
It also reuses the models you've built in dbt, Looker, or Power BI, which means the metric logic you maintain doesn't get rewritten in a second tool.
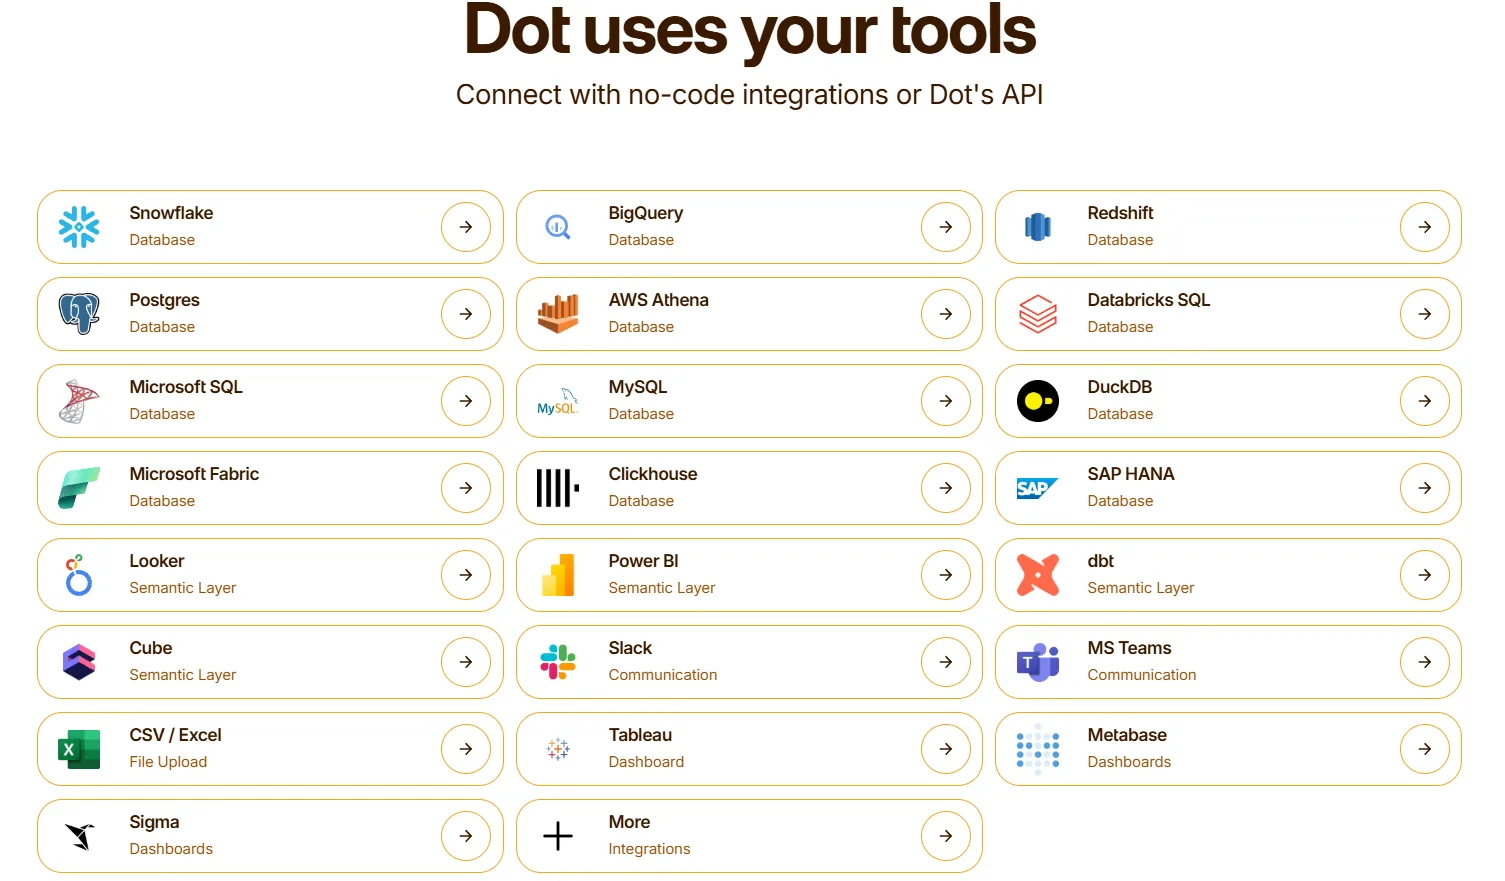
Delivery runs through Slack, Microsoft Teams, email, and the web app, with an API, a CLI, and an MCP server on hand for engineering-led work.
How Dot differs from Sisense
Both tools put AI in front of your data, and both take governance seriously, so the question was never quality.
It's what each one is built to do.
- Sisense is, first and foremost, an embedded analytics platform.
It lets you build governed, AI-powered dashboards into the product you sell, with tools like the Compose SDK and Sisense.JS giving your developers tight control over how those analytics look and behave.
- On the other hand, Dot is a self-service analytics platform that acts as an analyst for your team.
Dot reads the dbt, Looker, and Power BI logic you've already written, so you're adding an analyst over the stack you have, with no second round of modeling.
If you’re looking to reduce the amount of time that your data analysts are spending on adhoc requests and to enable your team to get both quick and comprehensive analysis from your data warehouse, Dot will be worth exploring with a demo.
Dot pricing
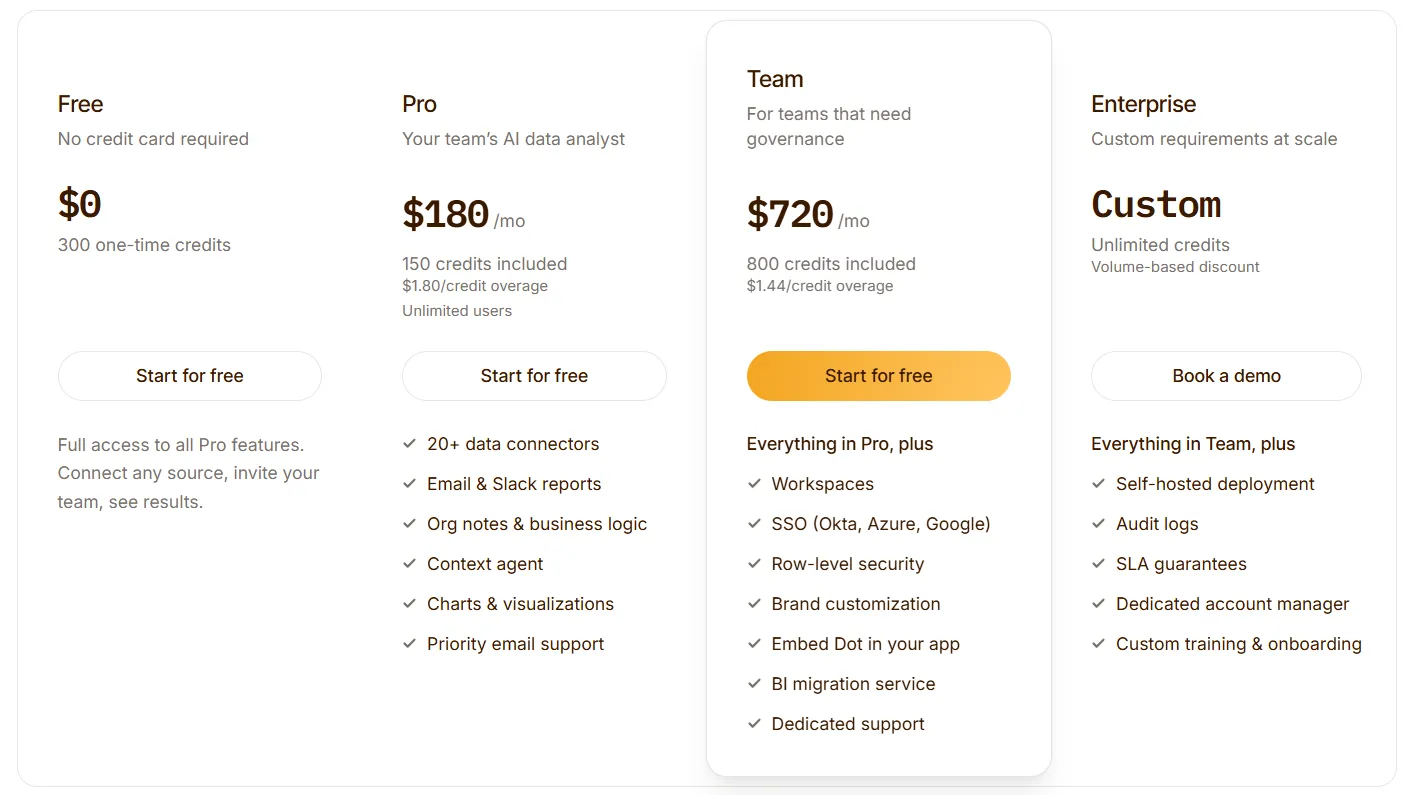
Dot opens free, with 300 one-time credits and the full Pro feature set, which is enough to run genuine analyses before you commit to anything paid.
Three paid tiers sit above that:
- Pro starts at $180/month and includes 150 monthly credits, overage at $1.80 a credit, and as many users as you want.
- Team starts at $720/month for 800 monthly credits, $1.44 per credit over the limit, and adds SSO, row-level security, embedding, BI migration, and dedicated support.
- Enterprise is custom, with unlimited credits, volume discounts, self-hosting, audit logs, an SLA, and a named account manager.
Dot pros and cons
✅ Answers arrive as written narrative with a recommendation, not a chart you're left to interpret.
✅ Anyone can ask in Slack or Teams, so data stops being gated behind the analyst queue.
✅ Tap any figure to see the query and rows behind it, so the numbers stay checkable.
✅ Scheduled reviews land as finished PowerPoints without a person rebuilding them.
✅ It connects to your current warehouse and semantic models, so there's no migration to sit through.
✅ Credit-based billing with unlimited seats, so cost tracks usage and not headcount.
❌ Not for teams whose main need is hand-built dashboards and custom visuals.
❌ You'll need a connected warehouse.
#2: ThoughtSpot
Best for: Companies whose analysts are buried under number requests from business users who'd happily get their own answers.
Similar to: Dot, Supaboard.
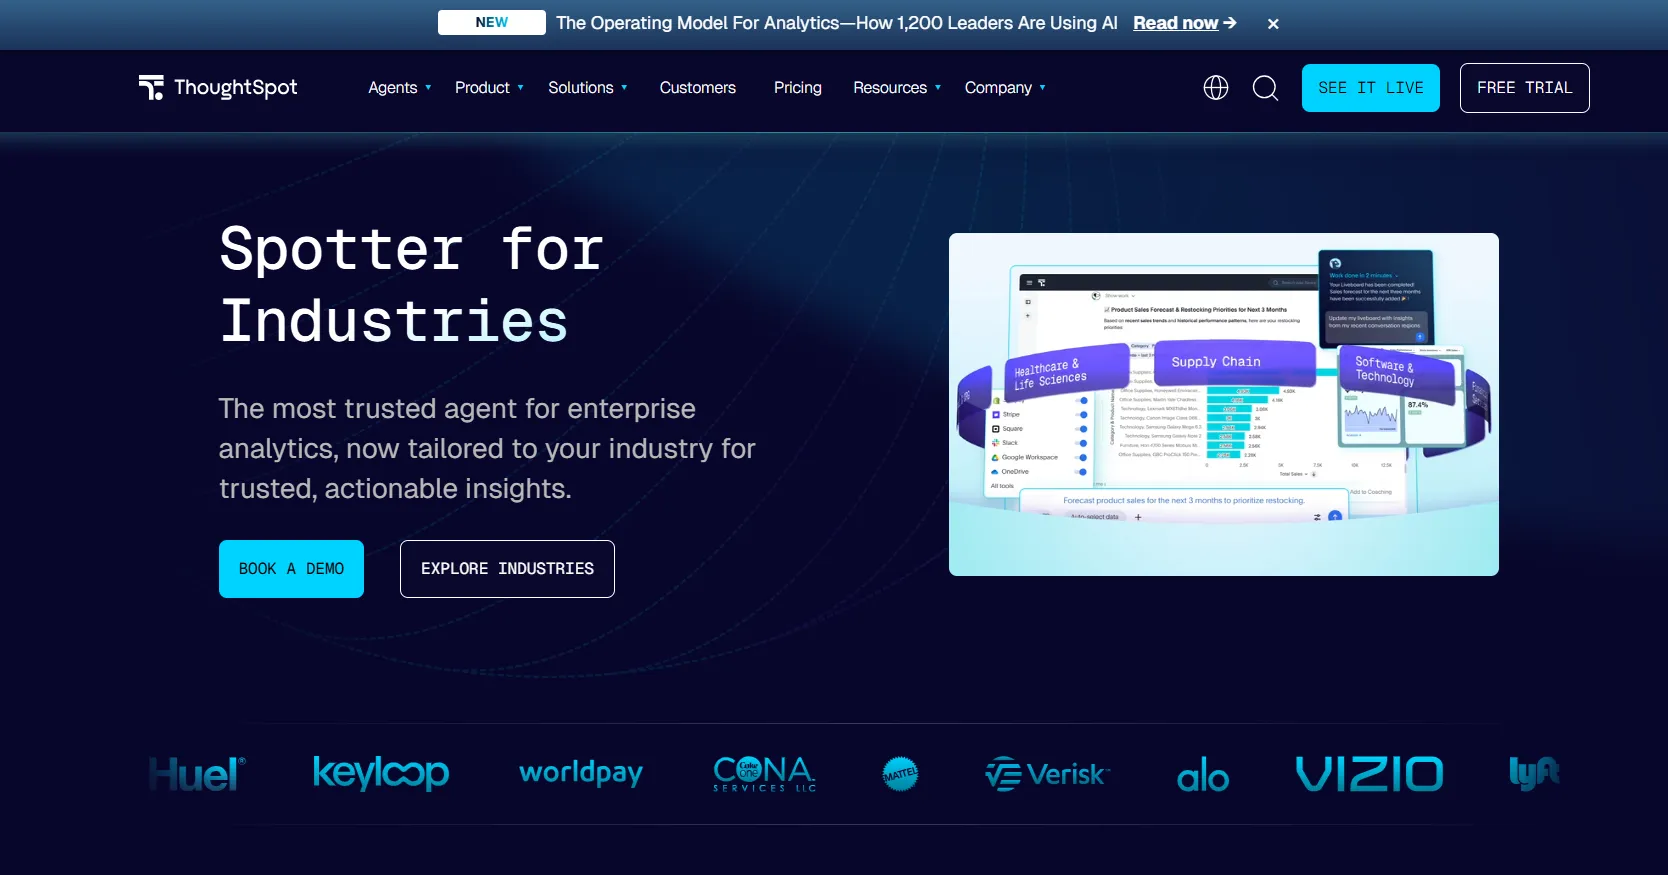
ThoughtSpot is old enough in this market that it lands on most BI shortlists by reflex.
What it sells has shifted, though. Now it's agents, and Spotter 3 takes a question and returns the analysis plus the dashboard it assembled to back it up.
ThoughtSpot's top features
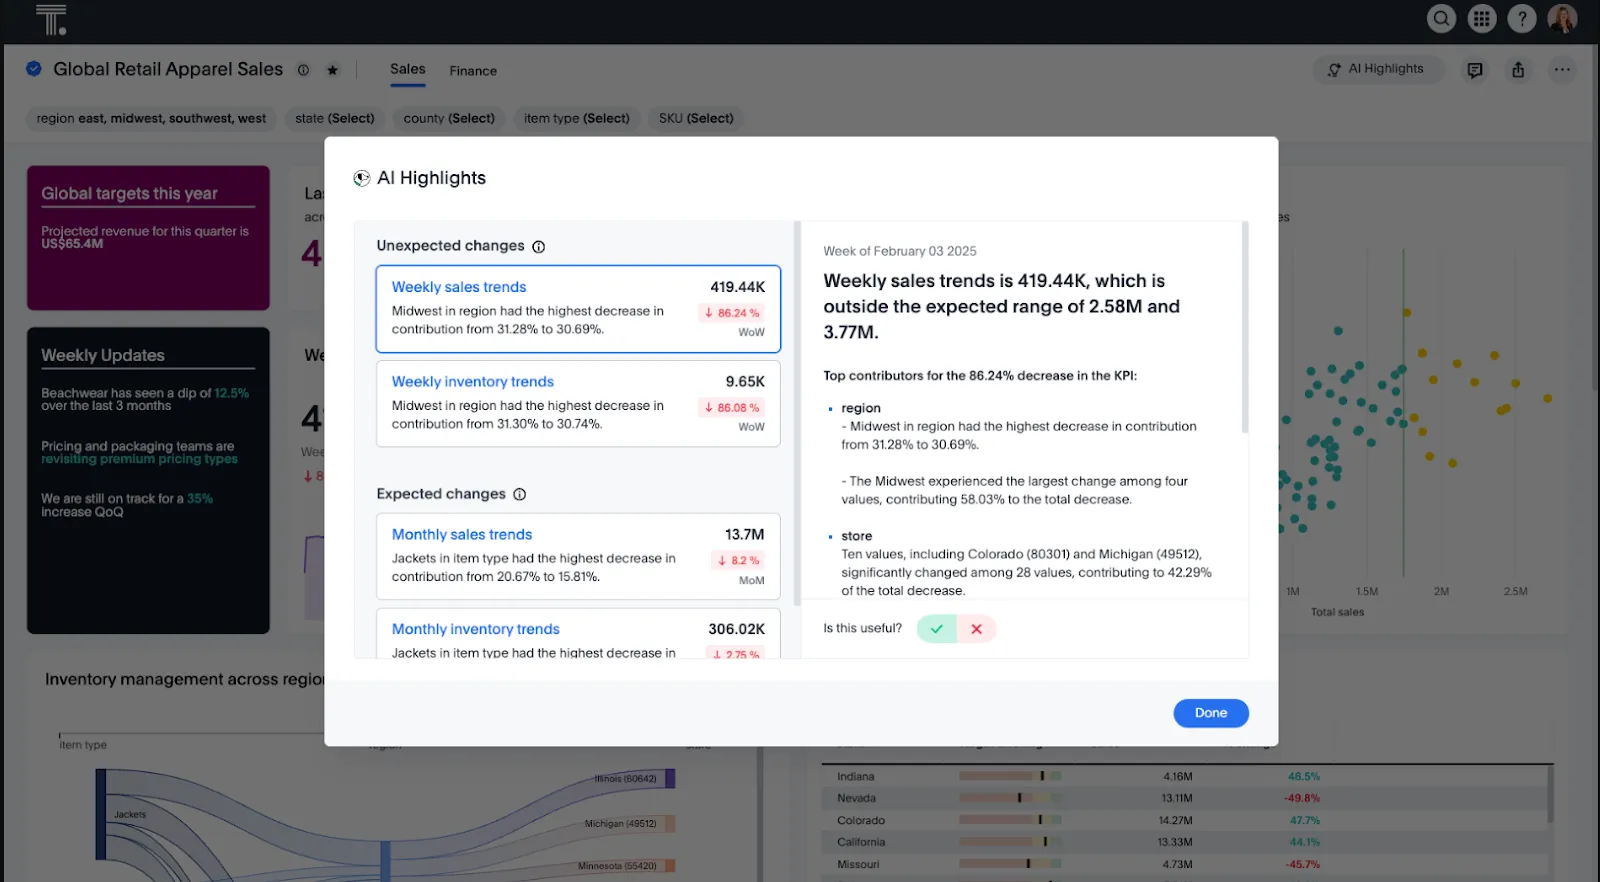
- Spotter agent: Ask it something and it hands back a governed answer, then builds out the Liveboard around that answer, the obvious follow-ups included.
- Liveboards: Dashboards that refresh against live data on their own, current whenever you open them.
- SpotterViz: Give it a dataset, and it returns a styled, laid-out dashboard with the formatting already decided.
- Embedded analytics: Put ThoughtSpot's search and charts inside your own app for your customers.
ThoughtSpot pricing
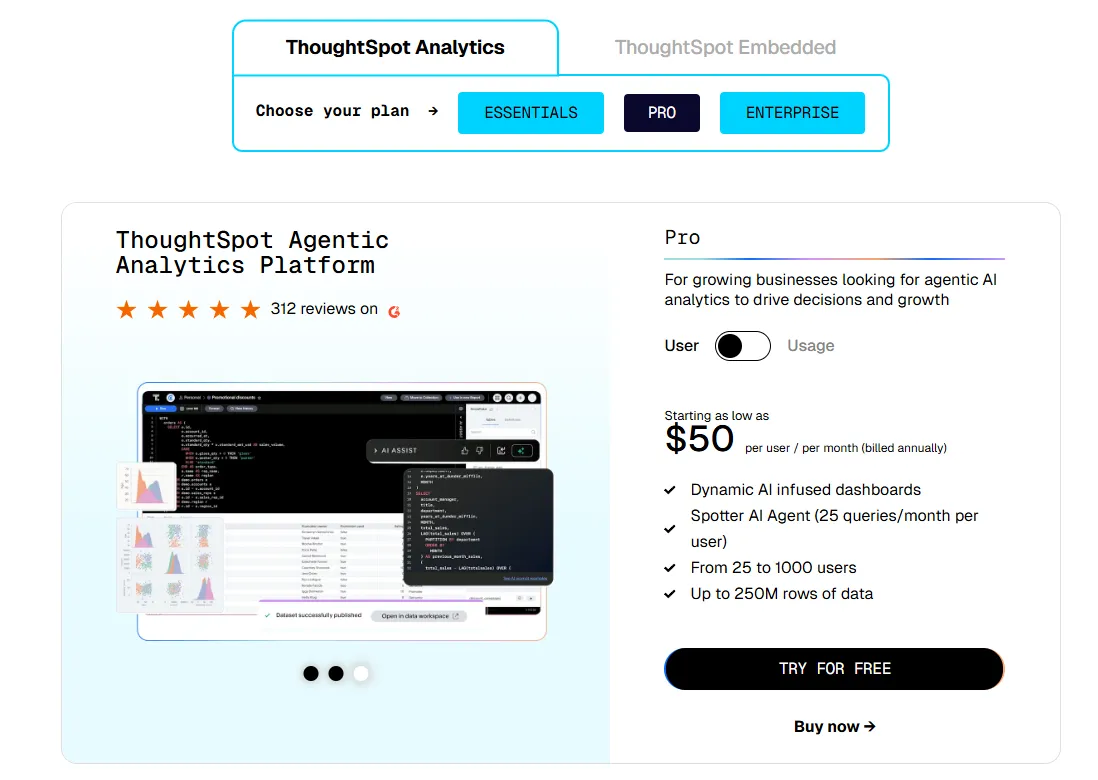
ThoughtSpot offers two separate products: ThoughtSpot Analytics for internal BI and ThoughtSpot Embedded for building analytics into applications - each with flexible pricing depending on scale and usage:
- ThoughtSpot Analytics:
- Essentials: From $25 per user per month (billed annually), for teams of 5-50 users, includes dynamic interactive dashboards and AI-powered insights and supports up to 25M rows of data.
- Pro (per user pricing): From $50 per user per month (billed annually), for 25–1,000 users, includes everything in Essentials, plus AI-infused dashboards and Spotter AI Agent (25 queries per user/month), and supports up to 250M rows of data.
- Pro (usage-based): From $0.10 per query, includes everything in Pro per user, and adds Analyst Studio.
- Enterprise (user or usage-based): Custom pricing, includes everything in Pro, plus unlimited users and data.
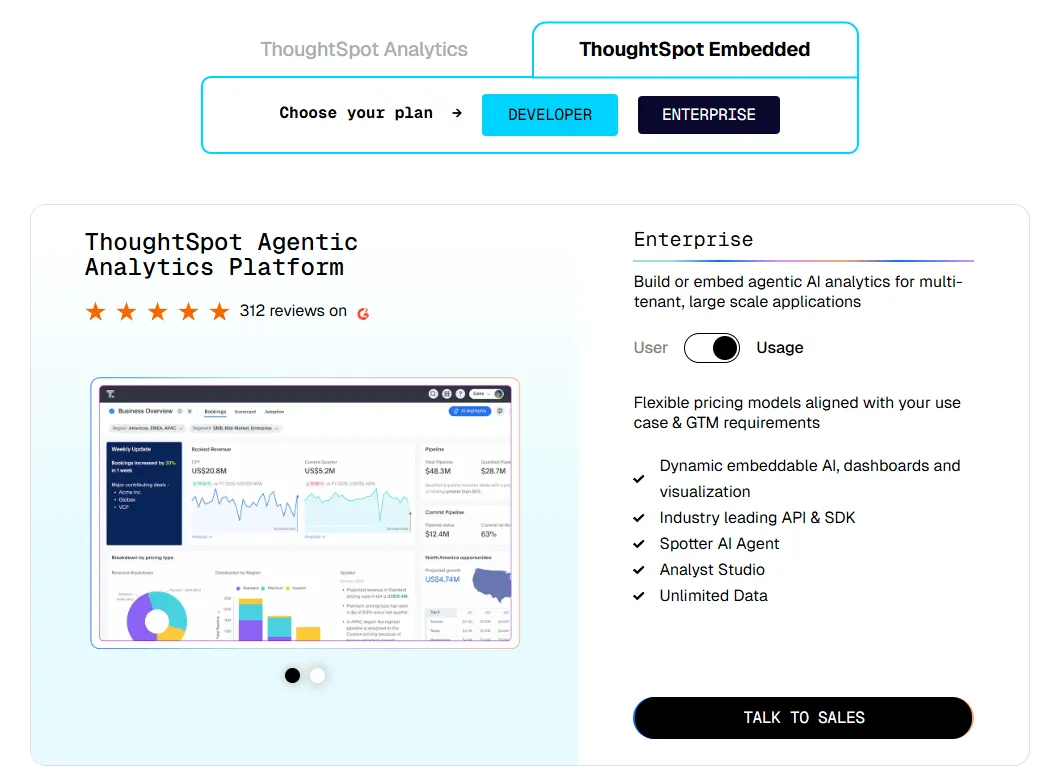
- ThoughtSpot Embedded:
- Developer: Free for 1 year, includes embeddable AI analytics, dashboards, and visualizations, APIs and SDKs, up to 10 users and 25M rows of data.
- Enterprise (user-based): Custom pricing, includes everything in Developer, plus unlimited data.
- Enterprise (usage-based): Custom pricing, everything in Enterprise, plus Spotter AI Agent and Analyst Studio.
ThoughtSpot pros and cons
✅ The search bar gets real use from non-technical staff, which is the entire reason to buy it.
✅ Permissions and governance stay clean as more teams pile on.
❌ Two pricing structures (per user vs. usage-based) can get confusing at scale.
#3: Supaboard
Best for: Small and mid-size teams that want working AI dashboards by the end of the day.
Similar to: ThoughtSpot, Zenlytic.
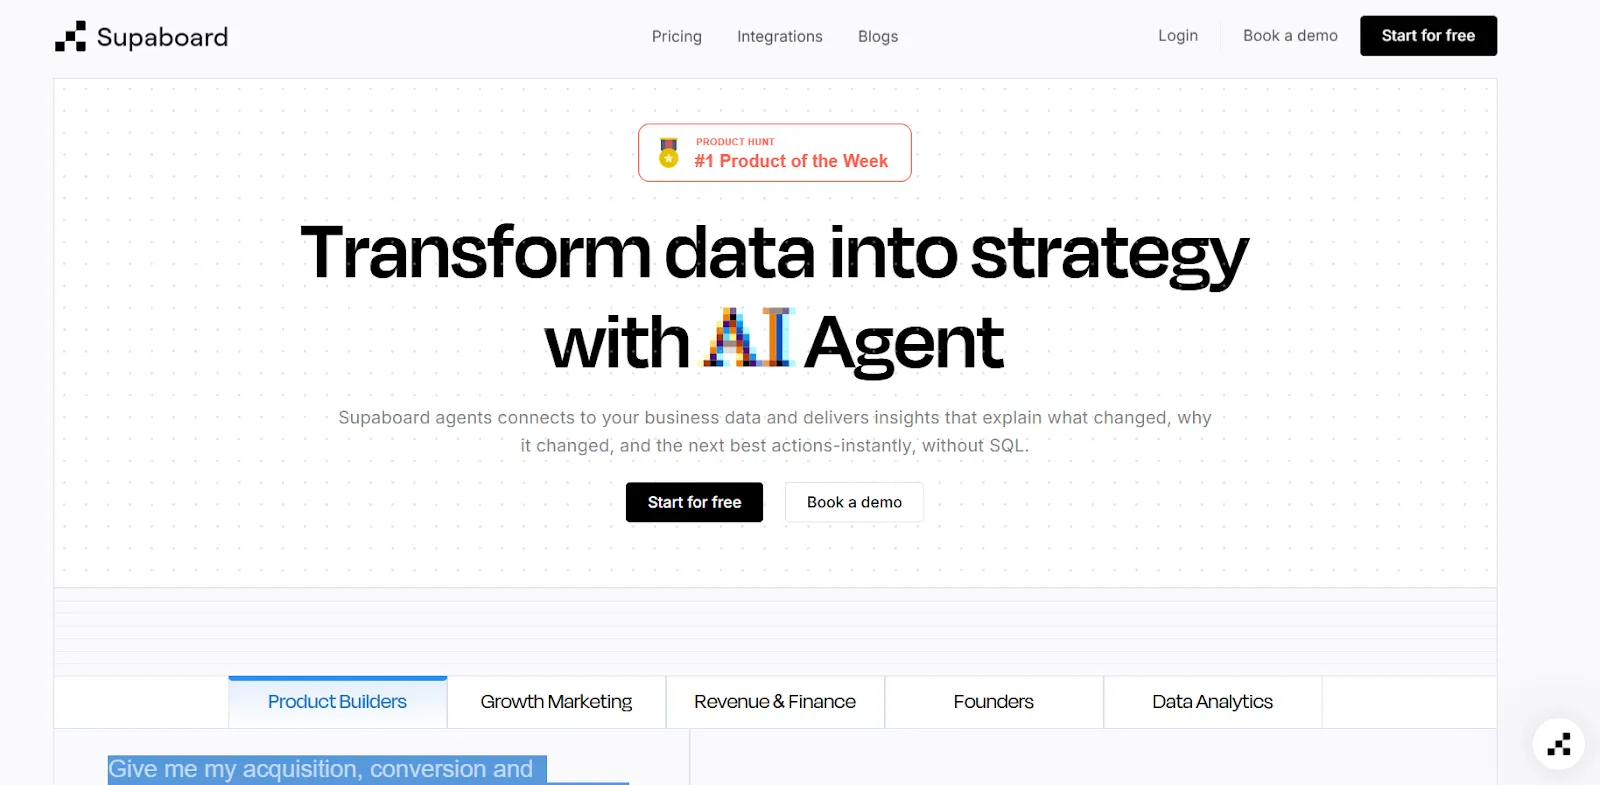
Supaboard is an AI-powered analytics platform that connects to your data sources and automatically generates dashboards, insights, and reports.
The pitch is speed. Connect a source, and an agent named Stella builds the dashboards and answers the questions, with no SQL and no setup phase to get through.
Supaboard's top features
- Trainable AI agents: You can create AI agents trained on your business logic, rules, and definitions.
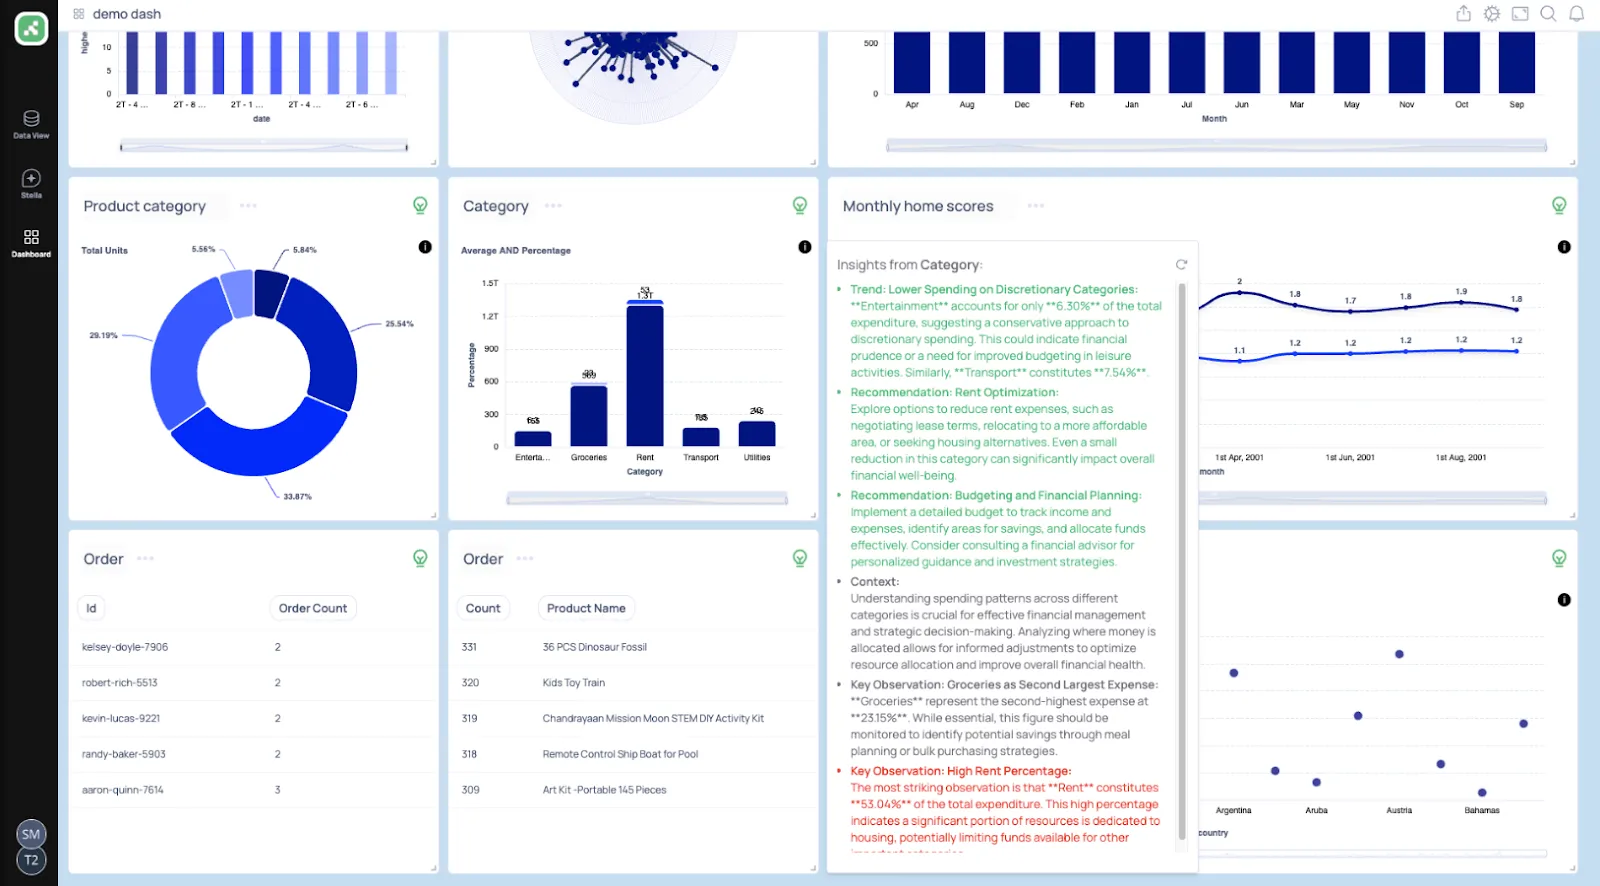
- Natural language data chat: Your team can ask questions in natural language and instantly receive metrics, charts, explanations, and recommended actions.
- AI-generated real-time dashboards: All you have to do is describe what you need, and Supaboard automatically builds interactive dashboards, KPIs, and tables that update live.
Supaboard pricing
Supaboard offers tiered pricing designed to scale from individual users to large enterprises:
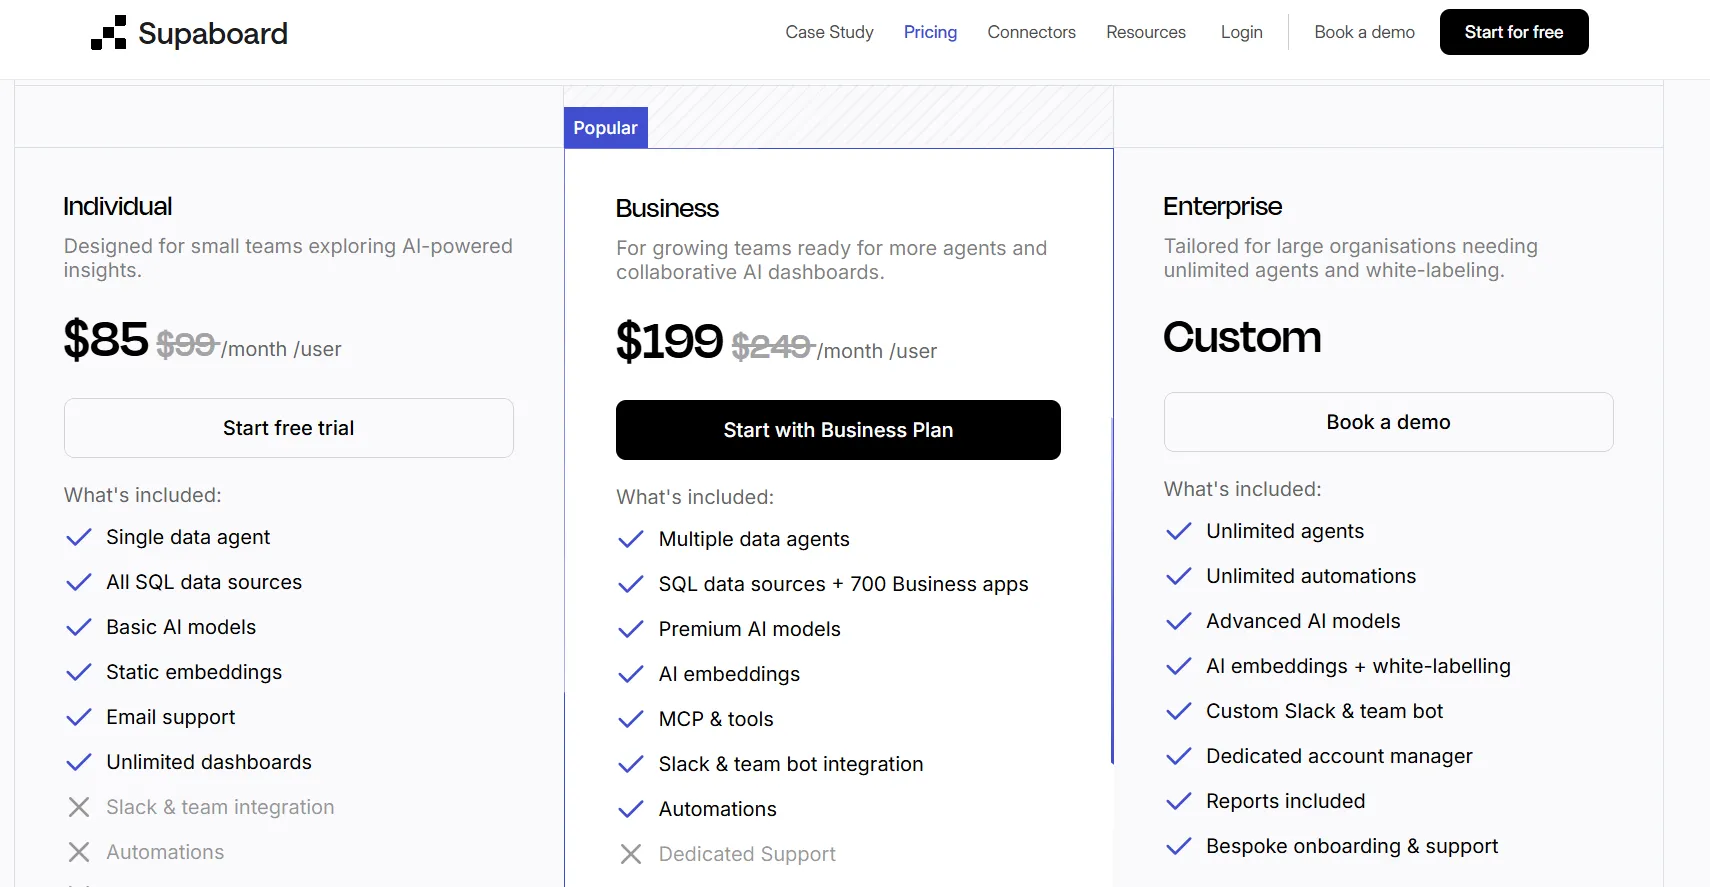
- Individual: $85/month, includes a single user, default AI agent, advanced AI models, static embeddings, unlimited dashboards, and email support.
- Business: $199/month, includes everything in Individual with multiple users, custom agents, AI embeddings, Slack and team bot integration, and dedicated support.
- Enterprise: Custom pricing, includes everything in Business with unlimited users and agents, AI embeddings with white-labeling, custom integrations, a dedicated account manager, and bespoke onboarding.
Supaboard pros and cons
✅ Hooking up data sources is quick, even with big files.
✅ Stella turns questions into analysis fast, which helps people who have never written a query.
❌ Limited dashboard customization options are implied by a G2 review.
#4: Zenlytic
Best for: Data teams that have lost trust in black-box AI and need answers they can stand behind.
Similar to: Dot, ThoughtSpot.
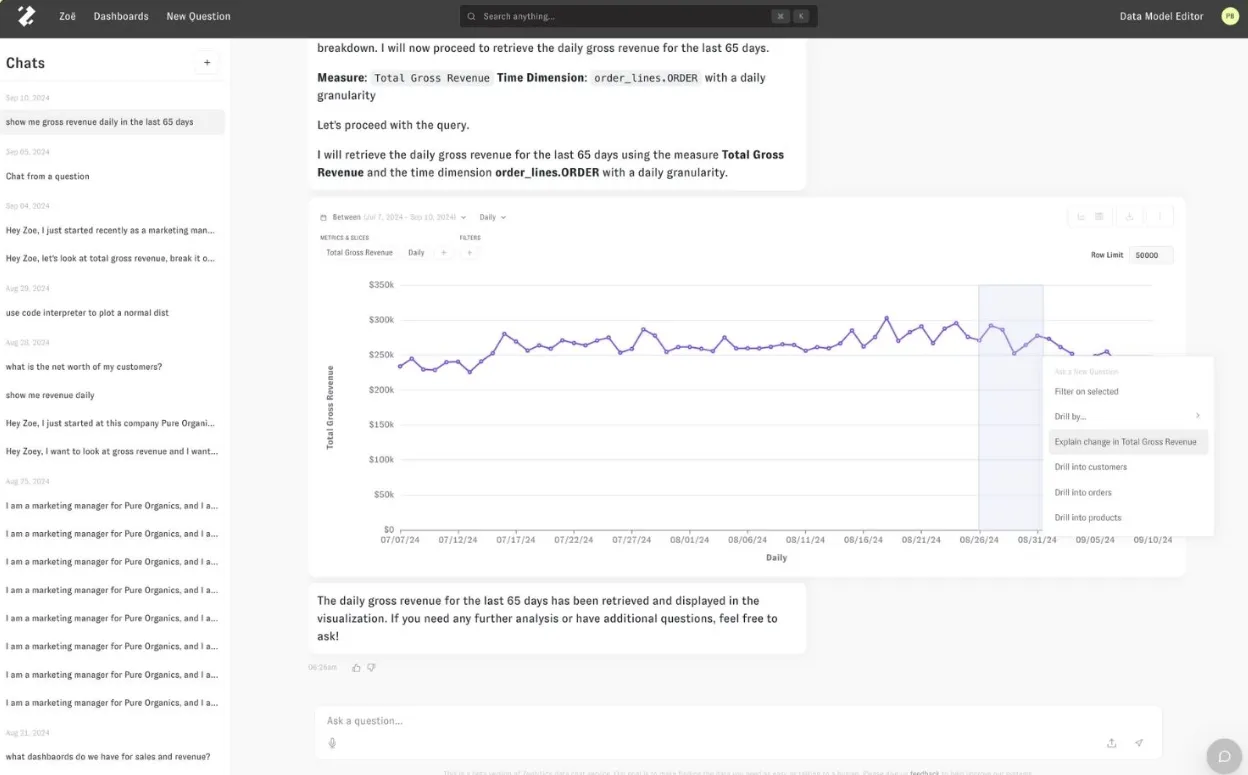
Zenlytic is built around Zoë, an AI analyst with one clear obsession: proving its own answers.
Every figure Zoë gives traces back to the metric and the logic that produced it.
The product has since grown into building slide decks and spreadsheet models that stay connected to live data and update themselves.
Zenlytic's top features
- Zoë with citations: Each answer ships with the metrics and logic behind it, and locked definitions (Zenlytic calls them Memories) keep the same question returning the same number.
- Self-updating artifacts: Decks and financial models wired to the warehouse, so the file doesn't fall out of date.
- Clarity Engine: An LLM-native semantic layer that lets teams define metrics and business logic once and reuse them across all queries, keeping answers consistent.
Zenlytic pricing
Zenlytic keeps prices off the website, so a look at the platform and a quote both run through a demo booking.
Zenlytic pros and cons
✅ Traceability is the main event here, not a box it ticks.
✅ Setup stays light, as Zoë learns the data and stands up the semantic layer itself.
❌ No public pricing to compare against.
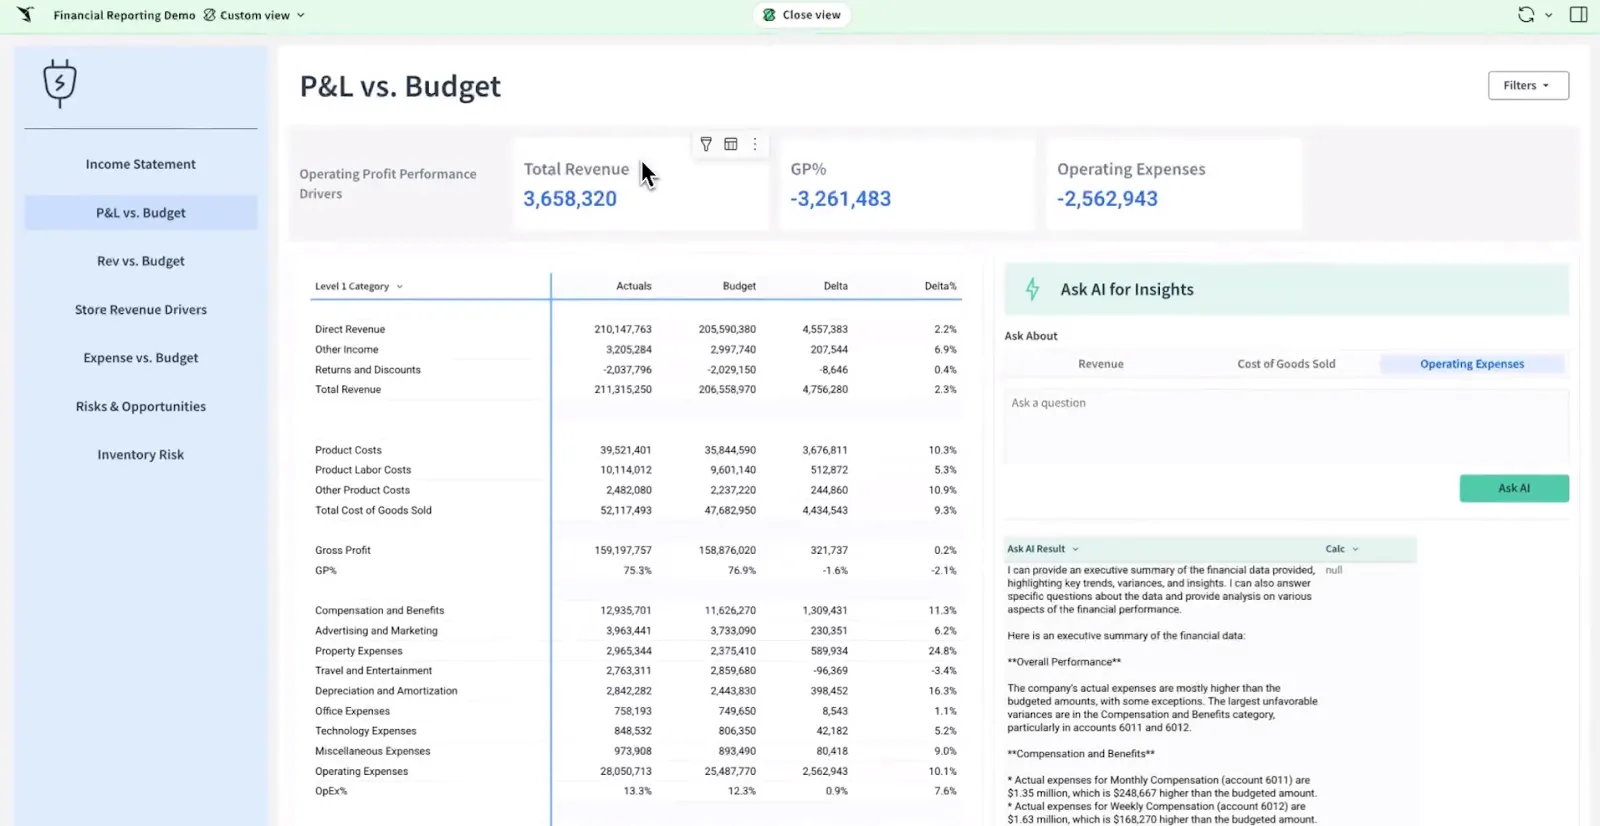
#5: Sigma
Best for: Finance and ops folks who'd sooner work in a grid than a chart builder, but need real warehouse data behind it.
Similar to: Omni, Metabase.
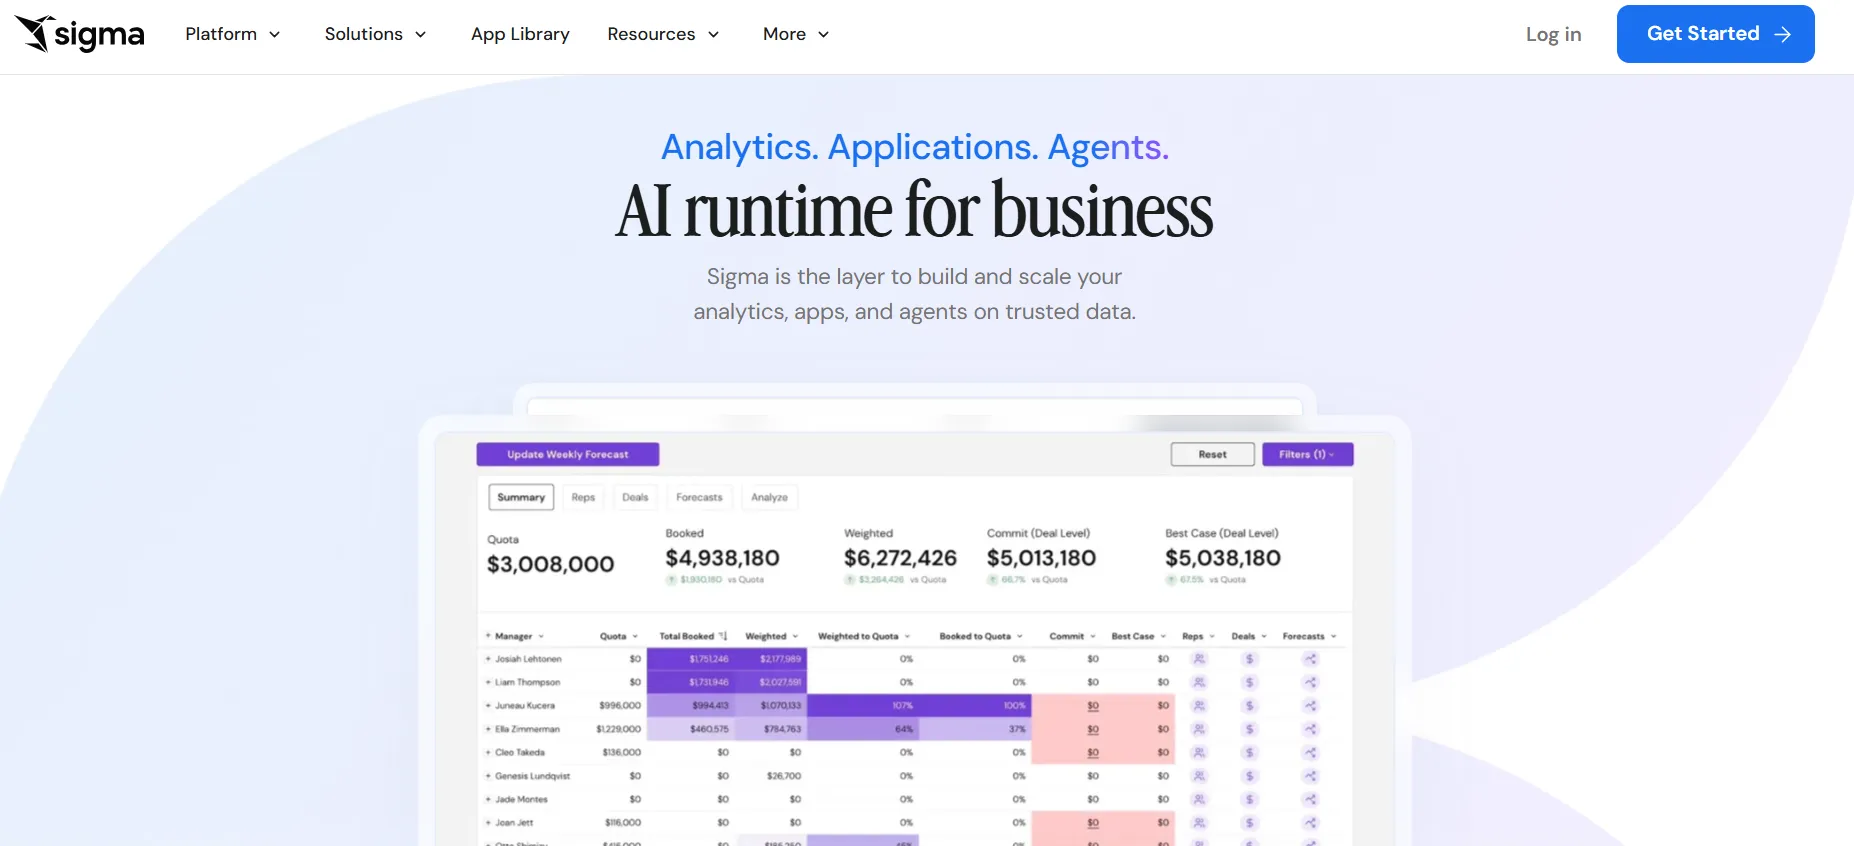
Sigma is a spreadsheet-style analytics platform that runs live formulas and pivots directly against your cloud warehouse.
The bet is that finance teams will never truly leave the spreadsheet, so Sigma brought the spreadsheet to the data.
Sigma's top features
- Spreadsheet interface on live data: You can work with billions of rows directly in your warehouse using formulas, tables, and logic that feel like Excel.
- AI-powered apps and dashboards: Your team can use natural language and AI to build dashboards, reports, and operational AI apps tied to live data.
- Collaborative workbooks: It’s possible to build dashboards in shared workbooks where teams comment, version, and iterate together.
Sigma pricing
Sigma doesn't publish a price list, so getting one means talking to their sales team for a quote shaped to your use.
Sigma pros and cons
✅ Reading the warehouse live keeps numbers current and governed, with no copy spun off to the side.
✅ Because it feels like a spreadsheet, finance and ops teach themselves.
#6: Omni
Best for: Data teams after a governed metrics layer that doesn't drag a full modeling language along with it.
Similar to: Sigma, Looker.
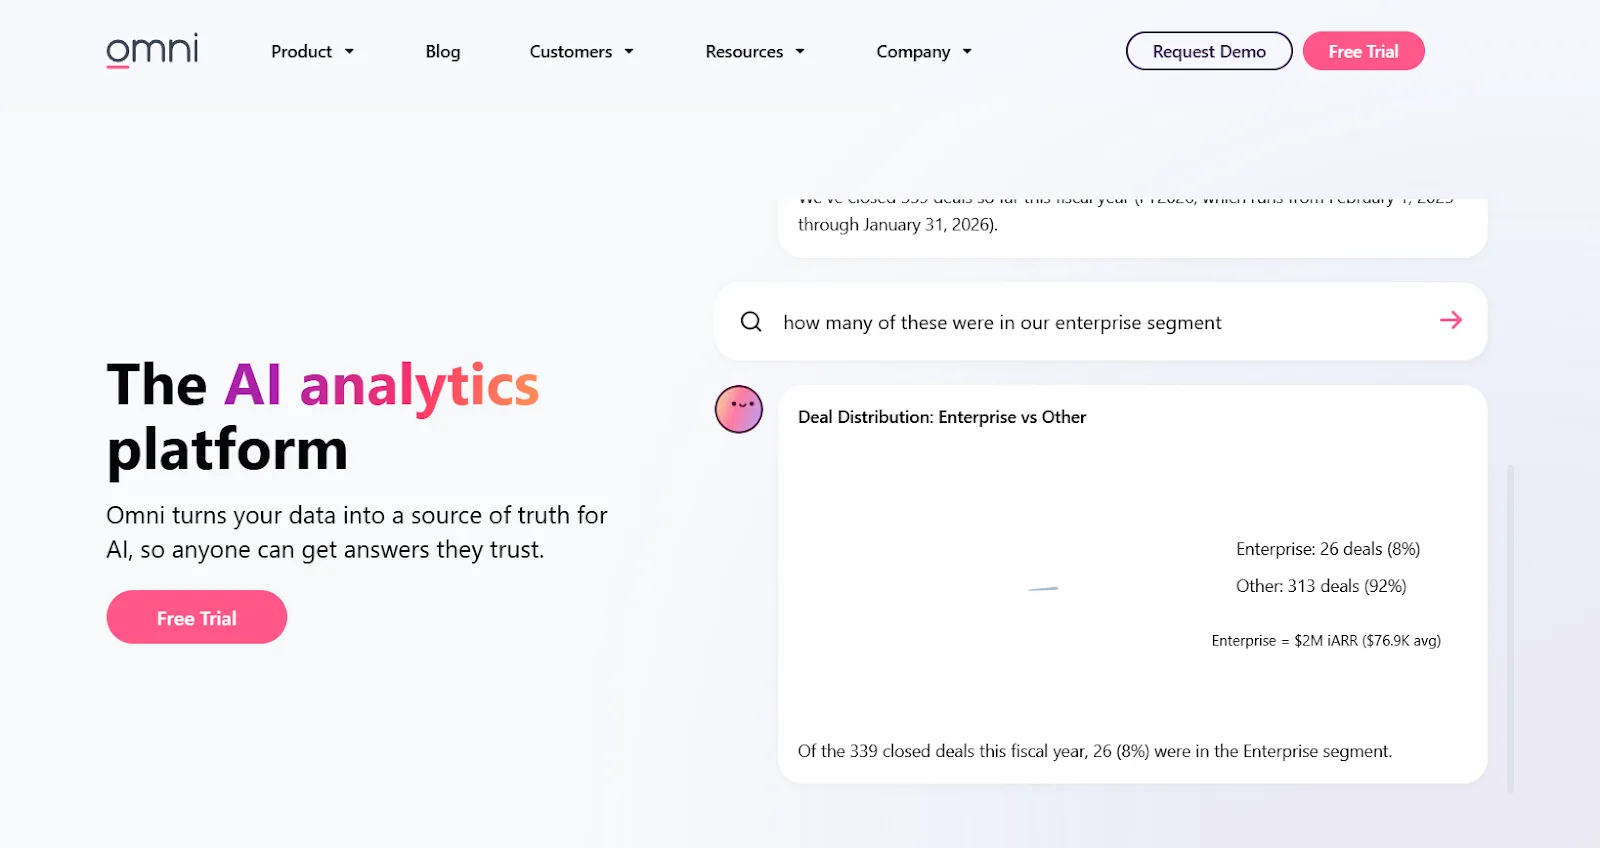
Omni is a BI platform that pairs a governed metrics layer with quick, spreadsheet-style exploration on top of your warehouse.
As it queries the warehouse directly, exploring doesn't mean waiting in a modeling queue.
Omni's top features
- Set it once, use it everywhere: Define a calculation in the shared model and it stays governed in every report that touches it.
- AI in the flow of work: Summaries of charts and draft queries appear in the workbook while you're in it, not off in a side panel.
- Spreadsheet-grade exploration: Dig through live warehouse data in a familiar grid while the governed metrics hold.
Omni pricing
Omni keeps its subscription pricing private, with a free trial you can request to try it first.
Omni pros and cons
✅ It's fast to explore in, and the drag-and-drop takes minutes to learn.
✅ It commits to dbt and live warehouse queries, which fits how modern teams already work.
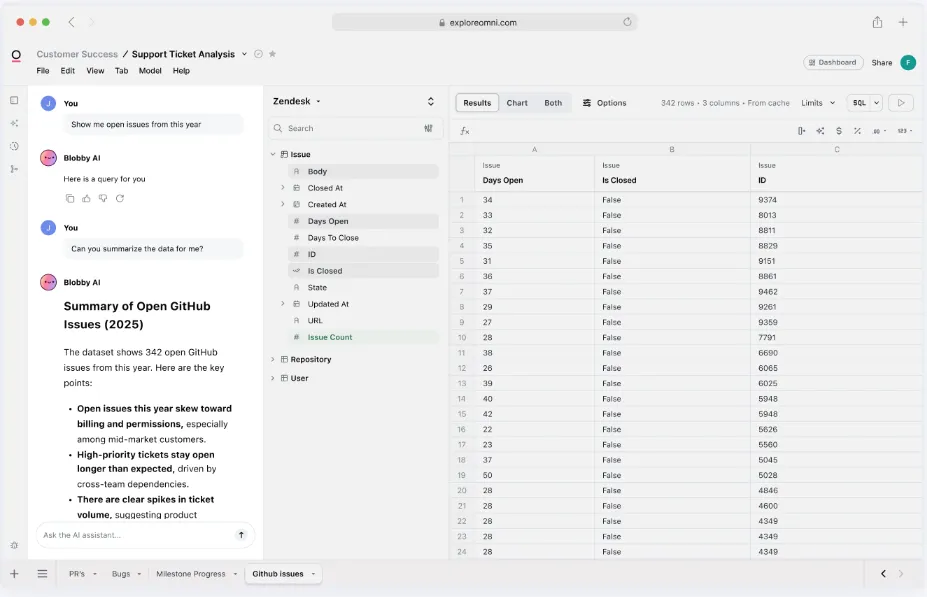
#7: Metabase
Best for: Startups and small data teams getting dashboards live this week, with a free path if they self-host.
Similar to: Sigma, Looker.
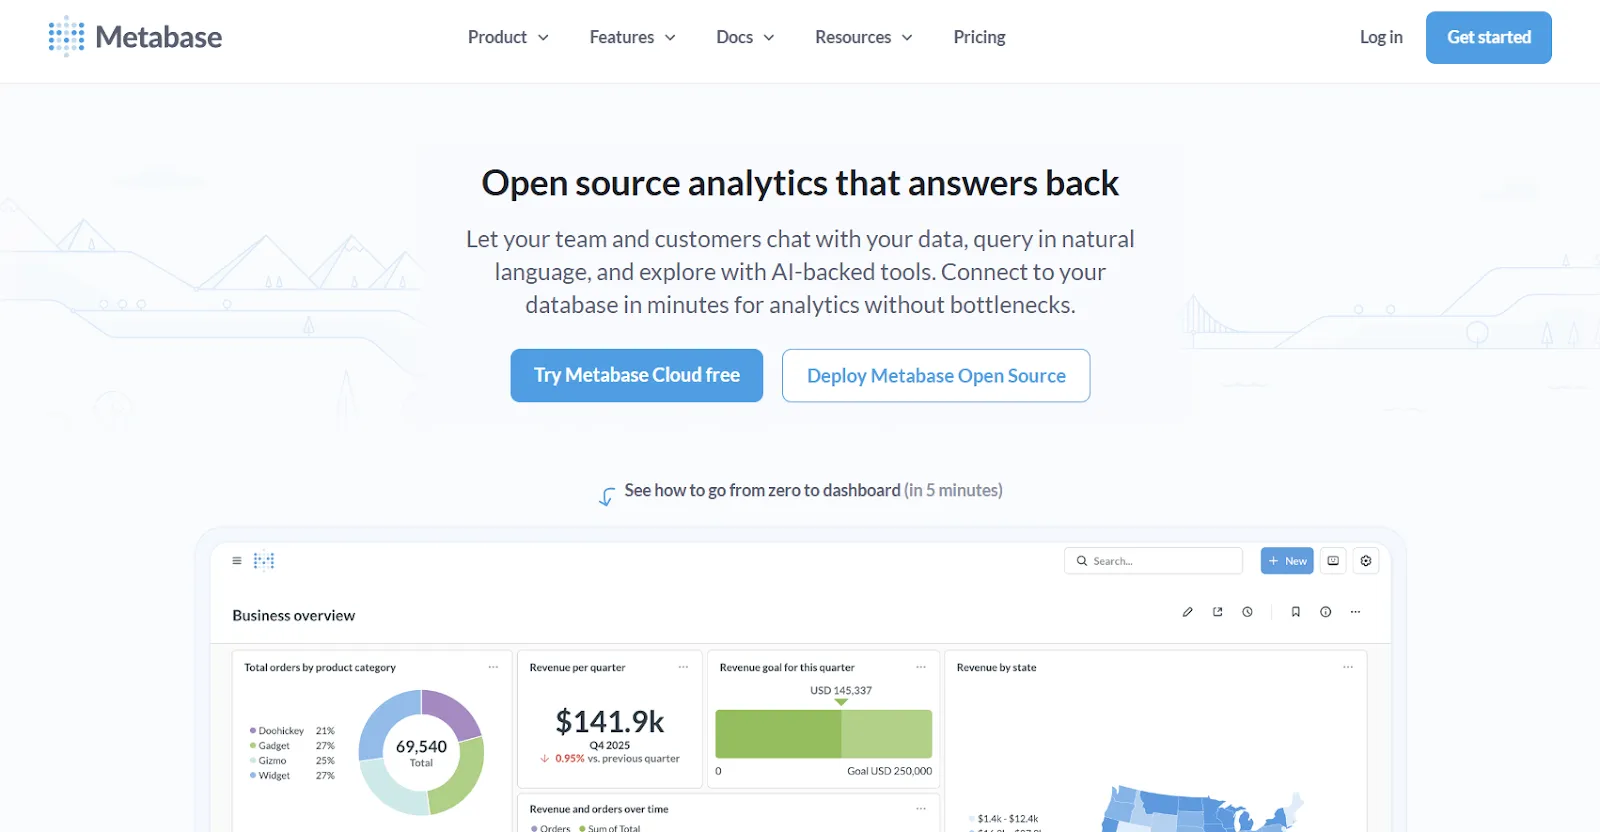
Metabase is an open-source BI tool that builds dashboards and answers typed questions, with a self-hosted edition that's free to run.
It's the tool a lot of companies reach for before they've even decided they need one, since it’s quick to deploy and cheap to maintain.
Metabase's top features
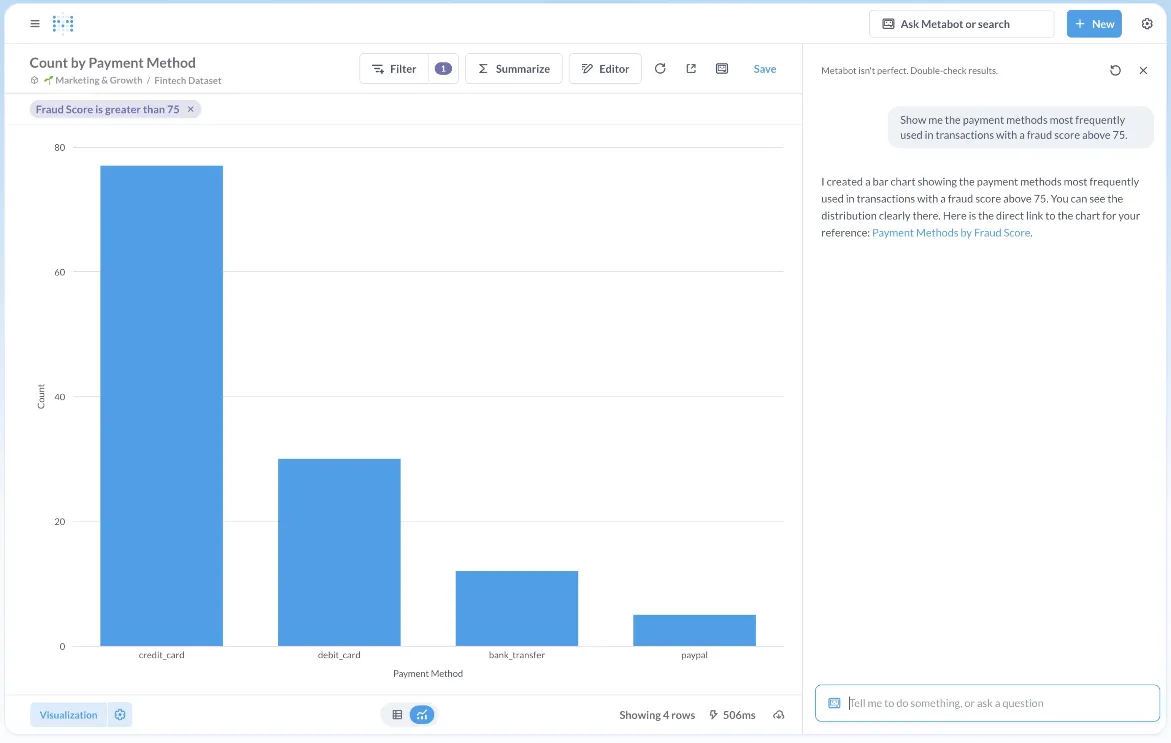
- Click-built, SQL-ready: Work through joins and filters by clicking, and drop into raw SQL the moment a question gets past what the builder handles.
- Metabot and drill-downs: Ask in writing to get a query back, and click into any chart to break it down further.
- Embedding options: Place charts and dashboards into internal tools or customer-facing apps.
Metabase pricing
Metabase offers two pricing options depending on how you use the product: internal business intelligence or customer-facing embedded analytics.
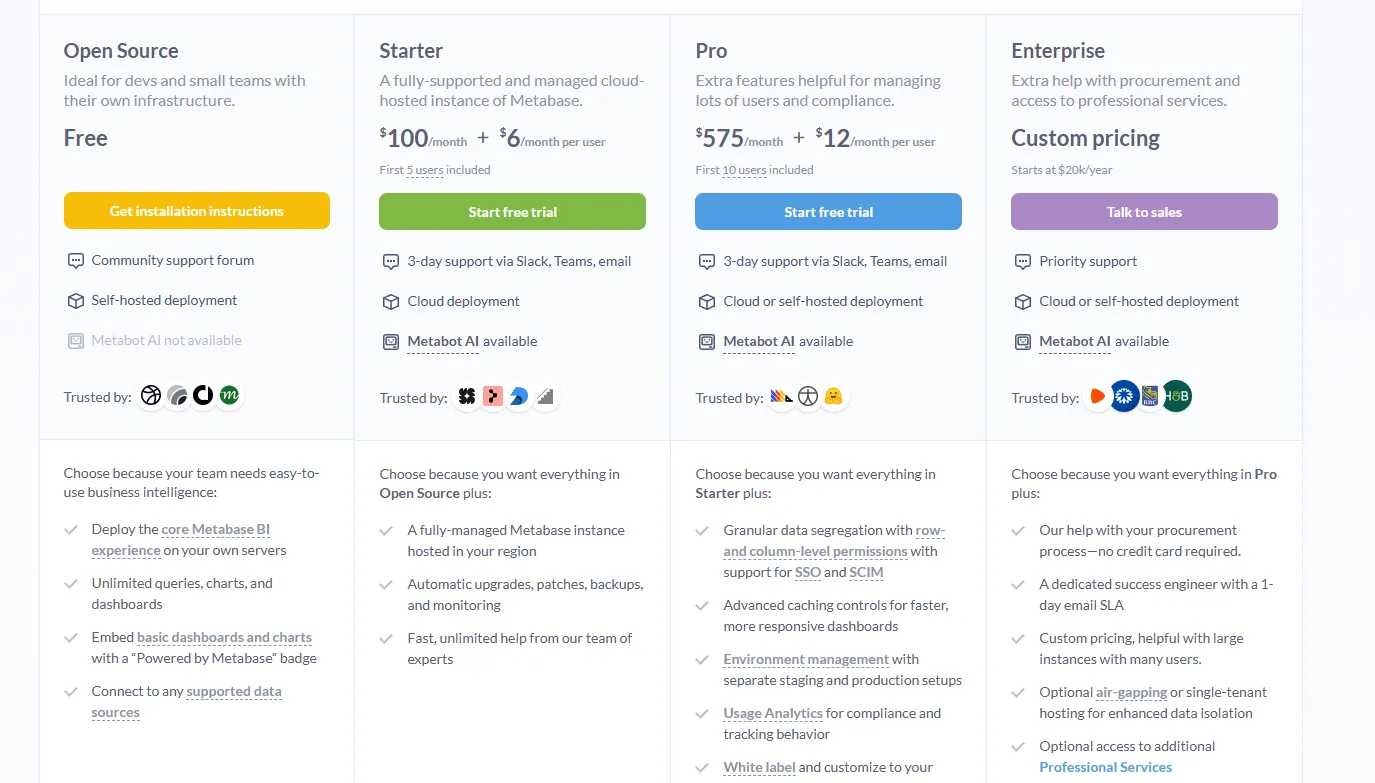
- Business Intelligence:
- Open Source (Self-hosted): Free, self-hosted deployment, includes unlimited queries, charts, and dashboards, connects to all supported data sources, basic embedding with “Powered by Metabase” branding, community support only.
- Starter (Cloud-hosted): $100/month + $6/user/month, first 5 users included, includes everything in Open Source, plus option to include Metabot AI (charged extra), automatic upgrades, backups, and monitoring, support via Slack, Teams, and email (3-day SLA).
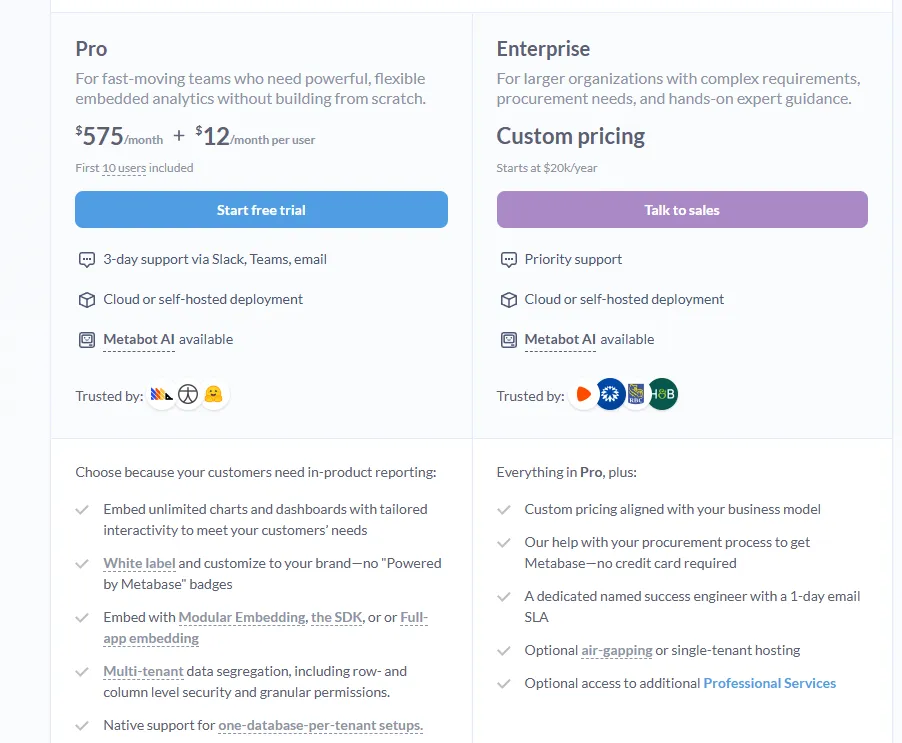
- Pro: $575/month + $12/user/month, first 10 users included, cloud or self-hosted deployment, includes everything in Starter, plus row- and column-level permissions, SSO and SCIM support, advanced caching and performance controls, staging + production environments, usage analytics and audit visibility, white-labeling, and embedded analytics capabilities.
- Enterprise: Custom pricing (starts at $20k/year), includes everything in Pro, plus priority support, dedicated success engineer (1-day email SLA), optional single-tenant or air-gapped deployment, and optional professional services.
- Embedded Analytics pricing:
- Pro: $575/month + $12/user/month, first 10 users included, includes unlimited embedded dashboards and charts, full white-labeling, modular embedding, SDK, or full-app embedding, multi-tenant security (row- and column-level), one-database-per-tenant support, staging + production environments, usage analytics, internal BI for your team, and option to include Metabot AI (charged extra).
- Enterprise: Custom pricing (starts at $20k/year), includes everything in Pro, plus a dedicated success engineer, priority support, optional single-tenant or air-gapped hosting, and optional professional services.
Metabase pros and cons
✅ The self-hosted open-source build is free past your own server bill.
✅ Getting it running on a common database takes an afternoon, not a sprint.
❌ A user on G2 believes that Metabase could benefit from having an AI assistant that understands the databases and assists in building queries
#8: Looker
Best for: Organizations standardizing on governed, warehouse-native BI with a single agreed definition of every metric.
Similar to: Power BI, Qlik Sense.
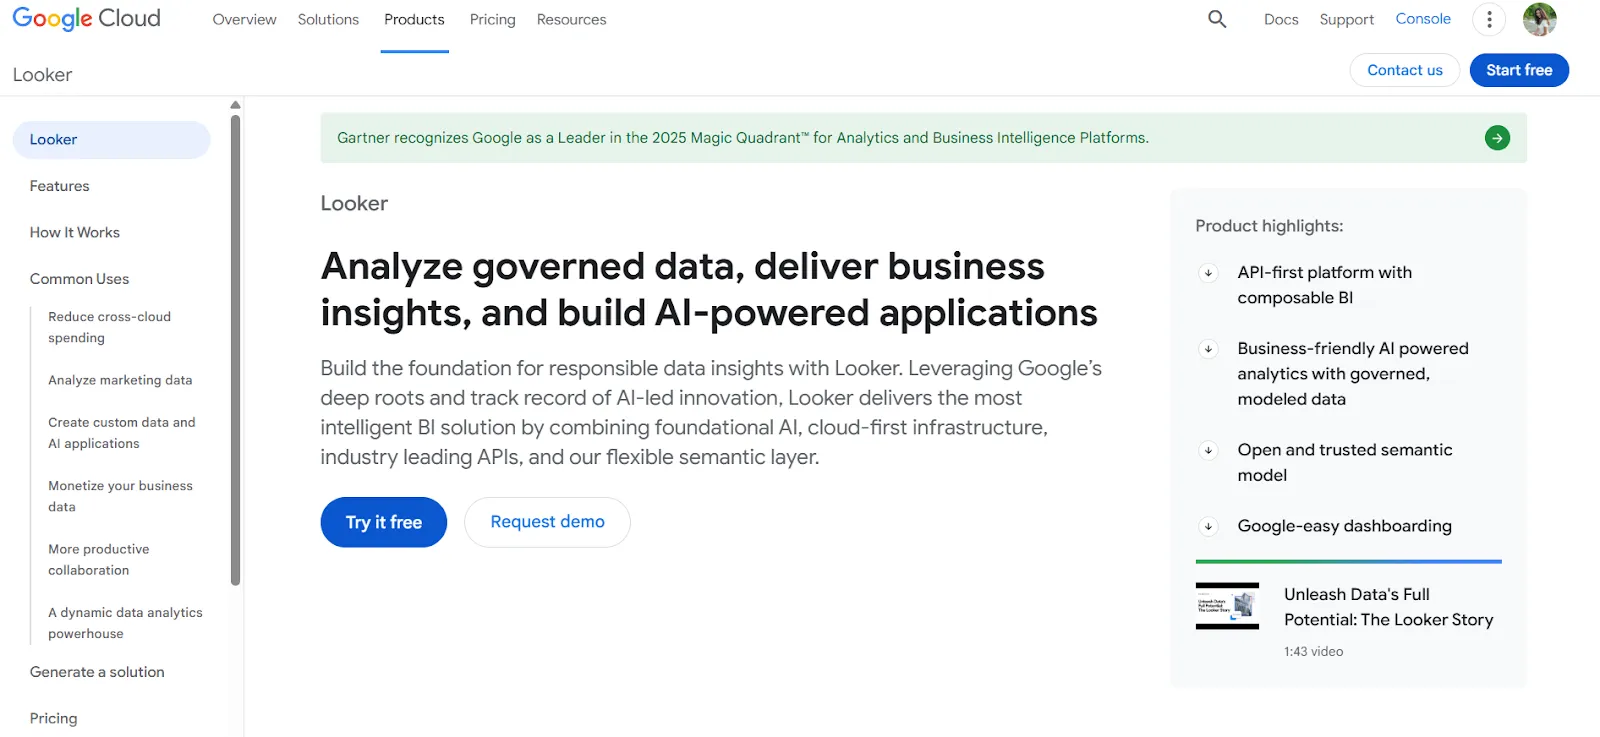
Looker is a warehouse-native BI platform that defines every metric once in a central LookML model, so numbers stay consistent everywhere they appear.
Part of Google Cloud since 2020, it builds on that modeling layer, not a pile of one-off dashboards.
Gemini has added conversational querying lately, which opens the data to people outside the analyst seat.
Looker's top features
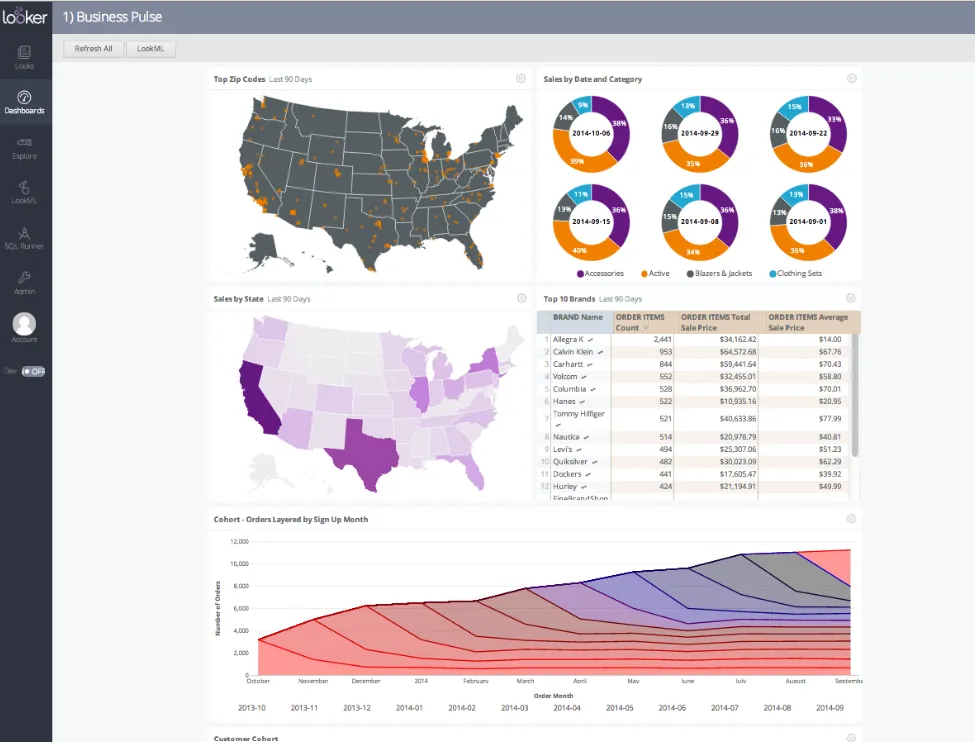
- The LookML model: Define metrics and rules a single time and every dashboard and report draws from that same logic.
- Conversational querying with Gemini: Ask in writing and get an answer without building a dashboard to get there.
- Embedding: Place reports and dashboards into internal tools or products you ship to customers.
Looker pricing
Looker uses a custom, contract-based pricing model made up of two parts: platform pricing (the cost of running a Looker instance) and user licensing (the cost per user type).
Pricing is annual for all plans.
- Platform editions:
- Standard: Designed for small teams or organizations with fewer than 50 users, includes 1 production instance, 10 standard users + 2 developer users, up to 1,000 query-based API calls/month, and up to 1,000 admin API calls/month.
- Enterprise: Built for larger internal BI and analytics use cases, includes everything in Standard, plus enhanced security features, up to 100,000 query-based API calls/month, and up to 10,000 admin API calls/month.
- Embed: Designed for embedding analytics into external products or applications, includes everything in Standard, plus up to 500,000 query-based API calls/month and up to 100,000 admin API calls/month.
- User licensing:
- Developer users: Full access to Looker, including LookML development, administration, APIs, and advanced tooling.
- Standard users: Can explore data, build dashboards and reports, run SQL, and schedule content.
- Viewer users: Read-only access to dashboards and reports, with filtering and drill-down.
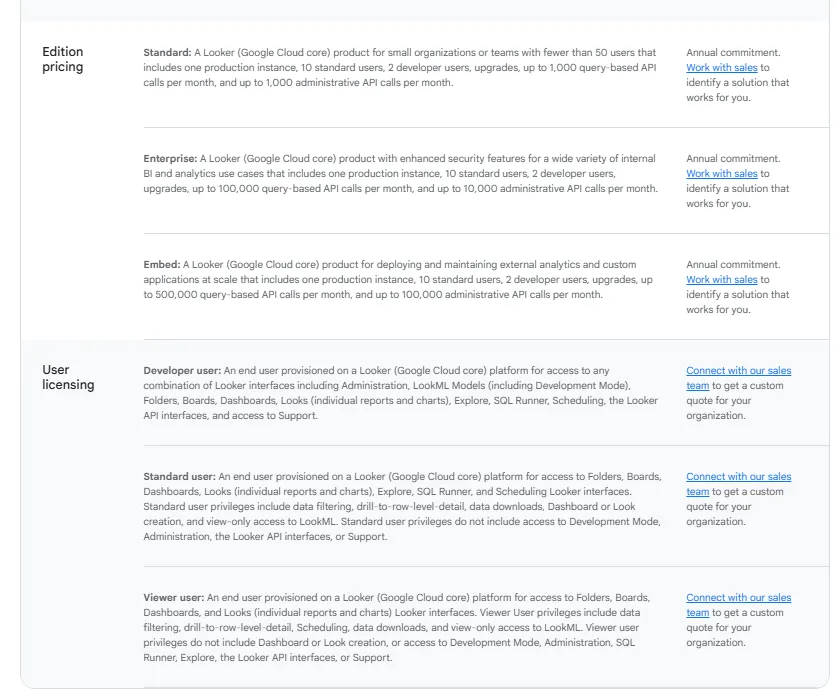
Pricing is custom on all plans and varies based on scale, permissions, and usage.
Looker pros and cons
✅ LookML pins one definition of a metric across every report.
✅ Embedding into internal tools or customer products is well covered.
❌ There's a bit of a learning curve at first, which can require a bit more education upfront to maximize all of its capabilities, according to a G2 review.
#9: Microsoft Power BI
Best for: Microsoft 365 shops looking to add reporting and self-service analytics without bringing in an outside tool.
Similar to: Looker, Qlik Sense.
Microsoft Power BI is a reporting and self-service analytics platform that turns modeled data into dashboards and published reports across an organization.
Power BI's top features
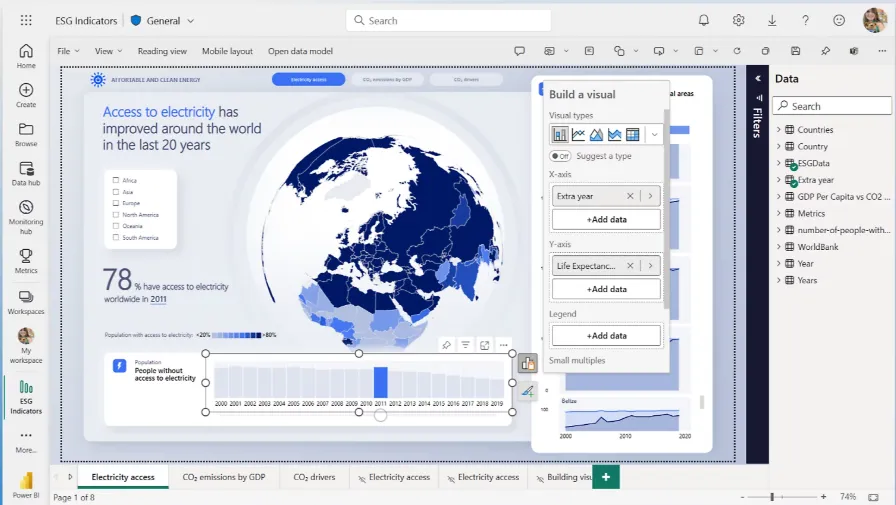
- Reports you can publish: Build up visuals and drill-throughs, then send the finished report to the whole company.
- Governance at scale: Row-level security and Microsoft Entra ID controls, with sensitivity labels over the top.
- Built into Microsoft: Direct ties into Excel and Teams that competitors have to put in work to rival.
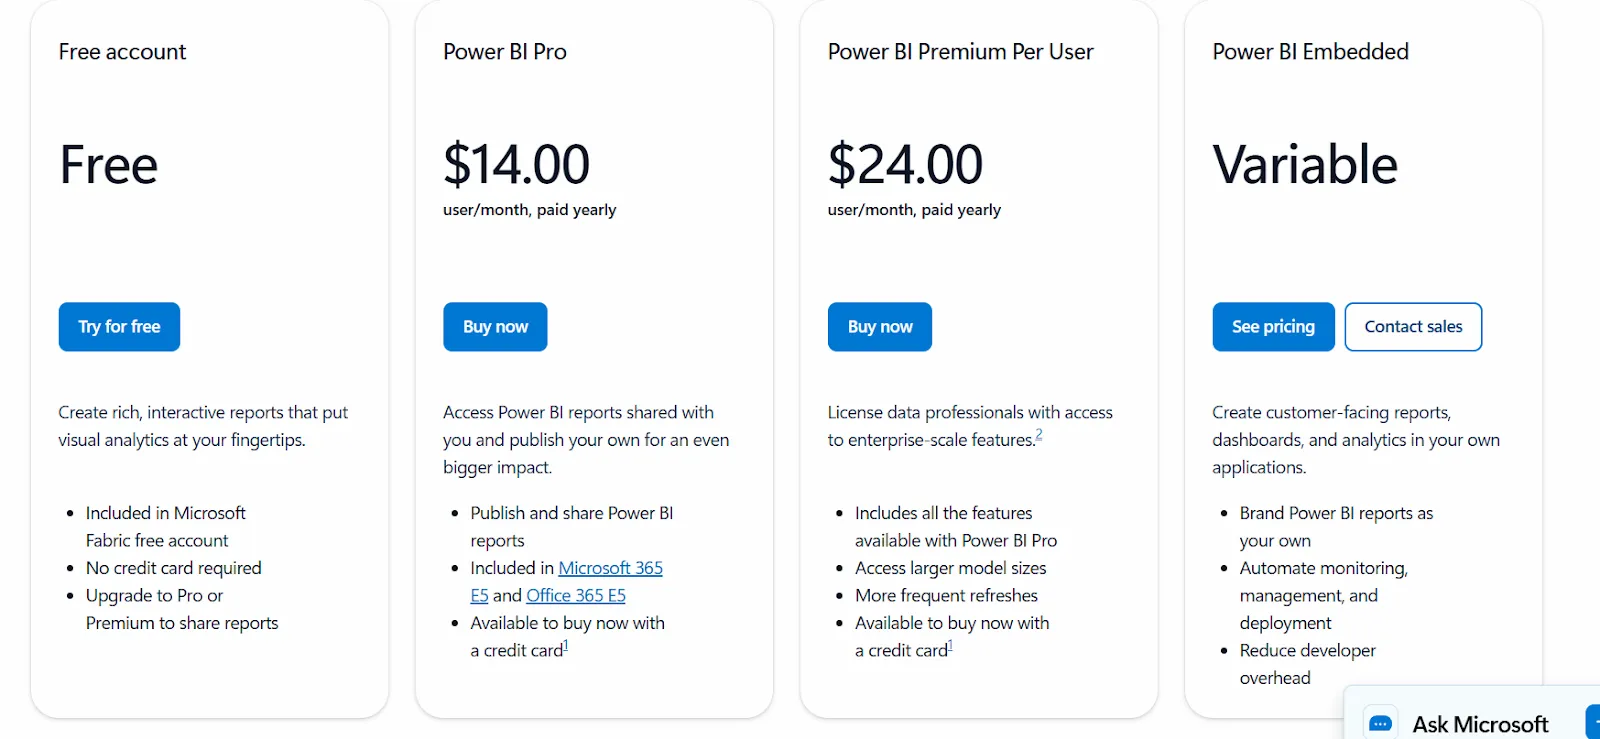
Power BI pricing
Power BI uses a per-user and capacity-based pricing model, with different tiers depending on how reports are created, shared, and scaled across the organization.
There’s a Free plan, best for individual users exploring data on their own, that includes building reports and dashboards for personal use, but no sharing or collaboration features.
The paid options include the following:
- Power BI Pro: $14/user/month, includes report publishing, sharing dashboards, collaboration in workspaces, and embedding in Microsoft Teams and SharePoint.
- Power BI Premium Per User: $24/user/month, includes everything in Pro, plus larger model sizes, more frequent refreshes, paginated reports, and advanced AI features.
- Power BI Embedded: Custom pricing, which lets you create customer-facing reports, dashboards, and analytics in your own applications.
Power BI pros and cons
✅ Reports go out to everyone in the company.
✅ In a Microsoft shop, the Excel and Teams links are tough to top.
❌ Advanced capabilities are locked behind Premium tiers.
#10: Qlik Sense
Best for: Governed or on-prem setups that need to explore data sideways, not only down a fixed drill path.
Similar to: Power BI, Looker.
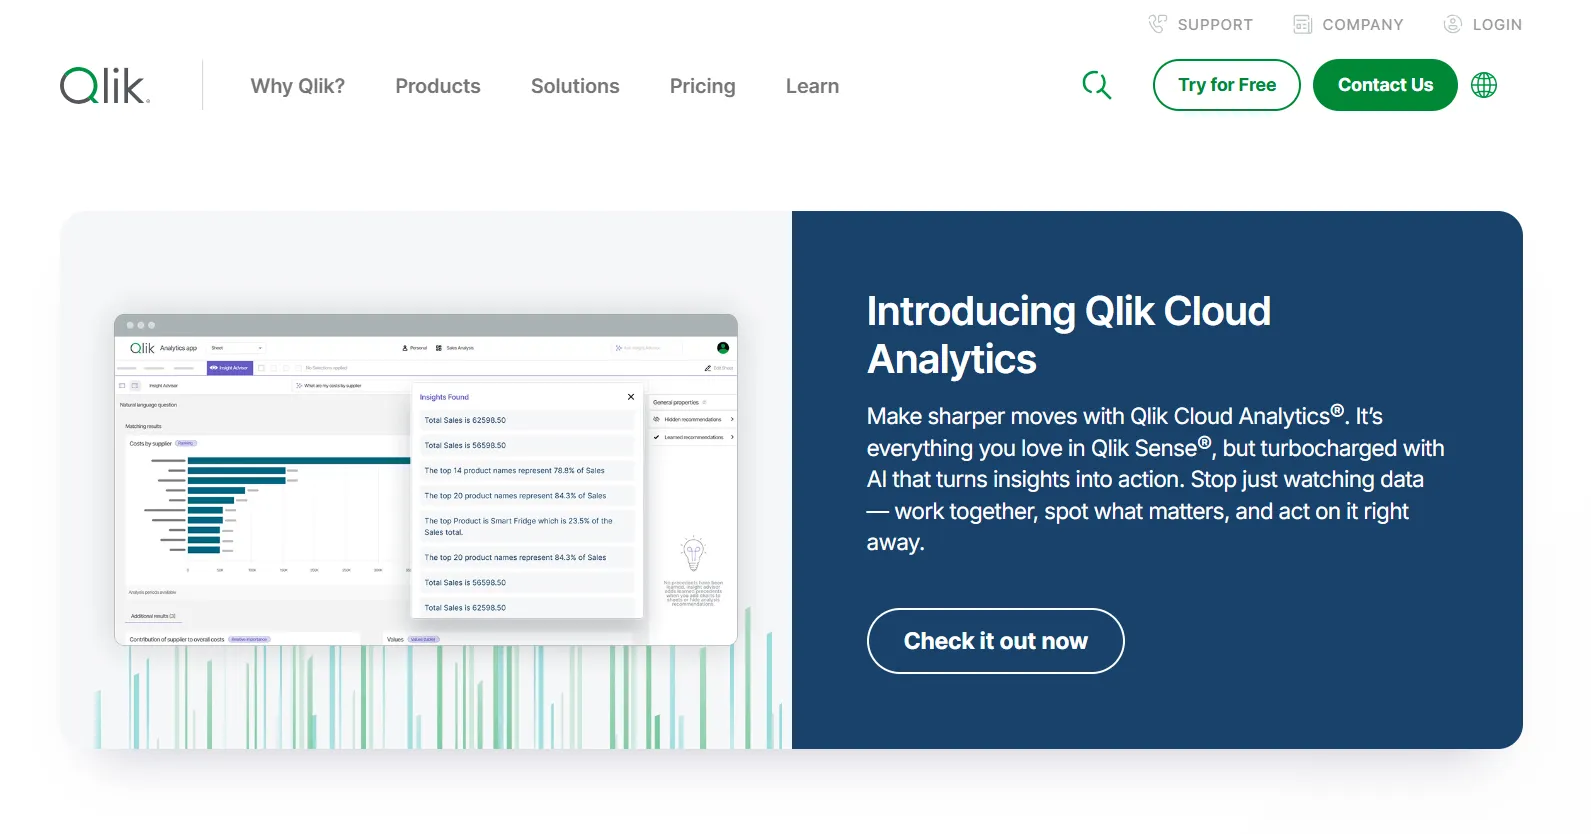
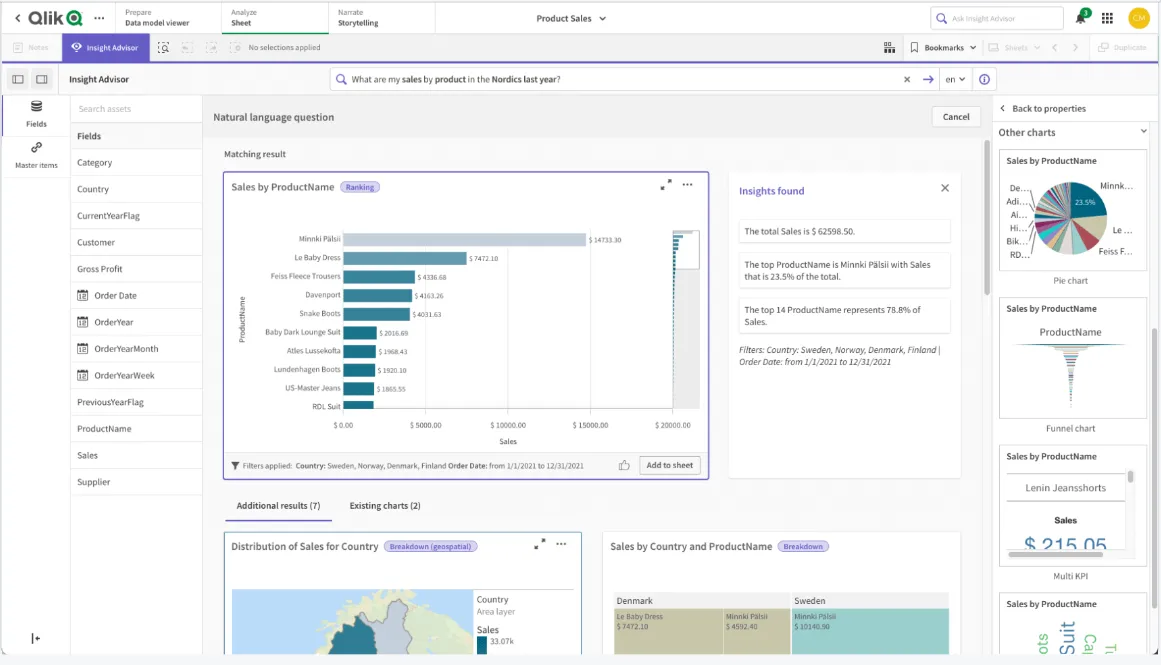
Qlik Sense is a BI platform built on an associative engine that lets you explore data from any angle, not just down a fixed drill path.
Click a value and the entire view recomputes around it, turning up links a straight top-down path would skip over.
Qlik Sense's top features
- Associative exploration: Choose any value and the rest of the screen recomputes together, letting you roam across dimensions.
- Qlik Answers: An agentic assistant that fields natural-language questions and answers within governance.
- Insight Advisor: AI-suggested findings and search, with alerts when a watched metric crosses a line.
Qlik Sense pricing
Qlik Cloud Analytics (the SaaS version of Qlik Sense) has four pricing tiers, all billed annually:
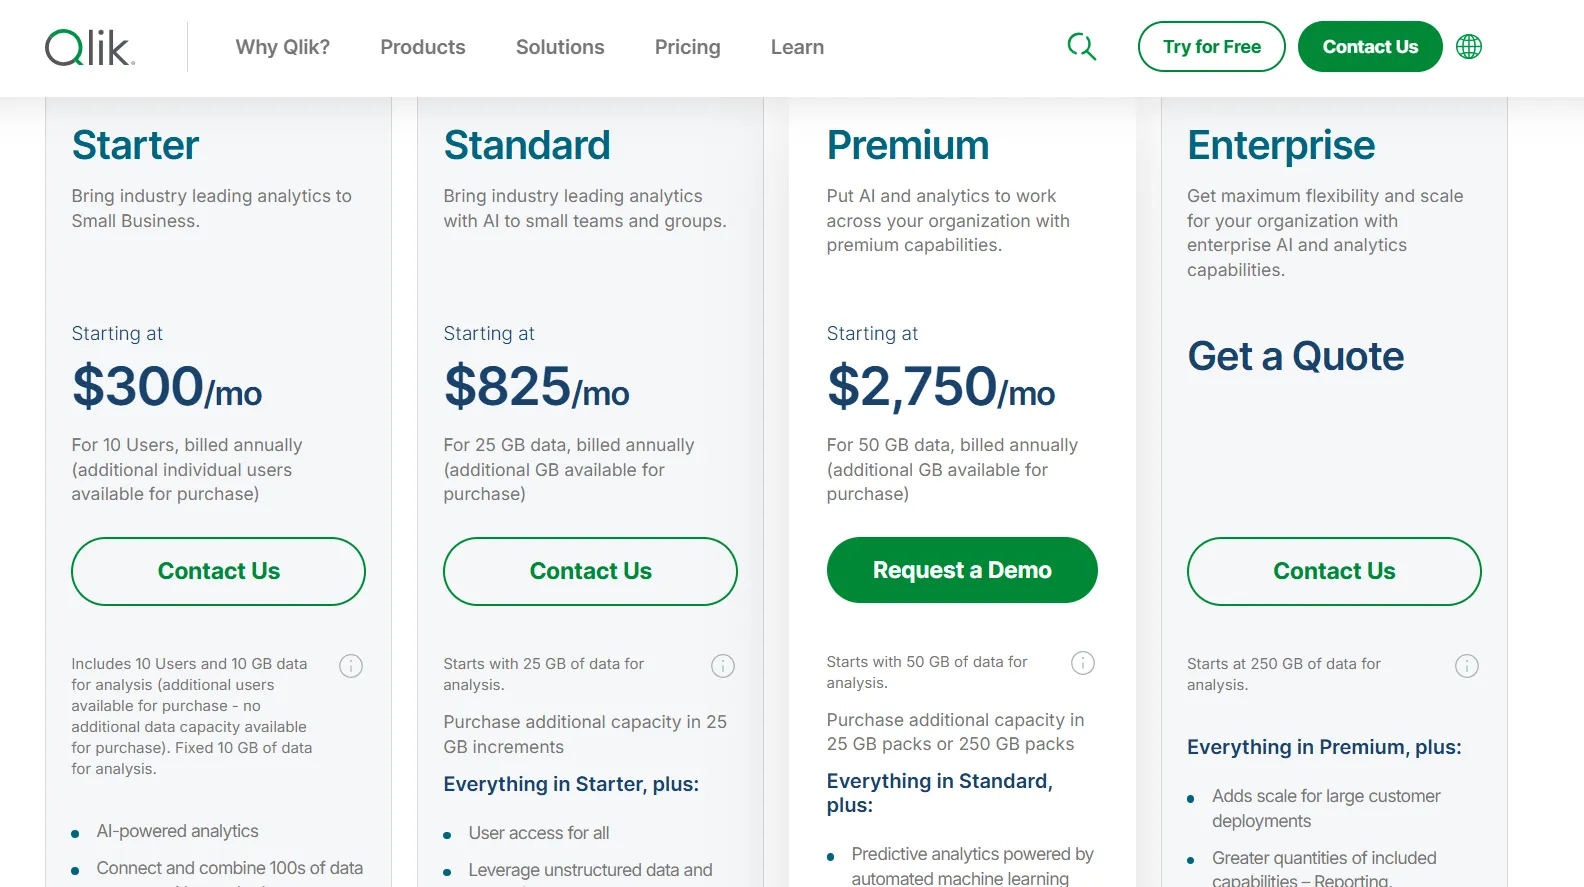
- Starter: $300/month, includes 10 users, 10 GB of data for analysis (fixed), AI-powered analytics, 100s of standard data source connectors, interactive dashboards, 5 GB max app size, and Qlik Community Support.
- Standard: $825/month, starts with 25 GB of data for analysis (additional capacity available in 25 GB increments), includes everything in Starter, plus user access for all, GenAI for unstructured data, managed and shared spaces, 1 GB of Personal Space, augmented advanced analytics, and 24x7 critical support.
- Premium: $2,750/month, starts with 50 GB of data for analysis (additional capacity in 25 GB or 250 GB packs), includes everything in Standard, plus predictive analytics powered by automated machine learning, additional GenAI capacity, anonymous access, SAP and Mainframe connectors, data lineage, 10 GB max app size, and guided customer success onboarding.
- Enterprise: Custom pricing, starts at 250 GB of data for analysis, includes everything in Premium, plus greater capacity for reporting, automations, machine learning models, and dataset size, 15 GB apps as standard (up to 50 GB per app available), 3 GB of Personal Space, multi-region tenants, and a personalized customer success plan.
Qlik Sense pros and cons
✅ The associative engine shines for complex, many-angle exploration.
✅ It fits governed and on-prem requirements without much fuss.
❌ One user on G2 mentions that sometimes there are loading issues, especially when business intelligence is running updates.
Which Sisense alternative fits how your team works?
Sisense does its core job well: putting governed, AI-driven analytics into the products that companies sell to their own users.
If you're shipping analytics as part of a product, it belongs on your shortlist.
Plenty of teams aren't doing that, though.
They want answers out of their own data, written and explained, without standing up and babysitting another dashboard.
That's the job Dot was built for.
Here’s what you get with Dot:
- Ask in Slack or Teams, and the answer comes back there, in email, or in the web app, scheduled reports included.
- Recurring reviews generate themselves and arrive as PowerPoints ready to present.
- The Context Agent holds metric definitions steady, so teams quit reconciling figures right before a meeting.
- Every number links back to its query and source data in one click.
- Direct connections to Snowflake, BigQuery, Redshift, Databricks, and more.
- The dbt, Looker, and Power BI models you already maintain carry over, with no migration.
- SSO and row-level security on the Team plan, with enterprise access controls beyond it.
- Credit-based pricing and unlimited seats.
➡️ Get started for free with Dot's free plan, or schedule a demo to see how it works with your data.
⚠️ Disclaimer: This article was last updated on the 22nd of June, 2026. If anything here has been misinterpreted, reach out, and we'll fact-check it.
Theo Tortorici
Theo writes about AI-powered analytics, data tools, and the future of business intelligence at Dot.