
10 Best AI Dashboard Software & Tools In 2026
Are you trying to figure out what the best AI dashboard software is for your team?
The right AI dashboard platform can cut through weeks of manual reporting by turning raw warehouse data into clear, decision-ready insights your whole organization can actually act on.
In this article, I'll go over the 10 best AI dashboard software tools for 2026, including their top features, pricing structure, and pros and cons.
TL;DR
- Dot offers the best AI dashboard software with its narrative-driven analysis, automated business review reports, and full audit trail on every insight.
- Tools like Tableau, Looker, and Qlik Sense are strong picks for organizations that want visual-first dashboards or governed BI with AI capabilities layered on top.
- On the other hand, tools like ThoughtSpot, Supaboard, and Zoho Analytics work well for teams that want natural language querying and accessible self-service AI analytics at a range of price points.
Factors To Consider When Evaluating AI Dashboard Software
Before we begin with the list of the best AI dashboard software tools, I wanted to go over the factors I took into consideration when making the short-list:
#1: Depth of AI Capabilities
If I were looking for an AI dashboard solution right now, I'd start by asking: what does the AI actually do?
Some tools just add a chat box on top of existing dashboards.
Others go deeper, generating full analyses, surfacing root causes, writing narrative explanations, and even producing automated reports.
The difference matters. A tool that answers "what happened?" is useful.
One that also explains "why it happened" and "what you should do about it" is a different category entirely.
I'd look at whether the AI can handle ad-hoc questions in plain English, whether it maintains context across conversations, and whether it produces outputs that are ready for decision-making without extra manual work.
#2: Data Connectivity and Integration
The best AI dashboard tool in the world is useless if it can't connect to your data.
I'd check for native connectors to your data warehouse (Snowflake, BigQuery, Redshift, Databricks), whether it supports semantic layers like dbt or existing BI models, and how it fits into your current workflow tools like Slack or Teams.
💡 Dot, for example, connects directly to your warehouse and also works with existing semantic layers from Looker, Power BI, and Cube, so you don't have to rebuild metric definitions from scratch.
#3: Ease of Use and Self-Service Access
AI dashboards are supposed to make data more accessible.
But some platforms still require SQL knowledge, complex setup, or weeks of training before anyone can get value from them.
I'd evaluate how quickly a non-technical stakeholder can ask a question and get a reliable answer.
Can they do it from Slack? Do they need to learn a modeling language first?
#4: Pricing Structure
Pricing models in this space vary wildly. You'll see per-seat pricing, usage-based credits, flat monthly rates, and enterprise contracts that start at six figures.
The key question isn't just "how much does it cost?" but "how does it scale?" A tool that charges $50 per user looks affordable until you need 50 seats.
➡️ Some of the platforms we will review also have a generous free plan that you can use to get a sense for their platform before committing to a paid plan.
What Are The Best AI Dashboard Software Tools In 2026?
The best AI dashboard software tools are: Dot, Tableau, Looker, ThoughtSpot, Qlik Sense, Sigma, and Metabase.
Here's a breakdown of the 10 best solutions on the market:
Tool | Use Case | Price |
Dot | AI data analyst that answers business questions with narrative insights, automated reports, and recommendations instead of dashboards. | Free plan; Pro from $180/month. |
Tableau | Advanced visual analytics and interactive data exploration for complex datasets and data storytelling. | $15-$75/user/month (billed annually). |
Looker | Governed, warehouse-native BI with centralized metric definitions via LookML and Google Cloud integration. | Custom pricing (annual contract). |
ThoughtSpot | Natural language search-driven analytics with AI agents for fast, self-service data exploration. | From $25/user/month (billed annually). |
Qlik Sense | Associative analytics engine for unrestricted data exploration across complex relationships. | Custom pricing. |
Sigma | Spreadsheet-like analytics on live warehouse data with AI-powered app building. | Custom pricing. |
Metabase | Open-source BI with simple dashboards, natural language querying, and flexible embedding. | Free (Open Source); Cloud from $100/month. |
Domo | All-in-one cloud BI combining data ingestion, dashboards, AI insights, and workflow automation. | Custom pricing (30-day free trial). |
Zoho Analytics | Budget-friendly BI with AI-powered reporting, 50+ visualizations, and deep Zoho ecosystem integration. | Free plan; Paid from $60/month. |
Supaboard | No-code AI dashboards with trainable agents and natural language analytics for business teams. | From $85/month (Individual); $71/month billed annually. |
#1: Dot
Dot offers the best AI dashboard software in 2026 because it lets you ask questions and get clear, narrative answers with recommendations in minutes.
But we're not trying to add to the noise of other AI dashboard solutions on the market.
Our solution aims to replace the manual back-and-forth of traditional reporting by doing the analysis for you, connecting directly to your data warehouse and delivering decision-ready insights where your team already works.
Let's go over the features that make Dot the ideal choice for data teams and business leaders: 👇
Ask Business Questions Directly in Slack or Teams
Most AI dashboard tools still expect you to open a separate app, navigate to the right view, and figure out the right filters.
Dot works differently.
Your team can ask questions directly in Slack or Microsoft Teams, things like "Why did conversion drop last week?" or "What changed in EMEA compared to last month?" and get a full analysis back in minutes.
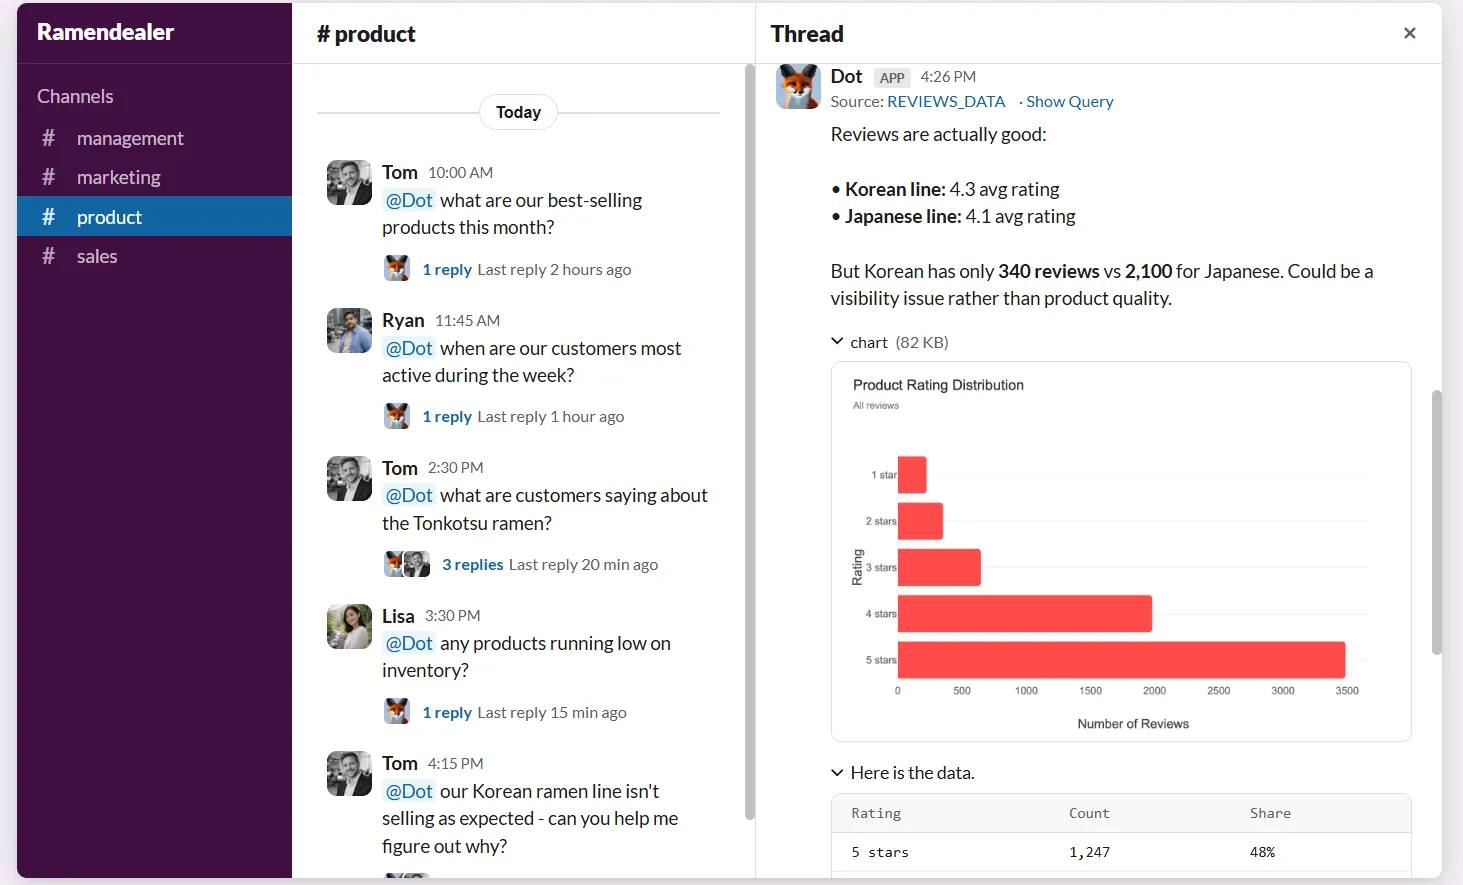
The response doesn't just show a chart. It explains what's happening, identifies which segments or metrics are driving the change, and suggests what to do about it.
Here's what makes this especially useful:
- Absorbs ad-hoc requests: Data teams stop getting interrupted by one-off questions. Stakeholders get answers without waiting in an analyst queue.
- No BI training required for your team: You don't need to learn SQL, DAX, or any data modeling language. You just ask questions and get answers on the spot.
- Full analysis, not just numbers: Every response includes context, explanation, and recommendations, not a raw data dump.
Business Context That Keeps Metrics Consistent
One of the biggest problems with dashboard-heavy setups is context drift.
Metrics get defined slightly differently across reports. Dashboards multiply. Soon, two teams are looking at the same KPI and getting different numbers.
Dot addresses this with our Context Agent that learns and maintains your business definitions, metric logic, and documentation across the data environment.
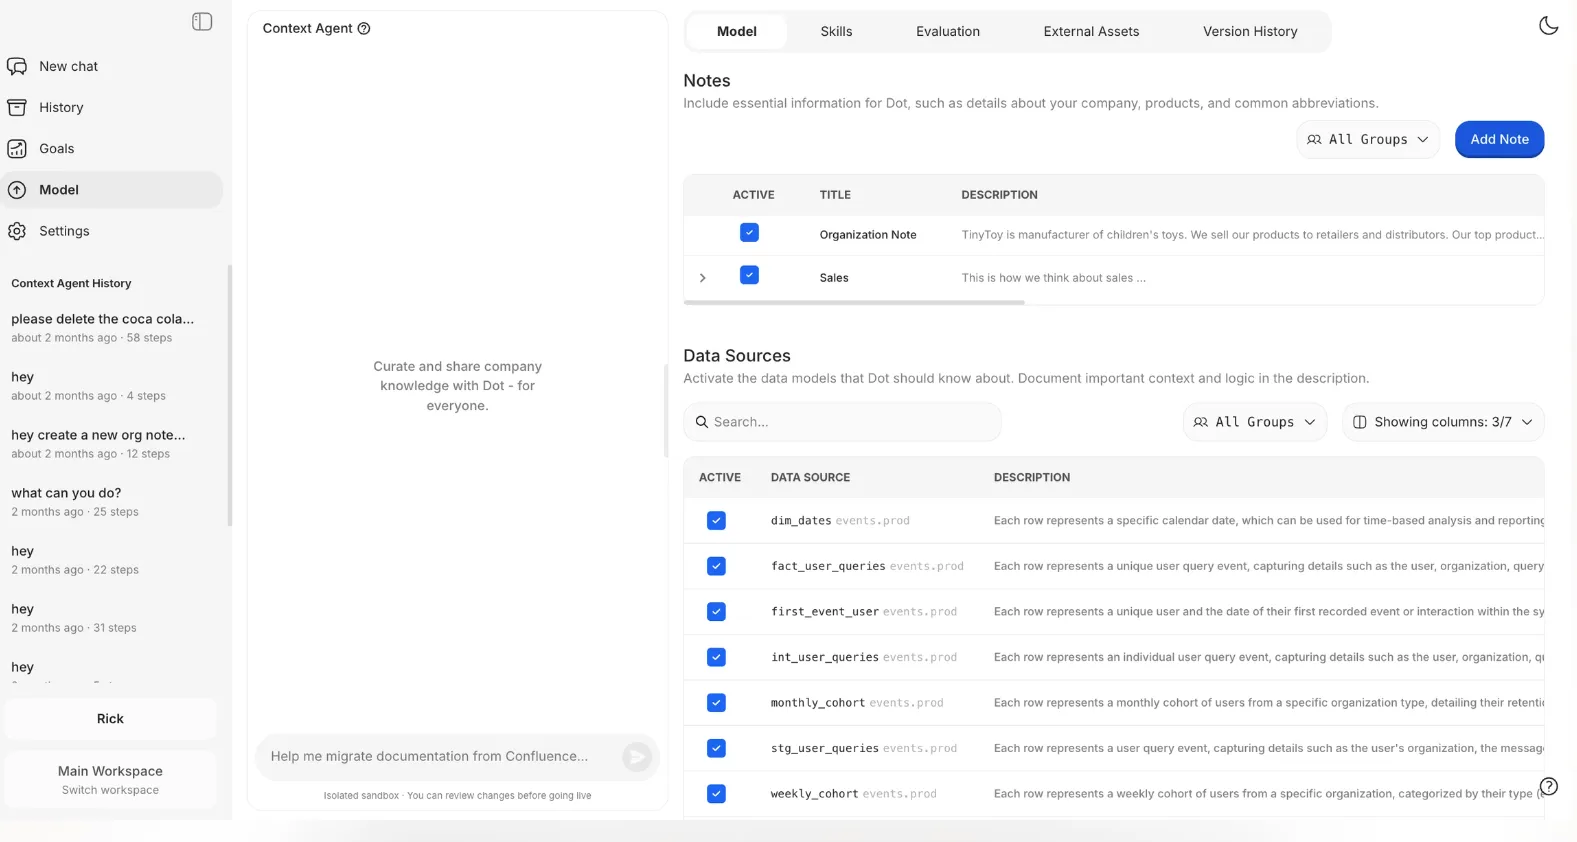
It keeps track of how key metrics are calculated, what tables to use, and how different teams talk about the same concepts.
Then it applies that context every time it generates an insight or report.
Your team will stop asking one another, "whose dashboard is right?" Every answer Dot gives is grounded in the same shared understanding of the business.
Automated Business Review Reports
Weekly and monthly business reviews eat up analyst time.
The usual process involves refreshing dashboards, double-checking numbers, exporting slides, and then explaining what changed.
Dot automates the entire review, not just the visuals.
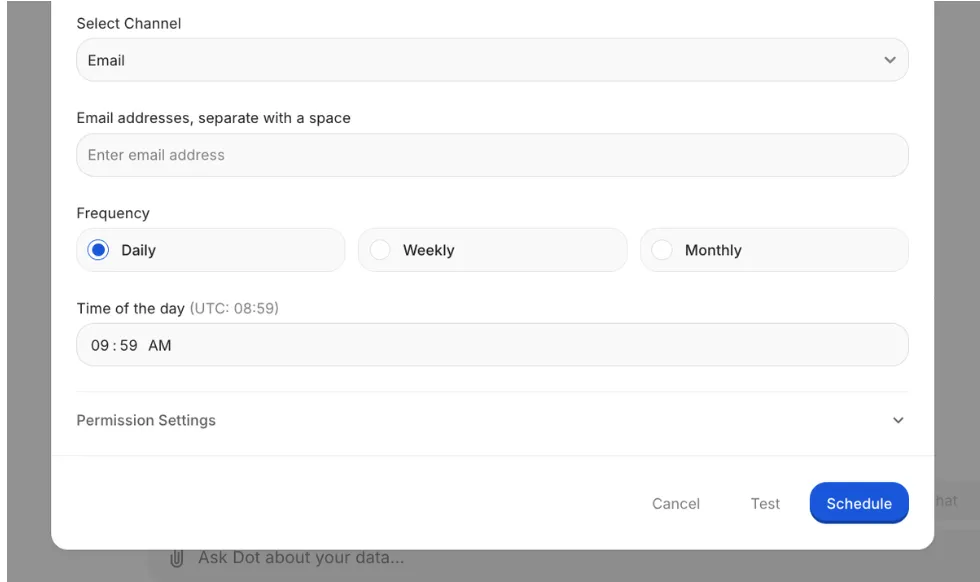
Our platform generates executive-ready reports on a set schedule (daily, weekly, or monthly) directly from the data warehouse.
Each report turns raw metrics into a written narrative that explains what happened, what shifted compared to previous periods, and where attention is needed.
Your leadership team will get a consistent, easy-to-read update, while your data team stops burning hours on the same recurring reports.
Full Audit Trail for Every Insight
A common frustration with traditional BI tools is that dashboards show what the numbers are, but not how they were produced.
If a metric looks off, teams have to dig through models, formulas, or refresh logs just to understand where the number came from.
Dot takes the opposite approach.
Every insight it produces links directly back to the underlying SQL queries, Python logic, and datasets used. There's no black box.
Everything is inspectable and verifiable.
Instead of "the dashboard says so," your team can trace insights back to the source of truth.
What Makes Dot Different From Other AI Dashboard Software?
Most AI dashboard tools in 2026 follow the same pattern: take an existing BI platform, add a natural language chat box, and call it AI-powered.
Dot is built differently.
Where other tools still revolve around dashboards as the primary interface, Dot treats analysis as the product.
You don't build a dashboard and then interpret it yourself. You ask a question, and Dot investigates the data, explains what it found, and gives you a clear recommendation.
That distinction matters more than it sounds.
Traditional AI dashboards still require someone to know which dashboard to open, which filters to apply, and how to read the output.
Dot removes all of that.
The analysis comes to you, in Slack, Teams, or email, already written in plain language with full context.
And unlike most tools that treat each query as a standalone interaction, Dot maintains shared business context across the entire organization.
It remembers how your company defines "active user" or "qualified lead" and applies those definitions consistently. No conflicting numbers across teams. No metric drift.
The audit trail is another clear differentiator. Most AI dashboards generate an answer and leave it at that.
Dot shows exactly how it got there, linking every insight to the SQL, logic, and data behind it. That makes it possible to trust the output, not just hope it's correct.
In short, other AI dashboard tools help you look at data faster. Dot helps you understand it and act on it.
Dot's Integrations
Dot connects directly to modern data warehouses like Snowflake, BigQuery, Redshift, and Databricks, as well as operational databases like Postgres, MySQL, and SQL Server.
Beyond raw data access, it integrates with semantic layers and transformation tools like dbt, Looker, Power BI models, and Cube.
That means it reuses your existing business logic instead of making you rebuild it.
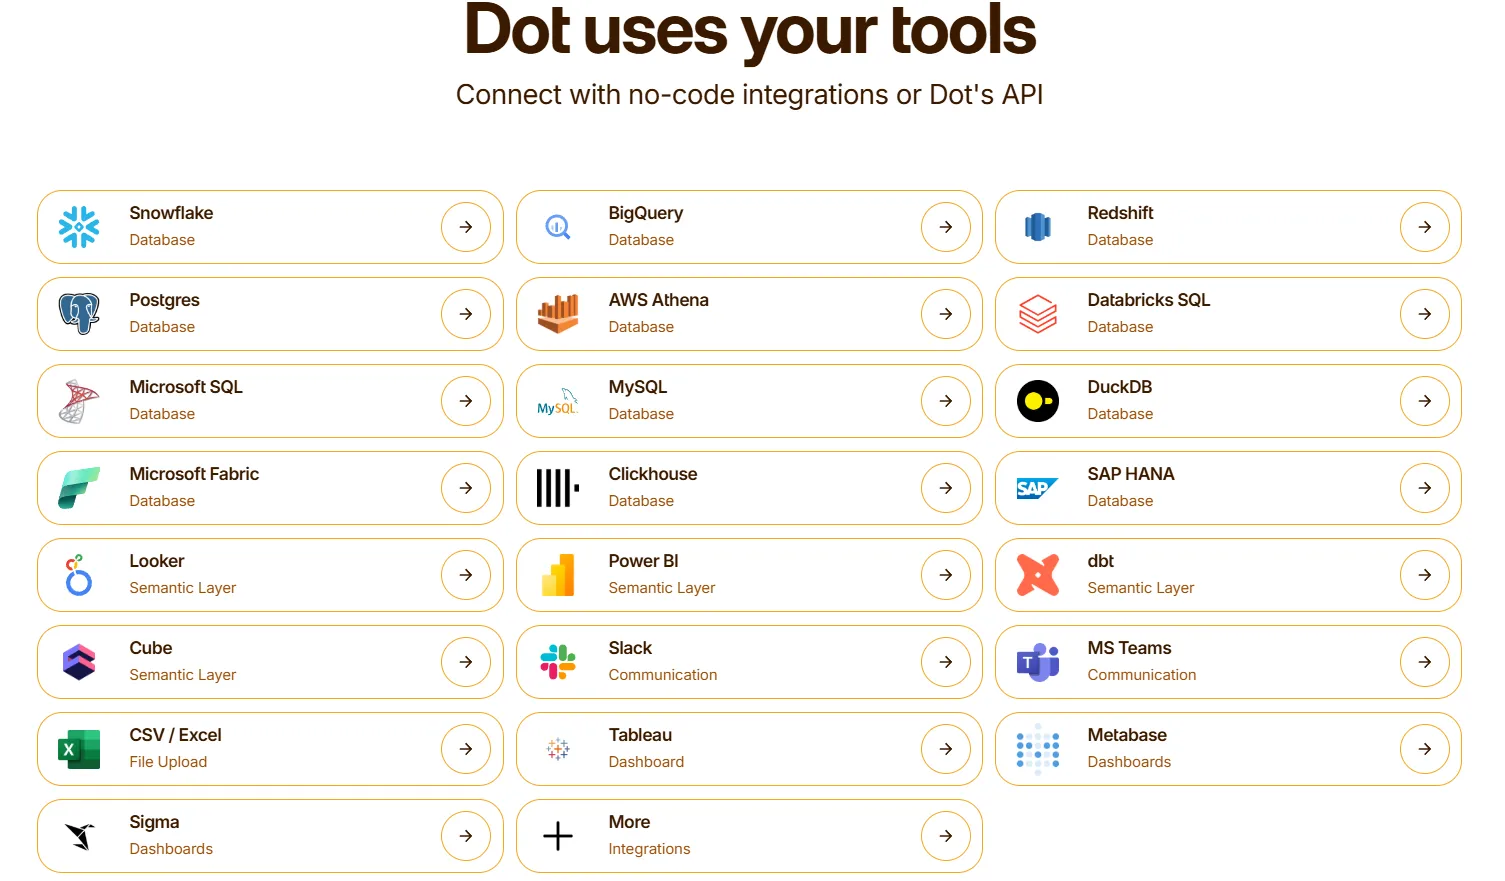
Dot delivers insights through Slack, Microsoft Teams, email, and its web app.
It can also sit alongside existing BI tools like Tableau, Metabase, or Sigma, complementing them rather than forcing a full replacement.
Dot Pricing
Dot offers a free plan with 300 one-time credits, full access to Pro features, and chat-based analysis.
There are three paid plans:
- Pro: $180/month, includes 150 credits per month, $1.80 per credit overage, and unlimited users.
- Team: $720/month, includes 800 credits per month, $1.44 per credit overage, SSO, row-level security, embeddable dashboards, BI migration support, and dedicated support.
- Enterprise: Custom pricing, includes unlimited credits, volume discounts, self-hosted deployment, audit logs, SLA, and a dedicated account manager.
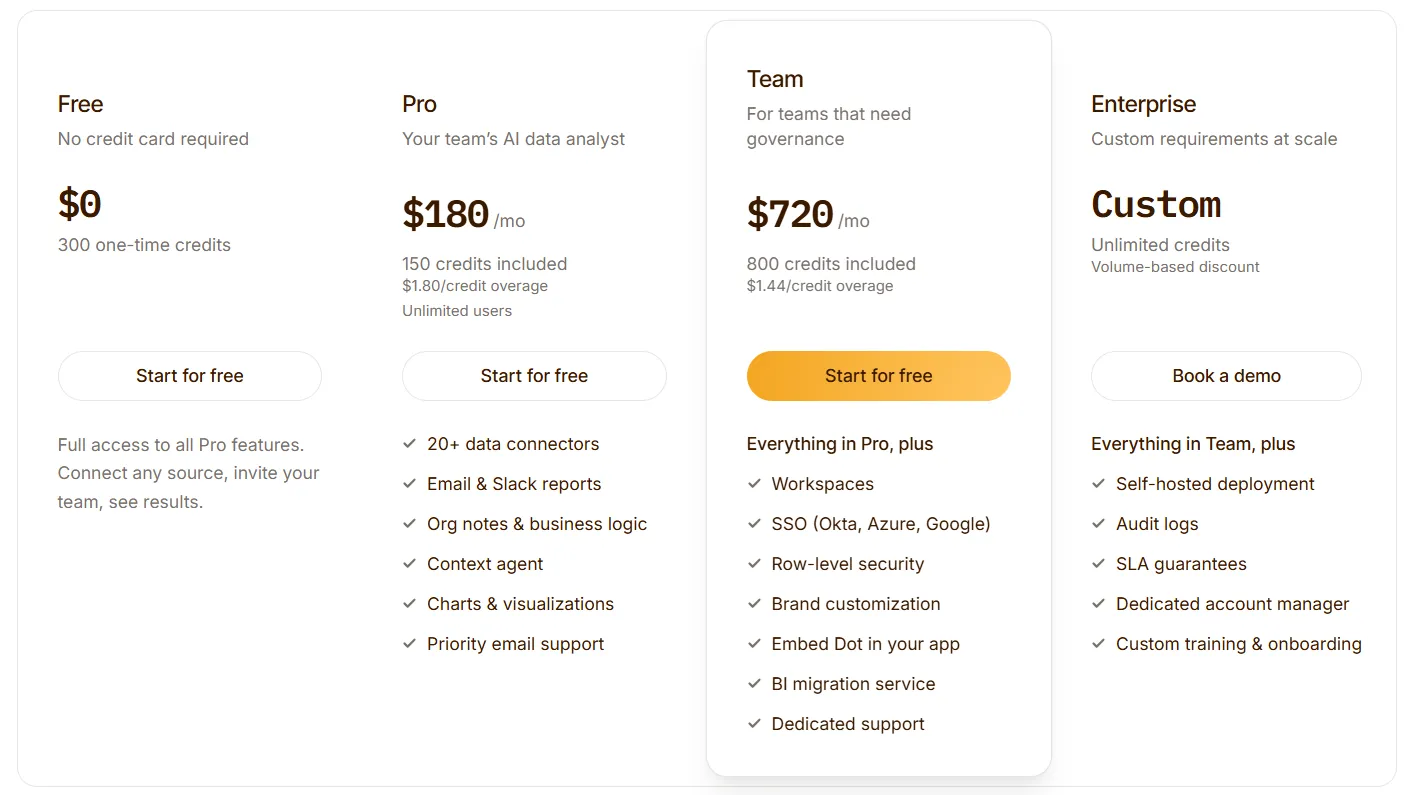
Annual billing saves 10% across all paid plans.
Dot Pros and Cons
✅ Replaces recurring reports with automated, narrative business reviews.
✅ Plain-English analysis delivered directly in Slack or Teams.
✅ Shared business context reduces metric drift across teams.
✅ Full audit trail on every insight, linking back to SQL, logic, and datasets.
✅ Unlimited users on all plans, no per-seat pricing.
❌ Not a traditional dashboarding tool, which may not suit teams that rely heavily on custom visual layouts.
❌ Credit-based model requires some planning around usage volume.
#2: Tableau
Best for: Data teams and enterprises that need advanced visual analytics, exploratory analysis, and flexible deployment across cloud and on-premise environments.
Similar to: Looker, Qlik Sense.

Tableau is one of the most established BI platforms on the market, known for its drag-and-drop visual analytics engine.
It now includes AI features like Tableau Pulse for automated insights and Ask Data for natural language querying, though its core strength remains in hands-on data exploration and storytelling.
Tableau's Top Features

- Advanced visual analytics: Build highly interactive dashboards using VizQL, with rich drill-downs, filters, and visualizations that make complex data explorable.
- Tableau Pulse: AI-generated metric summaries and anomaly detection delivered proactively, so users don't have to dig through dashboards to spot changes.
- Ask Data and Einstein Copilot: Natural language querying and AI assistance for creating visualizations without manual chart building.
- Flexible deployment: Available as Tableau Cloud, Tableau Server (on-premise), or embedded analytics, giving teams control over where and how they deploy.
Tableau Pricing
Tableau uses per-user, per-month pricing, with separate plans depending on whether you deploy Tableau in the cloud, on your own servers, or as part of its newer AI-driven offering:
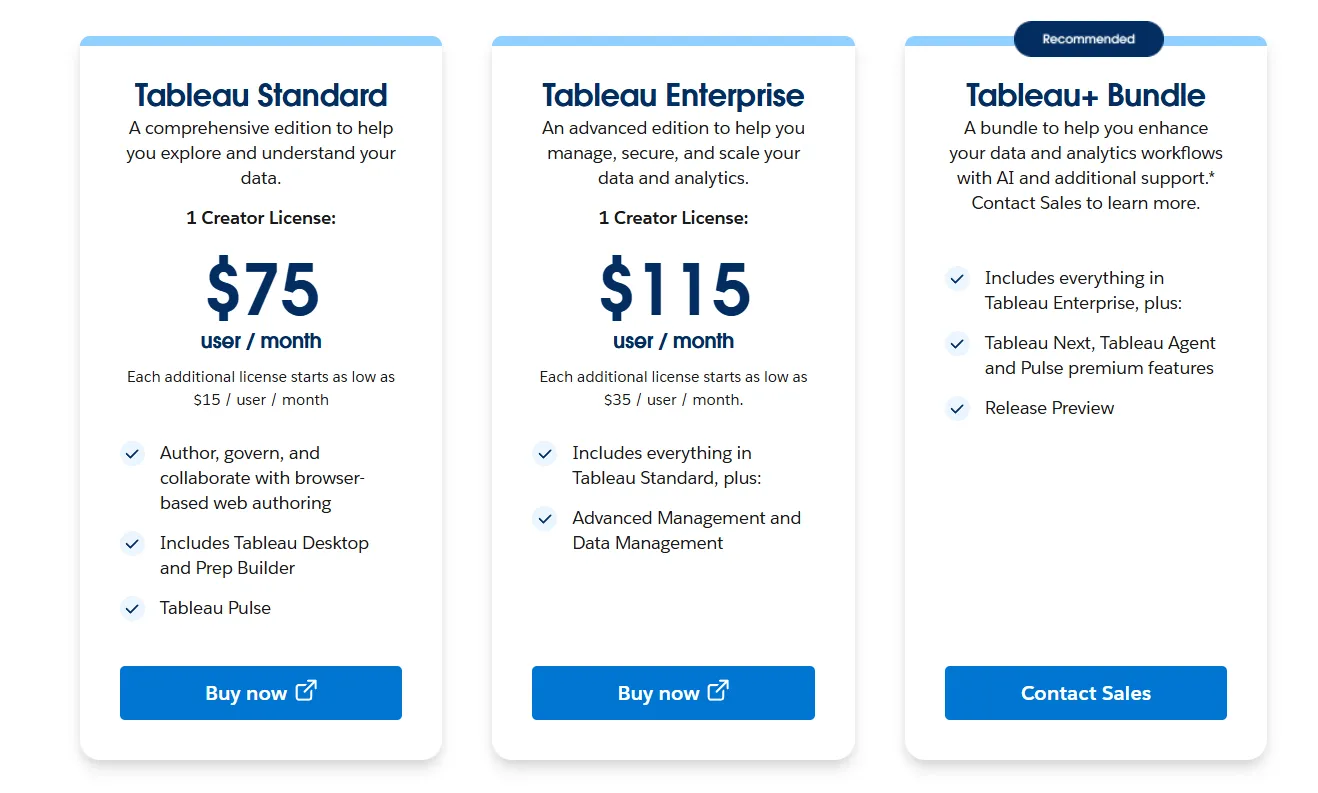
- Tableau Cloud has three pricing plans:
- Tableau Standard: $75 per 1 creator per month, with each additional license from $15 per user/month, includes browser-based authoring and collaboration, Tableau Desktop and Prep Builder, Tableau Pulse for metrics and insights.
- Tableau Enterprise: $115 per 1 creator per month, with each additional license from $35 per user/month, includes everything in Standard, plus Advanced Management and Data Management for governance and scale.
- Tableau+ Bundle (Cloud + AI): Custom pricing, includes everything in Tableau Enterprise, plus Tableau Next, Tableau Agent, and Pulse premium features, with access to release previews and early AI capabilities.
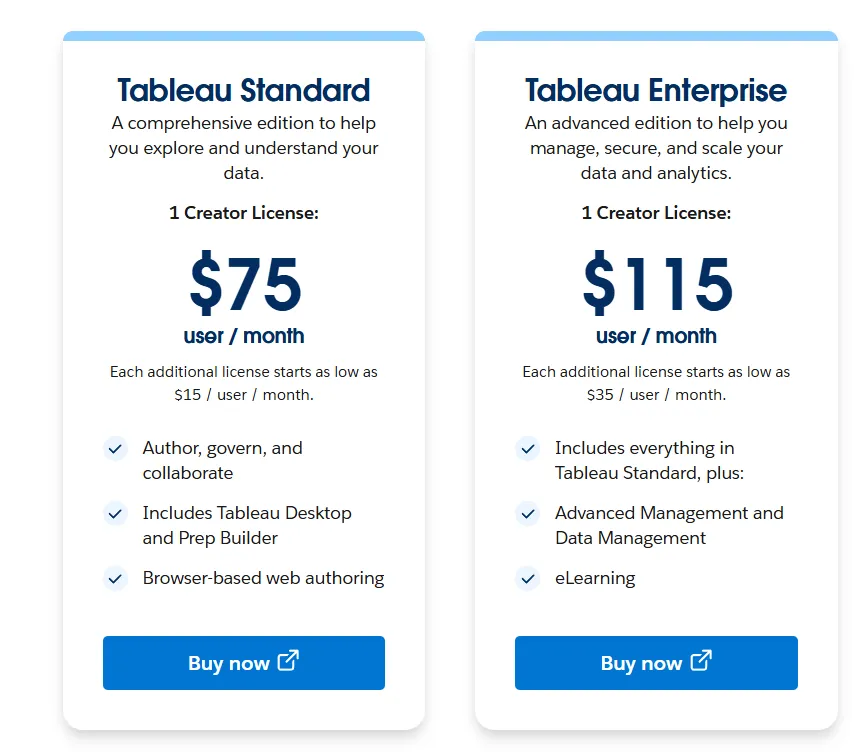
- Tableau Server has two pricing plans:
- Tableau Standard: $75 per 1 creator per month, with each additional license from $15 per user/month, includes authoring, governance, and collaboration and Tableau Desktop and Prep Builder.
- Tableau Enterprise: $115 per 1 creator per month, with each additional license from $35 per user/month, includes everything in Standard, plus Advanced Management, Data Management, and eLearning.
- Tableau Next (agentic analytics): Requires an annual contract, includes agentic analytics via Agentforce, Tableau Semantics, Tableau Pulse (including premium), and Data 360.
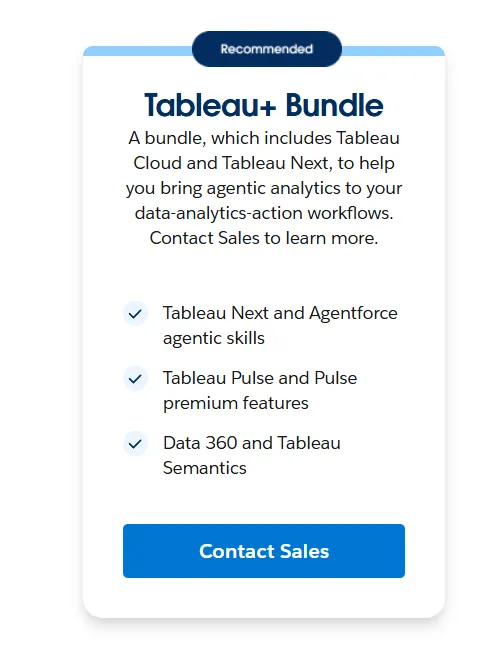
Tableau Pros and Cons
✅ Industry-leading data visualization and storytelling capabilities. Teams wanting a mature alternative to tools likePower BI often land here.
✅ Huge community and ecosystem with thousands of templates and connectors.
✅ Handles very large, complex datasets well.
❌ Steep learning curve beyond basic dashboards, especially around data modeling and calculated fields.
❌ Per-user costs add up fast, particularly when scaling from a small team to hundreds of viewers.
#3: Looker
Best for: Data teams that want governed, warehouse-native BI with consistent metrics and tight integration with Google Cloud.
Similar to: Sigma, Omni.
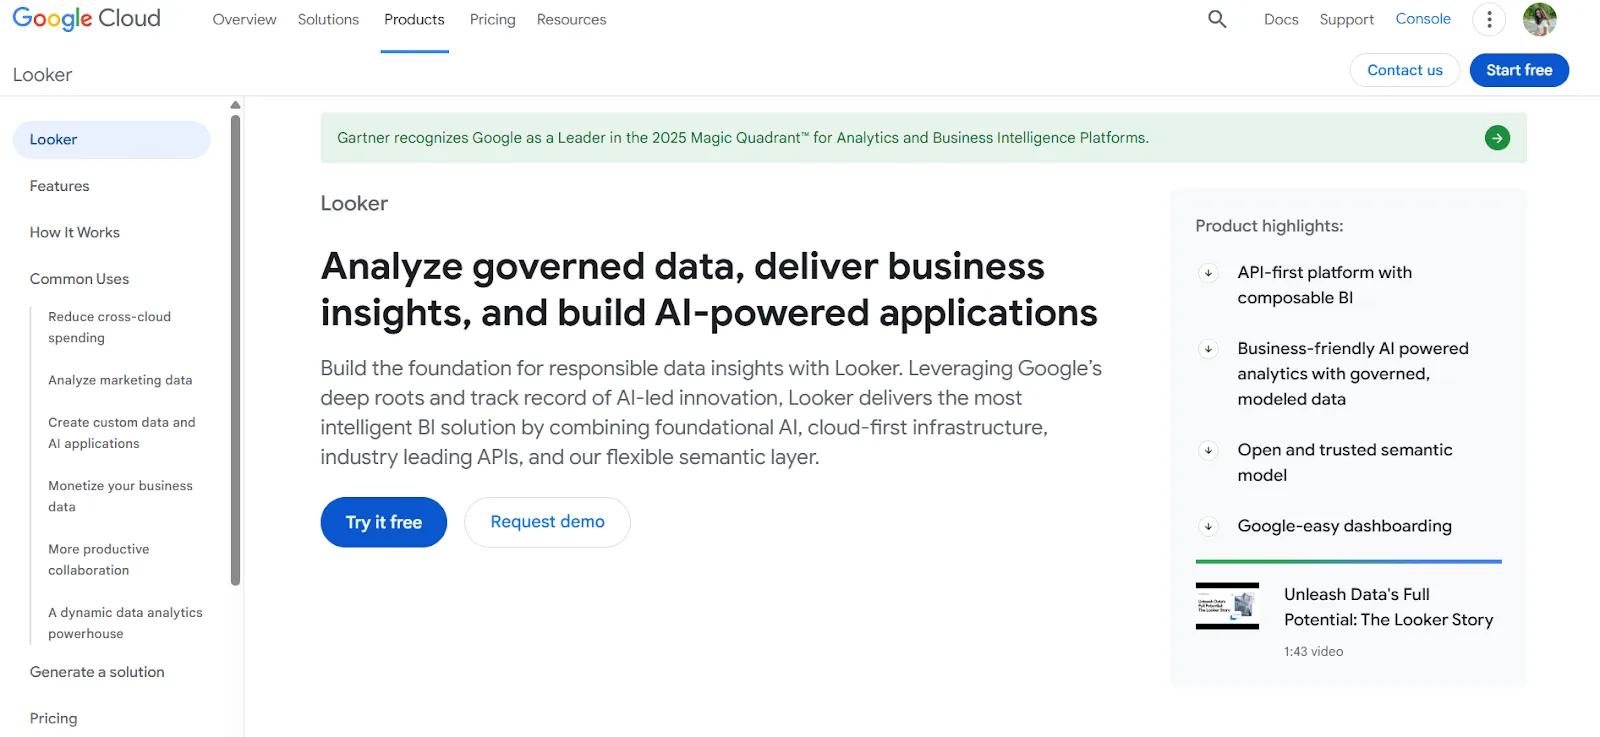
Looker is organized around a centralized modeling language called LookML that defines metrics and business rules in one place.
Every dashboard and report pulls from that same layer, keeping numbers consistent across the organization.
Looker's Top Features
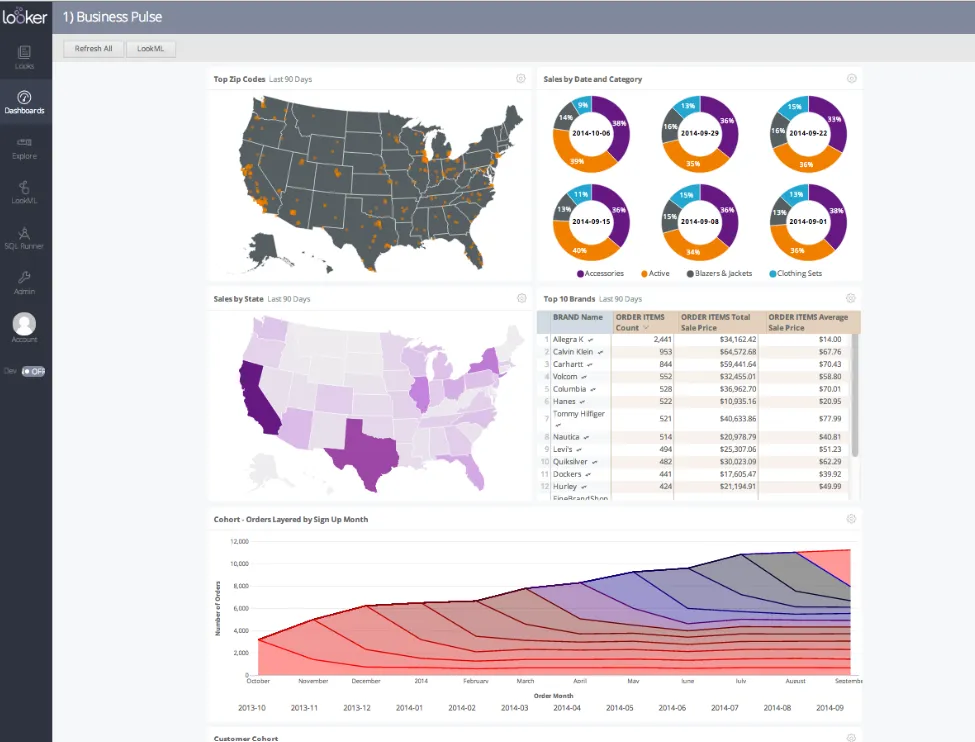
- Centralized semantic modeling with LookML: Define metrics once so every team sees the same numbers across all reports and dashboards.
- Conversational analytics powered by Gemini: Ask questions in natural language and get AI-generated answers without navigating dashboards manually.
- Real-time governed dashboards: Dashboards query the warehouse live, so users always see fresh, trusted data without relying on stale extracts.
Looker Pricing
Looker uses a custom, contract-based pricing model made up of two parts: platform pricing (the cost of running a Looker instance) and user licensing (the cost per user type).
Pricing is annual for all plans.
- Platform editions:
- Standard: Designed for small teams or organizations with fewer than 50 users, includes 1 production instance, 10 standard users + 2 developer users, up to 1,000 query-based API calls/month, and up to 1,000 admin API calls/month.
- Enterprise: Built for larger internal BI and analytics use cases, includes everything in Standard, plus enhanced security features, up to 100,000 query-based API calls/month, and up to 10,000 admin API calls/month.
- Embed: Designed for embedding analytics into external products or applications, includes everything in Standard, plus up to 500,000 query-based API calls/month and up to 100,000 admin API calls/month.
- User licensing:
- Developer users: Full access to Looker, including LookML development, administration, APIs, and advanced tooling.
- Standard users: Can explore data, build dashboards and reports, run SQL, and schedule content.
- Viewer users: Read-only access to dashboards and reports, with filtering and drill-down.
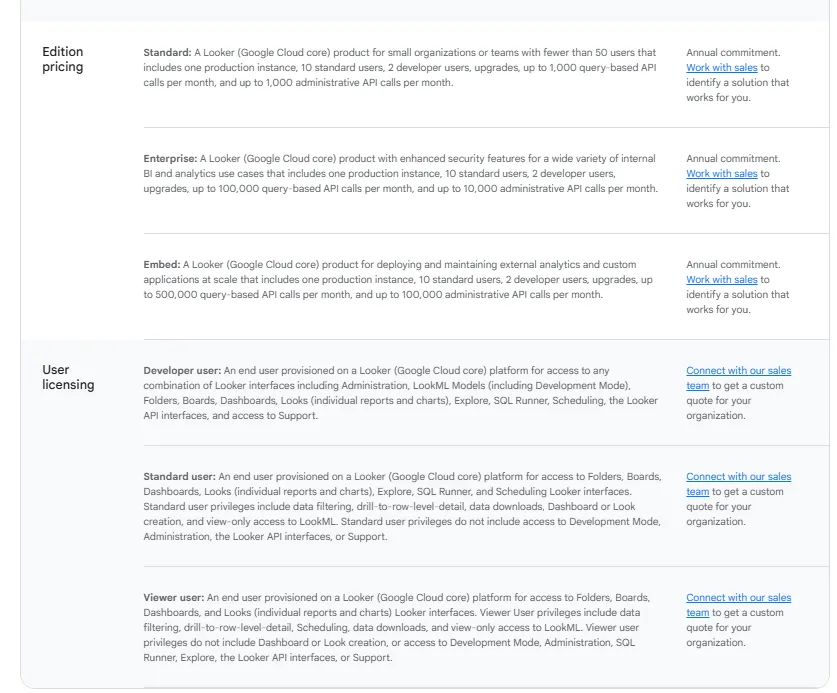
Pricing is custom on all plans and varies based on scale, permissions, and usage.
Looker Pros and Cons
✅ Keeps metrics consistent across the entire organization with a single source of truth.
✅ Strong embedding capabilities for internal tools or customer-facing products.
❌ Steep learning curve, especially for teams without LookML experience, which is why some organizations have been looking forLooker alternatives.
❌ Custom pricing makes it hard to estimate costs upfront.
#4: ThoughtSpot
Best for: Organizations that want AI-powered, self-service analytics with natural language querying and automated dashboards.
Similar to: Dot, Supaboard.
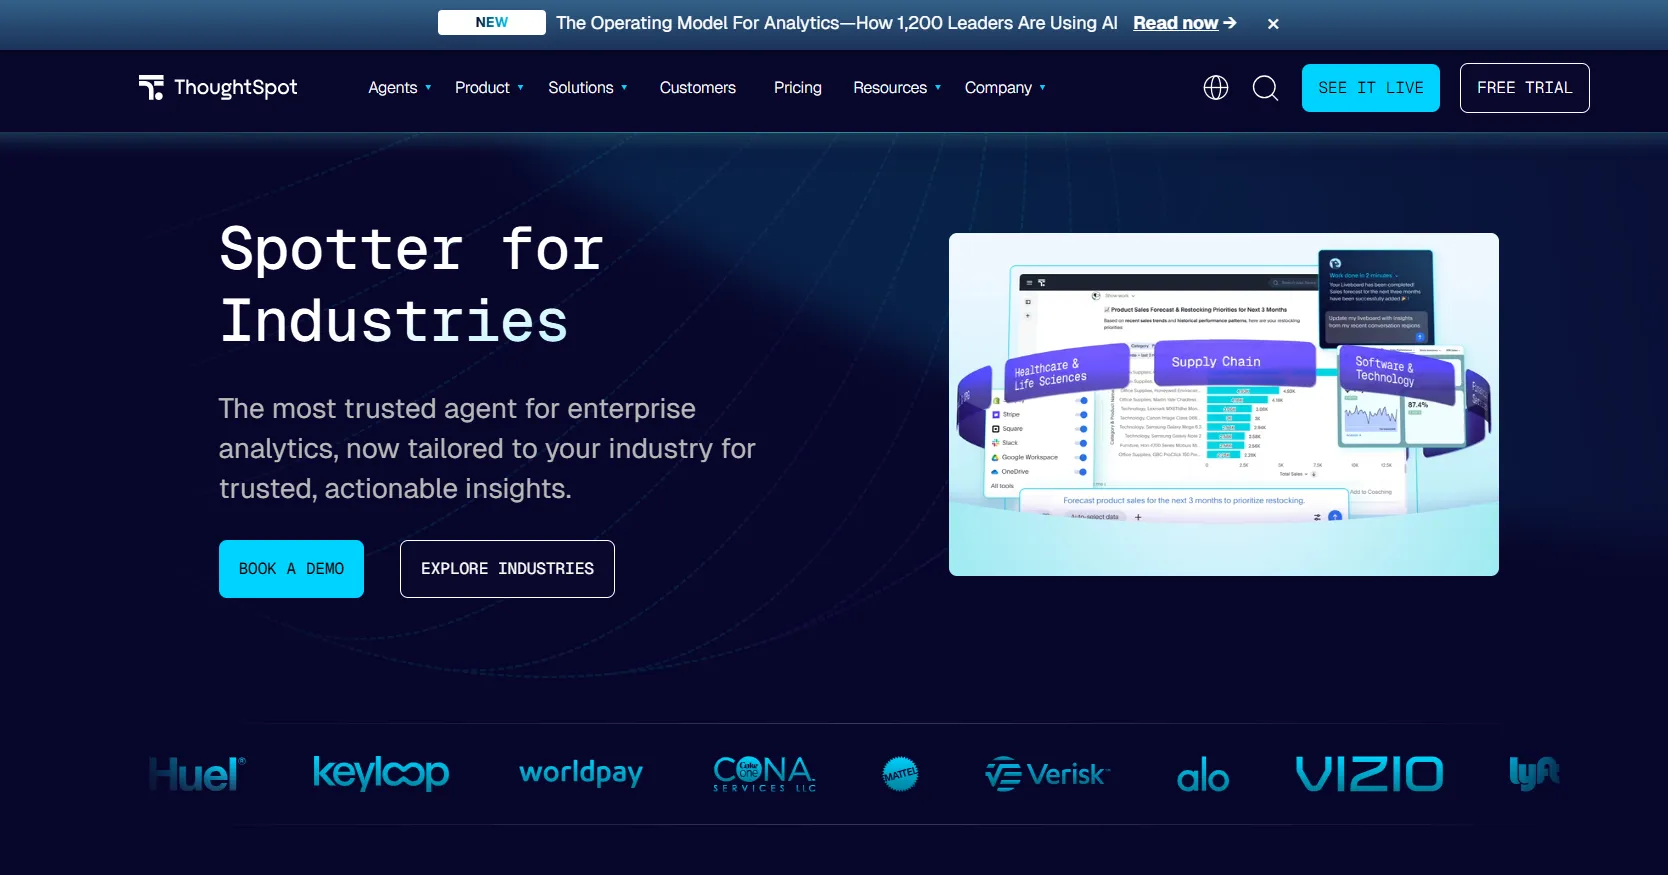
ThoughtSpot is built around the idea that anyone should be able to search their data the way they search the web.
Its Spotter AI Agent generates analyses, dashboards, and insights automatically, reducing the need for manual report building.
It's a strong option for teams exploring alternatives to tools likeDataGPT orTextQL that want a more established platform.
ThoughtSpot's Top Features
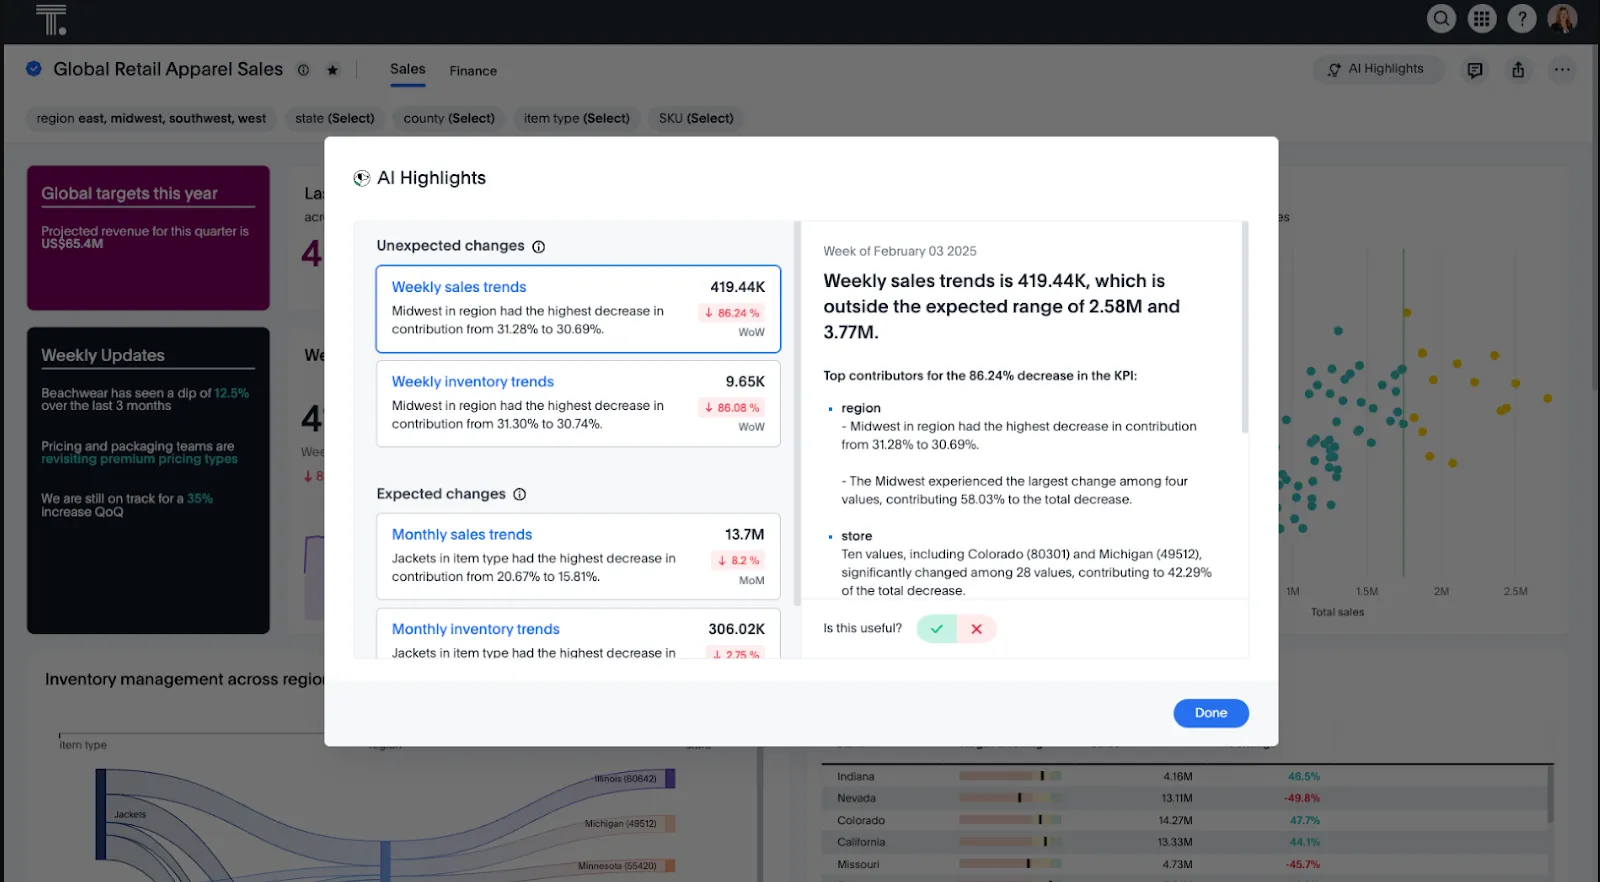
- Natural language analytics: Ask questions in plain English and get governed, instant answers from live data.
- Spotter AI Agent: Automatically generates analyses, dashboards, and insights, even from unstructured data, reducing manual exploration work.
- SpotterViz: Turns data into complete, styled dashboards without manual layout or chart configuration.
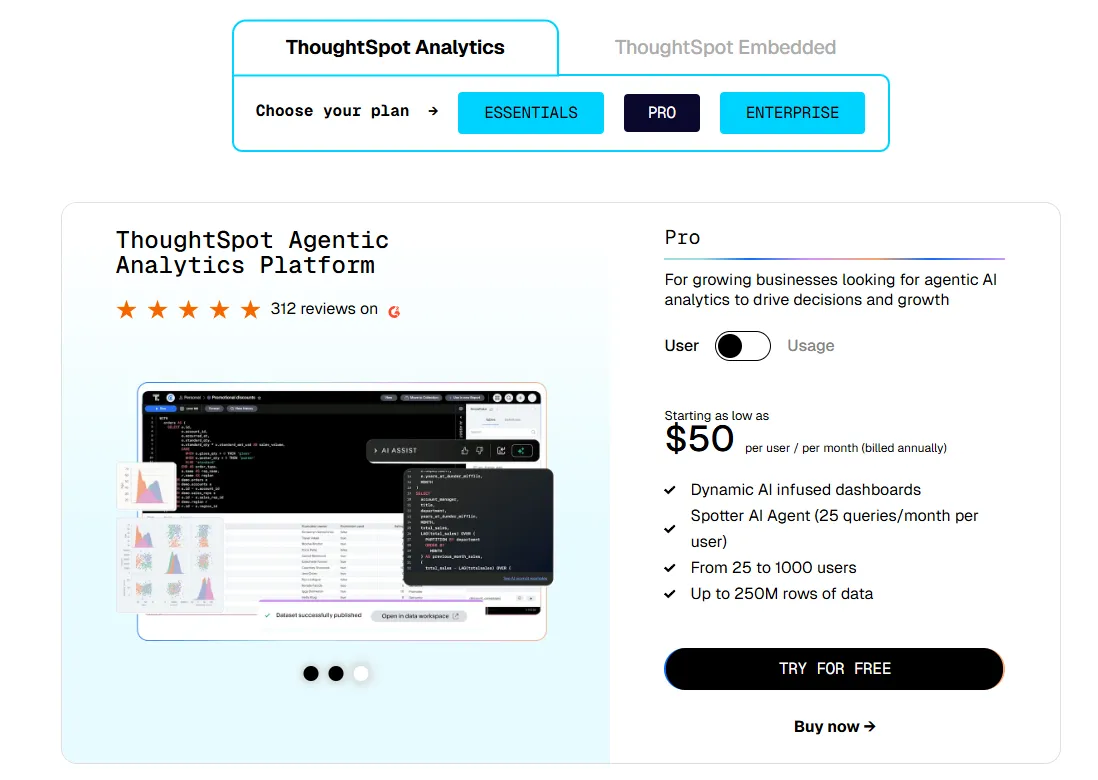
ThoughtSpot Pricing
ThoughtSpot offers two separate products - ThoughtSpot Analytics for internal BI and ThoughtSpot Embedded for building analytics into applications - each with flexible pricing depending on scale and usage:
- ThoughtSpot Analytics:
- Essentials: From $25 per user per month (billed annually), for teams of 5-50 users, includes dynamic interactive dashboards and AI-powered insights and supports up to 25M rows of data.
- Pro (per user pricing): From $50 per user per month (billed annually), for 25–1,000 users, includes everything in Essentials, plus AI-infused dashboards and Spotter AI Agent (25 queries per user/month), and supports up to 250M rows of data.
- Pro (usage-based): From $0.10 per query, includes everything in Pro per user, and adds Analyst Studio.
- Enterprise (user or usage-based): Custom pricing, includes everything in Pro, plus unlimited users and data.
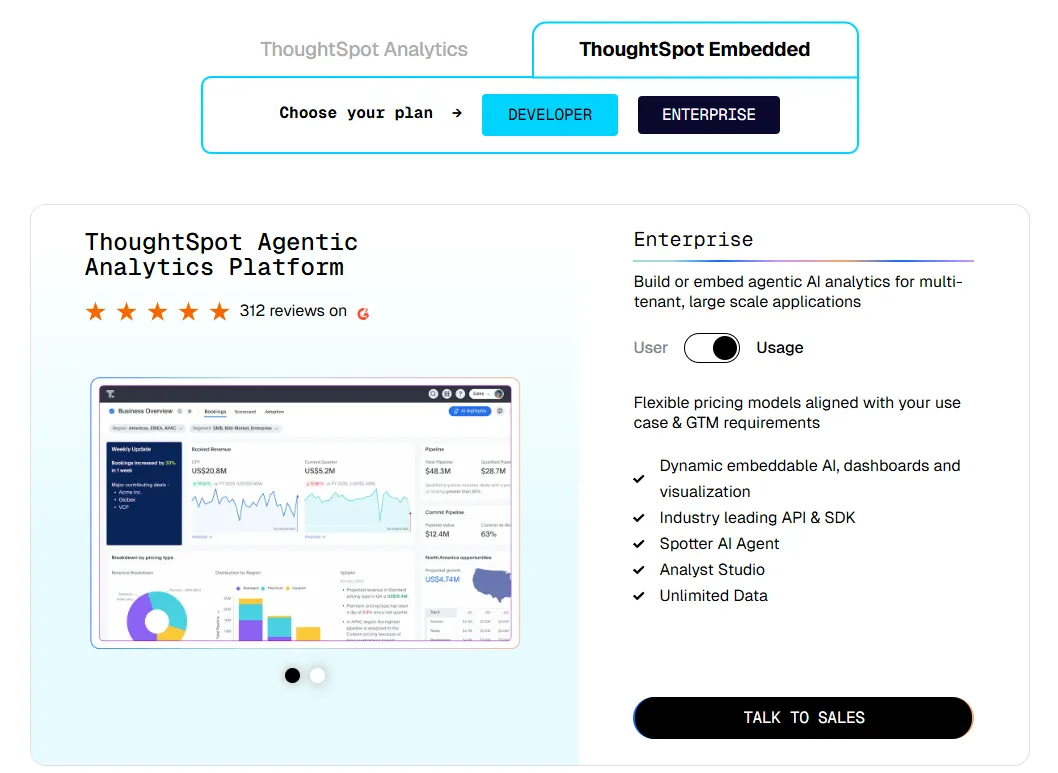
- ThoughtSpot Embedded:
- Developer: Free for 1 year, includes embeddable AI analytics, dashboards, and visualizations, APIs and SDKs, up to 10 users and 25M rows of data.
- Enterprise (user-based): Custom pricing, includes everything in Developer, plus unlimited data.
- Enterprise (usage-based): Custom pricing, everything in Enterprise, plus Spotter AI Agent and Analyst Studio.
ThoughtSpot Pros and Cons
✅ Very accessible for non-technical users thanks to search-driven analytics.
✅ Built-in AI surfaces patterns and explanations faster than traditional dashboards.
❌ Costs can be hard to predict at scale due to consumption-based pricing models.
❌ Auto-generated visuals can feel basic compared to Tableau or Qlik.
#5: Qlik Sense
Best for: Organizations that want powerful, interactive analytics for exploring complex data relationships, especially in highly governed industries.
Similar to: Tableau, Looker.
Qlik Sense is known for its unique associative analytics engine, which lets users explore data freely without being locked into predefined queries or drill paths.
It's built for teams that want fast, interactive exploration combined with AI-assisted insights and strong governance.
A solid pick for teams evaluating alternatives to tools likeMindsDB that want enterprise-grade analytics with built-in AI.
Qlik Sense's Top Features
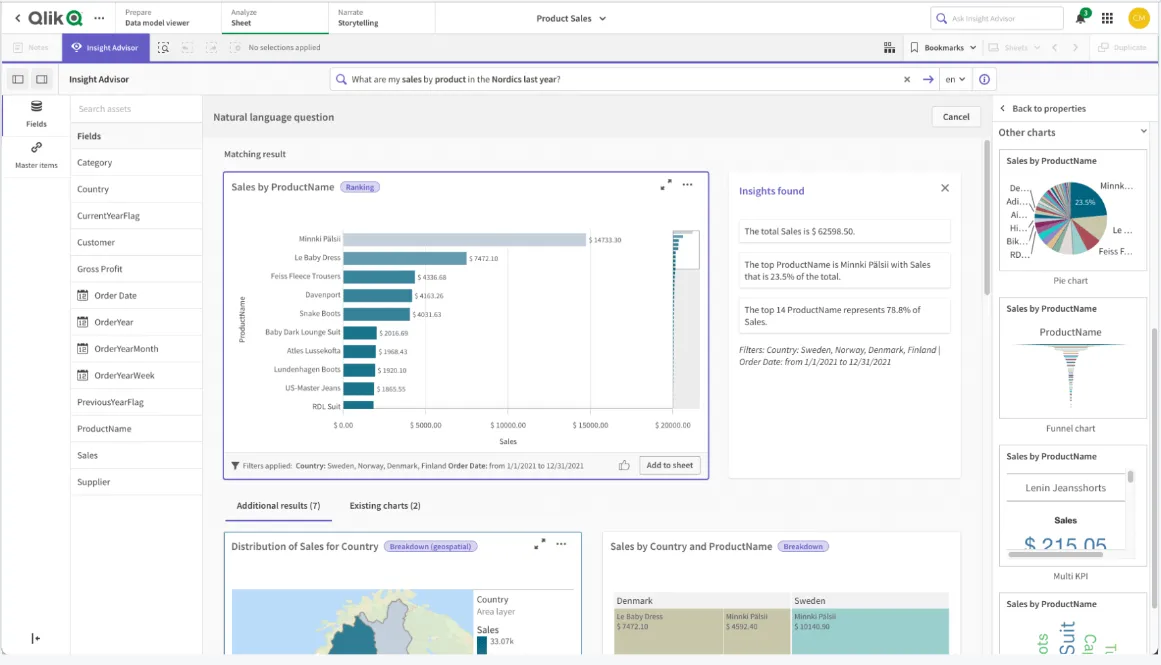
- Associative analytics engine: Explore data in any direction by selecting values across charts and tables, with instant recalculations that keep everything in context.
- AI-powered augmented analytics: Built-in AI generates insights automatically, supports natural language search, and enables predictive analytics without data science expertise.
- Real-time alerts and automation: Monitor data changes with intelligent alerts and trigger automated actions when thresholds or events occur.
Qlik Sense Pricing
Qlik doesn't publish pricing for Qlik Sense.
You'd need to contact their sales team for a custom quote based on deployment size and requirements.

Qlik Sense Pros and Cons
✅ Highly flexible and customizable analytics.
✅ Scales well for enterprise use with large data volumes and complex needs.
✅ Associative engine uncovers relationships that traditional query-based tools miss.
❌ Expensive, especially for broader organizational rollouts.
❌ Can be complex to set up and maintain without dedicated administrators.
#6: Sigma
Best for: Teams that want spreadsheet-like analytics on live warehouse data with AI-powered workflows, without the complexity of traditional BI setup.
Similar to: Looker, Metabase.
Sigma works directly on your cloud data warehouse and feels like working in a spreadsheet, making it immediately familiar to anyone who's used Excel.
It's added AI features for building dashboards, apps, and reports through natural language.
A good fit for finance and ops teams who want something more accessible than tools likeVanna AI orBasedash.
Sigma's Top Features
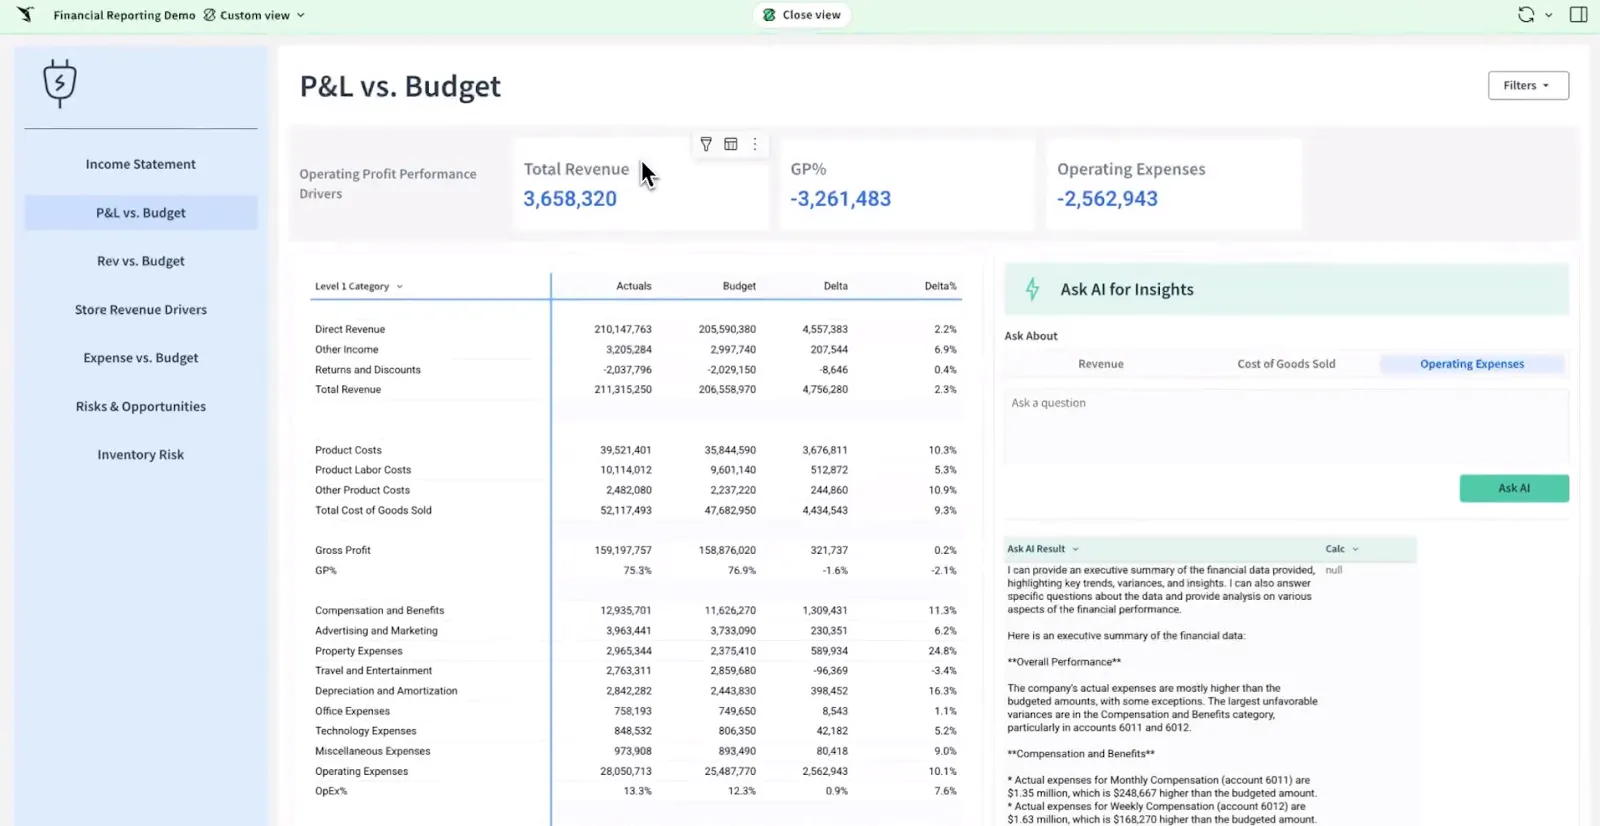
- Spreadsheet-style interface: Analyze data using formulas, tables, and logic that feel familiar to Excel users, making advanced analytics accessible to business teams.
- AI-powered dashboards and apps: Use natural language to build dashboards, reports, and full data apps that support real business workflows.
- AI Apps for operations: Build interactive apps for forecasting, capacity planning, sales pipelines, and budgeting without custom development.
Sigma Pricing
Sigma doesn't publish its pricing. You'd need to contact their sales team directly to get a custom quote.
Sigma Pros and Cons
✅ Spreadsheet-like interface makes it intuitive for anyone used to Excel.
✅ Queries data directly from the warehouse, so insights are always live.
❌ Limited visual customization compared to tools like Tableau or Qlik.
❌ Unpublished pricing makes it hard to compare costs before engaging with sales.
#7: Metabase
Best for: Startups, product teams, and data-lean organizations that want fast, self-serve analytics and flexible embedding without enterprise BI complexity.
Similar to: Zoho Analytics, Supaboard.
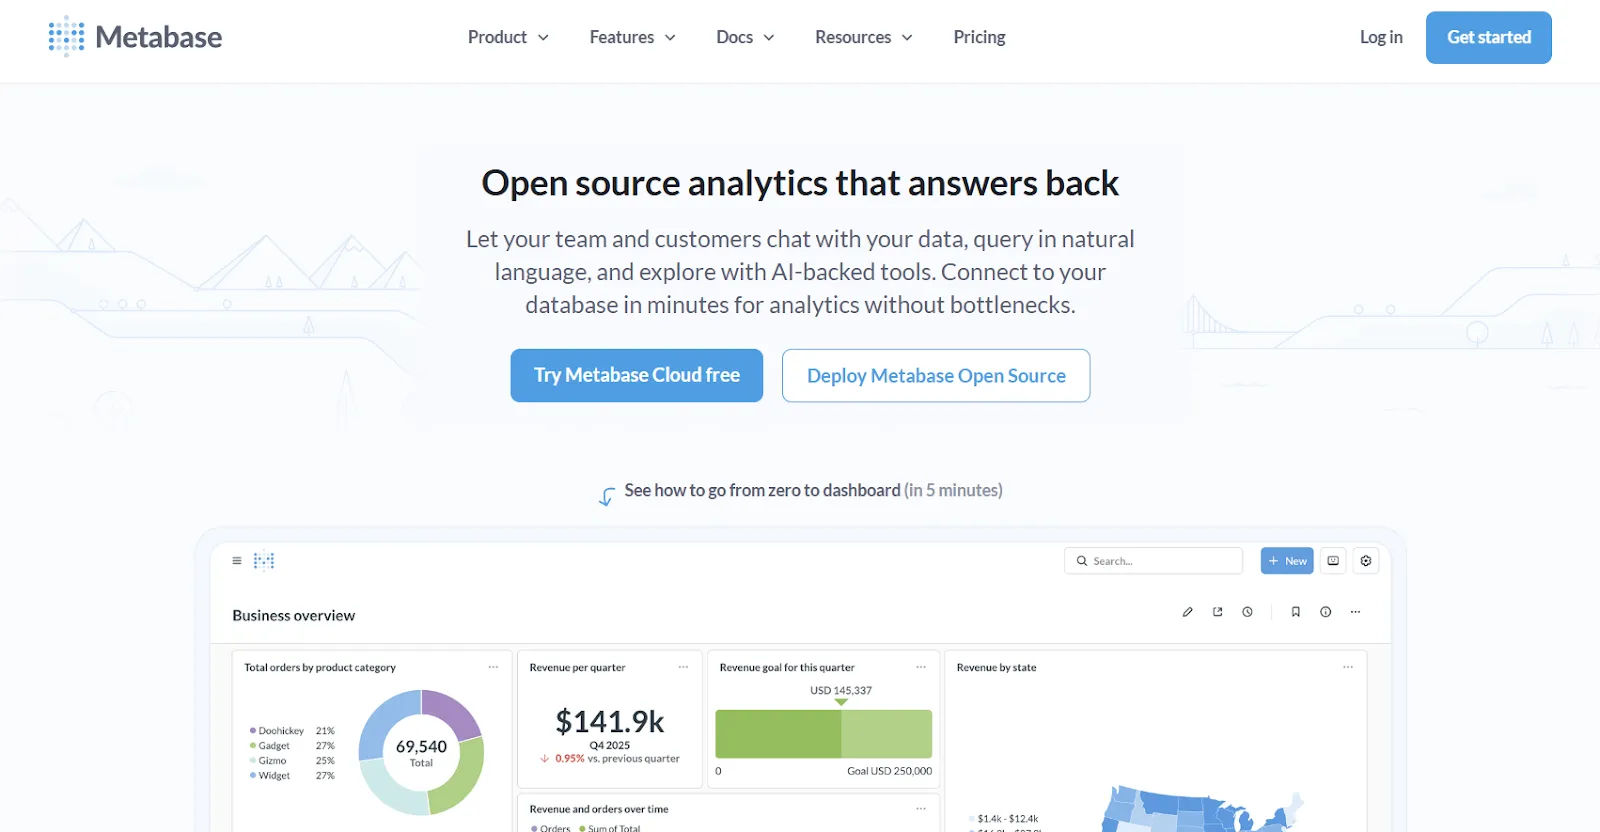
Metabase is an open-source analytics platform that lets teams explore data, ask questions in plain English, and share insights without bottlenecks.
Its Metabot AI feature adds natural language querying on top of an already simple visual query builder.
Metabase's Top Features
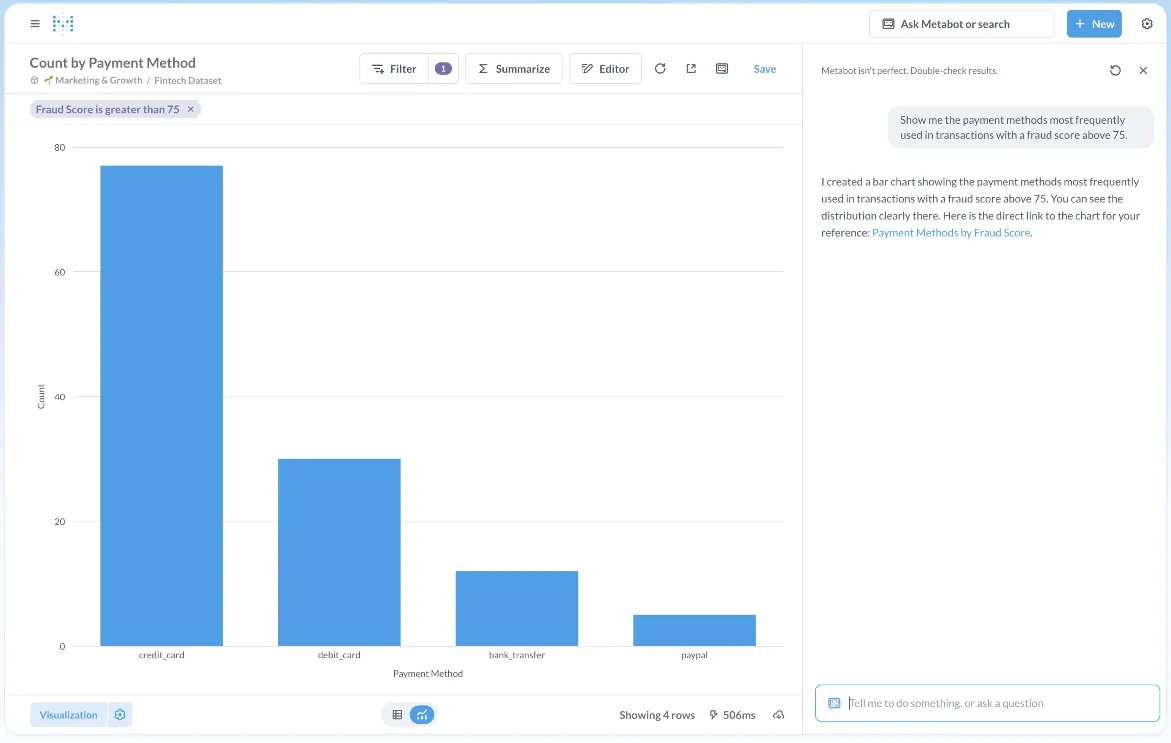
- Metabot AI: Ask questions in plain English and let AI generate queries and visualizations on top of live database data.
- Visual query builder: Non-technical users can build queries through a step-by-step interface, while analysts can drop into raw SQL when needed.
- Drill-through exploration: Click directly on charts to zoom in, filter, break out data, or auto-generate follow-up reports without writing new queries.
Metabase Pricing
Metabase offers two pricing options depending on how you use the product: internal business intelligence or customer-facing embedded analytics.
- Business Intelligence:
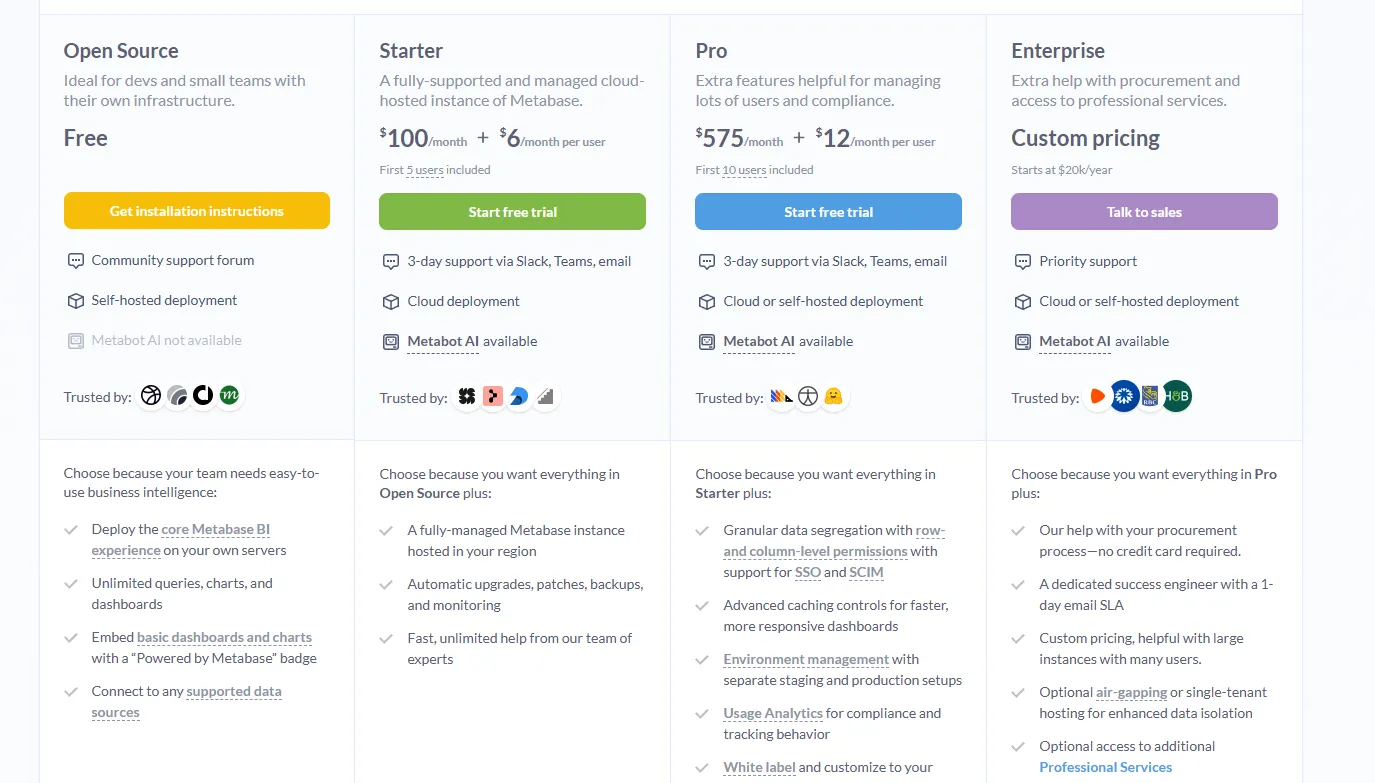
- Open Source (Self-hosted): Free, self-hosted deployment, includes unlimited queries, charts, and dashboards, connects to all supported data sources, basic embedding with “Powered by Metabase” branding, community support only.
- Starter (Cloud-hosted): $100/month + $6/user/month, first 5 users included, includes everything in Open Source, plus option to include Metabot AI (charged extra), automatic upgrades, backups, and monitoring, support via Slack, Teams, and email (3-day SLA).
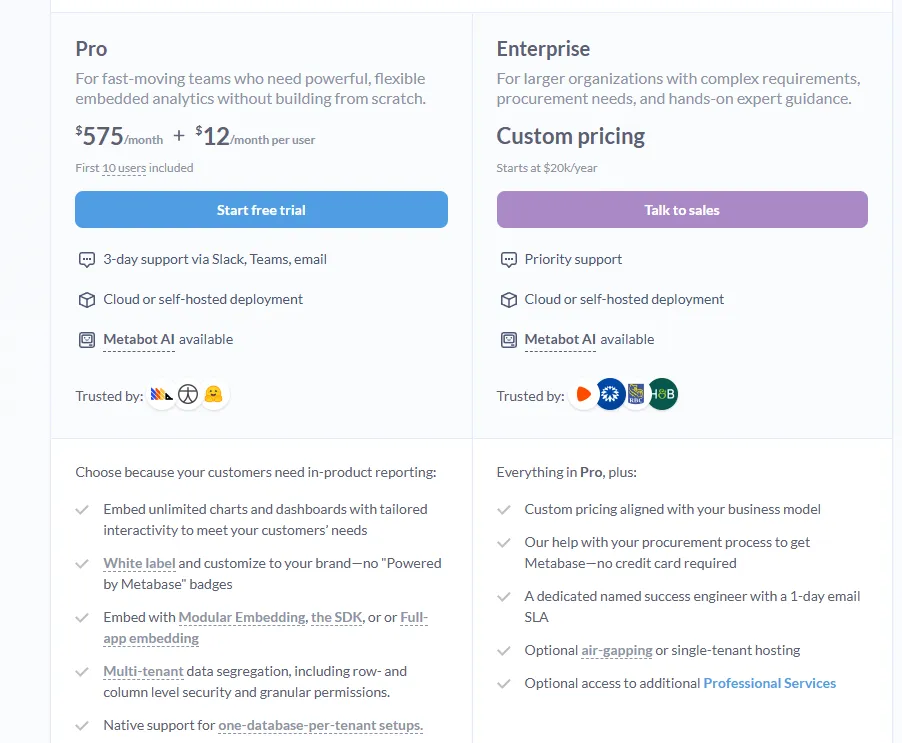
- Pro: $575/month + $12/user/month, first 10 users included, cloud or self-hosted deployment, includes everything in Starter, plus row- and column-level permissions, SSO and SCIM support, advanced caching and performance controls, staging + production environments, usage analytics and audit visibility, white-labeling, and embedded analytics capabilities.
- Enterprise: Custom pricing (starts at $20k/year), includes everything in Pro, plus priority support, dedicated success engineer (1-day email SLA), optional single-tenant or air-gapped deployment, and optional professional services.
- Embedded Analytics pricing:
- Pro: $575/month + $12/user/month, first 10 users included, includes unlimited embedded dashboards and charts, full white-labeling, modular embedding, SDK, or full-app embedding, multi-tenant security (row- and column-level), one-database-per-tenant support, staging + production environments, usage analytics, internal BI for your team, and option to include Metabot AI (charged extra).
- Enterprise: Custom pricing (starts at $20k/year), includes everything in Pro, plus a dedicated success engineer, priority support, optional single-tenant or air-gapped hosting, and optional professional services.
Metabase Pros and Cons
✅ Extremely intuitive for both technical and non-technical users.
✅ Cost-effective open-source option with solid community support.
✅ Strong embedding capabilities for customer-facing products, making it a popular choice alongside tools likeJulius AI for teams that want lightweight analytics.
❌ AI features are still basic compared to dedicated AI analytics platforms, which is why some teams have been looking forMetabase alternatives.
❌ Limited governance and semantic layer features.
#8: Domo
Best for: Mid-to-large teams that want an all-in-one BI platform combining data ingestion, dashboards, AI-driven insights, and workflow automation.
Similar to: Zoho Analytics, Qlik Sense.
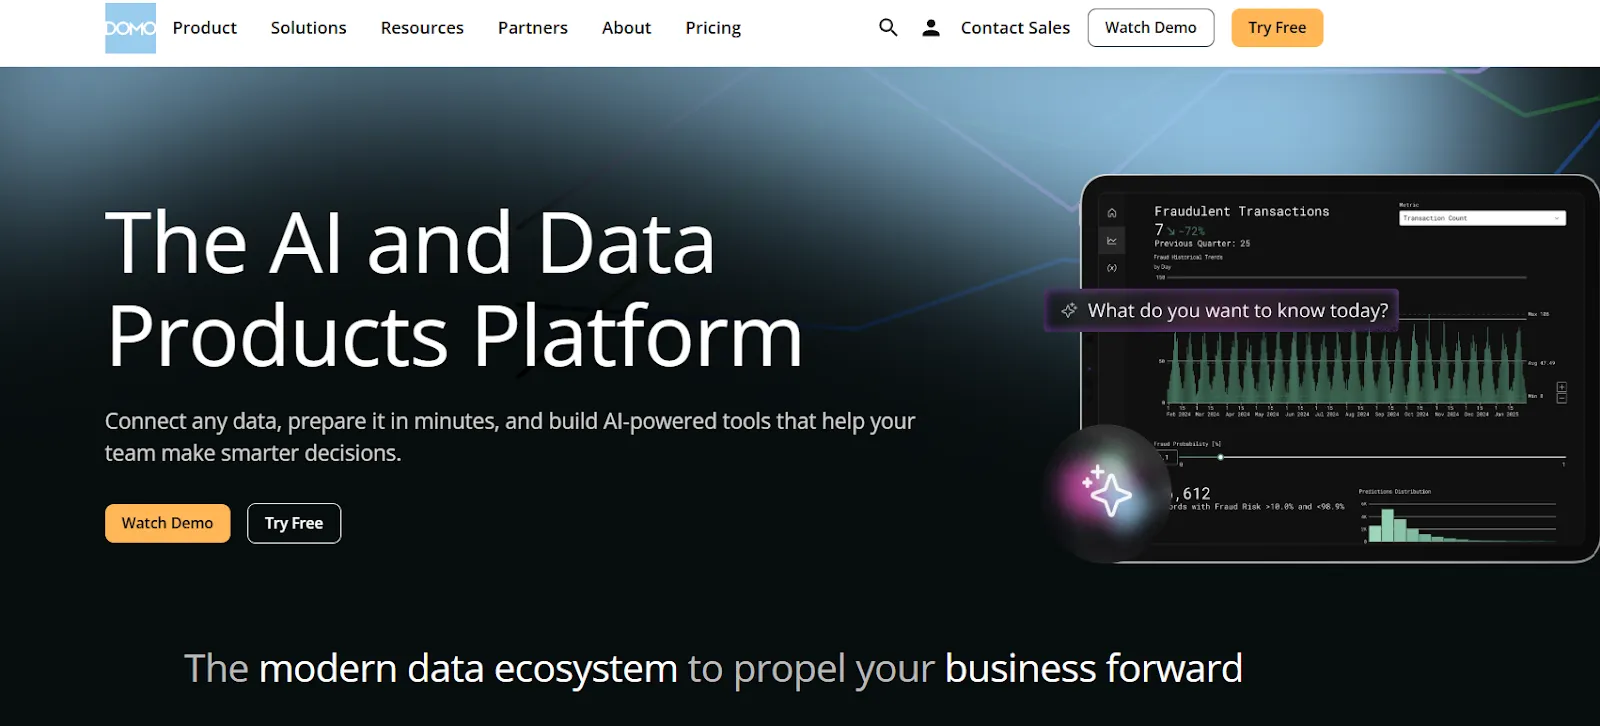
Domo is an end-to-end analytics platform that connects data from virtually any source and turns it into interactive, real-time dashboards.
The platform goes beyond reporting by combining automation and built-in AI to help teams act on insights directly from the platform.
Domo's Top Features
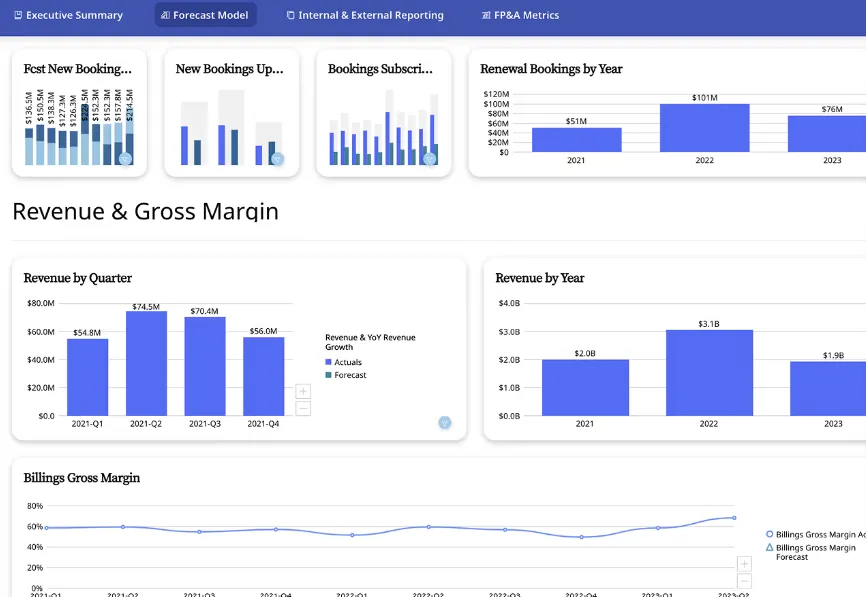
- Interactive dashboards and sharing: Build real-time, interactive dashboards that are easy to explore, share, and embed across teams or customer-facing apps.
- No-code analytics apps: Create custom, data-driven apps tailored to business workflows without writing code.
- AI-powered insights and chat: Ask questions in natural language, surface hidden trends, and use AI agents to automate decisions from dashboards.
Domo Pricing
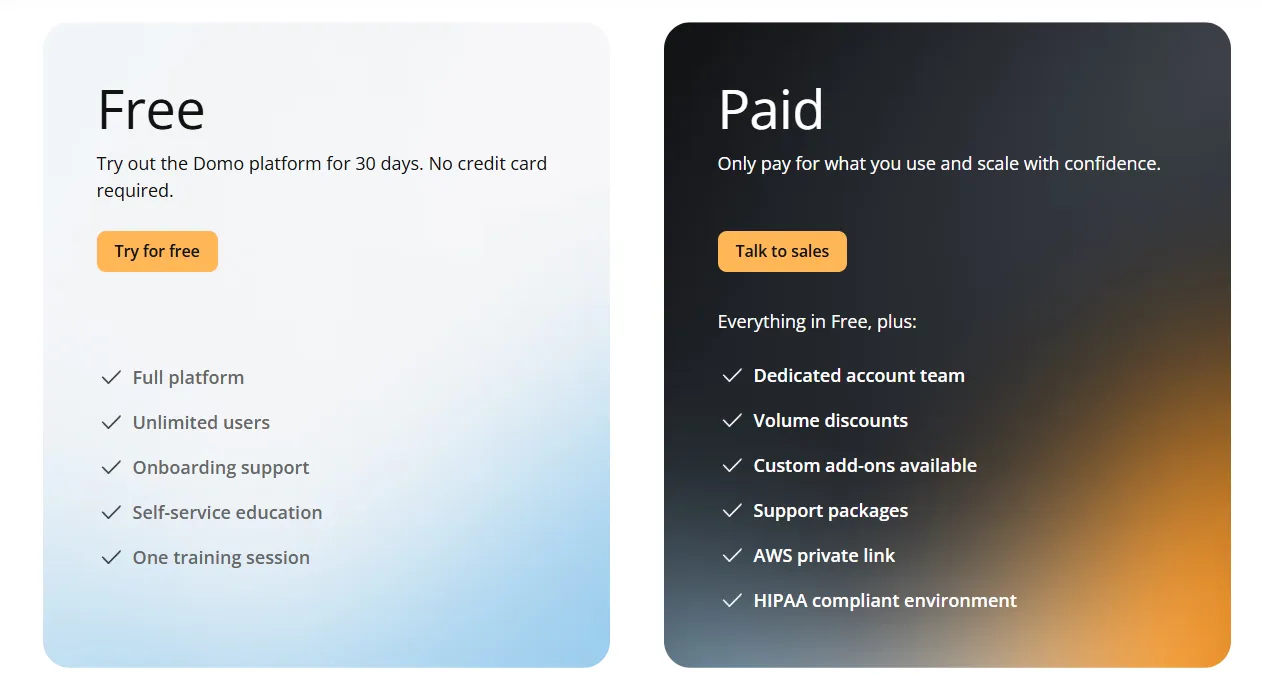
Domo offers one paid plan and a free trial.
The free trial gives you 30 days of full platform access with unlimited users, onboarding support, and one guided training session. No credit card required.
The paid tier is usage-based and includes a dedicated account team, volume discounts, custom add-ons, and support packages.
For pricing details, you'd need to contact their sales team.
Domo Pros and Cons
✅ Very easy to use for non-technical teams, with a clean interface.
✅ Strong connector library makes it simple to centralize data from many sources.
❌ AI features feel uneven and are sometimes pushed before they're fully useful in real workflows, which is why some teams have been looking forDomo alternatives.
❌ Opaque pricing.
#9: Zoho Analytics
Best for: Teams that want a powerful BI platform with AI features, lots of connectors, and good value for money, especially if they already use Zoho apps.
Similar to: Metabase, Domo.
Zoho Analytics is an AI-powered business intelligence platform built on the Zoho ecosystem that helps teams integrate data, prepare it, and turn it into interactive dashboards.
It balances self-service reporting with predictive AI and embedded BI at price points that undercut most competitors in this list.
Zoho Analytics' Top Features

- Ask Zia: Use natural language to analyze data, build reports, and get predictions and recommendations through Zoho's conversational AI agent.
- Data preparation and metrics layer: Clean, transform, and model data with 250+ no-code transformations while managing business metrics centrally.
- Flexible dashboards and embedded BI: Create interactive dashboards with 50+ visualizations and embed analytics into apps, portals, or customer-facing products.
Zoho Analytics Pricing
Zoho Analytics offers a free plan and four paid tiers:
- Free: $0, supports 2 users and up to 10,000 rows.
- Basic: $30/month, includes 2 users and 0.5M rows.
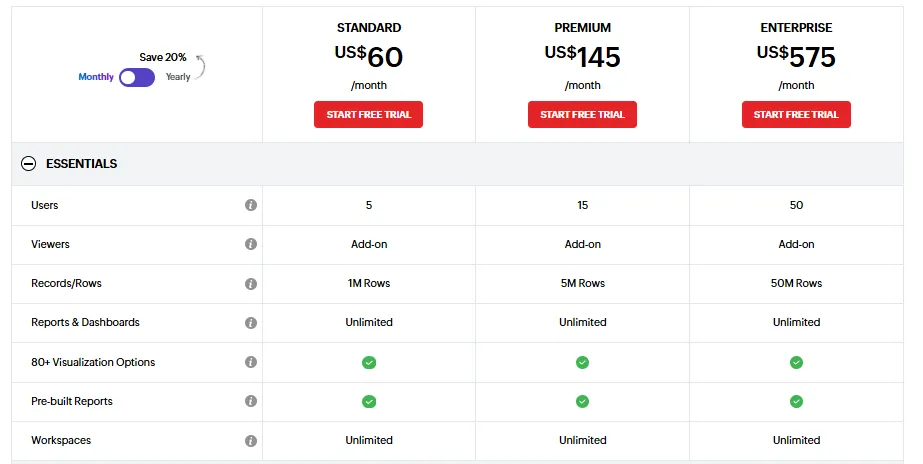
- Standard: $60/month, includes up to 5 users and 1M rows, unlimited workspaces, basic AI features.
- Premium: $145/month, includes up to 15 users and 5M rows, all AI features (except AI Studio).
- Enterprise: $575/month, includes up to 50 users and 50M rows, advanced governance, AI Studio.
Zoho Analytics Pros and Cons
✅ Great value for money, especially for small and mid-sized teams.
✅ Tight integration with Zoho apps makes setup fast if you're already in the ecosystem.
❌ Data syncing can lag, and exports (especially to Excel) feel clunky for presentation-ready reporting.
❌ Advanced features require higher-tier plans, which can make the jump from Standard to Enterprise feel steep.
#10: Supaboard
Best for: Business teams that want AI-powered dashboards and natural language analytics without requiring SQL or BI expertise.
Similar to: Dot, ThoughtSpot.
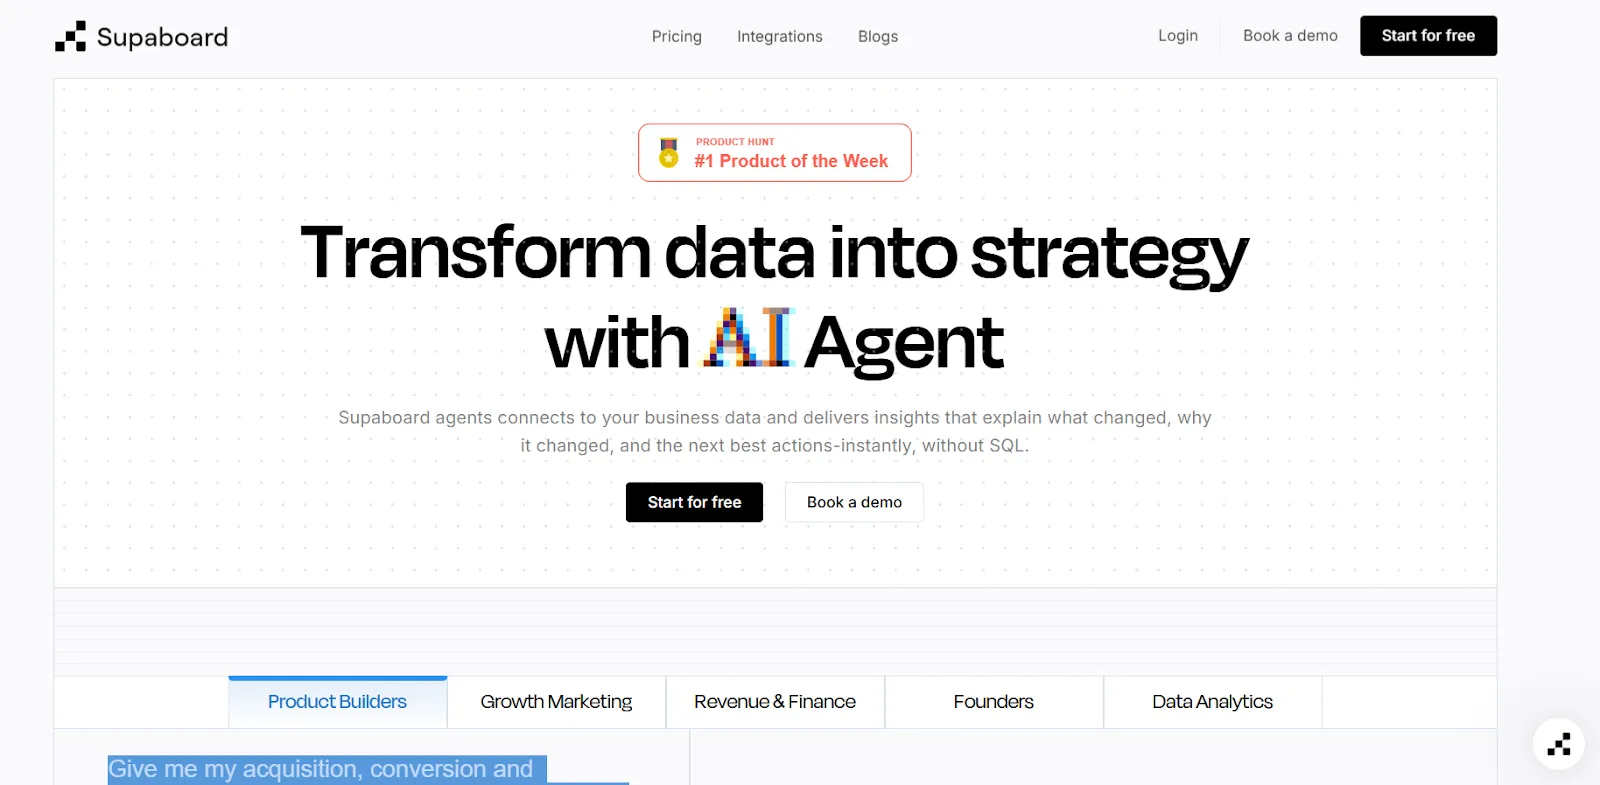
Supaboard is a newer entrant in the AI analytics space, having launched in February 2026 as the #1 Product of the Day on Product Hunt.
The platform connects to 600+ data sources and uses trainable AI agents to deliver instant insights tailored to your specific business definitions and rules.
Supaboard's Top Features
- Trainable AI agents: Create AI agents trained on your business logic, SLAs, and definitions to deliver context-aware insights without maintaining traditional data models.
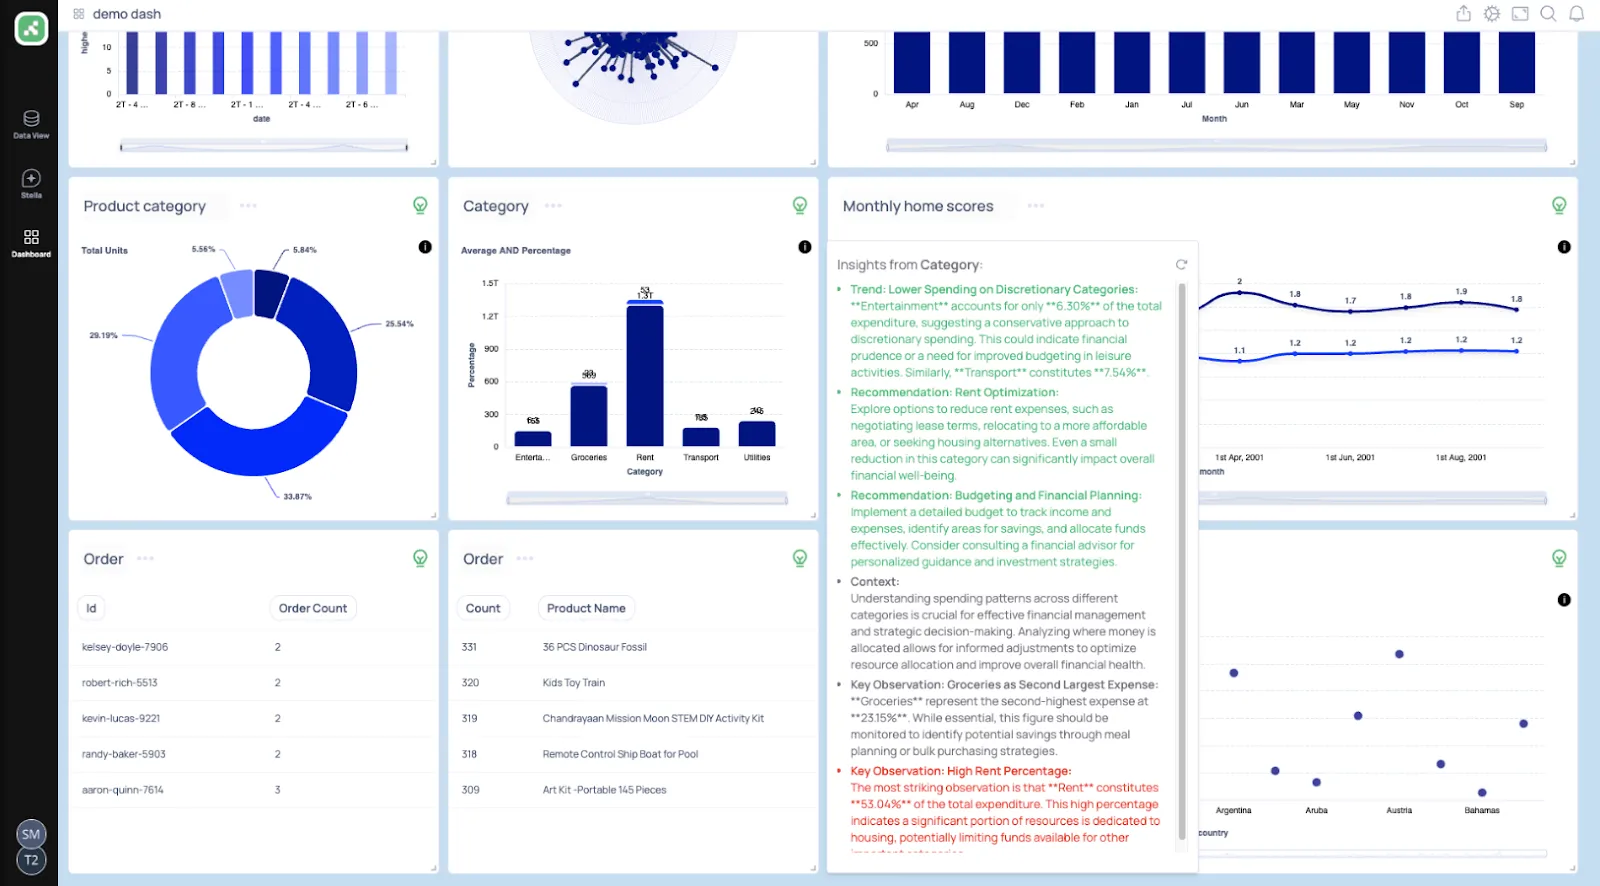
- Natural language data chat: Ask questions in plain English and instantly receive metrics, charts, explanations, and recommended actions.
- AI-generated real-time dashboards: Describe what you need and Supaboard builds interactive dashboards, KPIs, and tables that update live.
Supaboard Pricing
Supaboard offers three main tiers with a 14-day free trial on the first two:
- Individual: $85/month ($71/month billed annually), single user, default AI agent, unlimited dashboards, email support.
- Business: $229/month, multiple users, custom agents, Slack and team bot integration, dedicated support.
- Enterprise: Custom pricing, unlimited users and agents, white-labeling, dedicated account manager, bespoke onboarding.

Supaboard Pros and Cons
✅ Very easy to connect data sources and get started quickly.
✅ Natural language querying makes data accessible to non-technical users.
❌ Limited dashboard customization compared to established BI tools.
Make faster, more confident decisions with Dot
That's it from our list of the 10 best AI dashboard software tools for data teams and business leaders that can help you turn raw data into clear insights, automate recurring reports, and make faster decisions across your organization.
Dot helps you go beyond dashboards by answering business questions directly with narrative insights, automated executive-ready reports, and full audit trails on every analysis.
Our platform connects to your existing data warehouse, respects your current BI setup, and delivers insights where your team already works, in Slack, Teams, or email.
If your team is serious about getting answers in minutes instead of days, Dot is one of the most capable AI analytics platforms available today.
Here's what else you'll get by signing up for Dot:
- Ask any business question in plain English and get a full analysis with explanations and recommendations.
- Automated business review reports delivered on your schedule, daily, weekly, or monthly.
- Persistent business context that keeps metric definitions consistent across every team and query.
- A complete audit trail linking every insight to the underlying SQL, Python logic, and datasets.
- Direct integration with Snowflake, BigQuery, Redshift, Databricks, and semantic layers like dbt and Cube.
- Insights delivered in Slack, Microsoft Teams, email, or the web app, not locked inside dashboards.
➡️ Get started for free with Dot's Starter plan, or schedule a demo to see how it works with your data.
Theo Tortorici
Theo writes about AI-powered analytics, data tools, and the future of business intelligence at Dot.