
How To Use AI To Analyze Data: Step-By-Step Guide For 2026
This guide shows you how to run real analysis with AI in seven steps, without waiting on someone else for every number.
TL;DR
- Using AI to analyze data means asking a question in your own words and getting back the number, a chart, a short explanation, and the SQL that ran underneath.
- The options split into general-purpose AI chat with uploaded files, AI assistance inside notebooks and SQL editors, AI assistants built into BI platforms, and AI data analysts wired into your warehouse.
- The walkthrough below runs to seven steps using an AI data analyst called Dot (that’s us! A conversational analytics software), from a first connection through to automated delivery of the questions you repeat.
- Answer quality follows context quality, so the metric definitions your data team curates matter more than any prompt trick, and anything you act on should trace back to the query and rows behind it.
What are the main ways to use AI for data analysis?
Four approaches cover almost all AI-assisted analysis in 2026, and they differ mainly by how far your data has to travel and how much governance travels with it:
Approach | What it suits | Where it runs out |
General-purpose AI chat with uploaded files | One-off exploration of a file already on your laptop | No live link to source systems, so tomorrow's answer needs another upload |
AI assistance in notebooks and SQL editors | Analysts who write code and want a faster first draft | Assumes you can read the output closely enough to catch a wrong join |
AI assistants built into BI platforms | Questions that stay close to dashboards your team has already built | Scope follows the dashboard, and genuinely new questions still reach the data team |
AI data analysts connected to your warehouse | Business questions across the whole data model, governed by definitions your data team owns | Needs curated context before the answers can be trusted |
Knowing how to use AI to analyze data has turned into a working skill this year, much like spreadsheet fluency a decade ago.
Without it, the same frustrations repeat weekly:
- A one-line question becomes a ticket, and the answer lands after the decision was made.
- Two teams bring different revenue totals to the same review, because each pulled a separate export.
- Analysts spend the week rewriting a query they have already written a dozen times.
- Someone drops a customer export into a public chatbot, because it was the quickest option in reach.
- Reports get read and quietly ignored, since nobody can see how the numbers were calculated.
This guide walks through the full workflow with Dot, our decision intelligence software, then compares the four approaches so you can tell which fits the work in front of you.
How to use AI to analyze data in 2026?
Analyzing data with AI works best when you connect an AI data analyst to your warehouse, give it your business definitions, and ask questions the way you would ask a colleague.
An AI data analyst reads your warehouse or semantic layer where the data already is, converts a question into governed SQL, and hands back a chart with a written answer.
Governance is what separates the category from a chatbot pointed at a database.
One agreed definition per metric, maintained by your data team, applies no matter who does the asking.
Dot is one of these, and four things about it shape the steps below:
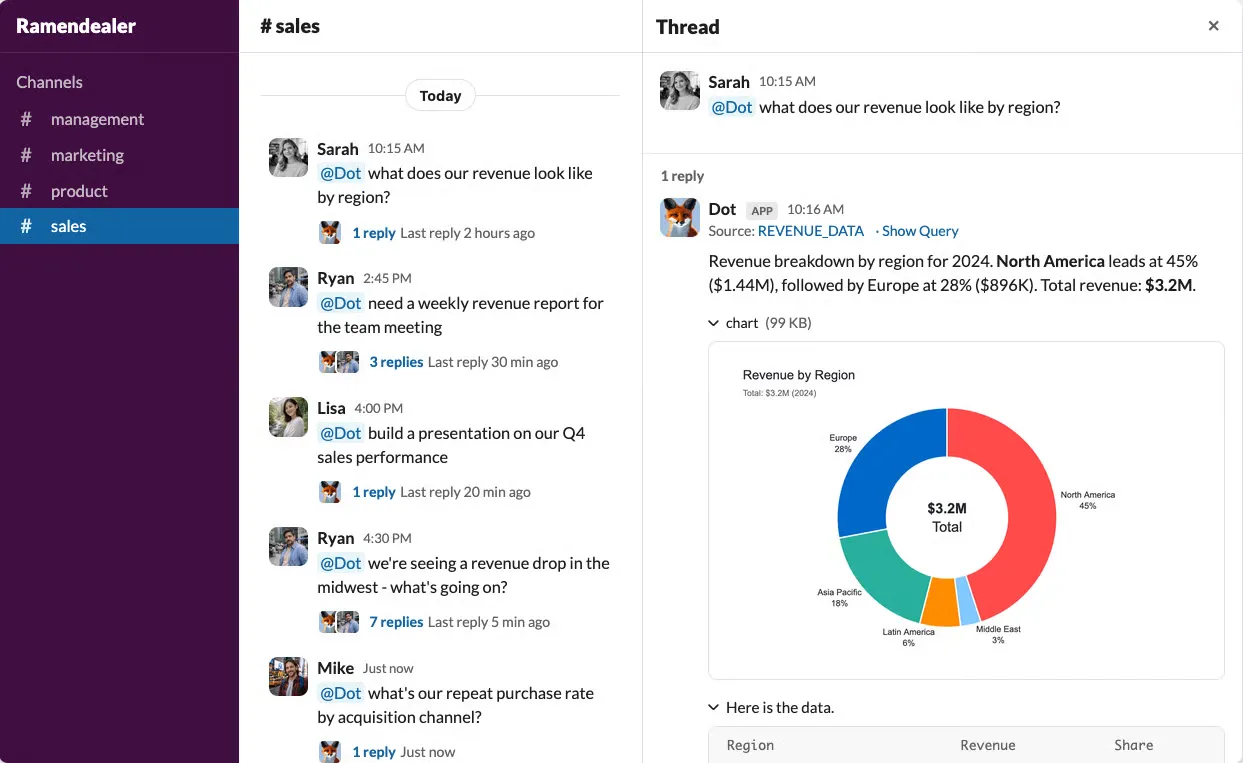
- Dot takes questions around the clock, in Microsoft Teams and Slack as much as in email or its own web app.
- Answers come with the query that generated them, leaving the work open to inspection.
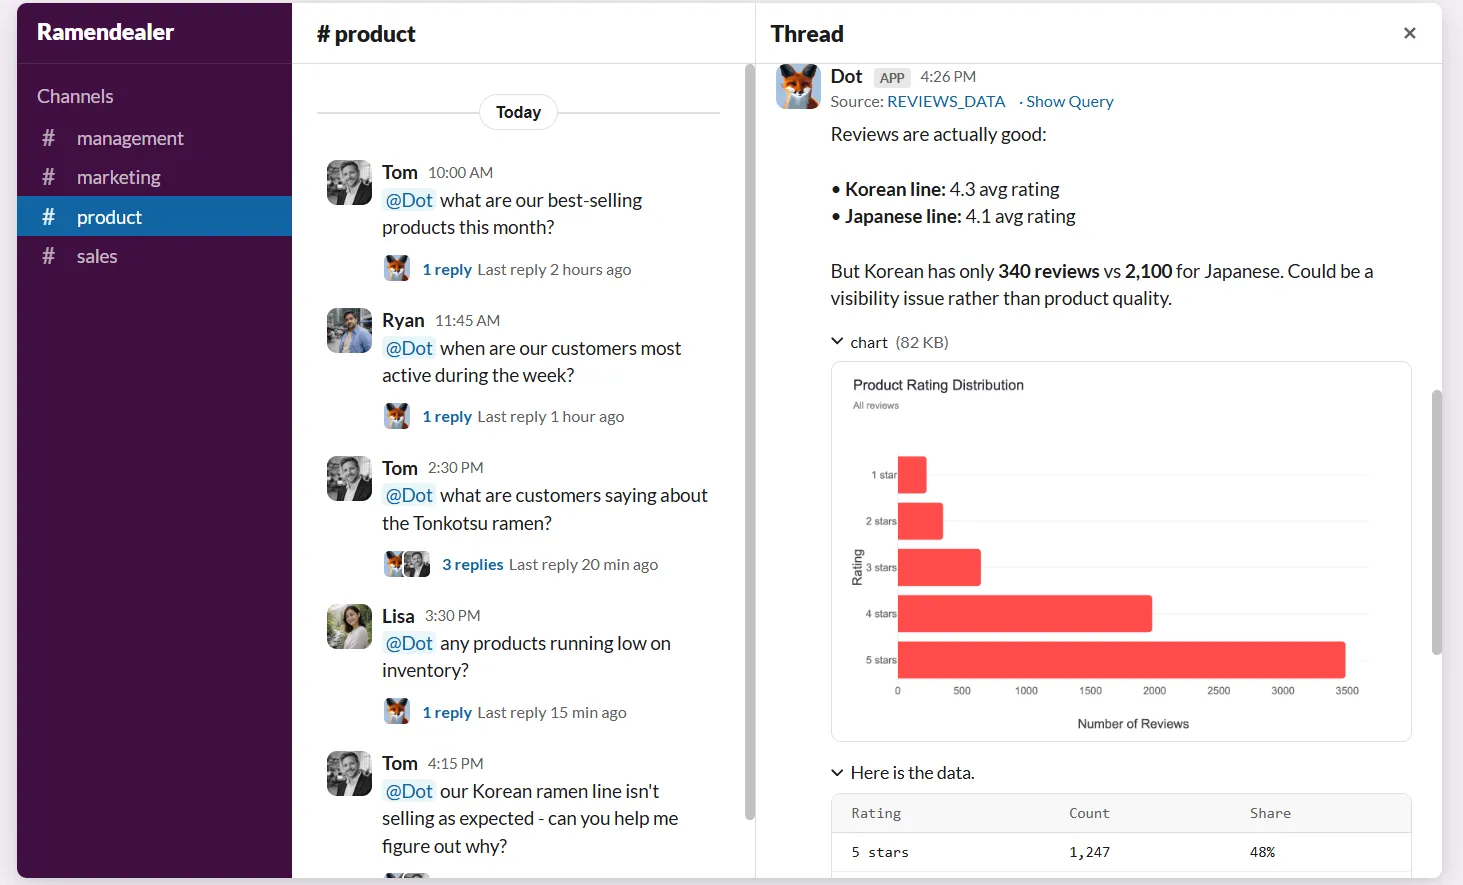
- Dot investigates multi-step "why" questions on its own and returns a structured report.
- Dot works from a knowledge base under version control, with your data team approving each change.
Here's how to analyze data with AI in seven steps 👇
Step 1: Connect your data and hand Dot your business context
This step gives Dot read access to your data and teaches it what your metrics mean.
Every later answer depends on both. Connections are set up under Settings.
Use credentials from an account with read permissions and nothing more.
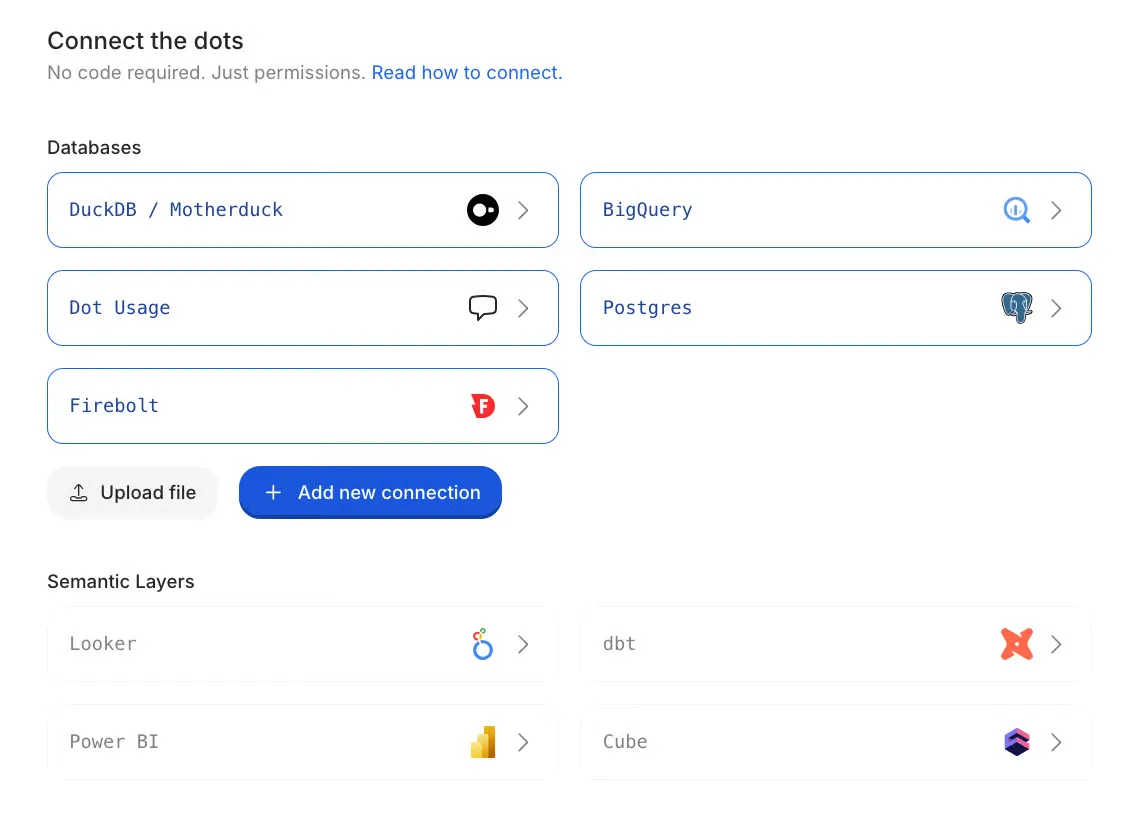
Warehouse coverage includes Snowflake, BigQuery, Databricks, Redshift, and Postgres.
Semantic layers connect too, whether your definitions are maintained in dbt, Looker, or Power BI, and your existing modelling work carries straight over.
Once the first sync finishes, Dot has your schemas and columns but not what any of it means to your business.
Root, Dot's Context Agent, supplies that meaning.
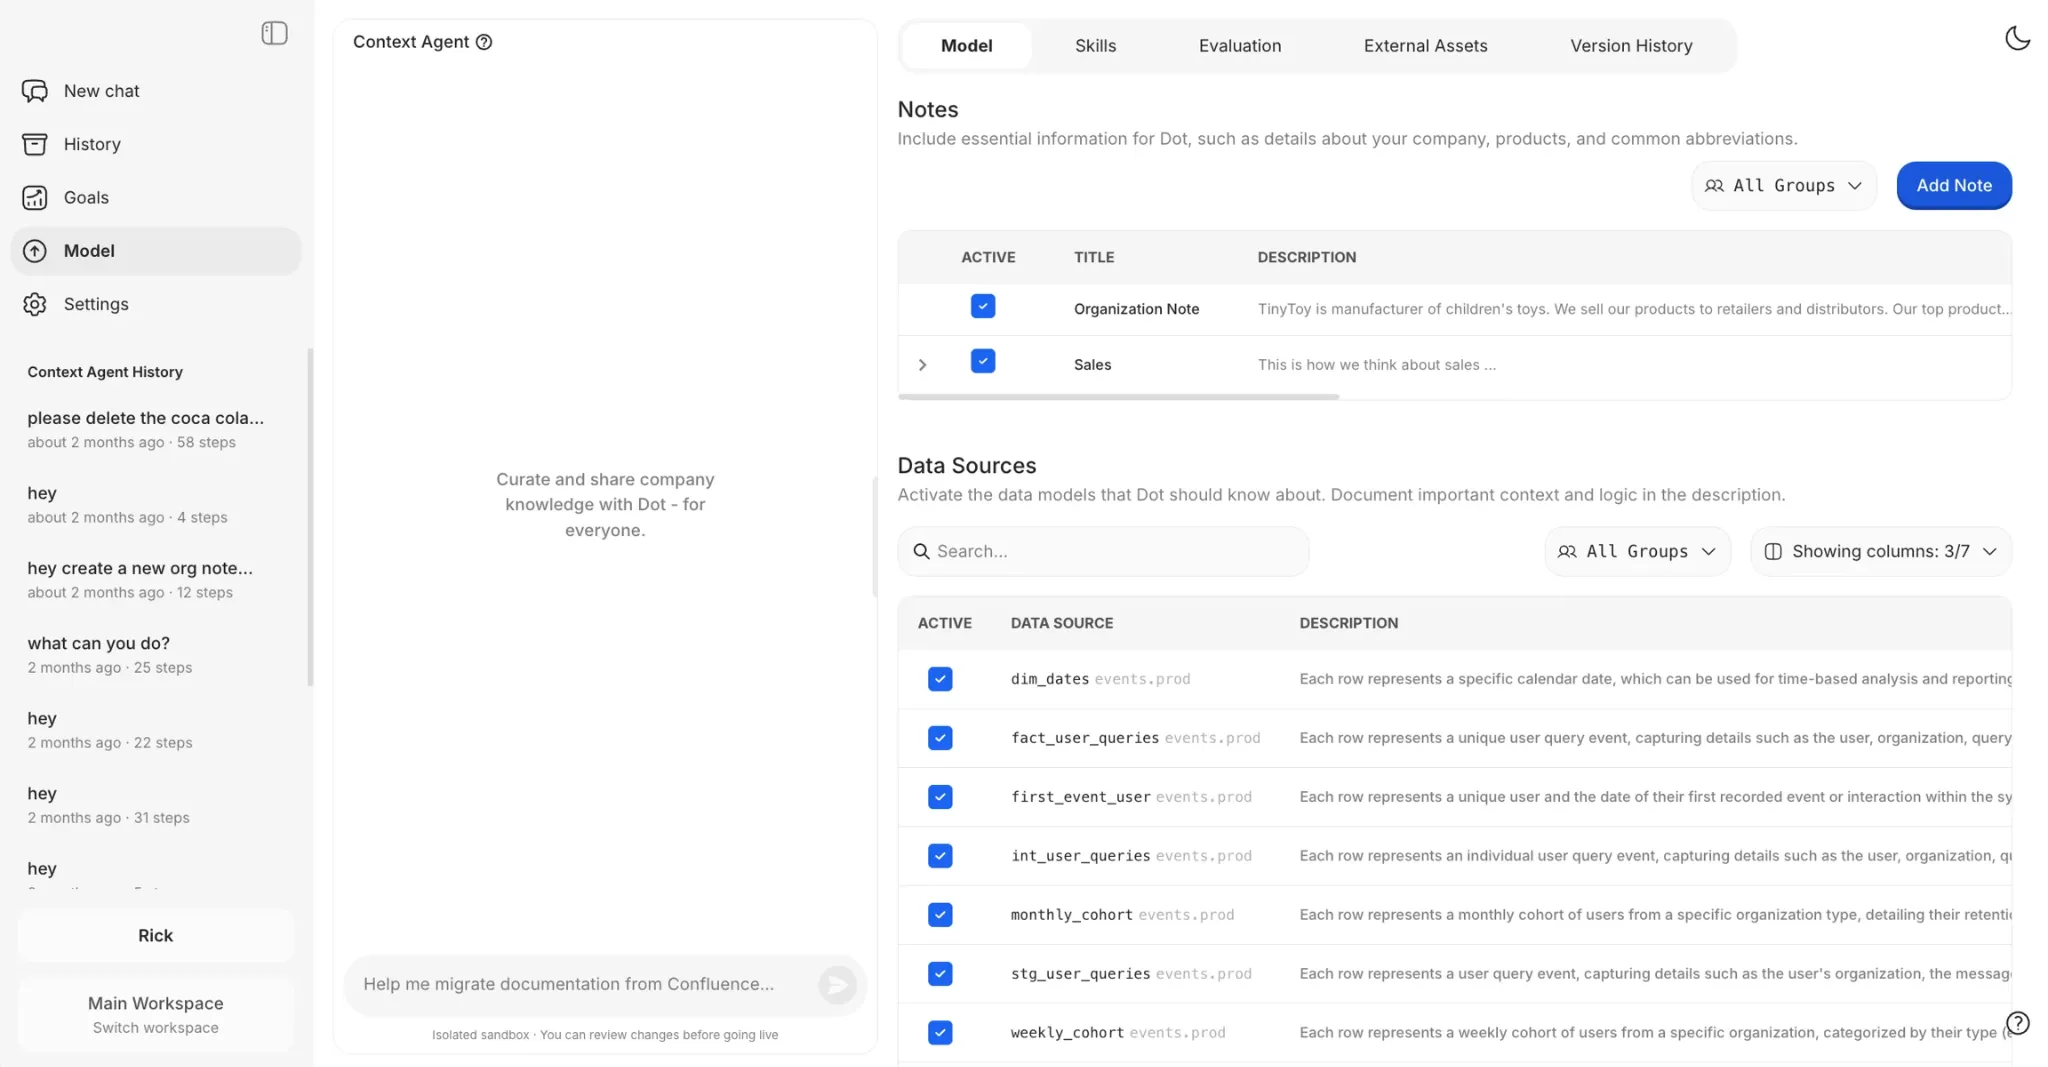
Launch Root from the sidebar and describe the use case you want to start with.
Root interviews you about the metrics involved, then drafts documentation you review ahead of anything going live.
Root can also read the dashboards your company already relies on and turn the calculations inside them into a metric glossary, the kind of documentation teams otherwise write by hand over months.
💡 Note: Nothing gets migrated here. Dot queries your warehouse in place, and your data stays where it is.
Our guide on setting up self-service analytics covers the configuration side in more depth.
Step 2: Ask the question the way an analyst would frame it
A well-specified question is the biggest lever you have over answer quality, because vague inputs are what produce vague results.
Dot is good at working out intent. A precise question still gets you a sharper answer.
Name as many of these as you can:
- The metric you mean, such as gross revenue, active buyers, churn rate, or pipeline coverage.
- The entity you're asking about, whether that's customers, suppliers, campaigns, or products.
- The time frame, like last month or the year to date.
- The grain and any cuts, such as by week, by region, by channel, or Enterprise accounts only.
- The unit, when currency or weight could be read more than one way.
"How are sales doing?" names a metric and leaves the other four open, so expect a woollier answer for it.
"What was Enterprise revenue by month for the first half of 2026, in euros?" gives Dot everything it needs.
When you're unsure what's even available, ask Dot for help phrasing the question.
Dot knows your data model and will suggest a direction.
Step 3: Read the answer with its query open beside it
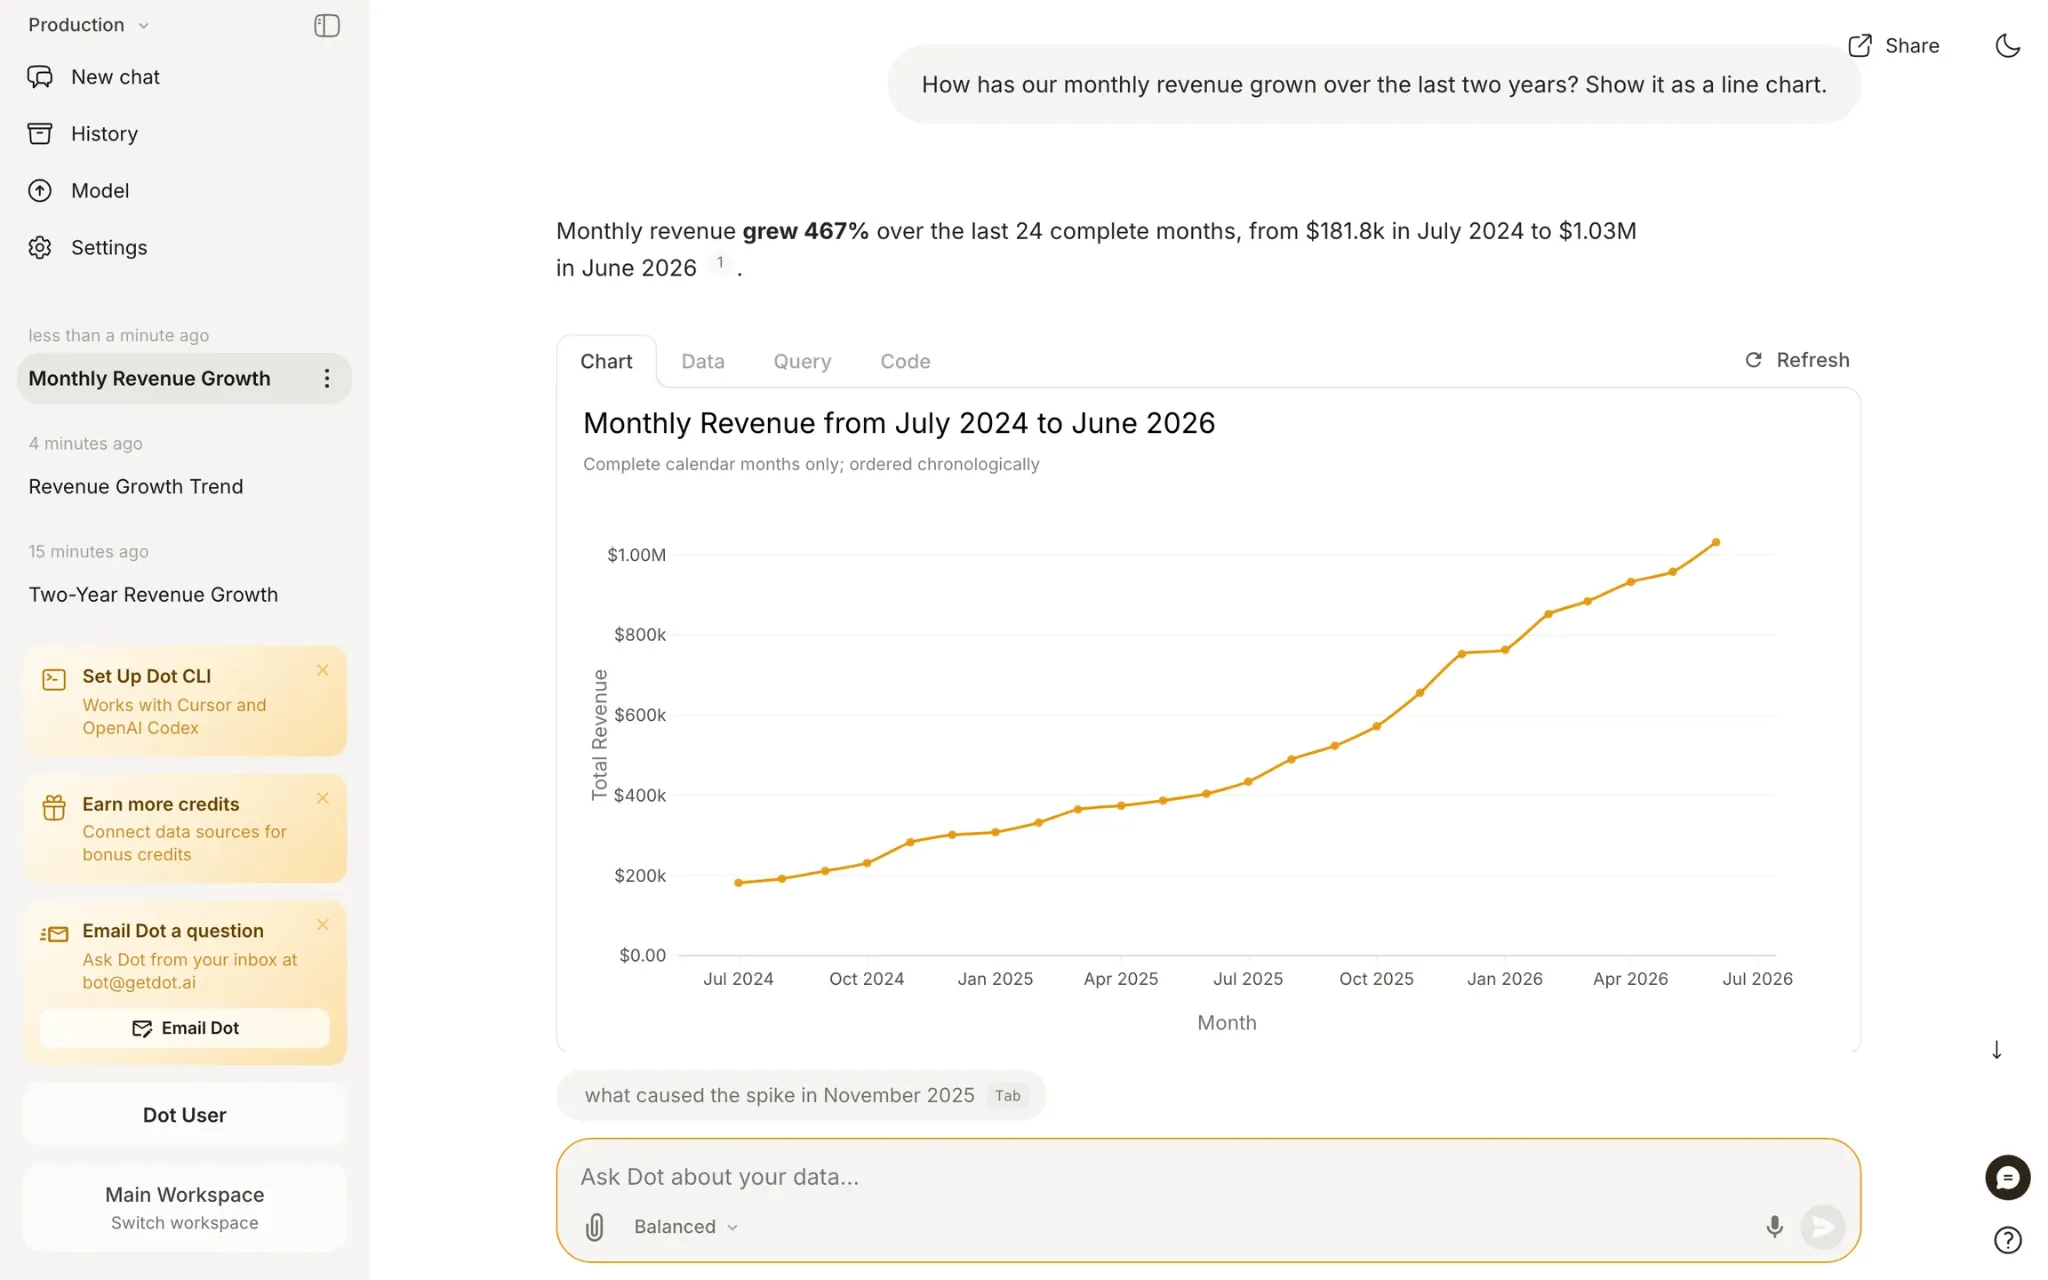
Dot grounds its answers in your connected data and exposes the query underneath, which turns verification into a few seconds of clicking with no SQL required from you.
Each answer arrives with Chart, Data, Query, and Code views plus a Source pill, and clicking through any of those shows the exact SQL and the rows it ran against.
Inside a longer report, individual statements link back to the data supporting them, letting a colleague verify one finding without re-running the whole analysis.
For multi-step work, open Full logs to read every query Dot ran on the way to its conclusion.
For people who don't write SQL, two habits make this quick: compare the result against a figure you already know by heart, then share the answer link with an analyst whenever it will drive a real decision.
💡 Pro tip: When an answer looks off, say "try again". Dot runs on frontier models and is statistical by nature, and a second pass often finds a better route through your data.
Step 4: Push the question from what happened to why it happened
Dot handles "why" questions autonomously, running a series of queries, testing explanations, ruling out dead ends, and assembling what survives into a structured report.
There's no mode to select first.
A quick lookup and a full investigation both start as a question, with Dot working out how much digging each one deserves.
Ask something like "Why did self-serve conversion drop in Q2 against Q1, and what's driving it?"
What comes back reads like an analyst's write-up, opening on one quantified finding, then key findings, the charts that support them, and recommended next steps.
What you do control is effort, through a dial called energy modes:
- Economy suits everyday lookups and keeps spending down.
- Balanced is the default and adds depth where a question needs it.
- Frontier is there for the questions you would otherwise hand to your most experienced analyst.
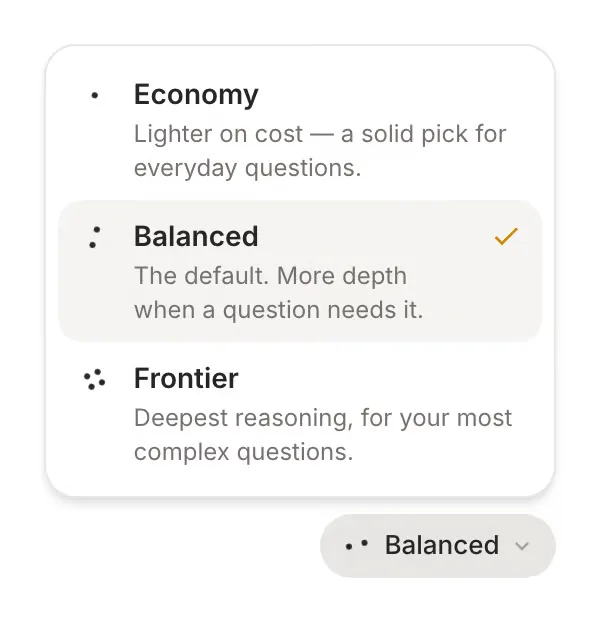
Outside the web app, start your message with !e for Economy or !f for Frontier.
Adding "go deep" or "ultrathink" to a question runs that single answer in Frontier while the rest of the conversation stays where it was.
Step 5: Keep the thread going, one follow-up at a time
Dot holds context across a conversation, so each follow-up builds on the previous answer, and you refine your way toward what you actually wanted to know.
A real thread tends to look like this:
- "Narrow that to EMEA."
- "Which ten customers moved the number most?"
- "Put last year beside it."
- "Now run the same cut for Enterprise accounts."
Files can be attached to the conversation too. That's how a budget target or a partner's CSV gets analyzed next to warehouse data.
Step 6: Turn the answer into something your team can open later
A chat answer captures a single moment.
Dot can turn that analysis into a live data app that re-queries your data whenever someone opens it.
Ask Dot to "build an executive overview dashboard" or "turn this into a board deck".
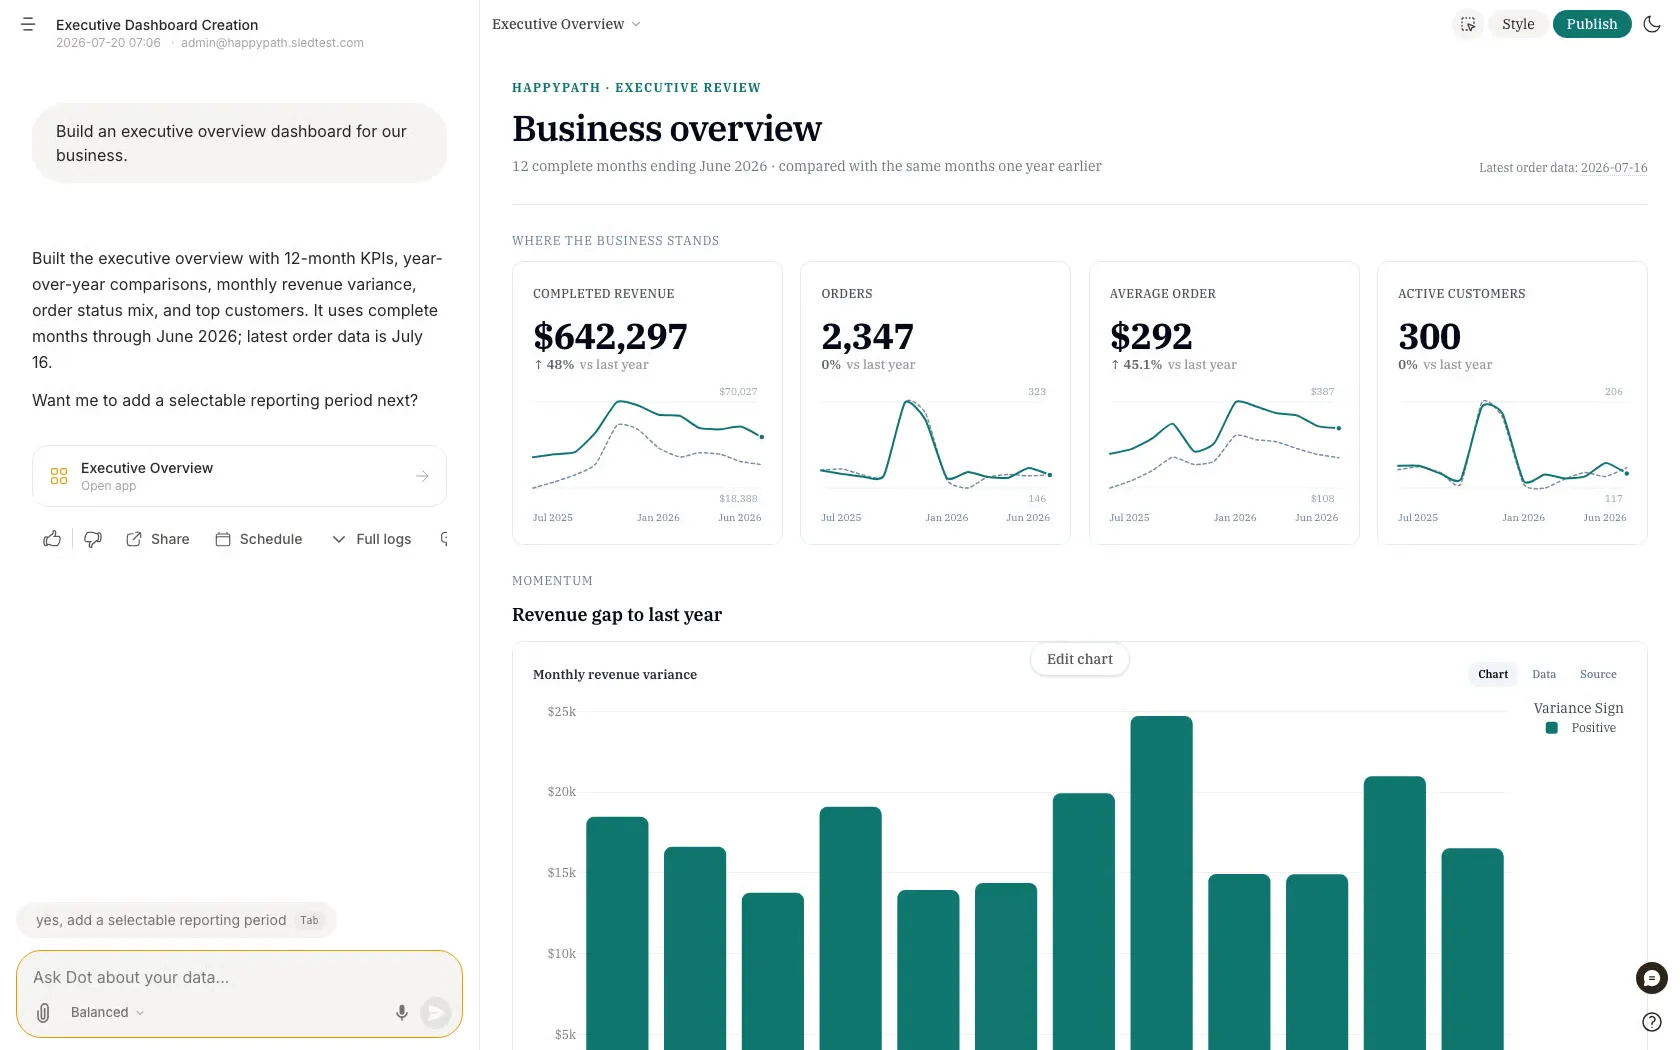
Dot compiles your questions into real SQL, dry-runs them, then shows a preview you can publish.
Apps come in a few shapes: filterable dashboards, written reports where every number is cited, live presentations for a board review, and scrolling data essays.
Refine them by talking.
"Add a region filter" or "change the theme" rebuilds the app and previews it again.
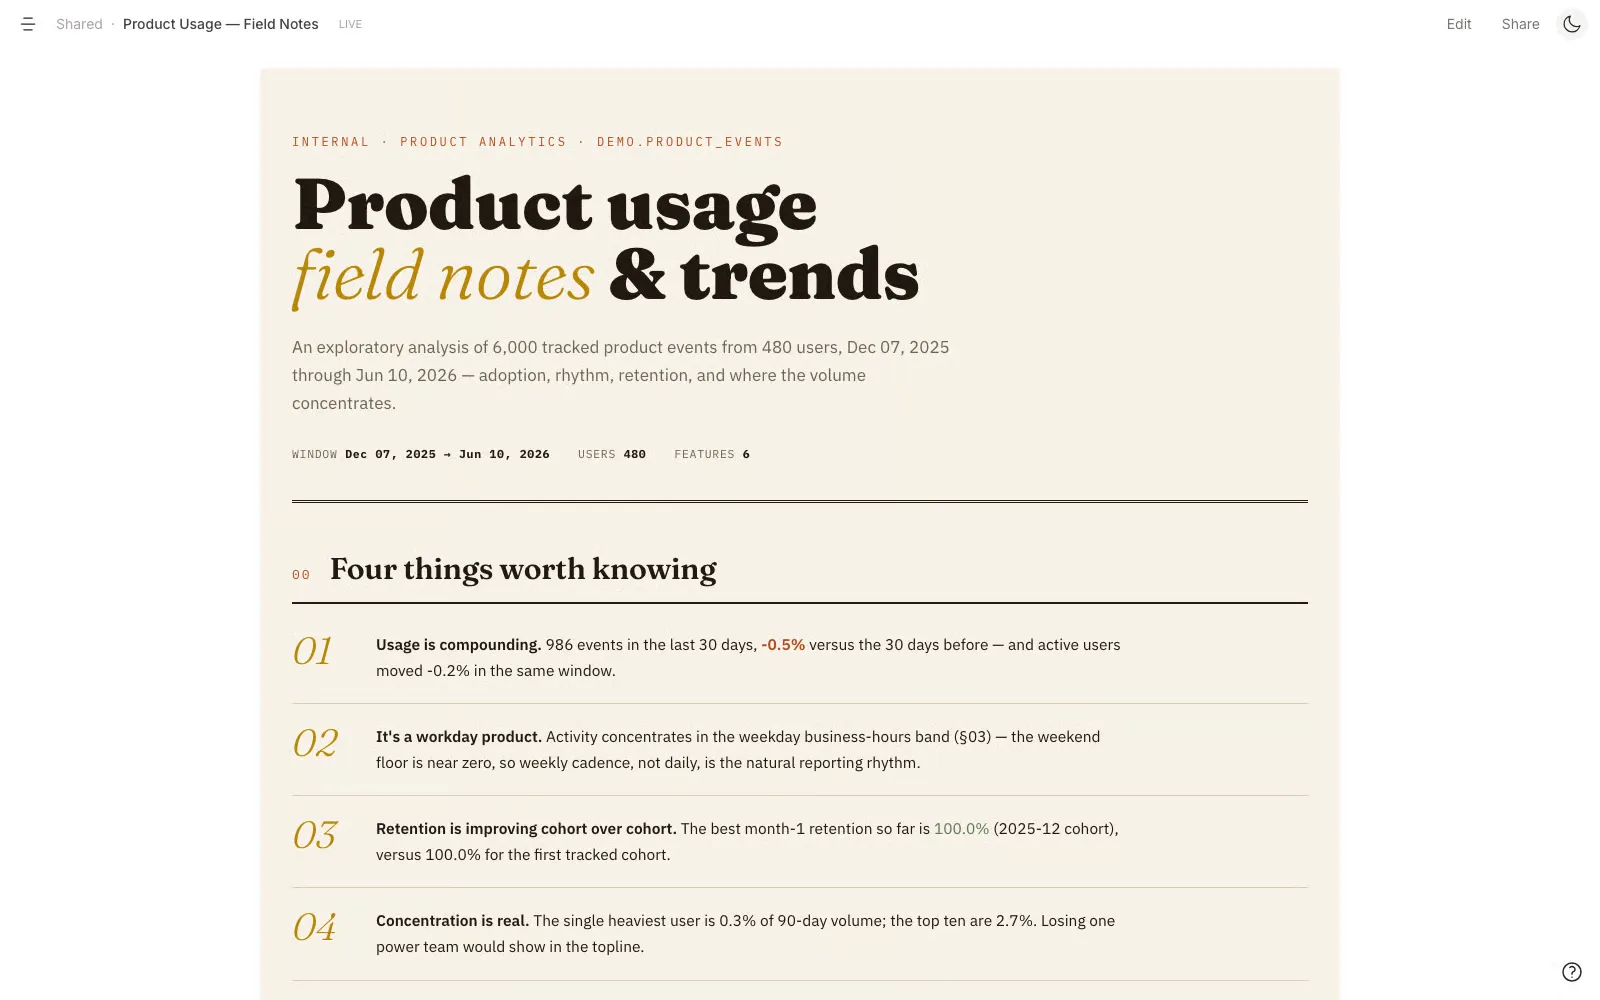
Once published, you can send a private link you're able to revoke later, embed the app in your wiki, export a board-ready PDF, or run it full-screen as a presentation.
💡 Note: No AI runs in the render path. Each view re-executes the pinned SQL against live data, which keeps apps fast and deterministic while the text and the queries stay editable in everyday language.
(Optional) Step 7: Schedule the questions you keep asking
When someone rebuilds the same analysis before every Monday meeting, a schedule takes that work off their plate.
To set one up:
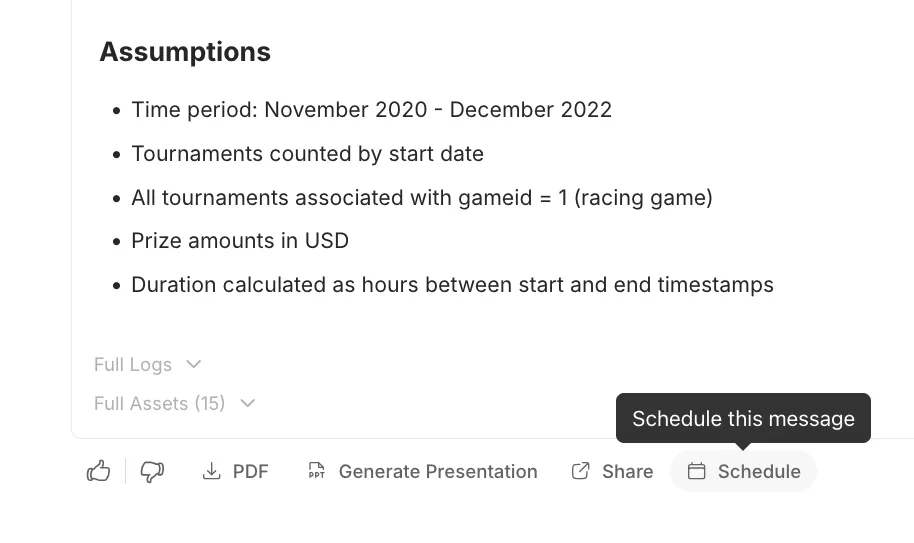
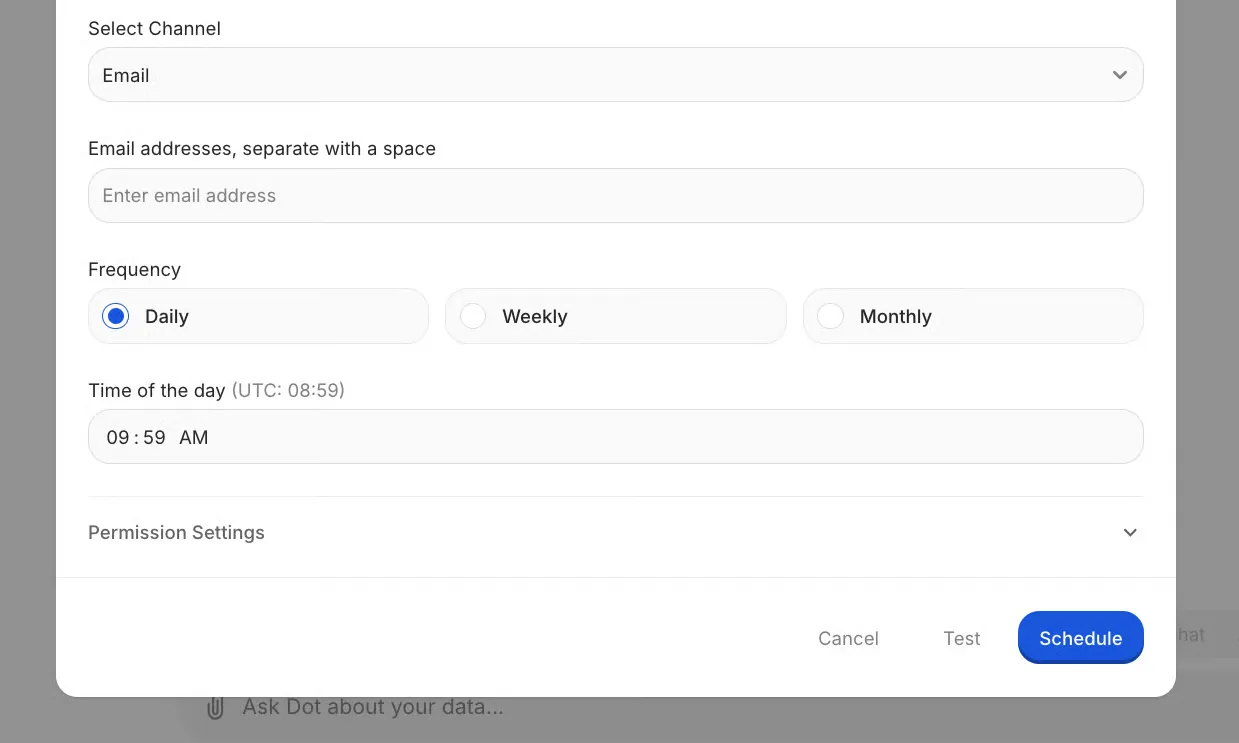
- Run the analysis you want repeated.
- Hit Schedule on that response.
- Pick your delivery channel and add recipients.
- Set the frequency, from daily up to monthly, then send a test before confirming.
Scheduled reports can be gated in two places.
A work gate queries your database before the agent starts, and a negative result cancels the run without consuming credits.
A result gate acts at the other end.
The analysis runs in full, while delivery waits on a condition you wrote in everyday language, like monthly revenue falling more than 5%.
Each run that goes ahead costs 1 Agent Compute Credit, with a ceiling of two per day.
And there you have it, AI-powered analysis running end to end, from your first question to a report that arrives before anyone thinks to ask for it.
Which AI approach fits which kind of work?
Each of the four approaches solves a genuine problem.
What separates them is how far an answer can travel before a human has to check it by hand.
1. General-purpose AI chat with uploaded files
You export a CSV, upload it to a general-purpose AI assistant, and ask questions about the file.
Nothing beats this for speed on a first pass, with no configuration to do and no waiting on anyone.
The limits appear once the work repeats.
Your file is a snapshot, so tomorrow's answer needs tomorrow's export, and the assistant won't know your company excludes internal accounts from revenue unless you say so every time.
Customer data leaving your systems is also a conversation your security team will want first.
2. AI assistance inside notebooks and SQL editors
Here the AI drafts Python or SQL for an analyst, who then runs the code and iterates on it.
For anyone comfortable in a notebook, this is a genuine accelerant: boilerplate appears in seconds and the analyst keeps full control of the logic.
It only works, though, for people who can already spot a wrong join or a silently duplicated row.
Which leaves the marketing manager with a Tuesday question exactly where she started, queued behind everybody else's Tuesday questions.
3. AI assistants built into BI platforms
Most BI platforms now ship an assistant that answers questions about the dashboards and models held inside that platform.
As your team already opens the tool every morning, a question about a metric on screen gets answered on the spot.
These assistants generally stop at the edge of the prepared model.
They perform well against pre-built structures, while a question that needs a table nobody has modelled yet still turns into a request for the data team.
What they can reach depends on what's been modelled, so warehouse tables outside that model can be out of scope.
4. AI data analysts connected to your warehouse
An AI data analyst connects straight to the warehouse, works from context your data team curates, and answers inside the apps your colleagues already have open.
Because the connection is live and the definitions are shared, the same question asked twice should return the same number, and a mismatch points at context you can fix at the source.
The cost shows up before the benefit does.
This approach needs curated context before it becomes dependable, and that curation is work your data team owns.
What comes back is compounding value, because every table you document and every correction you merge improves each answer that follows.
How do you get more out of AI data analysis?
Teams that keep getting value from AI analysis treat the setup as something they tend weekly, and four habits mark them out.
1. Match the depth to the question
Most questions don't call for your deepest reasoning mode, and spending that budget deliberately is what keeps AI analysis affordable as usage grows.
Set the economical energy mode as your workspace default and escalate on purpose.
Admins can also cap Agent Compute Credits per user or per group.
A budget has a useful side effect here, pushing people to spend it on the questions they care most about.
Usage follows a power law, where a small group accounts for most of the consumption.
Talk to those few directly and skip the company-wide email about credit discipline.
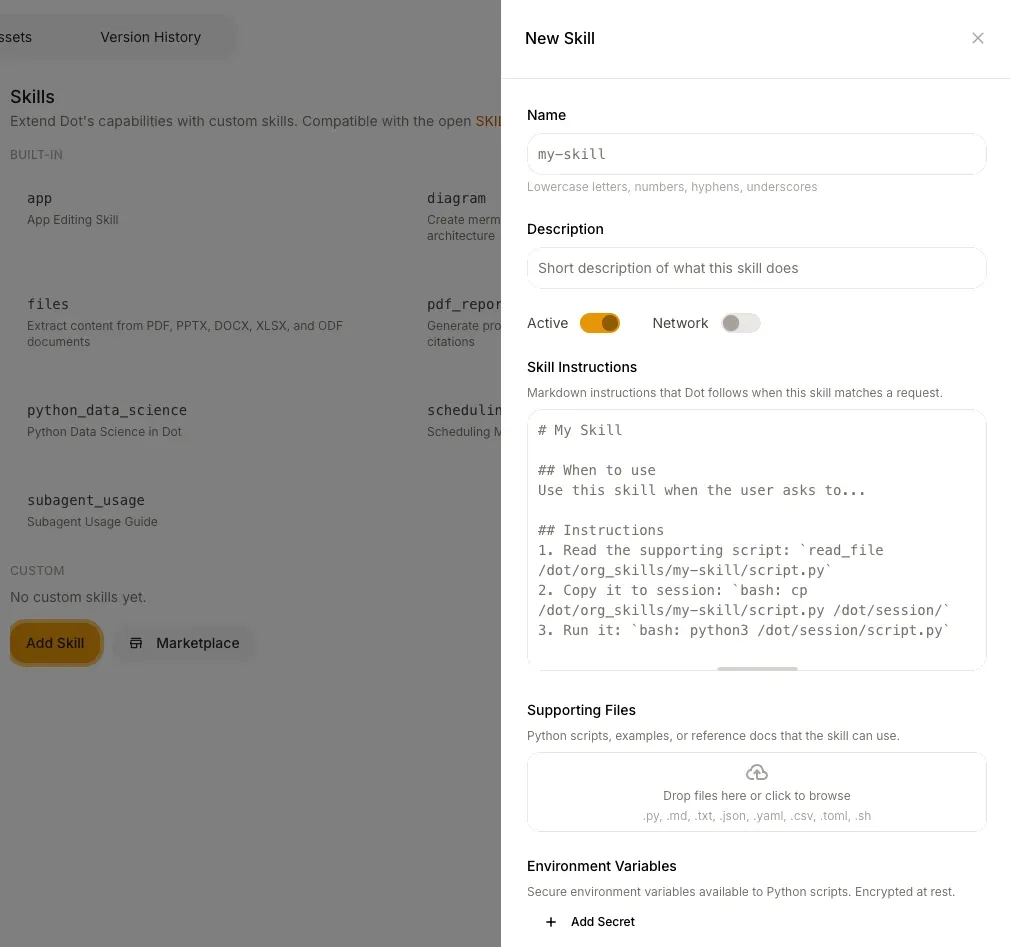
💡 Pro tip: You can also teach Dot new skills (detailed instructions that Dot follows when this skill matches a request).
2. Correct the system the moment it gets something wrong
Fixing context at the source is the fastest way to improve AI analysis.
Dot puts that in the hands of whoever spotted the problem.
Someone notices that a table was renamed or that a metric definition is wrong, and tells Dot to remember it.
Dot drafts a proposal, an admin reviews the diff (or a modeler you've given that permission), and a single click merges it for everyone.
Dot also reviews each conversation in the background and labels it on the History page.
The Issue label catches a complaint, a query error, a repeated question, or an empty result where data was expected.
The Abandoned label catches a clarifying question nobody came back to answer, which is the signal most teams overlook.
Work both filters weekly, opening the disappointing chats and asking Root to investigate.
💡 Pro tip: A wrong answer paired with the correct query is the most useful thing you can hand your data team. It converts a vague complaint into a work item somebody can close.
3. Put the analysis where your colleagues already work
Adoption follows convenience, and AI analysis performs best when it reaches people in the apps they check all day.
Install the Dot app for Microsoft Teams or Slack, then invite it into the channels where people already ask each other for numbers.
Teams working from separate data get their own workspace, with channels routed accordingly.
Beyond chat, Dot offers an API, a CLI, an MCP server, and an embeddable iframe you can drop into your own product with your colors and suggested prompts.
💡 Emerge saved over 2,000 hours a year with Dot and reached roughly 10x ROI, with team members asking questions in Slack and getting answers back in seconds.
4. Benchmark the answers against numbers you already trust
An evaluation checks Dot's answers against figures your business has already agreed on, turning a question of trust into something you can measure.
Under Model, open Evaluation and click New evaluation.
Pair a handful of questions with trusted answers taken from a reviewed dashboard.
Numeric tolerance defaults to 3%.
You can set it to zero for an exact match.
Every failure links to the conversation behind it, letting you see what Dot did and repair the missing context.
Evaluations save as files in the model repository, and you can export the questions to run in CI.
Metric accuracy then gets treated like any other failing test.
Start analyzing data with AI using Dot
Hopefully this gave you a usable path from a first question to a workflow your whole company can share.
Dot's free tier includes 300 credits up front along with the full Pro feature set, enough to wire up a source and put real questions through the seven steps above.
If you'd rather see it working on your own data first, book a demo and bring the question your team has been stuck on.
Theo Tortorici
Theo writes about AI-powered analytics, data tools, and the future of business intelligence at Dot.