
10 Best Marketing Analytics Tools In 2026
Below are the 10 best marketing analytics tools in 2026, covering what each one actually measures and the figure you would be quoted for it.
TL;DR
- Dot is the best marketing analytics tool in 2026 for marketing teams whose campaign data is already in a warehouse but who lack the SQL skills to analyse it. Our decision intelligence software answers campaign questions in writing wherever they get asked, and shows the SQL and models under every number. Pricing runs on analysis volume, with no per-seat charge.
- Google Analytics 4 and Matomo are the two web analytics options with a genuine free tier. One runs on Google's infrastructure and defaults to data-driven attribution; the other runs on servers you control in Europe.
- Adobe Analytics measures behaviour at enterprise scale across many properties, while Amplitude and Mixpanel both bill on event volume and carry unlimited seats at every tier.
- HubSpot Marketing Hub and Dreamdata both answer the revenue question: HubSpot works from inside the CRM that already holds your contacts, while Dreamdata resolves anonymous accounts and models attribution across a whole buying committee.
- Data Studio, which Google renamed from Looker Studio, and Supermetrics form the reporting and collection layer, and a surprising number of teams discover they were missing that layer all along.
What are the best marketing analytics tools in 2026?
The best marketing analytics tool in 2026 is Dot, an AI data analyst that investigates campaign questions and writes up the answer in Slack, Microsoft Teams, email, or its web app.
Google Analytics 4 is the strongest free option for web measurement, and Dreamdata is the pick for B2B revenue attribution.
Here are the 10 tools I’ve shortlisted:
Tool | Use case | Price |
Dot | Written campaign analysis and scheduled business reviews, delivered wherever your team asks questions. | Free tier; paid from $180 a month. |
Google Analytics 4 | Free web and app measurement with data-driven attribution and raw event export to BigQuery. | Free; Analytics 360 quoted by Google. |
Adobe Analytics | Enterprise digital measurement with cross-channel journey and incrementality analysis available alongside it. | Pricing not published. |
Amplitude | Behavioural and web analytics with campaign reporting, session replay, and experimentation bundled in. | Free to 2M events; Plus from $0, usage-priced. |
Mixpanel | Funnel and retention analysis over event data, with campaign reporting and attribution included. | Free to 1M events; Growth from $0, usage-priced. |
Matomo | Privacy-first web analytics you host yourself or run from Frankfurt, with no data sampling. | Free self-hosted; Cloud from €22 a month. |
HubSpot Marketing Hub | Campaign and revenue attribution reporting sitting alongside the contact records it scores. | From $20 per seat monthly; Professional from $890 a month. |
Dreamdata | Account-level B2B attribution that ties ad spend to closed pipeline across a buying committee. | Free tier; paid pricing quoted. |
Data Studio | Free dashboards over Google sources, with organisation-owned content and Gemini on the paid tier. | Free; Pro billed per user per Cloud project. |
Supermetrics | Moving campaign data out of ad platforms into your reporting destination or warehouse. | From €39 a month billed yearly. |
#1: Dot
Dot is the best marketing analytics tool in 2026 because a marketer asking why a channel underperformed gets a written answer with a recommendation, in whichever tool they asked from.
And the best part? They can also open the SQL behind any number in it.
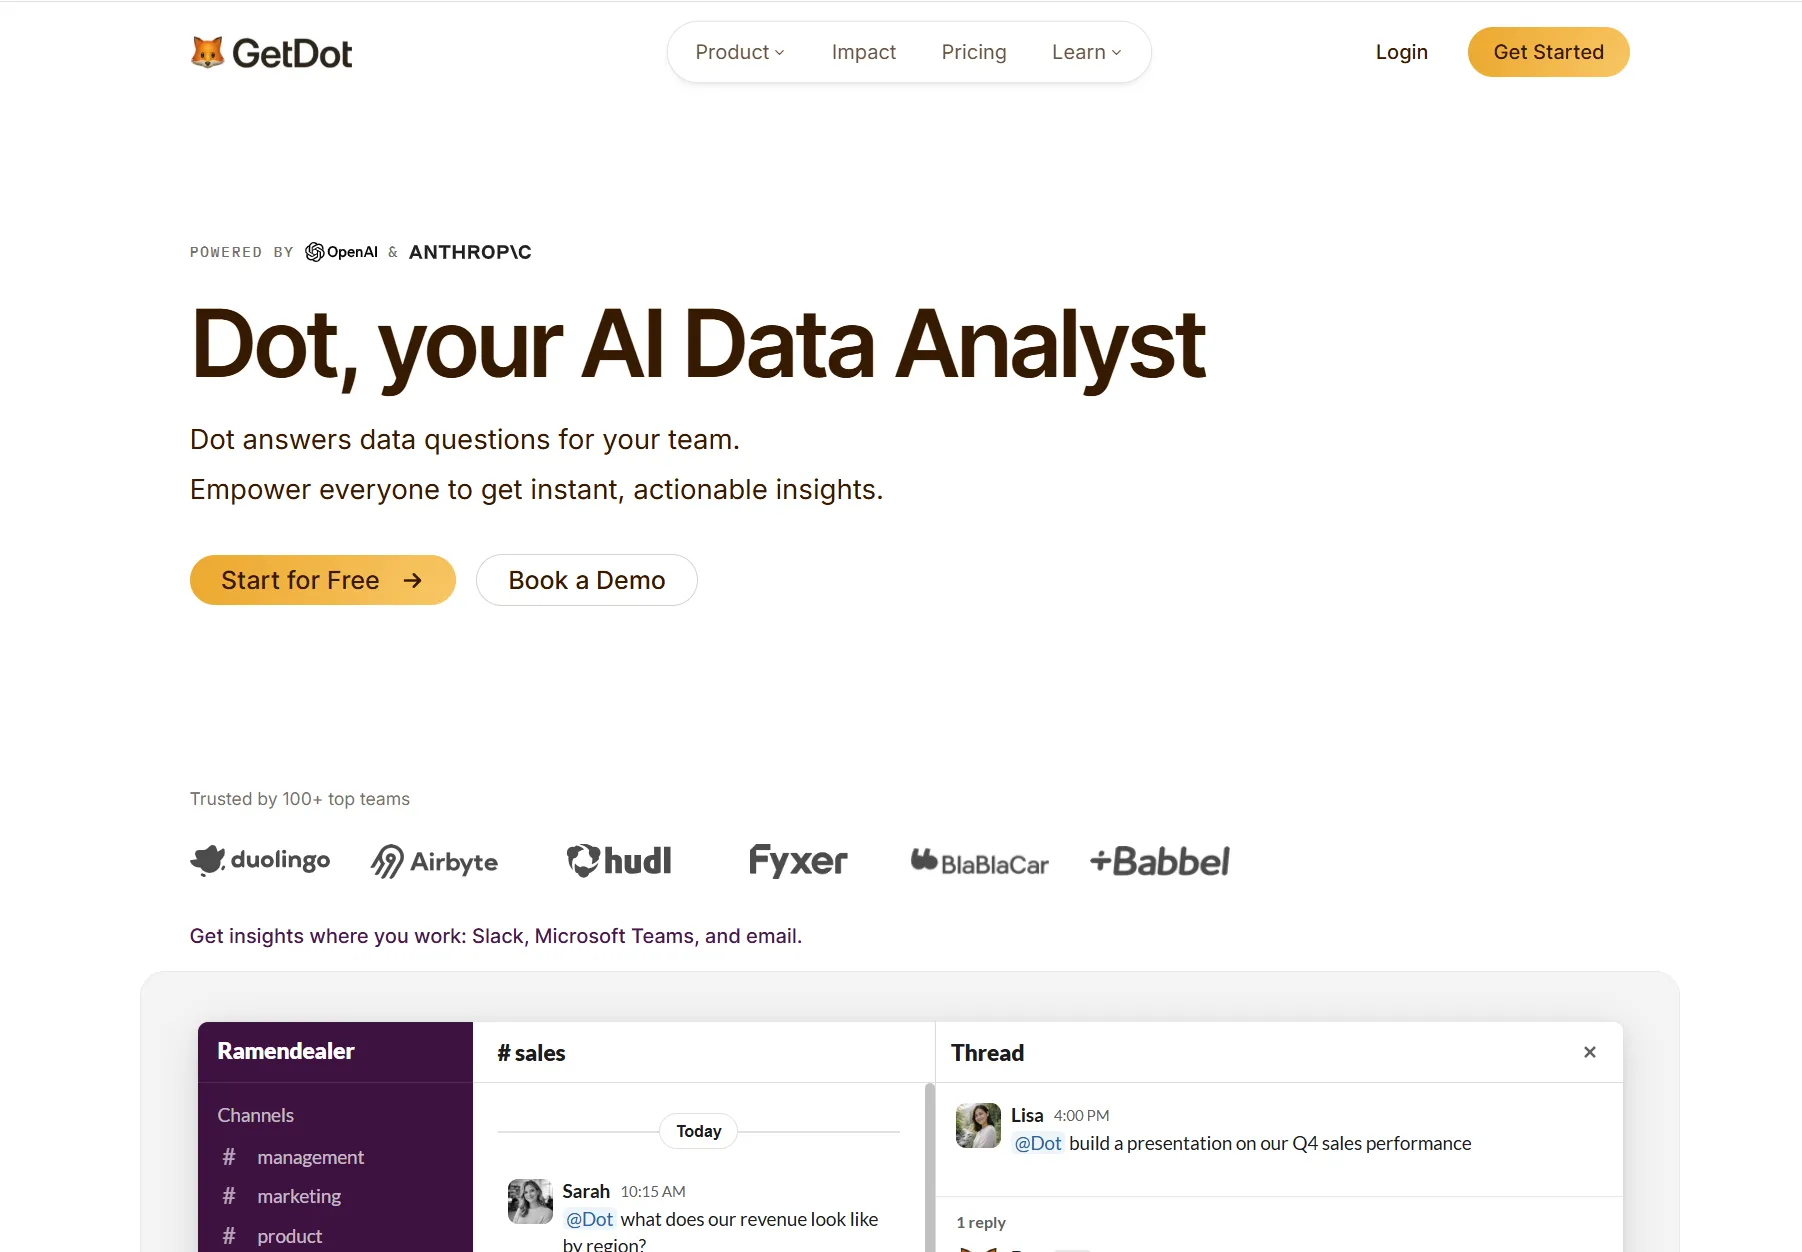
Disclaimer: Dot is our own BI product, so read this section as our argument.
Setup is a one-time job. All you have to do is connect whichever data warehouse your ad, web, CRM, and email data flows into.
Then you hand Dot the dbt models and documentation your team already keeps.
From there, campaign questions that would normally require an analyst are answered without one.
These are the parts that matter for marketing work:
Written analysis in the channel the question came from
Dot takes marketing questions in Slack, Microsoft Teams, email, and its own web app, replying in that same thread with the numbers, the reasoning, and a recommended next step.
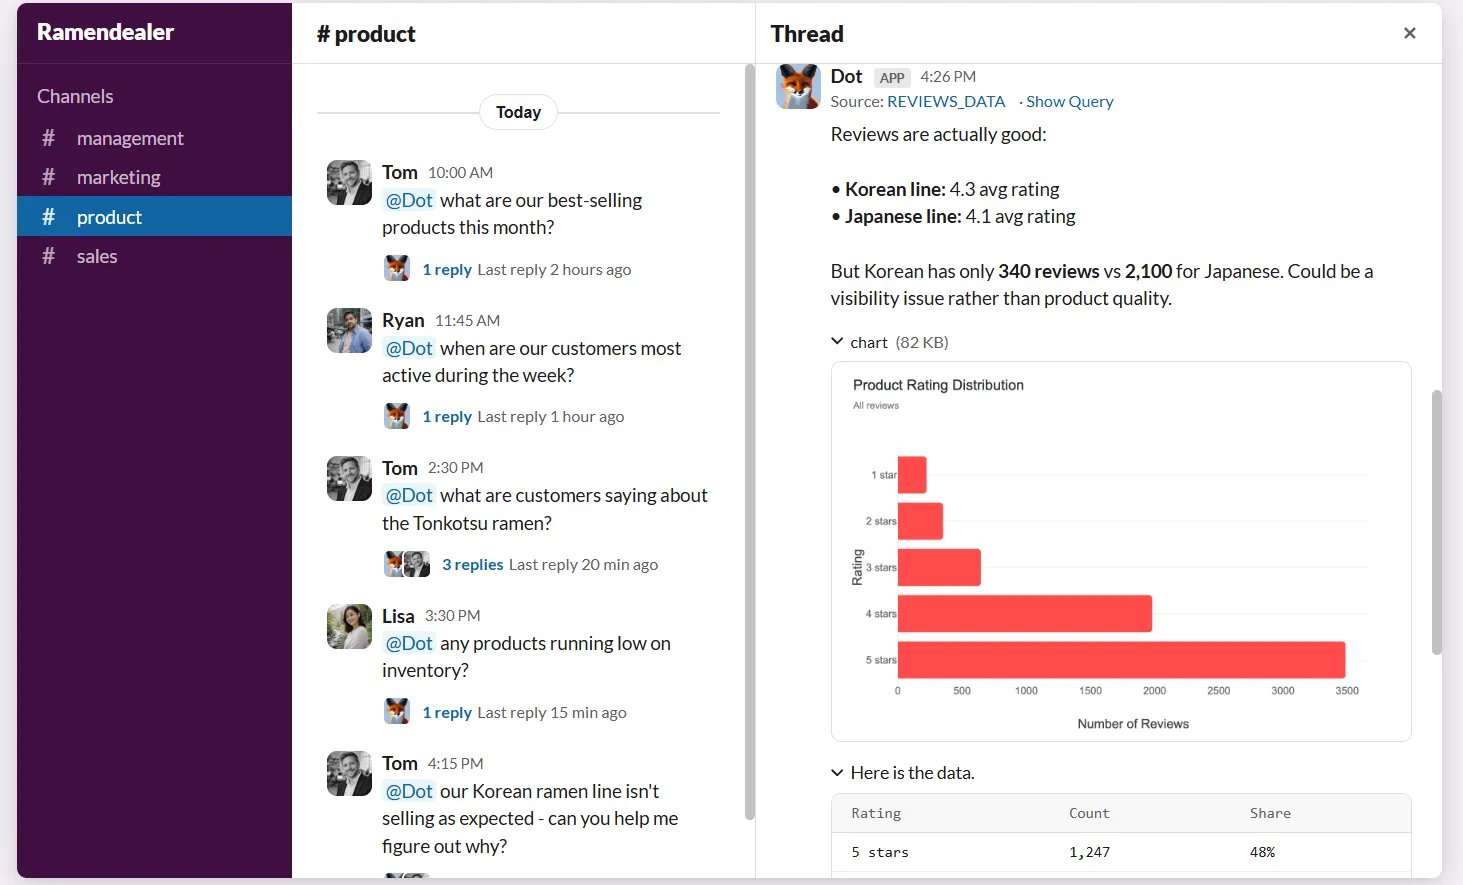
A performance marketer wondering why blended CAC moved last week types the question into their own Slack channel and reads the answer in the same thread.
No dashboard is opened, and no SQL is written.
Energy Mode decides how much compute a given question receives.
Economy handles routine lookups, and Frontier is reserved for complex analysis, with Balanced applied by default to everything in between.
Every claim in a reply links back to its source data, so anyone can check a number before acting on it.
Deep Analysis for the questions that start with why
Deep Analysis is Dot's investigation mode, where several lines of inquiry run in parallel and the findings come back with statistical confidence behind them.
That report opens with a single quantified finding, adds an executive summary and the supporting analysis with charts embedded, then closes with recommendations and the assumptions behind them.
Runtime lands between two and ten minutes depending on how tangled the question is.
When paid social conversions fall, and nobody knows whether it was creative fatigue, an audience change, a bidding shift, or broken tracking, that investigation is the work that would otherwise consume an analyst's week.
💡 Follow-ups keep the thread: "break that out by acquisition channel" continues the same investigation, and the finished report exports to PowerPoint when it needs to go in front of your team.
Business reviews drafted on your cadence
Any Deep Analysis can be put on a schedule, delivered daily, weekly, or monthly to email, Slack, or Microsoft Teams, with recipients set per report.
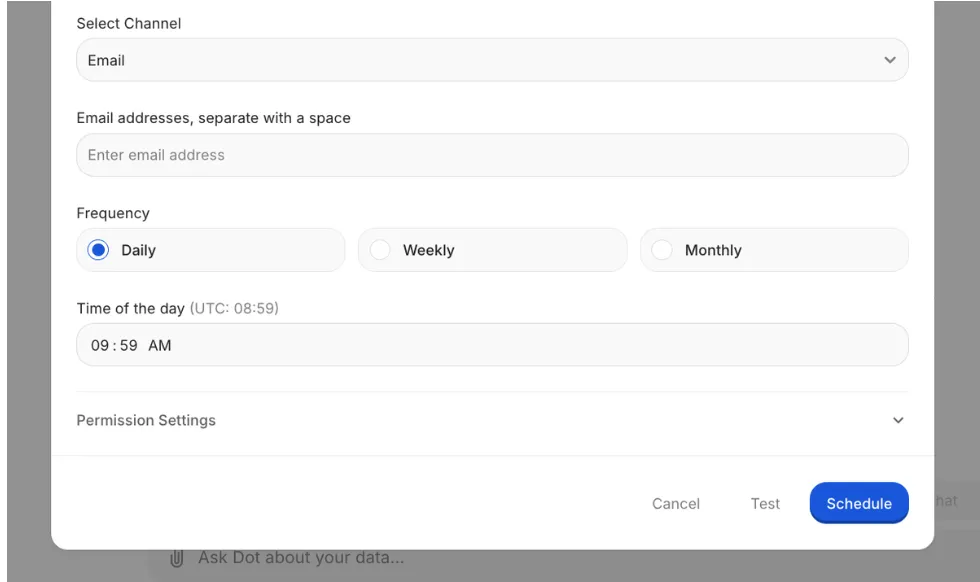
Every edition is generated against live warehouse data.
Each covers what moved, how far it moved against the prior period, the likeliest explanation, and the open questions.
Monthly marketing reporting usually means rebuilding identical charts and rewriting last month's commentary.
Scheduled reviews remove that task from the reporting cycle.
Scheduled runs cost one credit each and can fire at most twice a day, and admins can run a report as another user so it respects that person's data permissions.
Playbooks that encode how your team analyses campaigns
Playbooks let you write down the analytical conventions your marketing team already follows, so Dot applies them the same way every time it reports on a campaign.
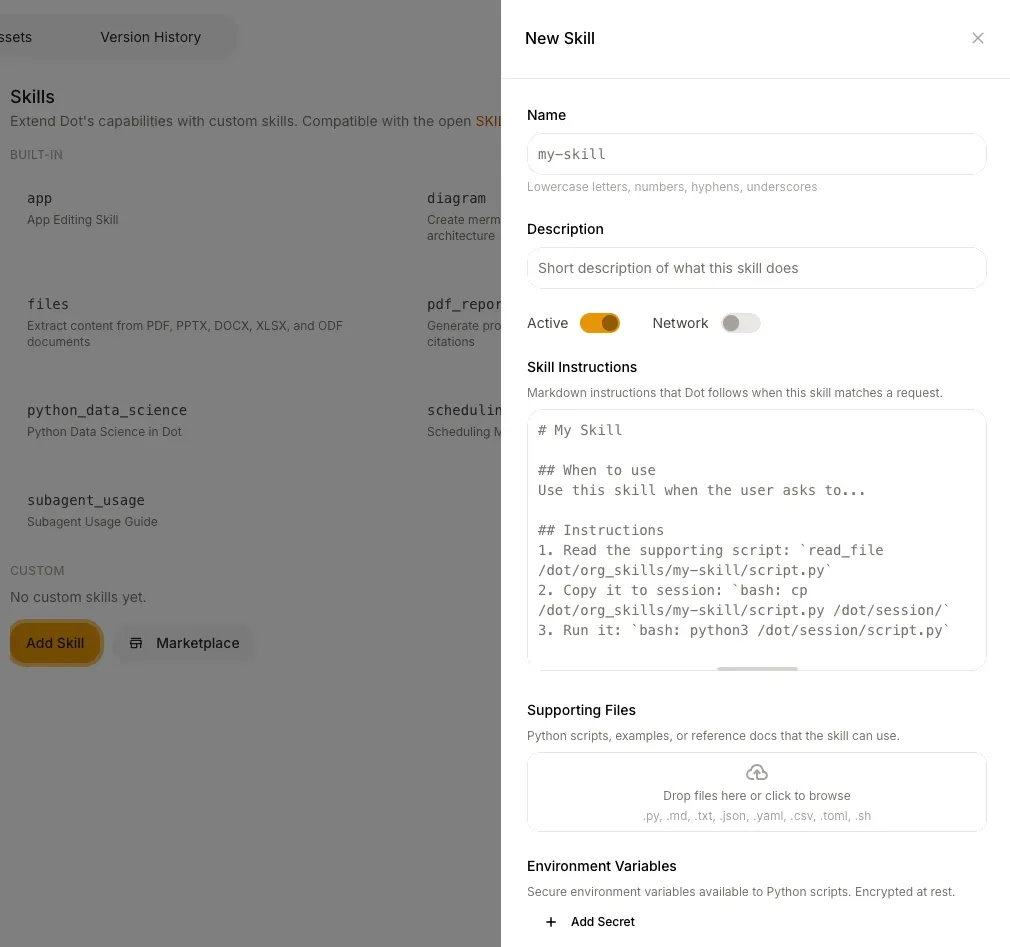
A campaign review playbook can specify that Google Ads campaigns group into Paid Search and Meta campaigns into Paid Social, and that audiences split between Prospecting and Retargeting.
It can also fix ROAS as conversion value over spend, name UTM parameters as the source of truth for cross-channel tracking, and exclude anything tagged test or internal.
The effect is that two people asking about the same campaign get the same numbers, calculated the same way, without either of them knowing the conventions.
Governed metric definitions with full lineage under every figure
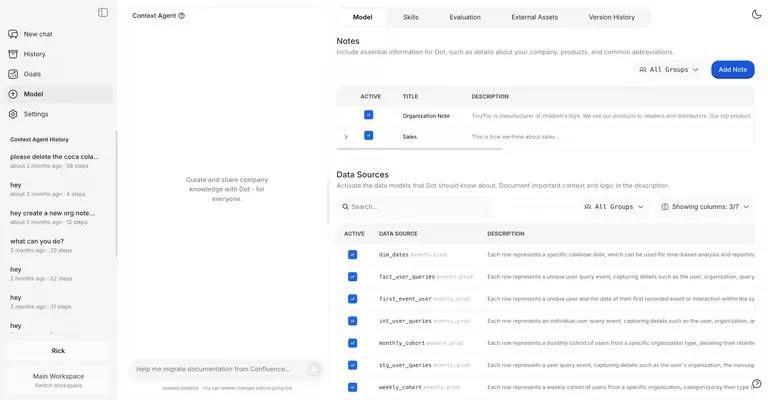
Dot governs metric definitions centrally through itsContext Agent, and attaches a lineage map to every figure it reports.
The problem this solves is sharpest in cross-channel reporting.
Google Ads reports 180 conversions for the quarter, and your CRM credits 96 of them to the same campaigns.
Neither figure is wrong, because each tool applies its own attribution window and its own test for what counts as a conversion.
The problem is that reconciling the two without an agreed definition costs a meeting and somebody's afternoon.
The Context Agent stores the agreed version and applies it to every answer Dot gives.
It assembles that record from the places your team already documents things, pulling from whichever data catalog you run, the warehouse schema, your dbt project, and documentation pages in a tool such as Confluence.
The dbt connection refreshes itself daily, unprompted. Governance holds as the team grows.
A correction someone types mid-conversation is held as a pending change for an admin to approve, so no single person's phrasing propagates company-wide.
Reworking a definition properly happens on a branch.
You put your questions to the revised version while everyone else carries on against the live one, and the diff gets reviewed before it merges.
Lineage covers the other half of any disagreement.
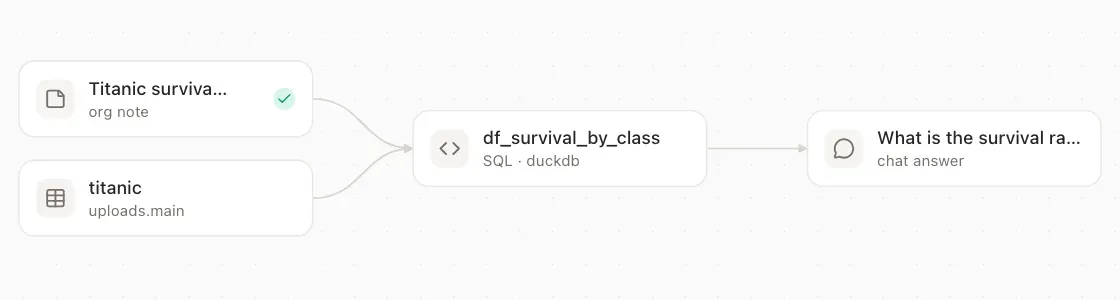
The full logs panel on any answer contains a lineage view that runs from the figure on screen back through the dbt models and the exact SQL, down to the warehouse tables underneath.
Any note your team wrote that influenced the query is drawn into the same graph.

Every query Dot runs is signed as well, recording the requester, the workspace, whatever triggered the run, and a link back to the originating thread.
BigQuery receives those as job labels, which puts your marketing team's query costs into the billing export.
What makes Dot different from other marketing analytics tools?
Dot differs from the other nine tools in one respect.
It returns a written interpretation of the data, where the others return the data itself.
The other nine collect marketing data, measure behaviour, model attribution, or display the result, and interpreting that output remains a manual task.
The billing model splits the same way.
Where the other tools publish a figure, the billing unit is seats, events, monthly tracked users, marketing contacts, or destinations.
On the seat-priced options, giving a fiftieth marketer access requires additional budget approval.
Every paid Dot plan allows unlimited users and charges only for the analysis produced.
That suits a marketing or data team that already has modelling in place and wants written answers built on top of it.
Nothing needs migrating, and marketers learn no new interface.
Dot does no tracking of its own and models no incrementality.
Extracting campaign data from ad platforms is what Supermetrics is built for, and Dot operates downstream of whichever pipeline you use.
💡 At Emerge, that shift saved more than 2,000 hours a year and returned roughly ten times what the subscription cost, with time to insight down by 99%.
Dot pricing
Dot has four tiers, and analysis volume determines the cost:
- Free costs nothing and grants 300 credits once, with every Pro feature switched on, which covers a real evaluation against live campaign questions.
- Pro runs $180 a month for 150 credits and charges $1.80 per credit beyond them, with no cap on user numbers.
- Team costs $720 a month for 800 credits, drops the overage rate to $1.44, and brings SSO, row-level security, embedding, migration help off your current BI tool, and dedicated support.
- Enterprise is quoted on request and removes the credit ceiling. It adds volume rates, self-hosted deployment, audit logging, an SLA, and a named account manager.
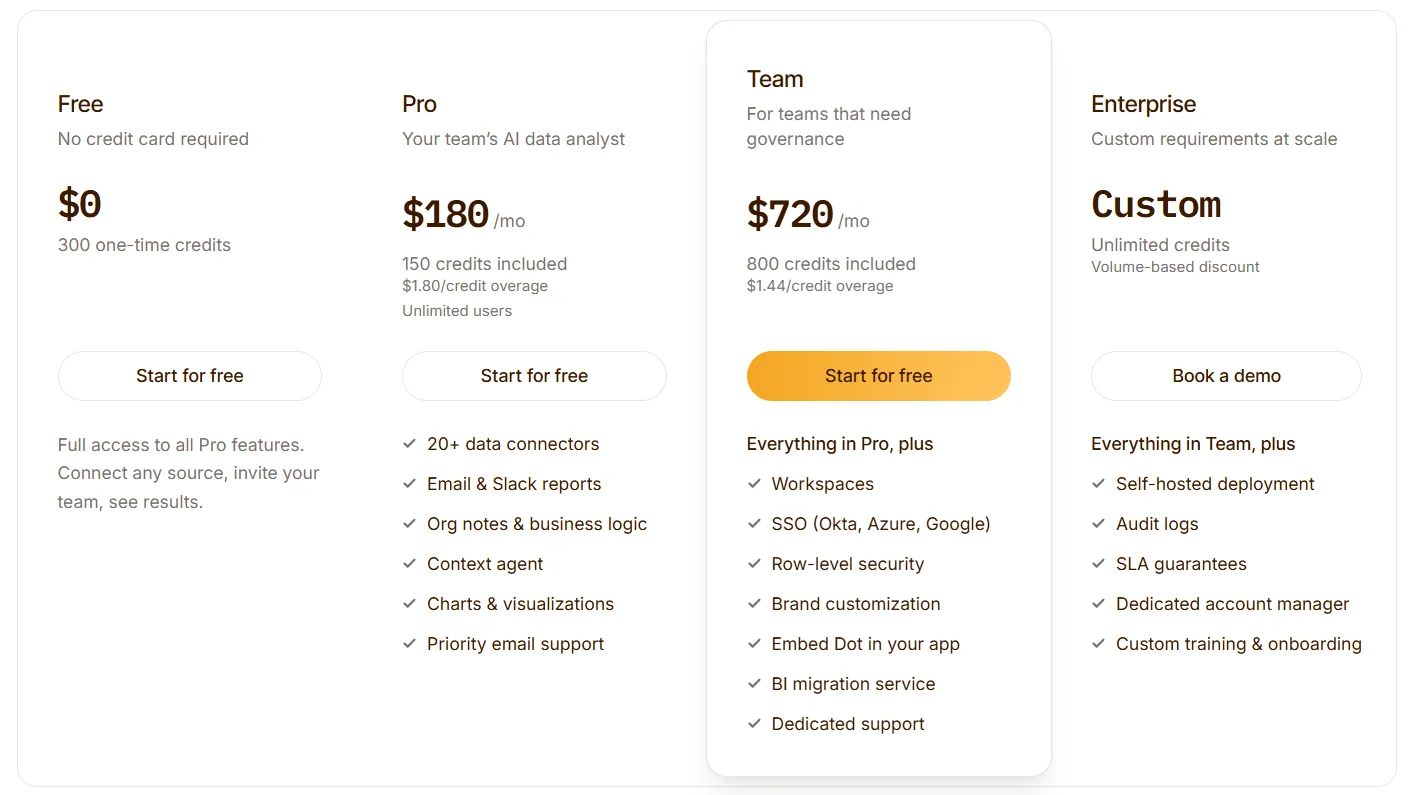
Answering a question or generating a report draws credits down, and paying annually removes 10%.
This means the invoice follows how much analysis your marketing team consumes, while the size of that team leaves it untouched.
Dot pros and cons
✅ Answers arrive as written analysis with a recommended action, in whichever channel the question was asked.
✅ Recurring reviews draft themselves against live warehouse data on whatever cadence you set, up to twice daily.
✅ Each published number links back to the query that produced it and the models beneath.
✅ No per-seat charge on any paid tier, and Dot is SOC 2 Type II compliant.
✅ Queries run against your warehouse in place, so Dot does not hold a second copy of your data.
❌ A heavy reporting month consumes credits quickly, so per-user or shared limits are worth setting up early.
❌ Dot carries no native Google Ads or Meta Ads connector, so campaign data has to reach a warehouse first, usually through a pipeline like Supermetrics.
#2: Google Analytics 4
Best for: Marketing teams that need free web and app measurement wired into Google Ads and BigQuery.
Similar to: Matomo, Adobe Analytics.
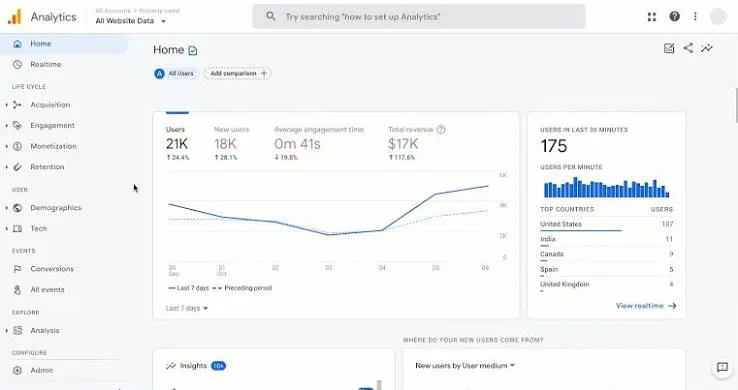
Google Analytics 4 is Google's web and app measurement platform, built on an event-based data model that tracks sites and apps inside a single property.
It remains free for the overwhelming majority of properties.
The paid Analytics 360 tier is reserved for organisations needing higher volumes and contractual guarantees.
Google Analytics 4's top features
- Event-based data model: Every interaction is recorded as an event across web and app in one property, which is what allows cross-platform reporting without stitching two tools together.
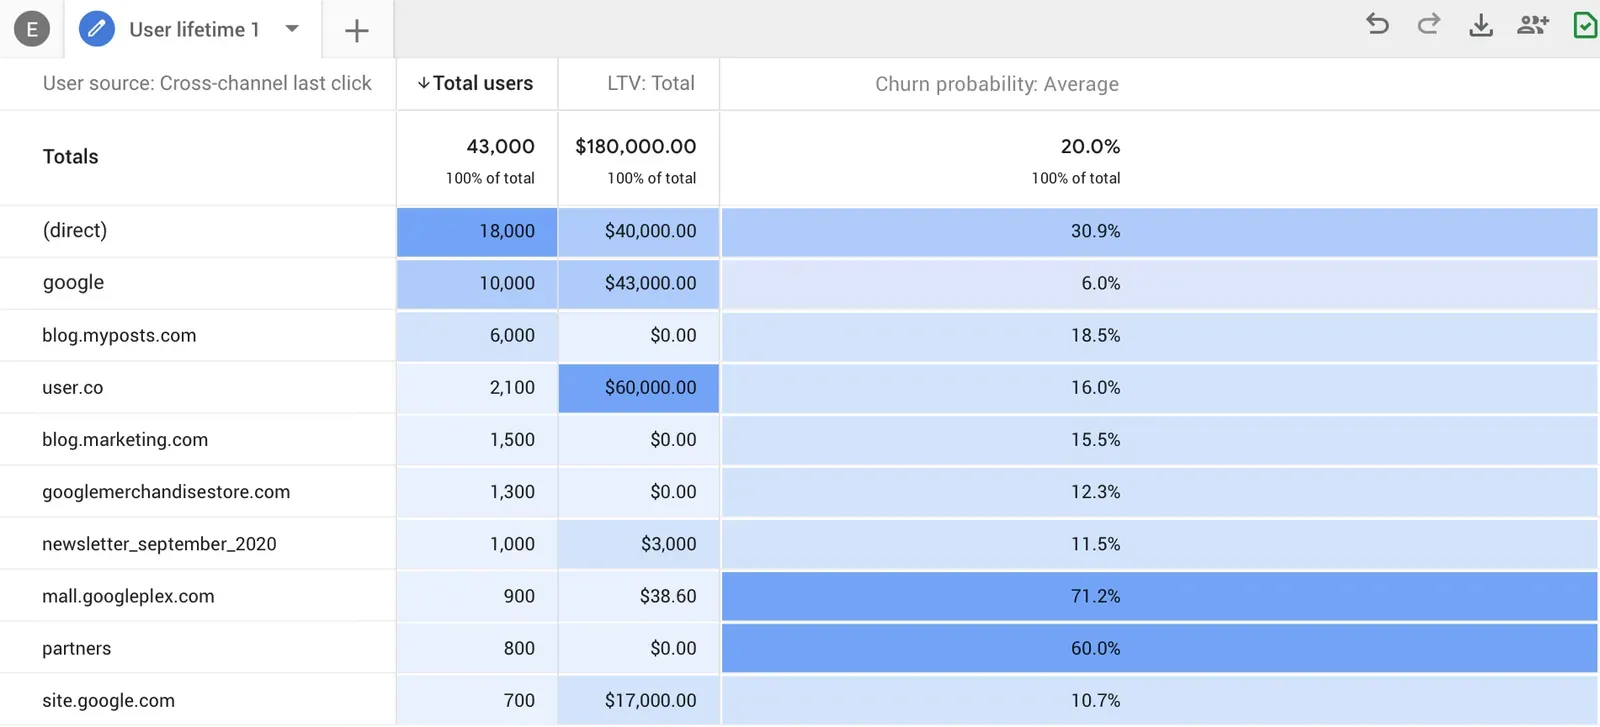
- Explorations: Free-form tables, funnels, path analysis, cohorts, segment overlap, and user lifetime reports cover the analysis the standard reports cannot reach.
- BigQuery export: Standard properties can export raw, unsampled events to BigQuery at no platform charge, which is how teams build attribution windows and funnels defined their own way.
- Attribution and audiences: Data-driven attribution now applies by default to new conversion events.
Google Analytics 4 pricing
Two editions exist, and only one of them has a number attached.
The standard edition costs nothing.
There is no time limit on it and no reduced feature set, which is why it measures most of the tracked web.
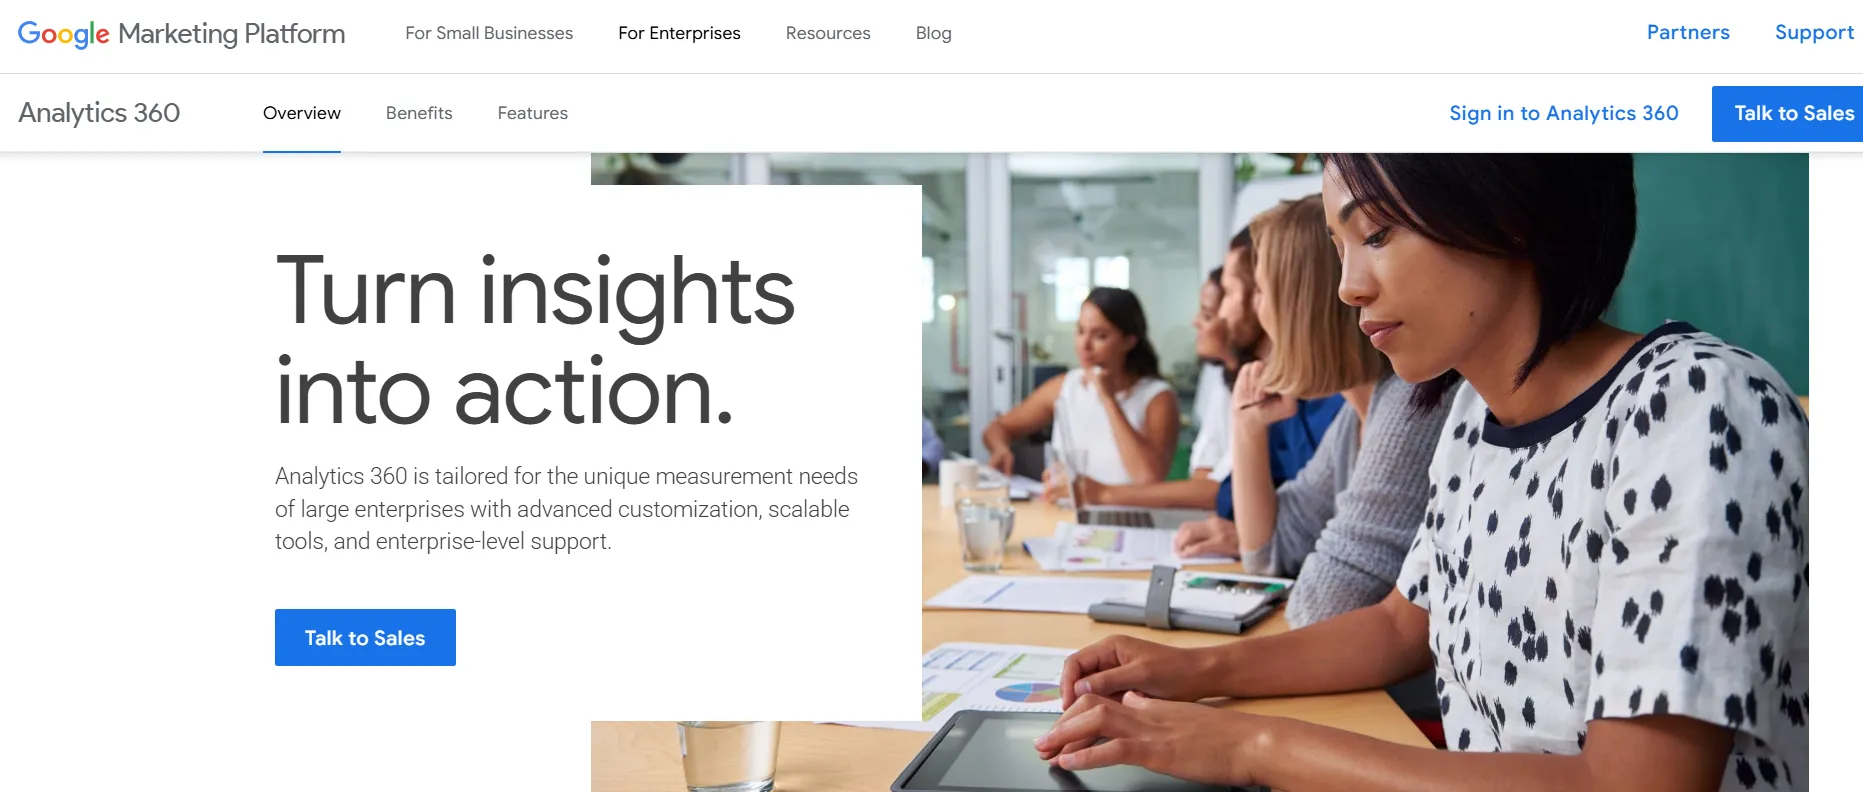
Analytics 360 is sold through Google Cloud on an event-volume basis and carries no published figure, so budgeting for it means a conversation with Google or a reseller.
Google Analytics 4 pros and cons
✅ The free tier covers functionality that comparable tools charge for.
✅ Its connections into Google Ads and BigQuery are hard to replace with any single product, and Search Console comes with them.
✅ Raw event export means you are never locked into the reporting the interface offers.
❌ The free BigQuery export is capped at one million events a day, and Google Cloud storage and query charges still apply beyond the free usage tier.
❌ Analytics 360 pricing is not published, so the upgrade path cannot be costed from public information.
#3: Adobe Analytics
Best for: Large organisations measuring digital performance across many properties and channels.
Similar to: Google Analytics 4, Amplitude.
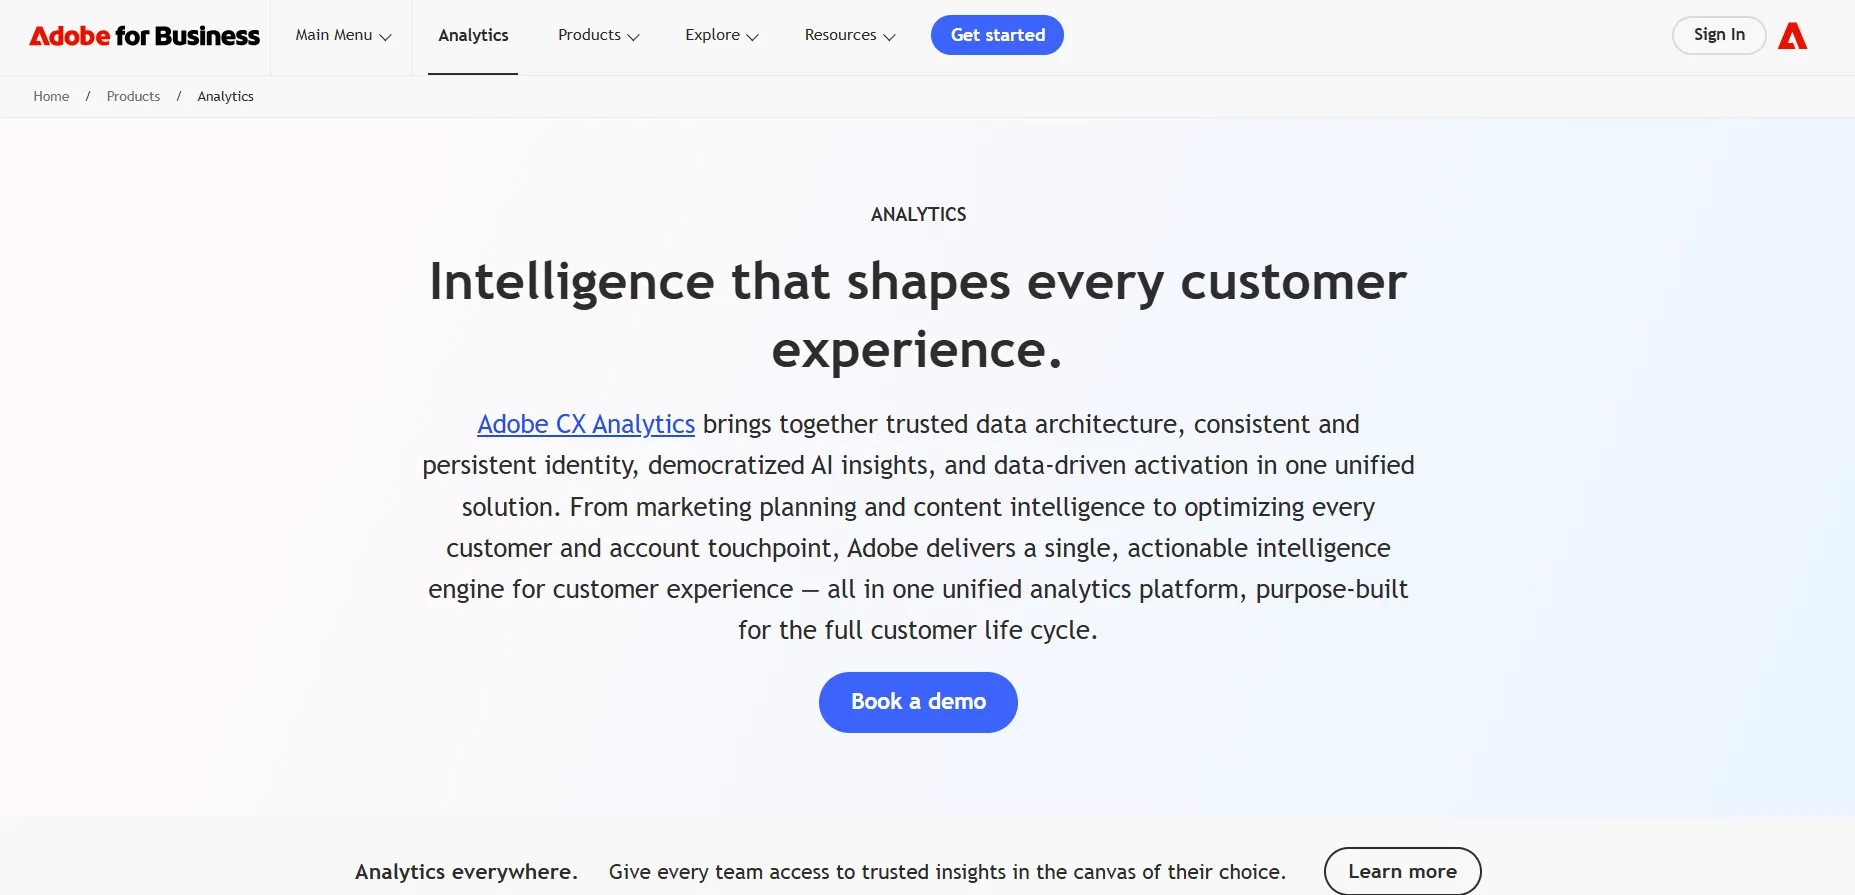
Adobe Analytics now belongs to Adobe CX Analytics, a family of products spanning web and mobile measurement, cross-channel journey analysis, B2B account analysis, campaign incrementality, and content performance.
Enterprise scale is the assumption throughout, and every product page ends at a demo booking with no figure attached.
Adobe Analytics' top features
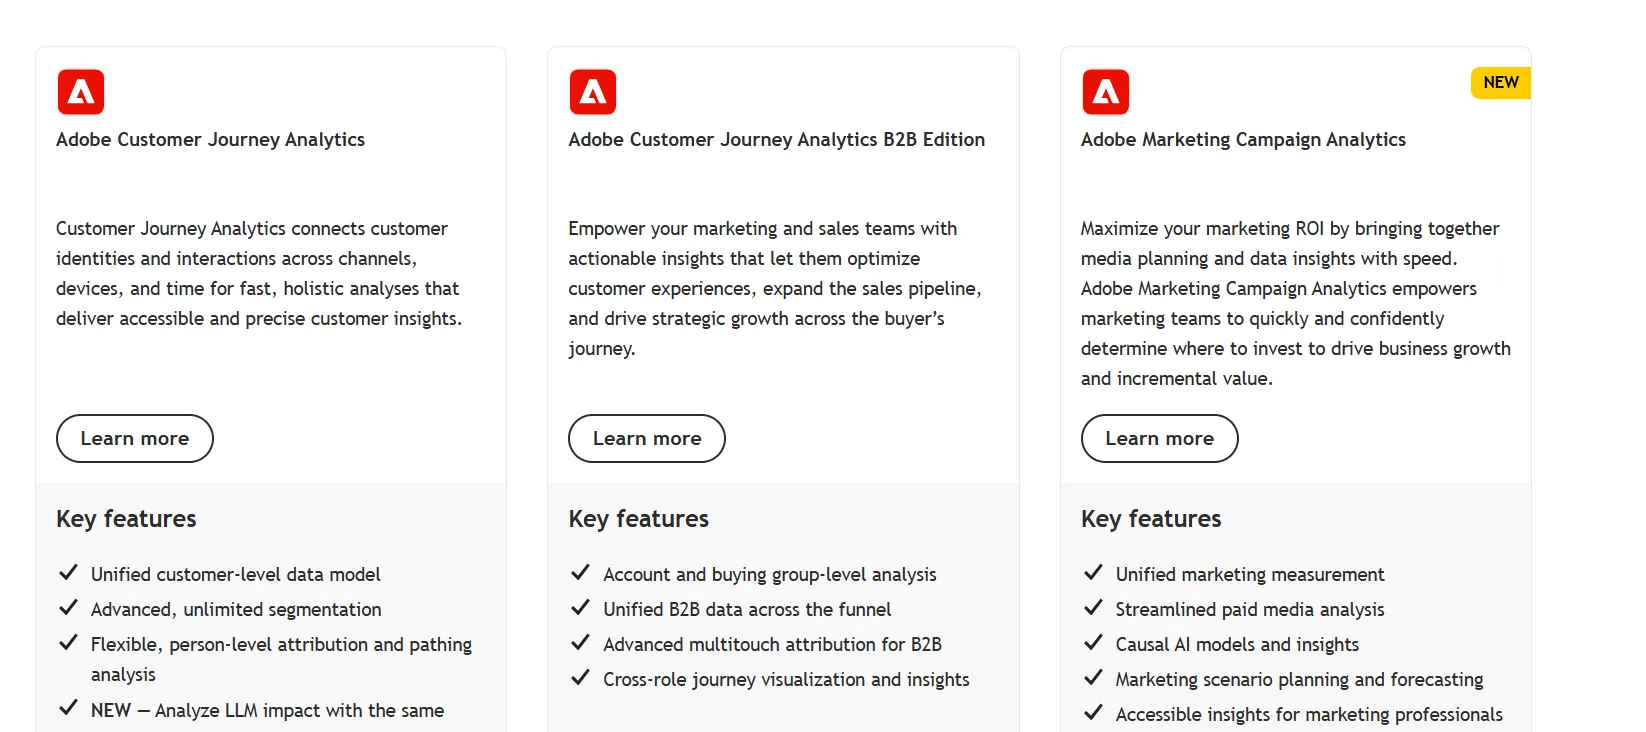
- Digital analytics for web and mobile: Visitor behaviour across digital properties gets collected and processed for analysis, covering deep segmentation, journey analysis across channels, advanced attribution, and enterprise-grade data governance.
- Customer Journey Analytics: A unified customer-level data model carries unlimited segmentation alongside person-level attribution and pathing analysis.
- Adobe has since added LLM impact analysis, so an AI assistant touchpoint gets measured like any other.
- Customer Journey Analytics B2B Edition: Account and buying-group level analysis over unified B2B funnel data, with multitouch attribution built for B2B and cross-role journey visualisation.
- Marketing Campaign Analytics: Unified marketing measurement running on causal AI models, covering paid media analysis plus scenario planning and forecasting for the next budget cycle.
Adobe Analytics pricing
Adobe publishes no figures anywhere in the CX Analytics family, and every route ends in a sales conversation.
Adobe Analytics pros and cons
✅ Journey analysis runs at person level across online and offline channels, and now covers the impact of LLM touchpoints.
✅ A dedicated B2B Edition handles account and buying-group analysis, which matters when a purchase decision is shared across a committee.
❌ No pricing is published for any product in the family, so the cost cannot be estimated without engaging sales.
#4: Amplitude
Best for: Marketing and product teams that want behavioural depth without per-seat licensing.
Similar to: Mixpanel, Adobe Analytics.
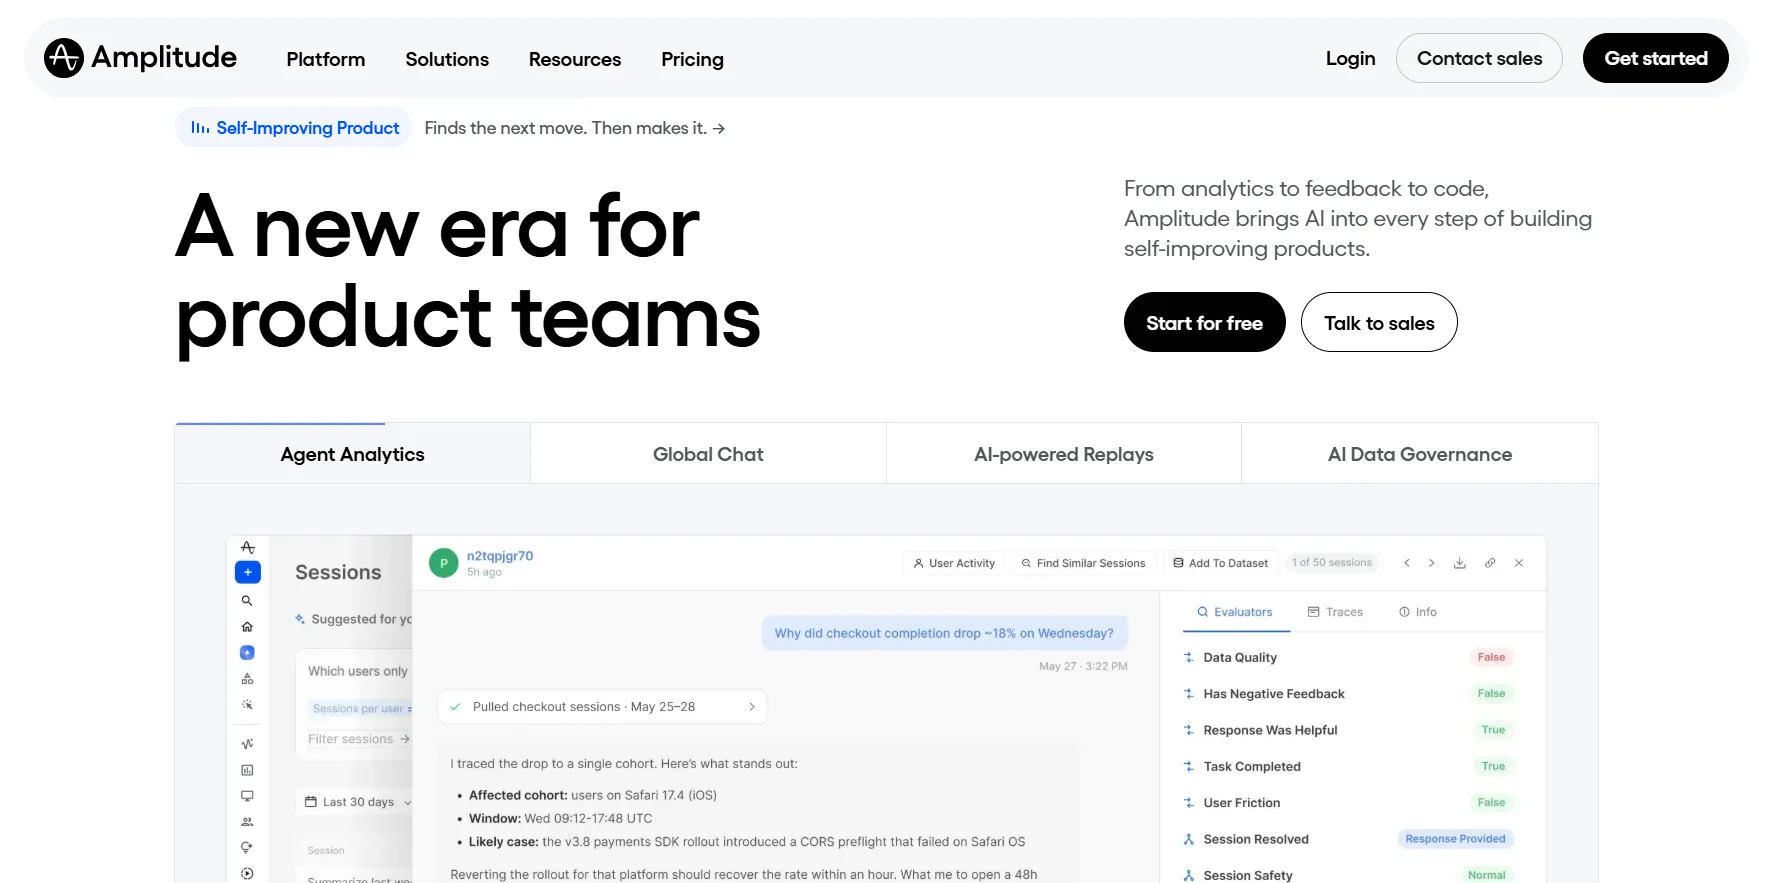
Built originally for product teams, Amplitude now ships a marketing analytics product alongside its product analytics, covering web measurement, campaign reporting, and experimentation from one platform.
Every plan includes unlimited seats and access to the full platform.
Volume separates the tiers more than features do, though governance and support still step up with price.
Amplitude's top features
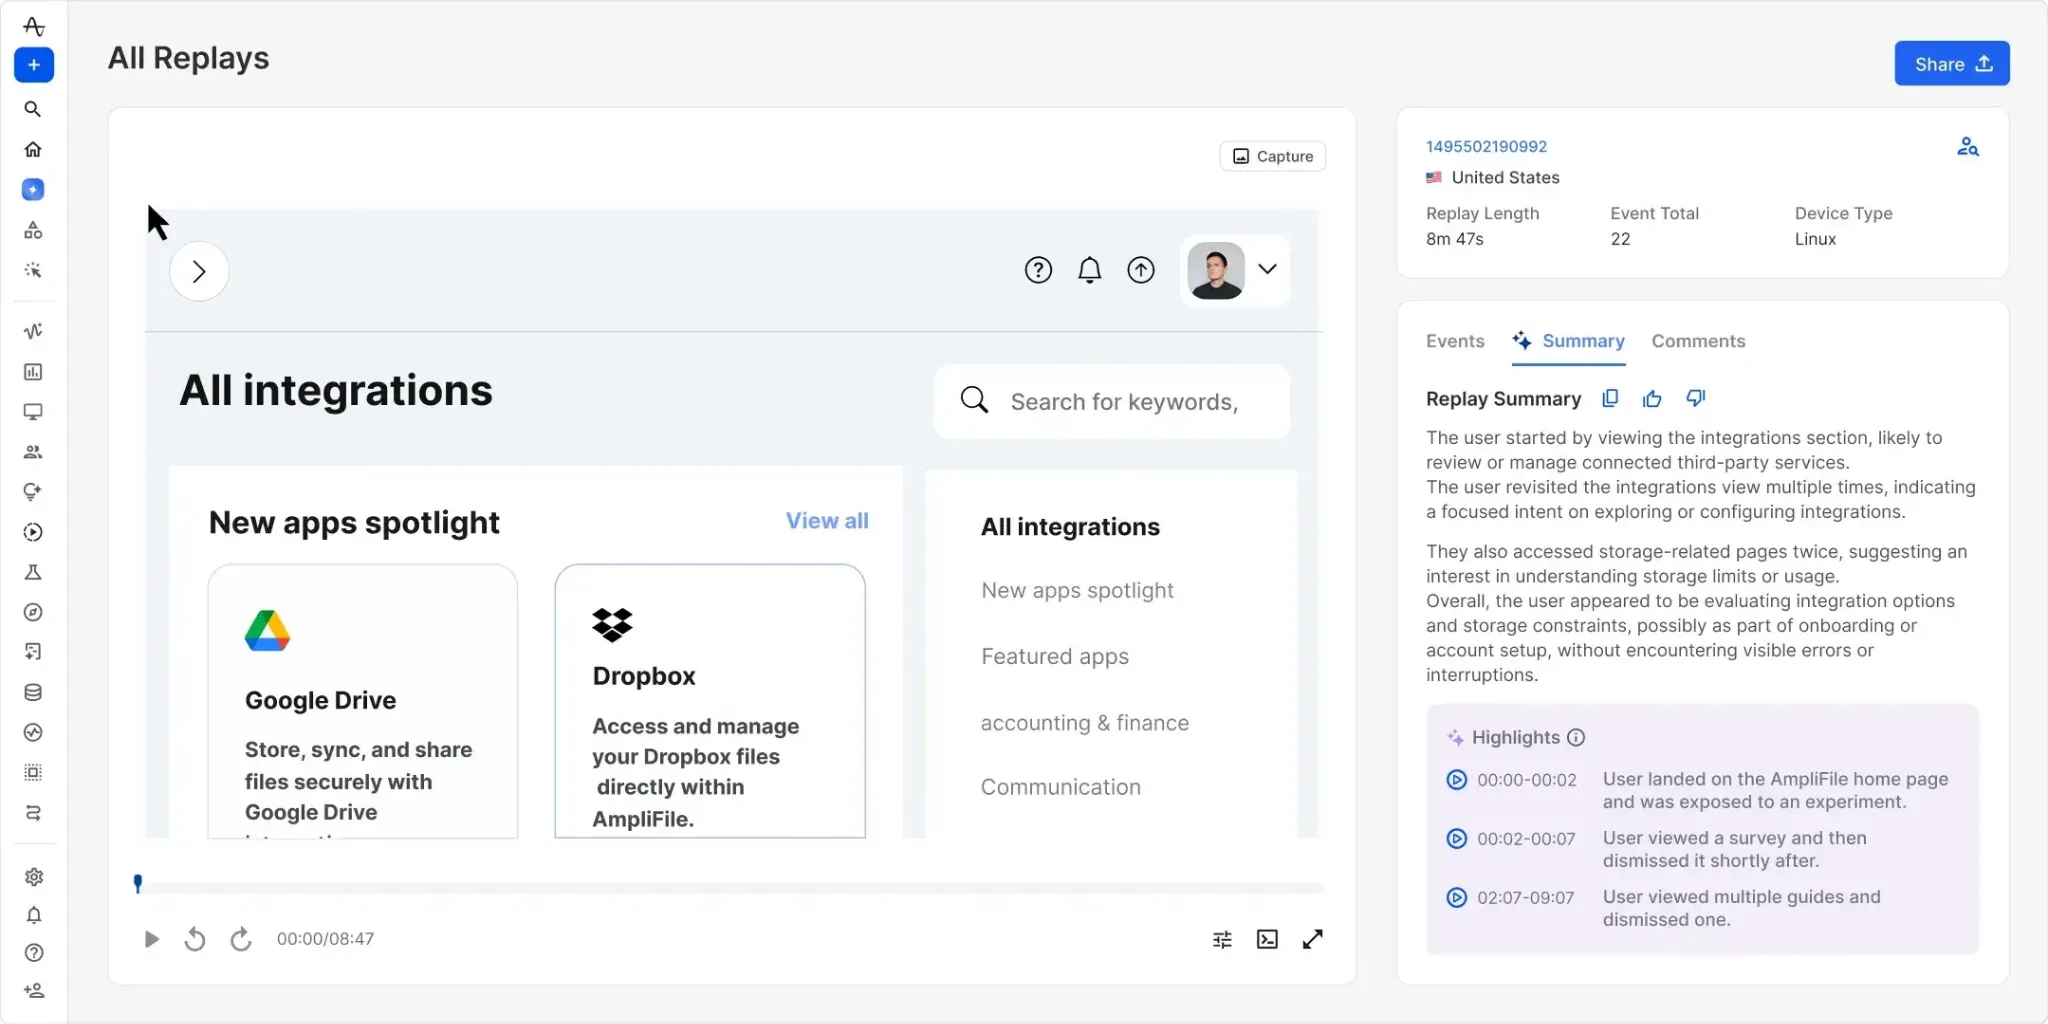
- Product and web analytics together: The same event data serves product funnels and web measurement, so acquisition and retention questions resolve against one dataset.
- Campaign reporting: Channel views, conversion drivers, cart analysis, and behavioural cohorts connect campaign exposure to what people did afterwards.
- AI agents and MCP access: Amplitude's agents answer questions about product data.
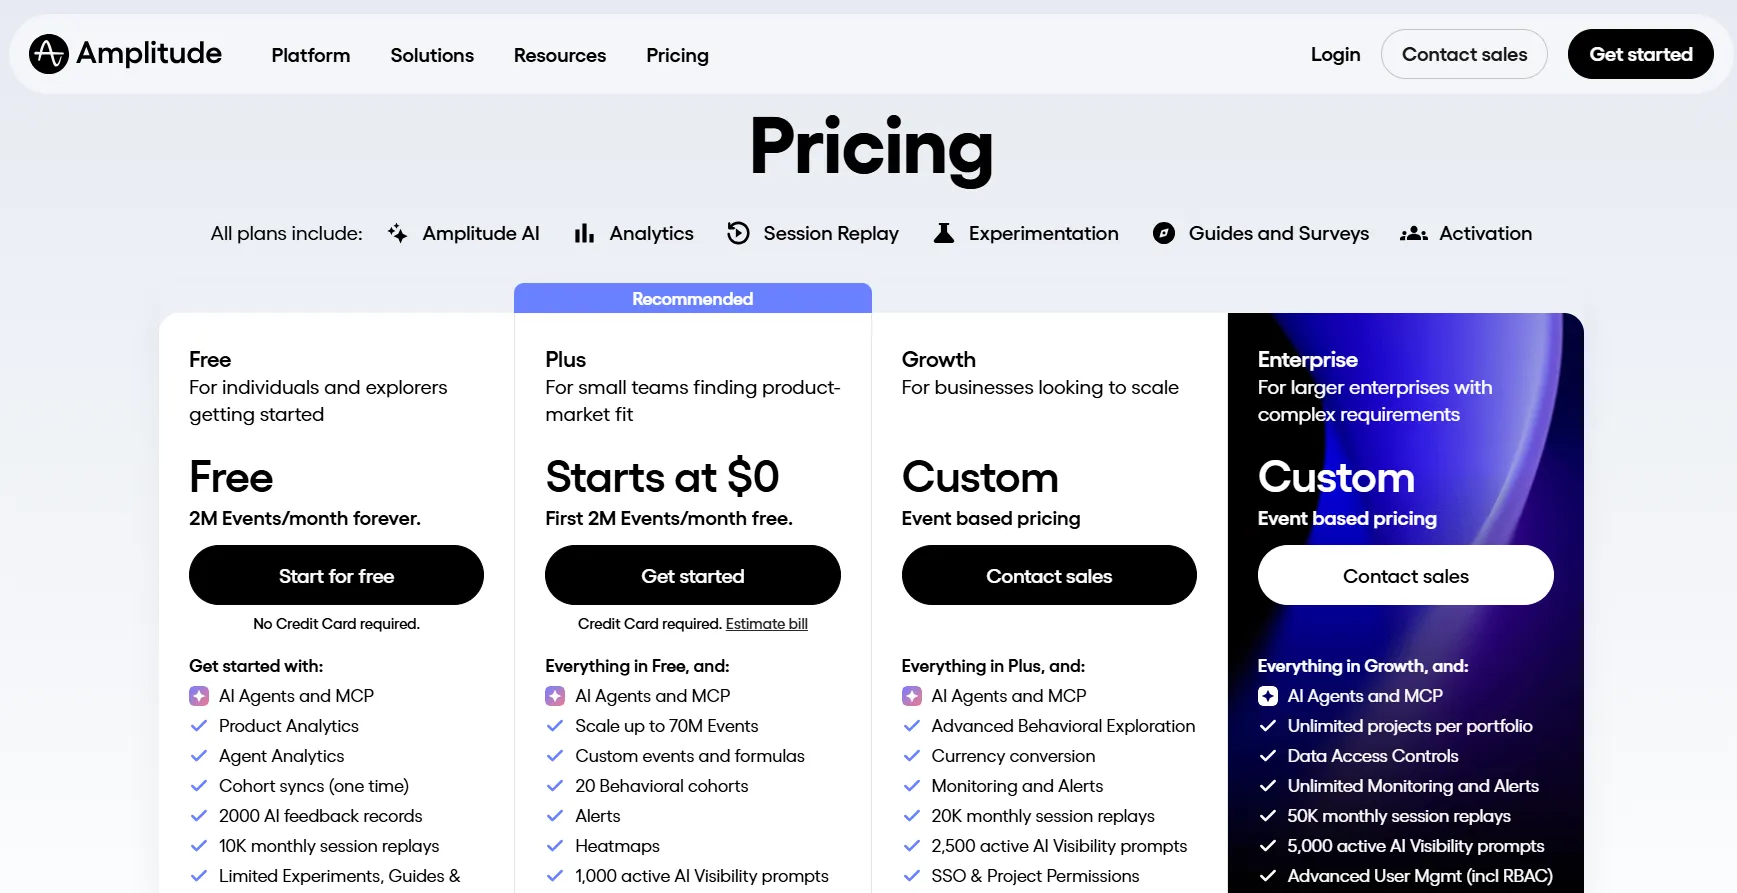
- AI Visibility prompts: Amplitude tracks how your brand appears in AI assistant responses, with prompt allowances rising from 500 on the free plan to 5,000 on Enterprise.
Amplitude pricing
Usage determines the cost, and seat count never does.
- Free covers 2 million events a month permanently. Session replay, feature flags, web experimentation, and guides are all included at reduced volumes.
- Plus starts at $0 and scales with event volume up to 70 million events, adding custom formulas, behavioural cohorts, heatmaps, and two-year data retention.
- Growth and Enterprise are both quoted on event volume, adding advanced behavioural exploration and SSO at the first step, then data access controls and role-based permissions at the second.
Startups under $10 million in funding with fewer than 20 employees can apply for a free year on Growth.
Amplitude pros and cons
✅ Unlimited seats on every plan, including the free one, so the size of the marketing team never enters the pricing conversation.
✅ Session replay, experimentation, feature flags, and AI agents all appear on the free tier.
❌ Several capabilities arrive as add-ons priced as a percentage of your platform plan, which makes the eventual bill hard to model in advance.
#5: Mixpanel
Best for: Teams tracking conversion funnels who want published event pricing and unlimited seats.
Similar to: Amplitude, Google Analytics 4.
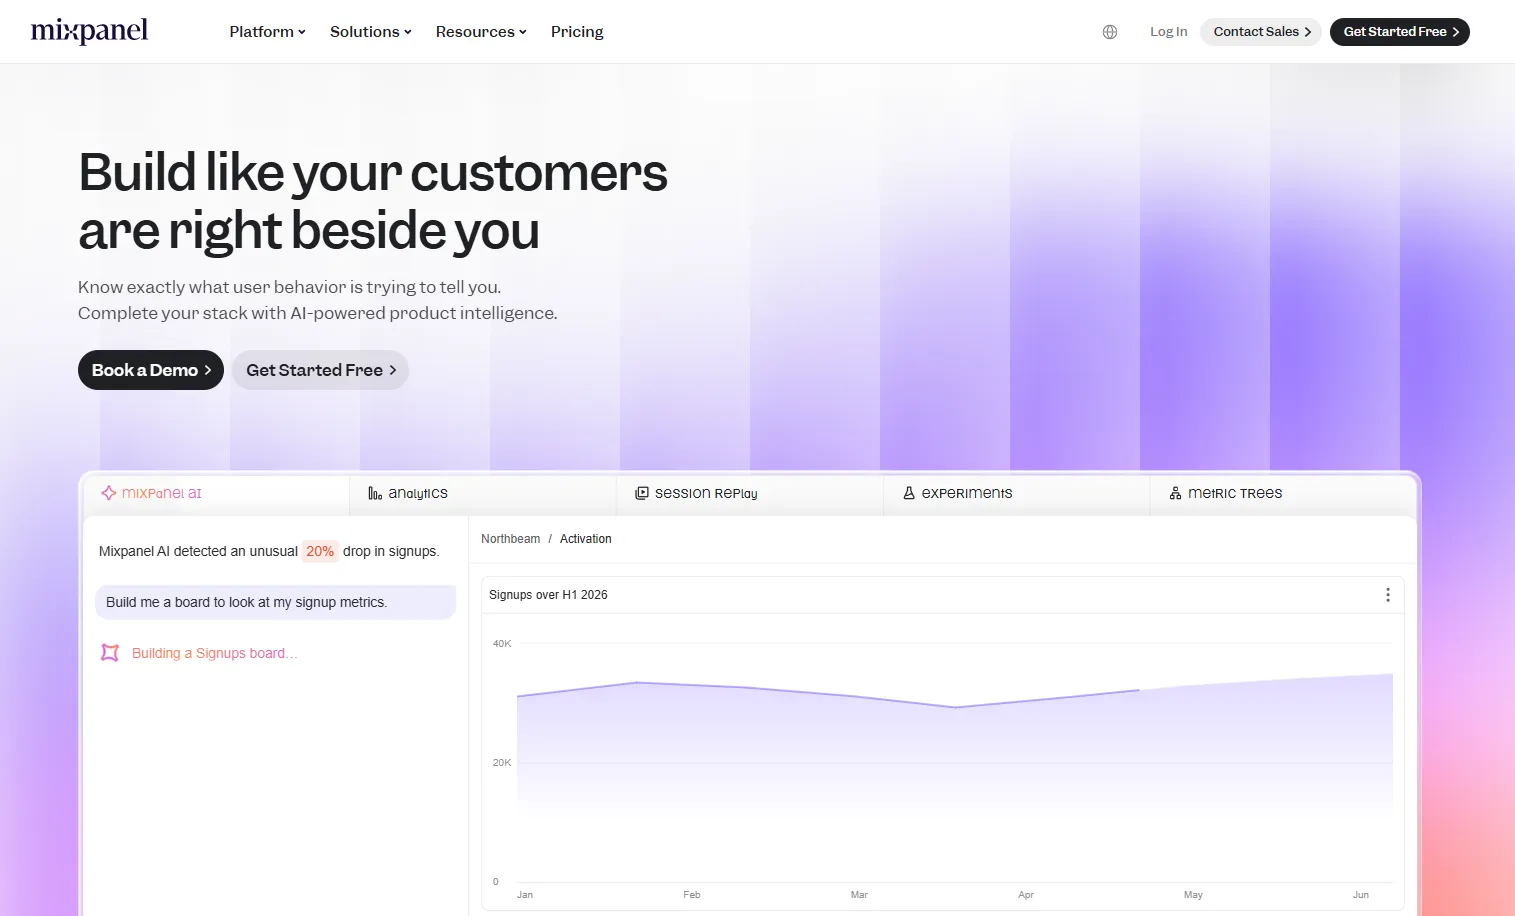
Mixpanel reports on funnels, retention, user flows, and cart behaviour over event data.
Campaign reporting and multi-touch attribution are included on every plan.
Mixpanel's top features
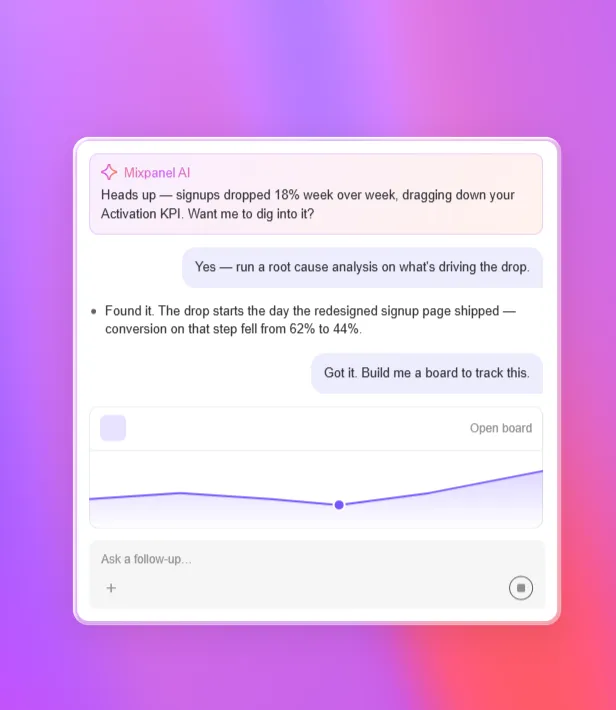
- Funnel and retention reports: Insights, funnels, flows, and retention analysis cover where people drop out of a conversion path and who comes back.
- Campaign reporting and multi-touch attribution: Both are standard across free and paid plans, which is unusual at this price point.
- Session replay: Web and mobile replays come with heatmaps, rage and dead click detection, console logs, and network calls, at 10,000 sessions a month even on the free plan.
- Mixpanel Agent and MCP server: An agent answers questions over your event data.
Mixpanel pricing
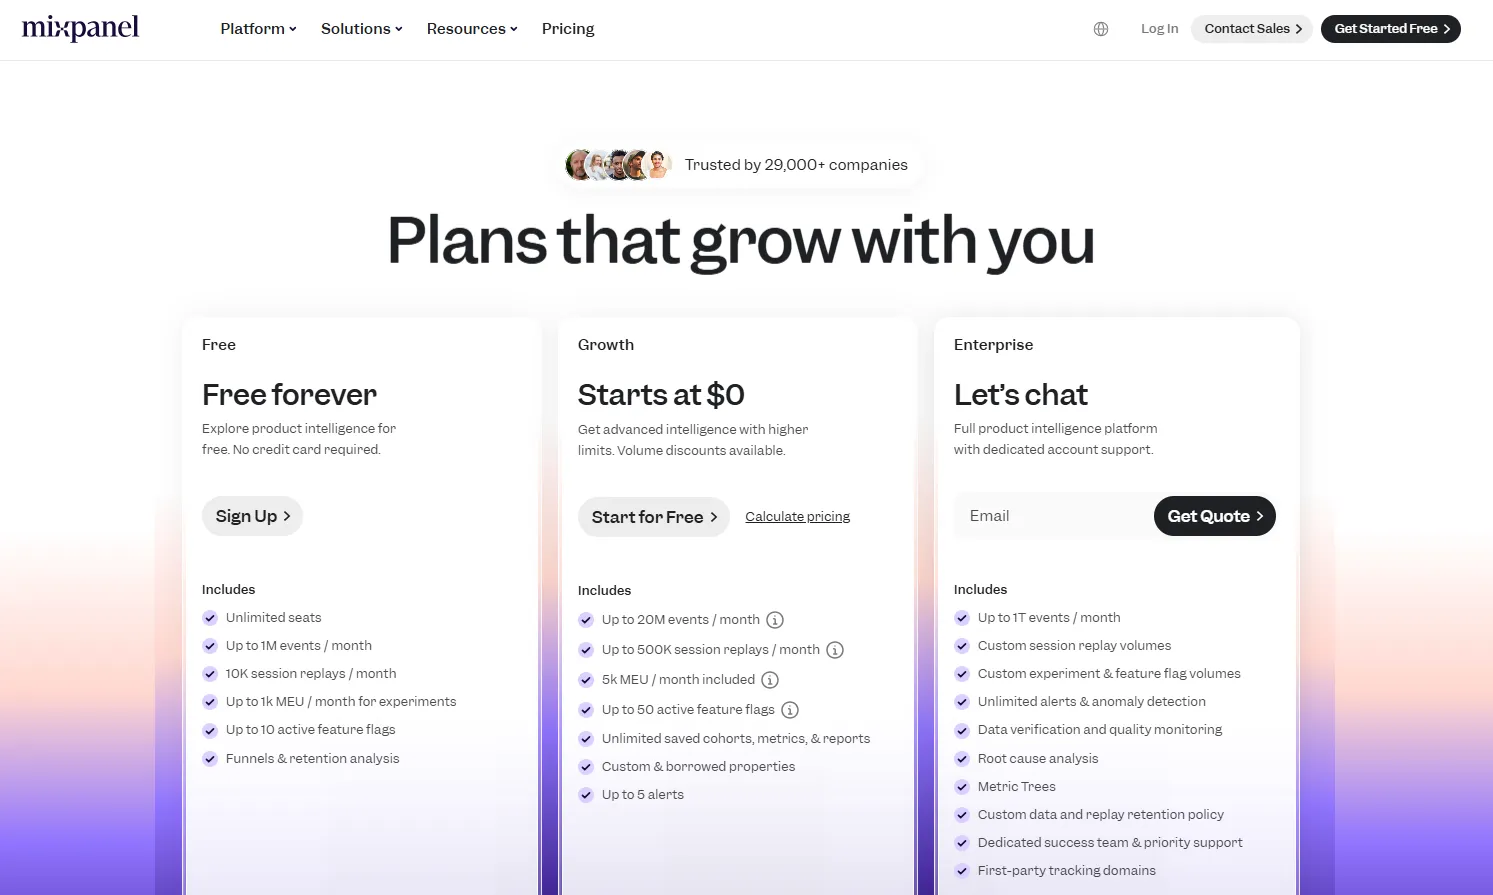
Event volume drives everything, across three tiers:
- The free plan runs to 1 million events a month with unlimited seats, 10,000 session replays, and five saved reports per seat.
- Growth starts at $0, keeps the first million events free each month, and scales to 20 million, unlocking unlimited saved reports and cohorts along with alerts.
- Enterprise reaches 1 trillion events a month and adds anomaly detection, root cause analysis, metric trees, SAML SSO, and a dedicated success team, priced on request.
Mixpanel pros and cons
✅ Unlimited seats mean another marketer costs nothing to add, whatever tier you are on.
✅ Campaign reporting and multi-touch attribution appear in the standard feature set, not as paid upgrades.
❌ Group analytics is an add-on on both free and Growth plans, which is the feature B2B teams need to analyse by account.
❌ Data pipelines are also an add-on, so warehouse delivery costs more than the tier price suggests.
#6: Matomo
Best for: Teams with data residency obligations who want analytics on infrastructure they control.
Similar to: Google Analytics 4, Adobe Analytics.
Since 2007, Matomo has offered web analytics that organisations run on their own servers or from Matomo's European cloud, keeping visitor data out of third-party advertising ecosystems.
The self-hosted edition is free for unlimited traffic and users, and no plan samples data.
Matomo's top features
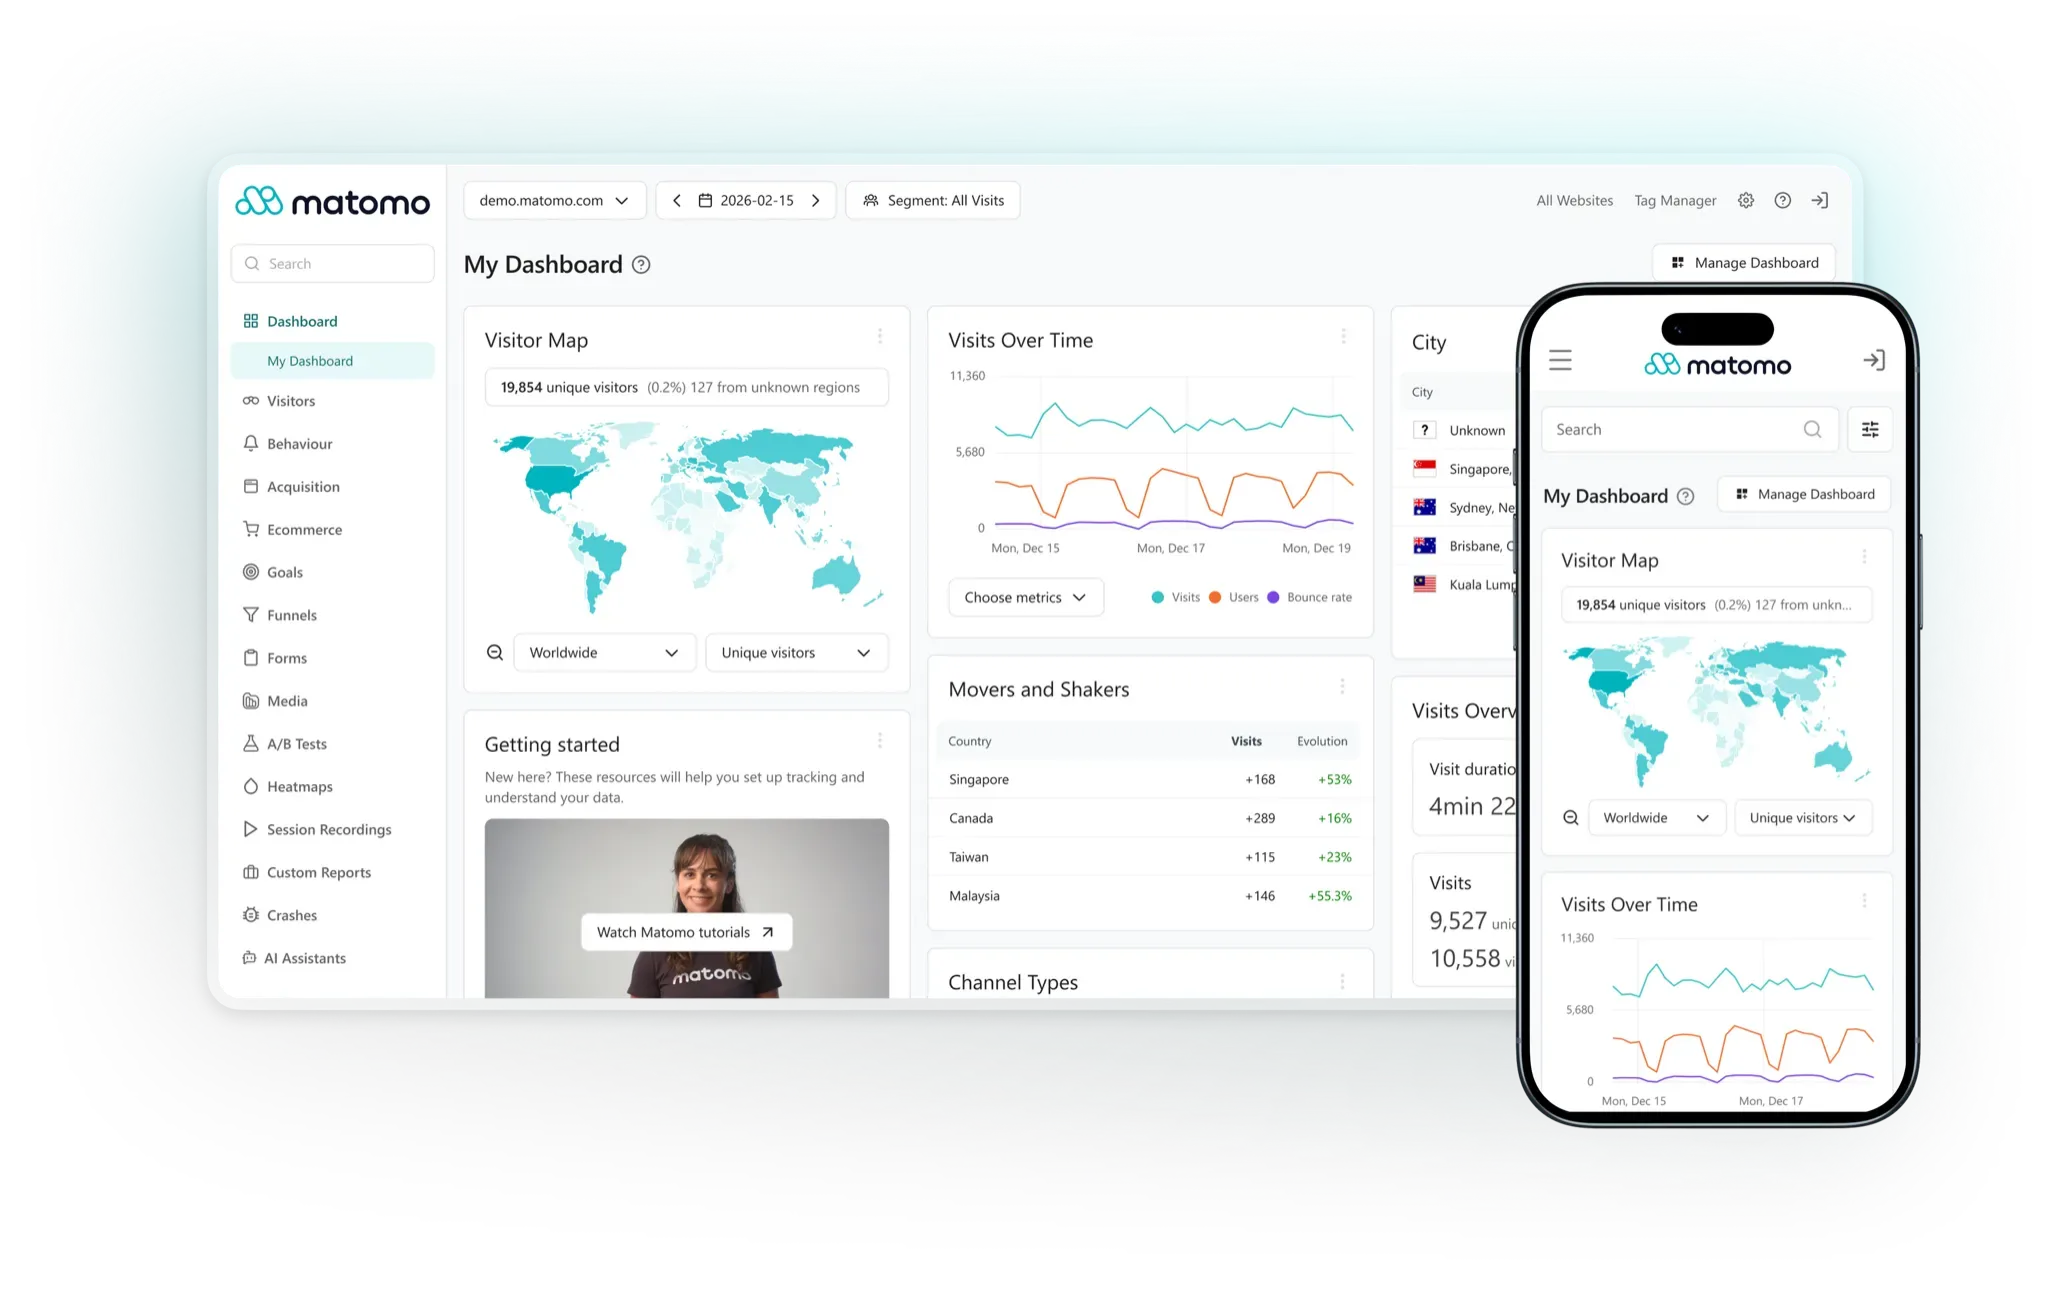
- Ownership and hosting choice: The self-hosted Community edition is free forever with unlimited hits and users, and the managed Cloud option keeps data in Europe with ISO 27001 certification behind it.
- Multi-channel conversion attribution: Credit gets assigned across the channels that touched a conversion, available on Cloud and on the Business bundle upwards for self-hosted deployments.
- Behavioural analysis add-ons: Heatmaps, session recordings, funnels, form analytics, and A/B testing come as premium plugins, bundled by tier for on-premise or included in Cloud.
- AI Assistants report and no sampling: Matomo reports on traffic arriving from AI assistants.
Matomo pricing
Matomo prices its two hosting options differently.
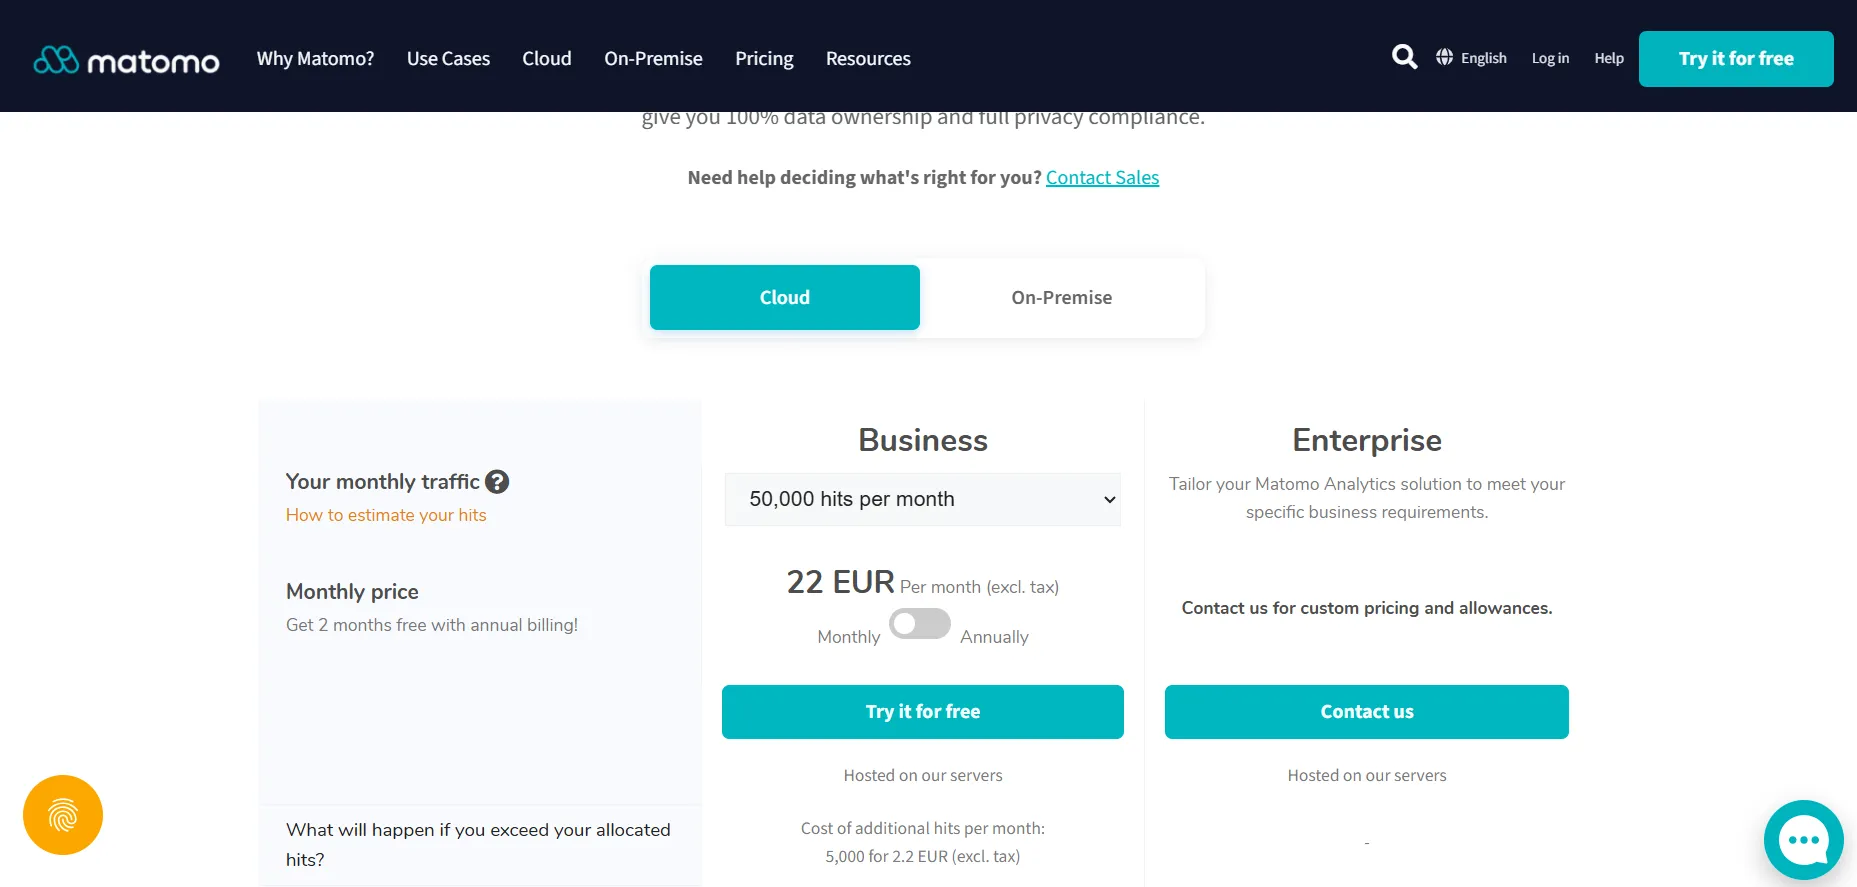
- Matomo Cloud publishes one figure, €22 a month excluding tax for 50,000 hits, covering 30 websites and 30 team members with 24 months of raw data retention. Going over that allowance costs €2.20 per additional 5,000 hits.
- Above 10 million hits a month, Cloud moves to a custom Enterprise arrangement. Annual billing gives two months free.
- The free option is the self-hosted edition: The Community edition costs nothing for unlimited users and hits.
- Paid plugin bundles start at €230 a month for Team on annual billing, covering up to 4 users and 5 million hits, then €1,209 for Business and €2,834 for Enterprise. Paying monthly instead lists at €275, €1,450 and €3,400.
Matomo pros and cons
✅ The self-hosted Community edition carries no licence fee for unlimited traffic or users, and applies no sampling at any volume.
✅ European hosting and complete data ownership answer the compliance questions that rule out other options.
✅ ISO 27001 certification backs both.
❌ Matomo Cloud publishes only its entry tier, so anything past 10 million hits a month needs a sales conversation.
#7: HubSpot Marketing Hub
Best for: Marketing teams already running their contact database in HubSpot.
Similar to: Dreamdata, Adobe Analytics.
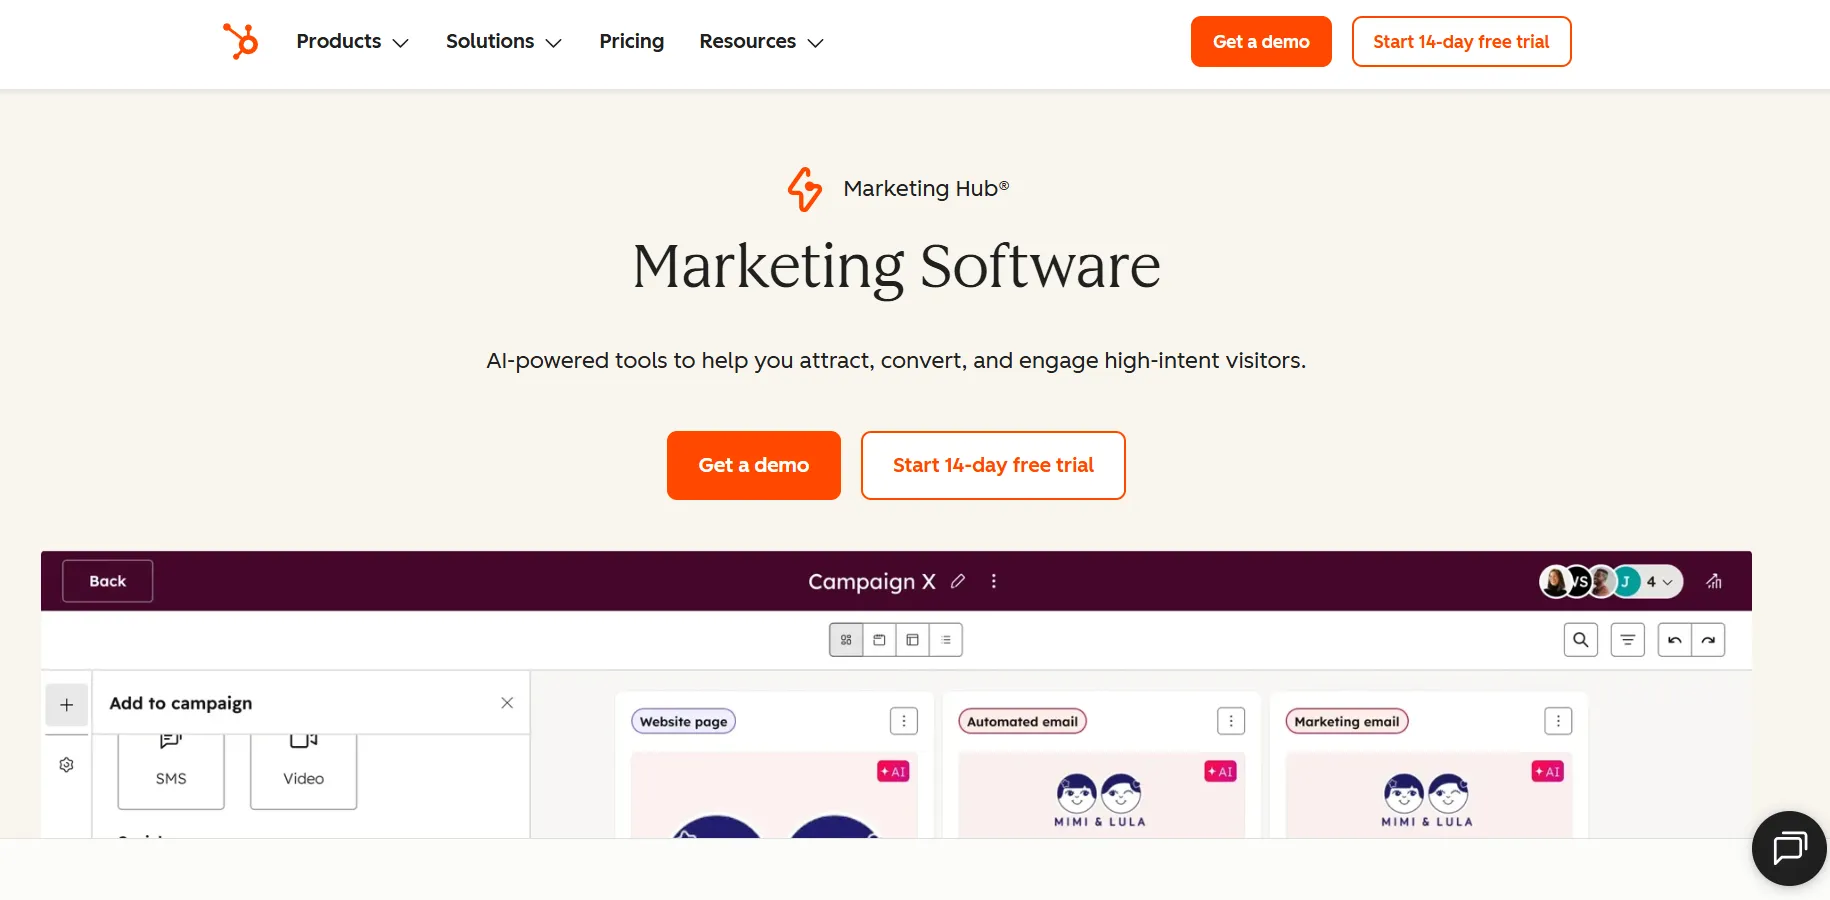
For teams already running their contact database in HubSpot, Marketing Hub keeps campaign reporting and attribution beside the records being scored.
HubSpot Marketing Hub's top features
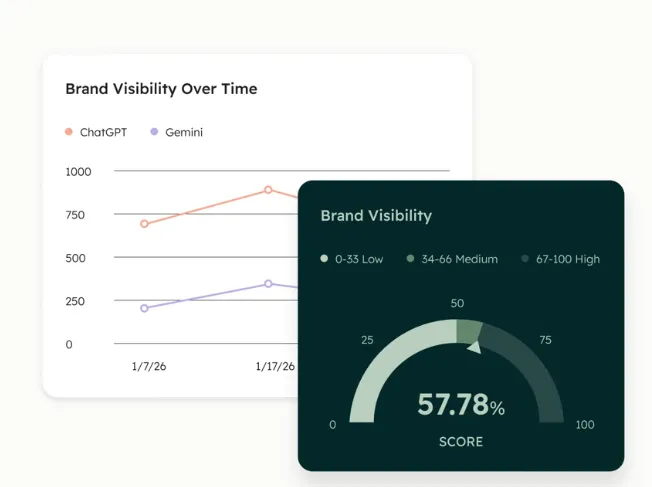
- Campaign reporting: Marketing emails, paid ads, social posts, and site content group into a campaign so performance rolls up against a goal, with 5,000 campaigns per account on Professional and 10,000 on Enterprise.
- Multi-touch revenue attribution: An Enterprise feature tracking up to 10,000 logged interactions per contact.
- Professional includes campaign reporting and customisable website traffic analytics, but not revenue attribution.
- Customer journey analytics: An Enterprise report that visualises touchpoints with conversion rates and timing between them, holding up to 15 stages and 20 million events.
HubSpot Marketing Hub pricing
HubSpot Marketing Hub has three paid editions, and the price difference between them is substantial.
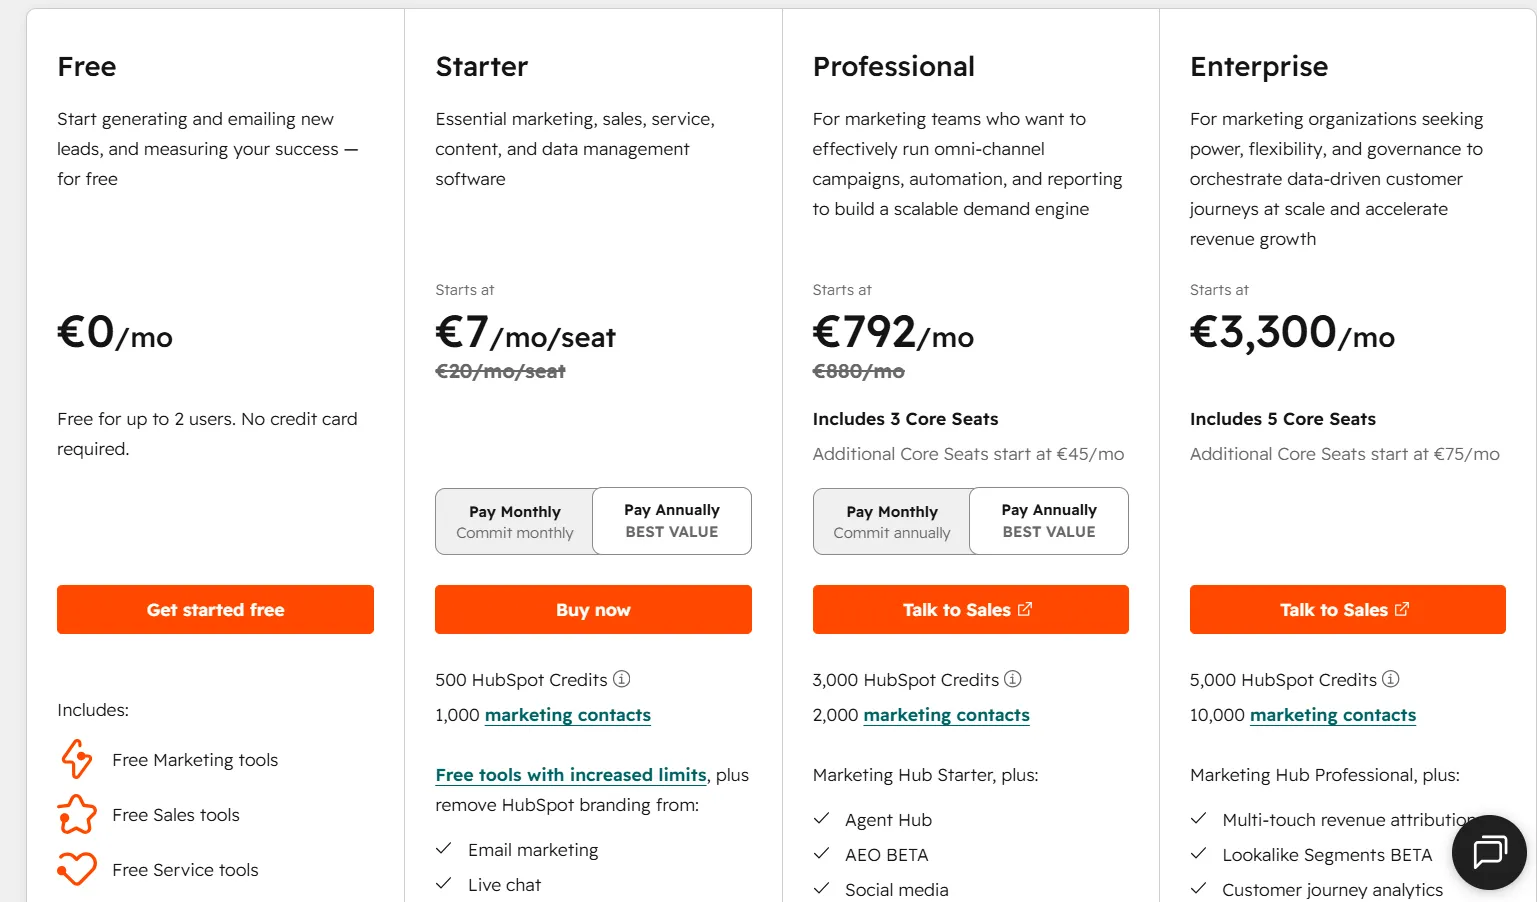
- Starter begins at $20 per seat monthly and includes 1,000 marketing contacts. Additional contacts cost $50 per thousand at first, easing to $40 per thousand above 5,000.
- Professional starts at $890 a month with three core seats and 2,000 marketing contacts, and requires a one-time onboarding fee.
- Enterprise starts at $3,600 a month for five core seats and 10,000 marketing contacts, billed annually. Additional core seats run $20 a month on Starter and $50 on Professional. Enterprise seats cost $75. Also requires a one-time onboarding fee.
- Every edition also carries a HubSpot Credits allowance for the AI agents that draw on them, with 500 on Starter and 3,000 on Professional, rising to 5,000 on Enterprise. Further credits cost around $9 per thousand on annual billing.
HubSpot Marketing Hub pros and cons
✅ Campaign performance and attribution report from the same dataset as the contact records they score, so no pipeline work stands between a marketer and the answer.
✅ Starter is one of the cheapest published entry points here for a team that also needs the CRM.
❌ Multi-touch revenue attribution and customer journey analytics require Enterprise, which is beyond most smaller marketing budgets.
#8: Dreamdata
Best for: B2B marketing teams connecting ad spend to pipeline across a buying committee.
Similar to: HubSpot Marketing Hub, Amplitude.
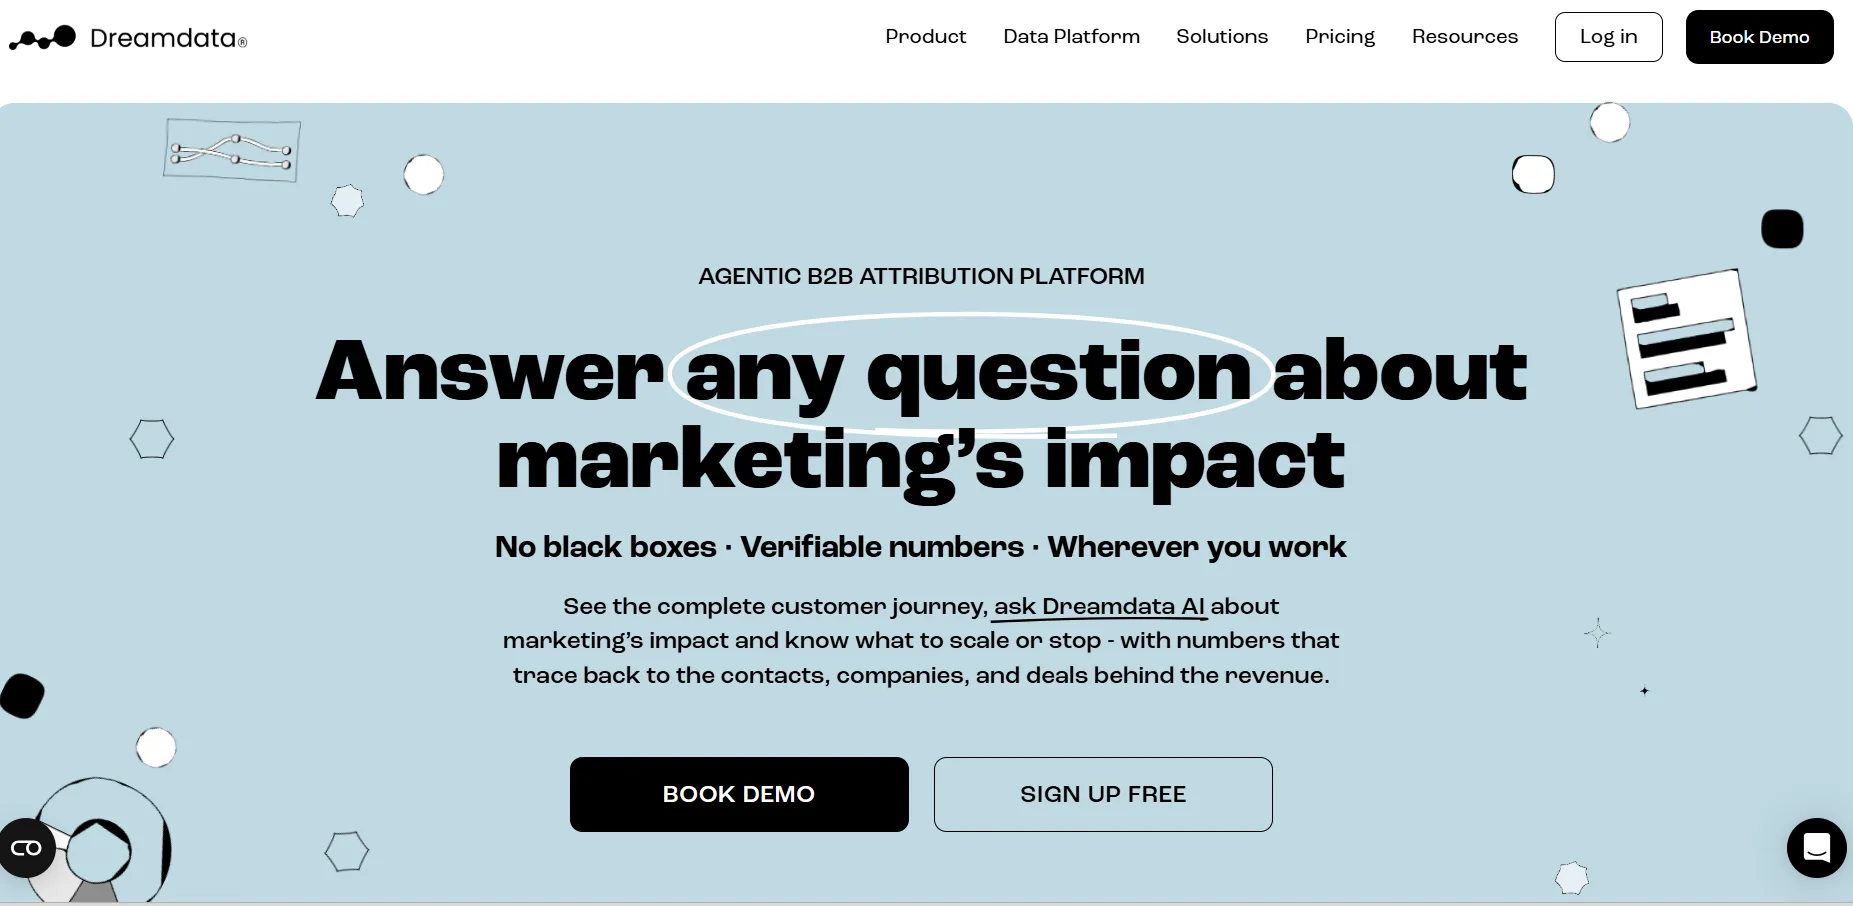
A Copenhagen-based attribution platform, Dreamdata connects advertising spend to closed revenue at the account level, which matters when several people share a single purchase decision.
Monthly tracked users drive the pricing, and a permanent free tier covers B2B web analytics before any contract exists.
Dreamdata's top features
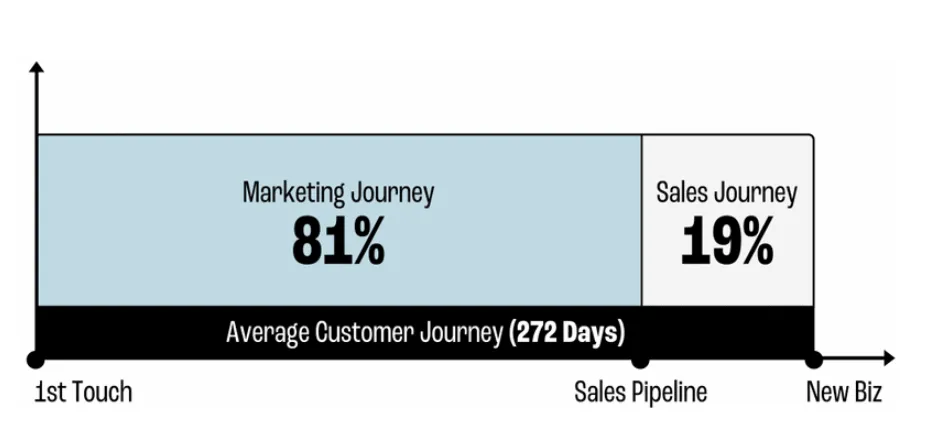
- Company identification: Dreamdata says its proprietary IP-to-company resolution engine identifies up to 80% of companies visiting your site.
- Unified journey model: Touchpoints from your website, marketing automation platform, CRM, and ad accounts merge into one account-based journey, whether the visitor was identified or entirely anonymous.
- Performance attribution: AI-based and custom attribution models measure marketing impact, with revenue and content analytics alongside custom ROI and ROAS reporting.
- Analytics Agent and MCP server: Questions get answered in everyday language without waiting on ops.
Dreamdata pricing
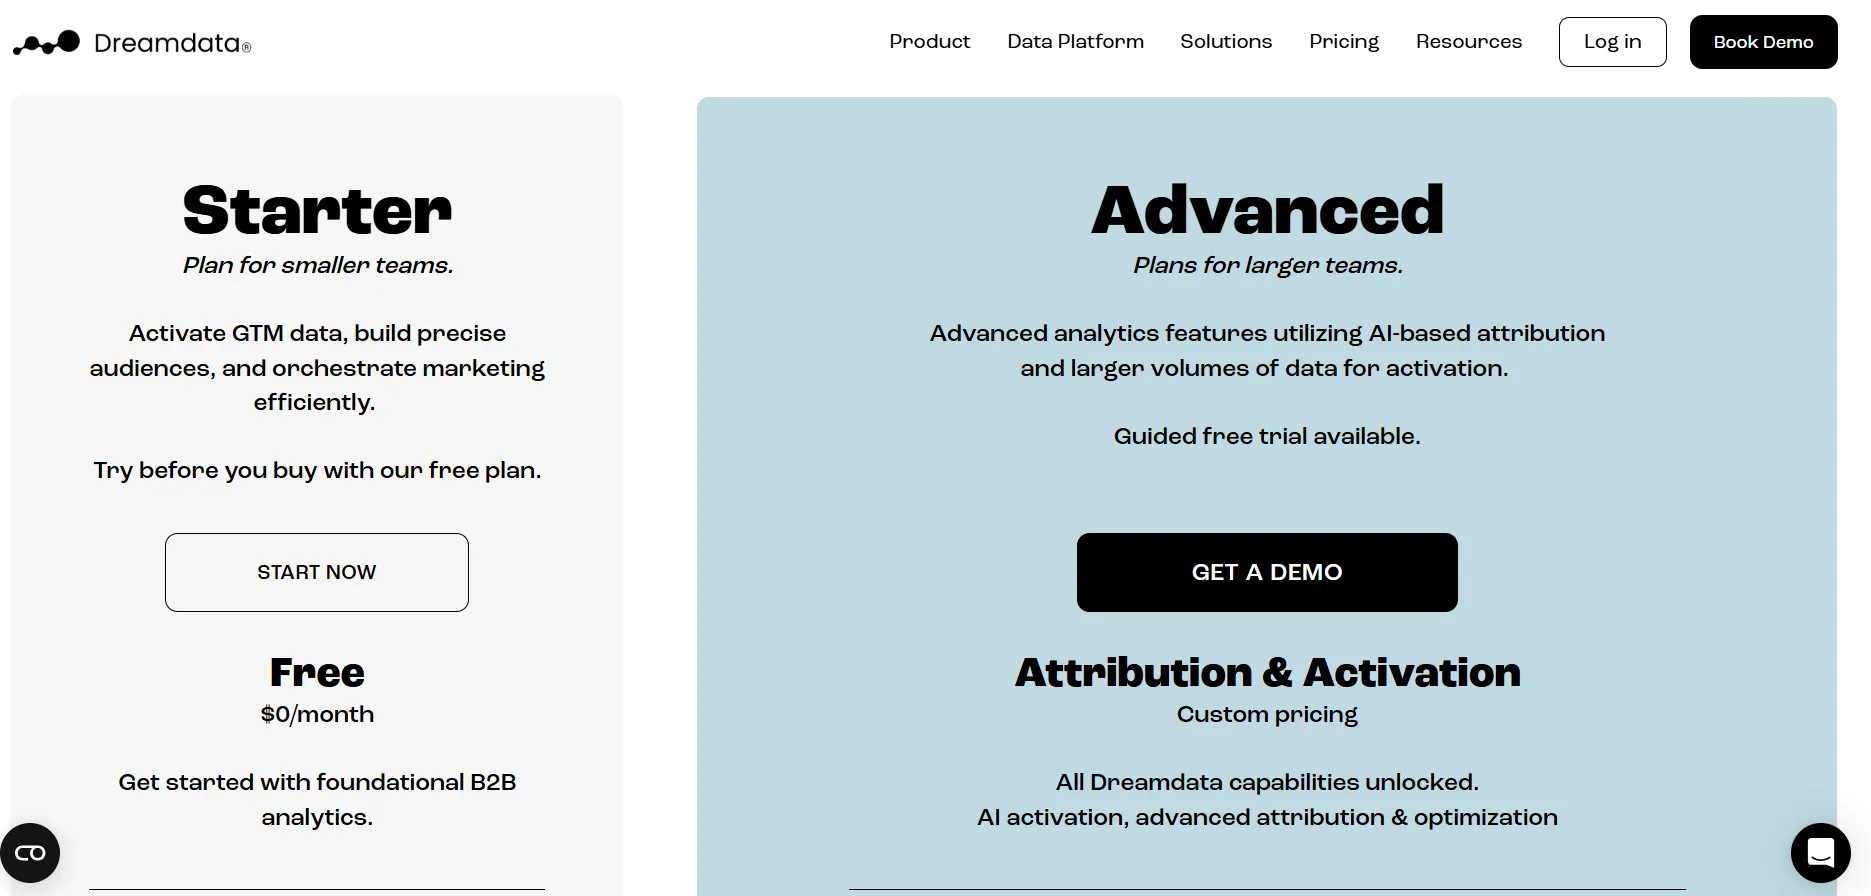
The current pricing page shows two options, and only one has a figure:
- Dreamdata Free costs nothing and includes B2B web analytics, cookie and cookieless tracking, engagement scoring, company identification, the audience builder, Slack and Teams notifications, and B2B benchmarks. Limits are two months of user history, five seats, three stage models, two notifications, and one sync.
- The Attribution and Activation tier carries no figure: It unlocks custom attribution models, revenue and content analytics, AI report summaries, and advanced data controls including SSO. Activation and data warehouse access are sold as add-ons. Full onboarding, a dedicated CSM, a dedicated technical manager, solutions consulting, and data science support come with it.
Dreamdata pros and cons
✅ Account-level resolution and a free tier that includes company identification let you see which companies visit before committing to anything.
✅ The paid tier is sold with hands-on implementation help, which matters given how much CRM and ad-platform wiring attribution depends on.
❌ The free tier holds two months of history and five seats, which is enough to see traffic but not to model attribution over a B2B sales cycle.
#9: Data Studio
Best for: Marketing teams reporting on Google sources who want dashboards at no cost.
Similar to: Supermetrics, Google Analytics 4.
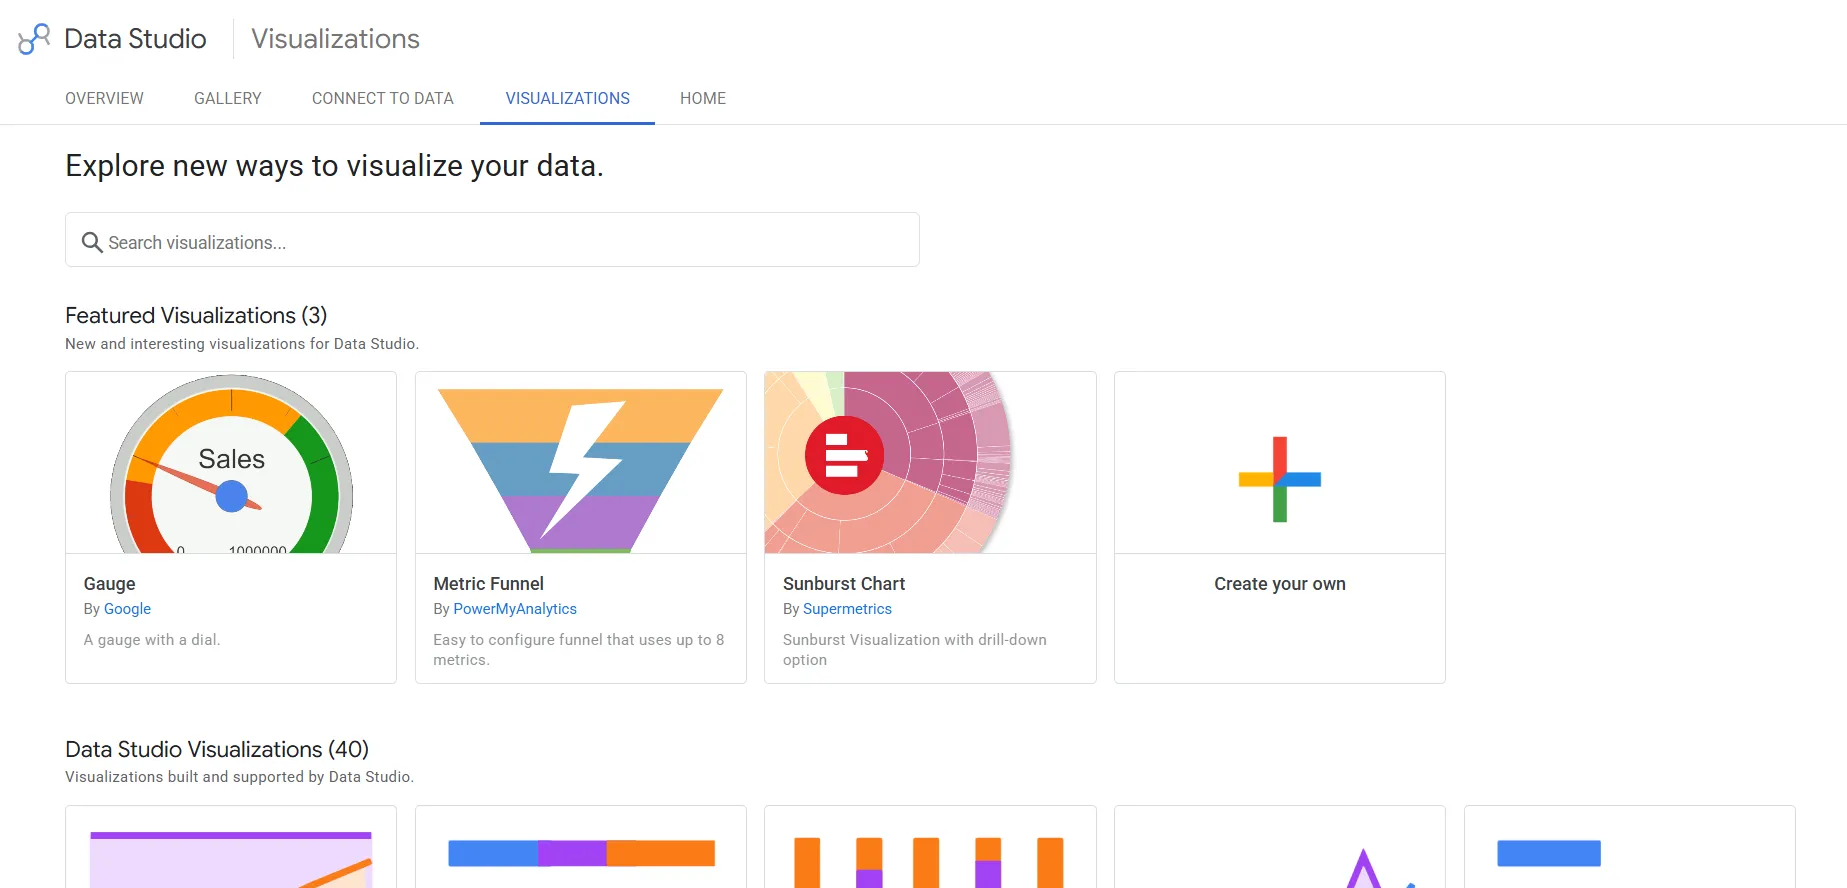
What Google now calls Data Studio is the free reporting layer over Google Analytics 4, Google Ads, BigQuery, Search Console, and several hundred partner sources.
Google renamed Looker Studio back to Data Studio during 2026.
Its documentation now carries a banner confirming the change, so both names point to the same product.
Data Studio's top features
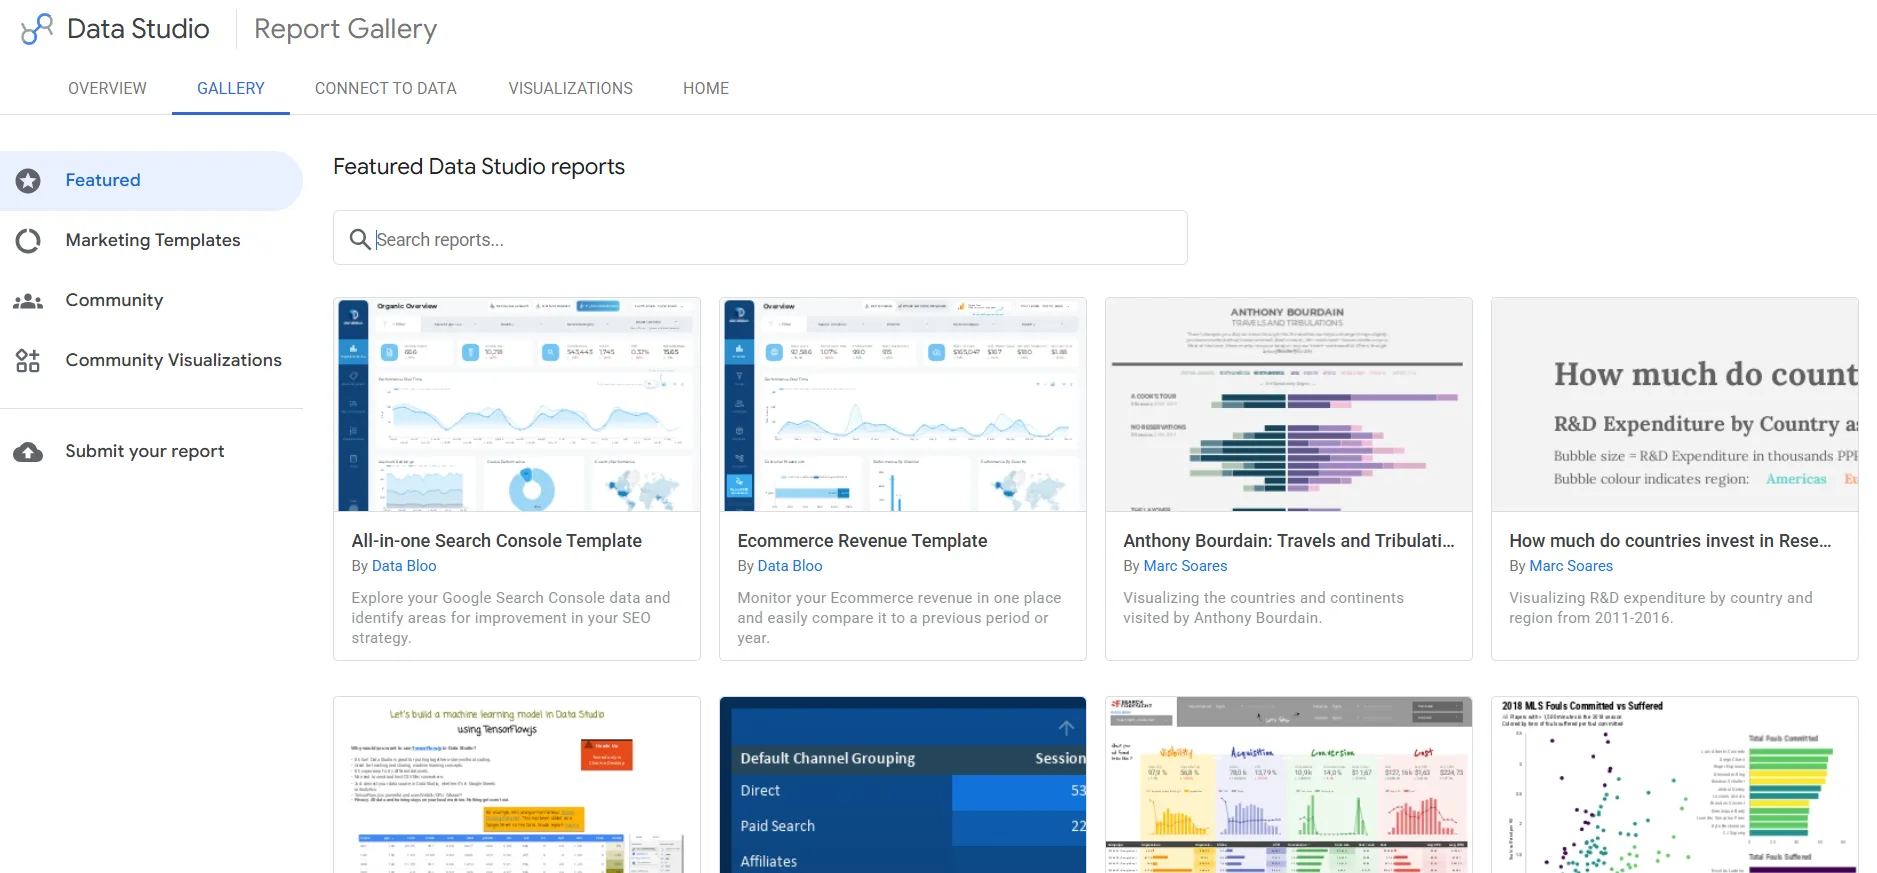
- Free report building: Unlimited reports and dashboards across 21 Google-built connectors, with scheduled email delivery and sharing included at no charge.
- Roughly 1,390 partner connectors reach everything outside Google, and around 40 native chart types cover the drawing.
- Delivery and alerts: Paid subscriptions allow up to 200 delivery schedules per report and alerts that fire when a chart meets a condition you set, with Google Chat available as a delivery target.
- Gemini and Conversational Analytics: Gemini answers questions about your data and writes calculated fields from a prompt, and Conversational Analytics adds data agents and a code interpreter.
Data Studio pricing
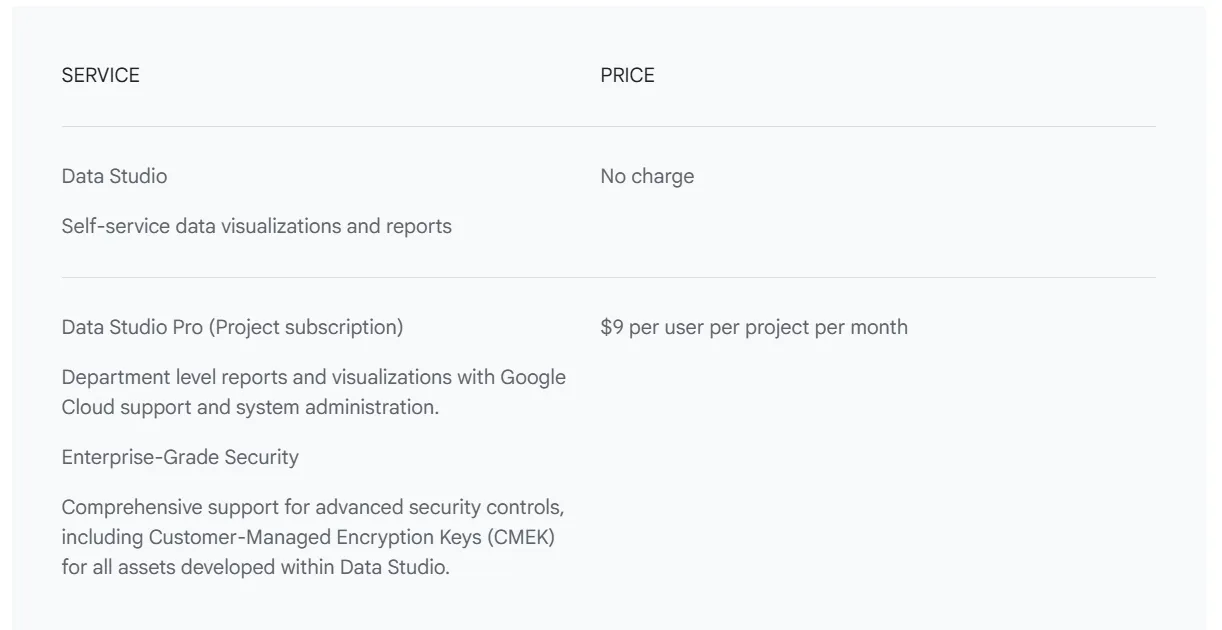
Data Studio has a free tier at $0 with unlimited reports, and one paid tier.
- Free: $0, including the option to build and share reports across every Google-built connector.
- Data Studio Pro: $9/user/month, billed per Google Cloud project. Report ownership shifts from the individual to your organization, and you pick up team workspaces, expanded scheduled delivery, Gemini features, and SLA-backed support.
Data Studio pros and cons
✅ The free tier is production-grade for Google-centric reporting, covering unlimited dashboards plus native Google Analytics 4 and BigQuery connections.
✅ Viewers never need a paid licence, so distributing a report to stakeholders costs nothing.
❌ Pro billing is per user per Google Cloud project and covers every licensed user, active or not, which multiplies quickly across client environments.
❌ Technical support requires both a Pro subscription and a separate Google Cloud support plan, and non-Google sources need third-party connectors bought elsewhere.
#10: Supermetrics
Best for: Teams whose campaign data needs moving out of ad platforms before anything can report on it.
Similar to: Data Studio, Dot.
Supermetrics, which says it serves more than 200,000 companies across 120 countries, pulls marketing data out of ad platforms and delivers it somewhere useful, whether that is a spreadsheet, a dashboard, a warehouse, or an AI assistant.
Supermetrics' top features
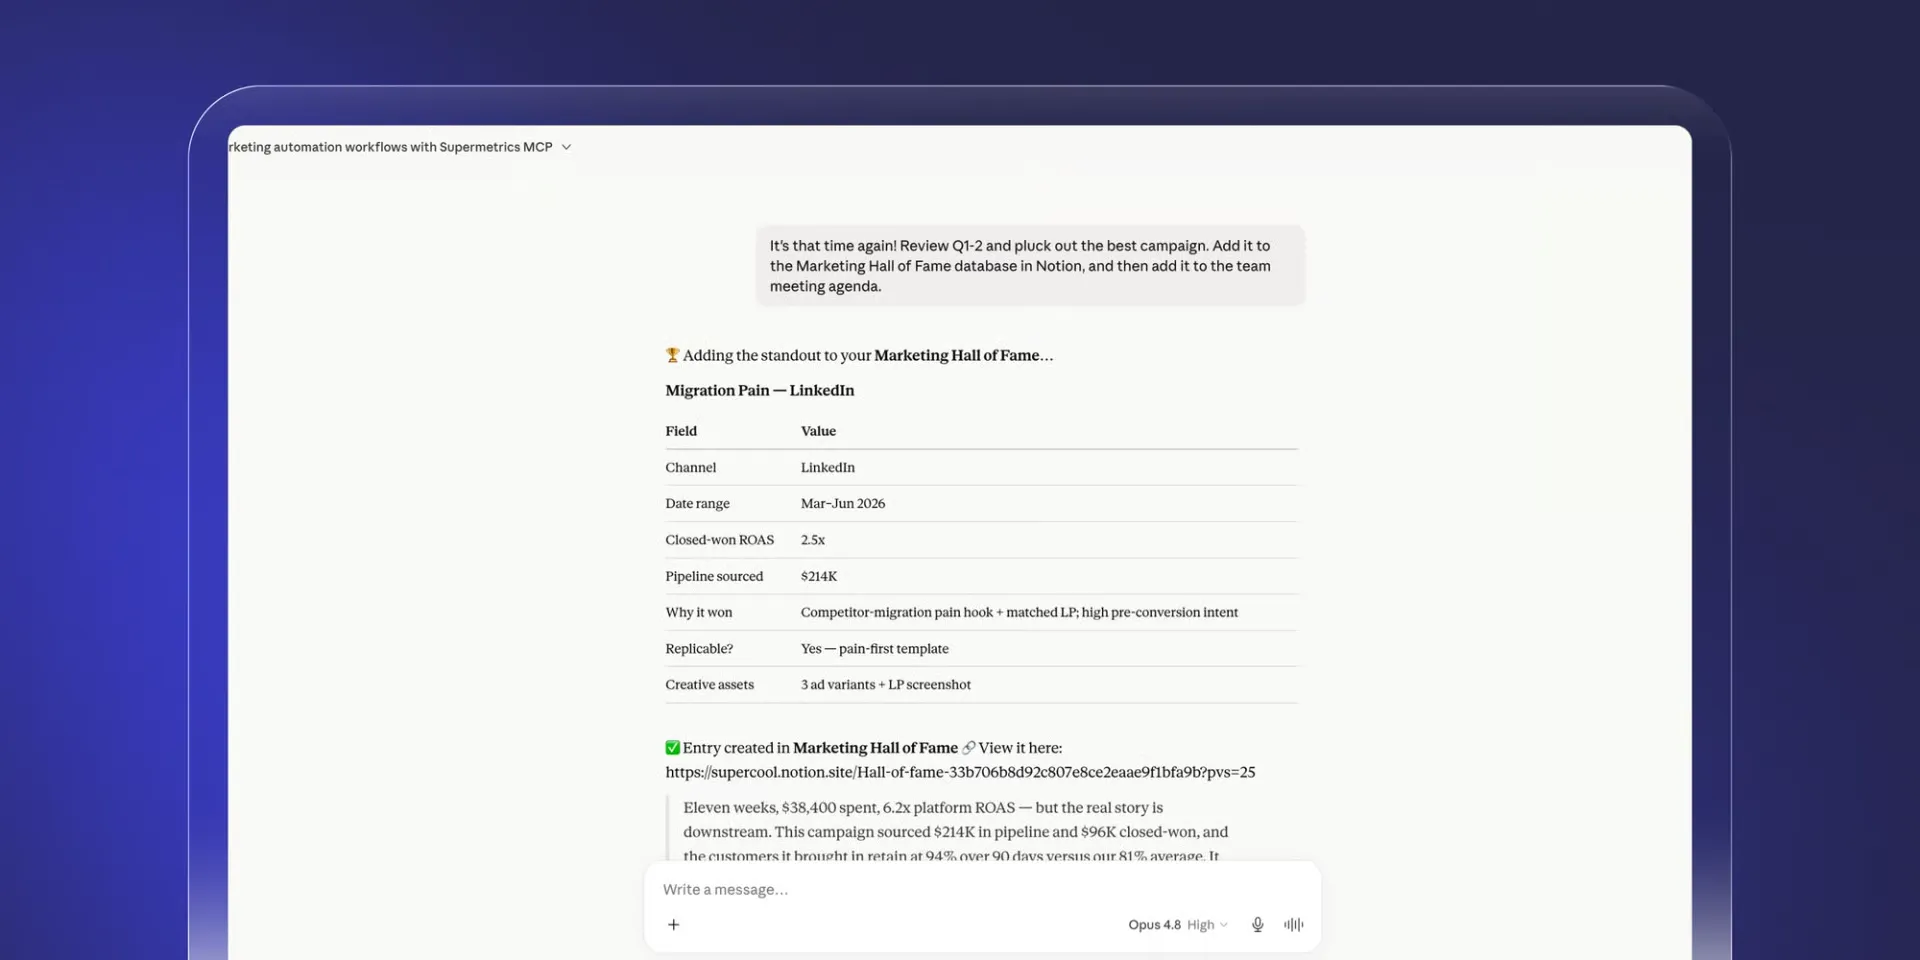
- Connector library: Sources span paid media, social, SEO, web analytics, ecommerce, and email platforms, covering the ad networks most marketing stacks already run on.
- Destination choice: Data lands in Google Sheets, Excel, Power BI, or Data Studio, which Supermetrics still lists under its former name of Looker Studio.
- Supermetrics Studio: A dashboard layer inside Supermetrics itself, with monthly AI credits rising from 4,000 on Starter to 18,000 on Pro.
- Warehouse delivery and transformations: Enterprise opens up Snowflake and BigQuery as destinations.
Supermetrics pricing
Four packages appear on the pricing page, and extras adjust each one upward.
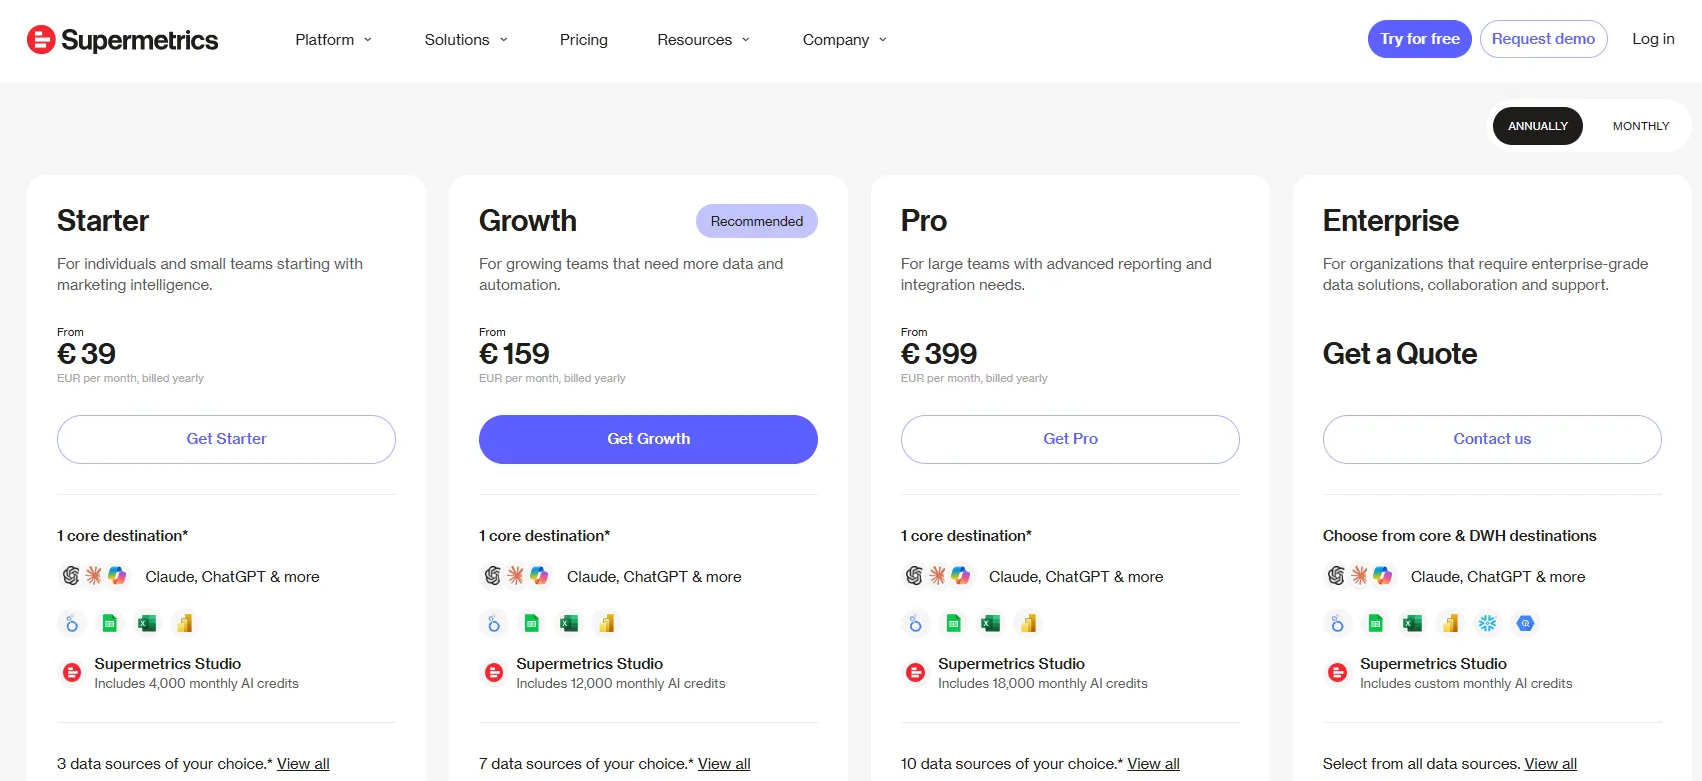
- Starter runs €39 a month billed yearly, covering one core destination, three data sources, one user, three accounts per source, and weekly refreshes on Google Sheets.
- Growth is €159 a month for seven data sources, two users, seven accounts per source, and daily refreshes.
- Pro costs €399 a month and covers ten data sources, three users, ten accounts per source, and hourly refreshes.
- Enterprise is quoted, adding Snowflake and BigQuery as destinations alongside custom limits, on-demand refreshes, SAML single sign-on, and a customer success manager.
Committing yearly saves 20%, and a 14-day trial needs no card.
Supermetrics pros and cons
✅ The connector library is wide enough to cover most marketing stacks without custom API work.
✅ No plan charges data volume fees.
✅ ChatGPT, Claude, Microsoft Copilot, and the usual spreadsheets and BI tools all work as delivery destinations.
❌ Warehouse destinations are Enterprise-only.
Get started with Dot for free
Those are the 10 best marketing analytics tools in 2026, between them covering web measurement, behavioural analysis, revenue attribution, and the collection layer that feeds all of it.
Dot addresses this differently.
Our AI data analyst analyses the marketing data your pipelines already deliver and reports its findings in the channels your team already uses.
A Dot subscription gives a marketing team the following:
- Written answers with a recommended action, delivered back into Slack, Microsoft Teams, email, or the web app.
- Deep Analysis for questions a single query cannot settle, with the assumptions written down alongside the conclusion.
- Scheduled campaign and performance reviews built from live data, exportable straight to PowerPoint.
- Playbooks that encode how your team groups channels, splits prospecting from retargeting, defines ROAS, and handles UTM tracking, applied identically every time.
- Root, the Context Agent, keeping one definition per metric as the team and the data grow.
- No seat charges on any paid plan, so the bill tracks the volume of analysis run and not the number of people licensed.
➡️ Get started for free with Dot's free plan, or schedule a demo to see how it works with your data.
⚠️ Disclaimer: This article was last updated on September 1 2026. If you spot any inaccuracies, please do contact us, and we'll fact-check it.
Theo Tortorici
Theo writes about AI-powered analytics, data tools, and the future of business intelligence at Dot.