
Power BI Semantic Model: What It Is & How To Build One In 2026
A Power BI semantic model is the layer between your data and your reports: the tables, the relationships between them, and the DAX measures that define numbers like revenue or gross margin, plus names, descriptions and security rules. Every Power BI report reads from one, and Copilot, Fabric data agents and outside AI analysts query it too. Microsoft called semantic models "datasets" until November 2023. How well the measures are named and described decides whether an AI picks the right number.
Part of the model | What it does | In the worked example below |
Tables | Hold the data: facts (events) and dimensions (things you slice by) | Sales, Date, Product, Customer |
Relationships | Tell the engine how filters travel between tables | Sales to Date on order date (active) and ship date (inactive) |
Measures (DAX) | Define each business number once | [Total Sales], [Gross Margin %], [Sales YoY %], [Shipped Sales] |
Metadata | Names, descriptions, hidden flags, formats, display folders | Raw price and cost columns hidden; every measure described |
Security roles | Row-level security rules written in DAX | Not used here |
What is a semantic model?
A semantic data model describes data in business terms: it says "customer", "order" and "gross margin" where the database says cust_id, fct_order_line and a formula someone keeps in a spreadsheet, and it records how the things relate and how to calculate them. In Power BI, that is a tabular model on the Analysis Services engine. A report never queries your warehouse directly; it asks the model, and the model answers with its own definitions.
Semantic model vs. dataset
They are the same thing. Microsoft renamed Power BI datasets to semantic models in November 2023, in Power BI and Fabric, to better reflect the Analysis Services models underneath. A few things kept the old name, including the REST API operations, which is why API calls and older tutorials still say "dataset".
Semantic model vs. semantic layer
A semantic layer is the general pattern: define metrics once so every tool computes them the same way. In a Power BI shop, the semantic model is the semantic layer, scoped to one model. Looker puts the same idea in LookML, dbt in MetricFlow, and Cube and Malloy in their own modeling languages.
A worked example: a small sales model
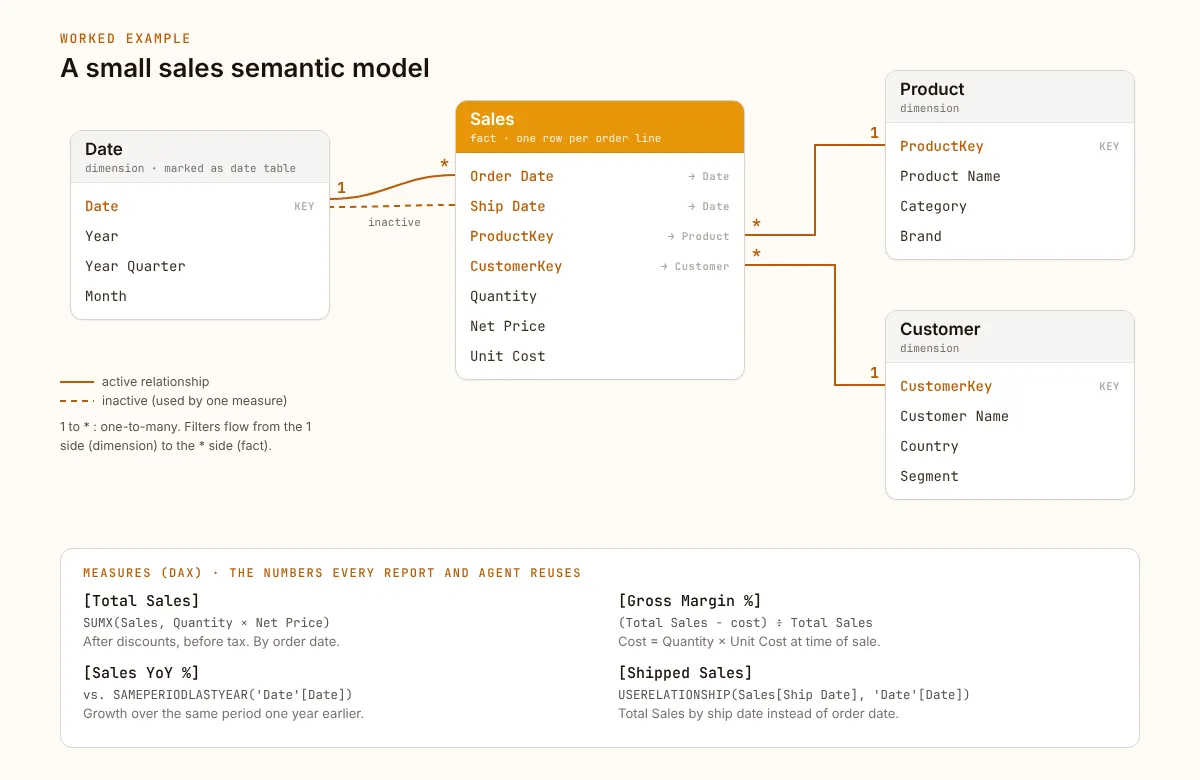
This is a textbook star schema, the shape Microsoft recommends for Power BI: one fact table in the middle, dimensions around it.
Step 1: the tables
- Sales (fact): one row per order line, with Order Date, Ship Date, ProductKey, CustomerKey, Quantity, Net Price and Unit Cost.
- Date (dimension): one row per day, with Year, Year Quarter and Month, marked as the model's date table so time-intelligence functions behave.
- Product (dimension): ProductKey, Product Name, Category, Brand.
- Customer (dimension): CustomerKey, Customer Name, Country, Segment.
The raw numeric columns in Sales (Quantity, Net Price, Unit Cost) and the key columns are hidden, so people and AI agents use the measures built on them instead of summing the columns themselves.
Step 2: the relationships
- Sales[Order Date] to 'Date'[Date]: many-to-one, active.
- Sales[Ship Date] to 'Date'[Date]: many-to-one, inactive. Only one relationship between two tables can be active, so the second date role waits until a measure switches it on.
- Sales[ProductKey] to 'Product'[ProductKey]: many-to-one.
- Sales[CustomerKey] to 'Customer'[CustomerKey]: many-to-one.
All four filter in one direction, from the dimension (the "one" side) to the fact (the "many" side). Pick Category = Bikes in a slicer and every measure only sees bike order lines.
Step 3: the measures
Total Sales =
SUMX ( Sales, Sales[Quantity] * Sales[Net Price] )

Gross Margin % =
VAR SalesAmount = [Total Sales]
VAR Cost = SUMX ( Sales, Sales[Quantity] * Sales[Unit Cost] )
RETURN
    DIVIDE ( SalesAmount - Cost, SalesAmount )

Sales YoY % =
VAR PriorYear =
    CALCULATE ( [Total Sales], SAMEPERIODLASTYEAR ( 'Date'[Date] ) )
RETURN
    DIVIDE ( [Total Sales] - PriorYear, PriorYear )

Shipped Sales =
CALCULATE ( [Total Sales], USERELATIONSHIP ( Sales[Ship Date], 'Date'[Date] ) )
A measure has no fixed value. It is evaluated in whatever filter context the visual or query sets: [Total Sales] for Bikes in 2025 is one number, for Germany last quarter another. The formula is written once and every slice reuses it. Each measure also gets a description in the Properties pane, such as "Quantity × net price, after discounts, before tax. Dated by order date." for [Total Sales].
Step 4: what a report sees
Drop Category on rows, Year on columns, and [Total Sales] and [Gross Margin %] into a matrix. Power BI turns that visual into a DAX query against the model, roughly this (Performance Analyzer in Desktop shows the real one, which is longer):
EVALUATE
SUMMARIZECOLUMNS (
    'Product'[Category],
    'Date'[Year],
    "Total Sales", [Total Sales],
    "Gross Margin %", [Gross Margin %]
)
The report never knows how margin is calculated. It asks for [Gross Margin %] by Category and Year, and the model does the rest.
Step 5: what an AI agent sees
An AI agent has no visual to drag fields into. It reads the model's metadata and writes the DAX itself, from something like this:
Semantic model: Sales Analytics  (workspace: Finance)

Columns
  'Date'[Year]             integer
  'Date'[Year Quarter]     text, e.g. "2026-Q3"
  'Product'[Category]      text
  'Customer'[Country]      text
  'Customer'[Segment]      text

Measures
  [Total Sales]      Quantity × net price, after discounts, before tax. By order date.
  [Gross Margin %]   (Total Sales − cost) ÷ Total Sales. Cost at time of sale.
  [Sales YoY %]      Total Sales vs. the same period one year earlier.
  [Shipped Sales]    Total Sales by ship date instead of order date.

Relationships
  Sales[Order Date]   → 'Date'[Date]         many-to-one, active
  Sales[Ship Date]    → 'Date'[Date]         many-to-one, inactive
  Sales[ProductKey]   → 'Product'[ProductKey]
  Sales[CustomerKey]  → 'Customer'[CustomerKey]
The hidden columns are not in the list, so the agent can't sum them by accident. Ask it "Which product category's gross margin fell most in Q3 2026 compared with Q3 2025?" and a well-behaved agent writes something like:
DEFINE
    MEASURE Sales[Margin PY] =
        CALCULATE ( [Gross Margin %], SAMEPERIODLASTYEAR ( 'Date'[Date] ) )
EVALUATE
SUMMARIZECOLUMNS (
    'Product'[Category],
    TREATAS ( { "2026-Q3" }, 'Date'[Year Quarter] ),
    "Margin", [Gross Margin %],
    "Margin last year", [Margin PY],
    "Change", [Gross Margin %] - [Margin PY]
)
ORDER BY [Change] ASC
It did not invent a margin formula: it reused [Gross Margin %] and added only the year-over-year shift. Its job is to pick the right measure and filters, which is easy with four described measures. With [Margin], [GM %], [Gross Margin % (old)] and no descriptions, the agent is guessing, and so is every new analyst.
Import vs DirectQuery vs Direct Lake
Every table in a semantic model has a storage mode. It decides where the data sits when a query runs, not how the model is defined: the same DAX works in all three.
Storage mode | Where the data sits at query time | Freshness | Where it's available |
Import | A compressed copy in the model's memory (the VertiPaq engine) | As of the last refresh: up to 8 a day on Pro, 48 on Premium Per User | Every license; models up to 1 GB on Pro, 100 GB on Premium Per User |
DirectQuery | In the source database; each visual sends it a query | Live | Every license; speed depends on the source |
Direct Lake | Delta tables in OneLake, loaded into memory as queries need them | Reads the Delta tables, with no import copy to schedule | Workspaces on Fabric capacity |
Per Microsoft's Direct Lake overview, Direct Lake on SQL endpoints can fall back to DirectQuery and cannot be mixed with Import tables. Direct Lake on OneLake has no fallback, can sit in a composite model next to Import or DirectQuery tables, and became generally available in the Power BI March 2026 update. For AI, storage mode changes speed and cost, not the answer. Costs by license are in our Power BI pricing breakdown and Microsoft Fabric pricing.
Where semantic models live, and how tools reach them
You author a model in Power BI Desktop and publish it to a workspace in the Power BI service, where other reports can connect to it and people with Build permission can build on it. In a Fabric workspace, a model can also sit on a lakehouse or warehouse. What else can reach it depends on the workspace's license mode.
The XMLA endpoint
The XMLA endpoint is the Analysis Services protocol, exposed per workspace at an address like powerbi://api.powerbi.com/v1.0/myorg/Finance. Tabular Editor, DAX Studio, SQL Server Management Studio and third-party AI agents use it to read a model's metadata and run queries. According to Microsoft's XMLA documentation:
- It exists for workspaces on Premium Per User, Premium capacity, Fabric capacity and Embedded capacity. Pro workspaces don't have one.
- In a Premium Per User workspace, the user or app that connects needs a PPU license.
- Reading a model through XMLA requires Build permission on that model.
- The tenant setting "Allow XMLA endpoints and Analyze in Excel with on-premises semantic models" must be on.
- Since June 9, 2025, Power BI and Fabric capacities default to XMLA read/write; admins can set a capacity back to read-only, which is all reading metadata and running queries needs.
Workspace license mode (as of October 2026) | XMLA endpoint | Copilot in Power BI | GetDot |
Pro | No | Only through a Fabric Copilot capacity | No: the model can't be read, so it isn't indexed |
Premium Per User | Yes | Not with PPU alone; through a Fabric Copilot capacity | Yes |
Fabric capacity (F SKUs) or Premium capacity (P SKUs) | Yes | Yes, on paid F2 or larger, or P1 or larger (not trials) | Yes |
How AI uses a Power BI semantic model
Three kinds of AI read Power BI semantic models, and all three answer with DAX against your measures: Copilot, Fabric data agents, and outside agents that connect over XMLA or the REST API. Names and requirements are as of October 2026.
Copilot in Power BI
Copilot works in the report pane, where it answers questions about the open report, and in a standalone, full-screen experience (still labeled preview) that answers across any report or semantic model you can access.
To use it, the workspace needs paid Fabric capacity (F2 or larger) or Premium capacity (P1 or larger), not a trial. Pro and Premium Per User workspaces can get it through a Fabric Copilot capacity, an F2/P1-or-larger capacity designated to carry and bill a group's Copilot usage.
Microsoft's guidance for Copilot on semantic models says hidden measures and columns are excluded from its view, and recommends business-friendly names and descriptions. The Prep data for AI settings add an AI data schema (the subset of the model Copilot should use), verified answers and AI instructions; the standalone experience warns that answers may be poor on a model not marked as prepped for AI. Our Power BI Copilot vs GetDot comparison covers reach, surfaces and costs.
Fabric data agents
Fabric data agents became generally available in March 2026. A data agent answers questions over several Fabric sources, and for a semantic model source it generates DAX and runs it through the model's XMLA endpoint. Per Microsoft's setup docs, it needs paid F2 or larger capacity, or P1 or larger with Fabric enabled; Read permission on the model is enough to add it and ask questions, while Prep data for AI needs Write. One detail catches teams out: Microsoft's best practices for semantic models in data agents say model-specific guidance belongs in Prep data for AI, because the DAX generation step ignores the data agent's own instructions for semantic models.
How GetDot uses your semantic model
GetDot is an AI data analyst that answers in Slack, Teams, email, the web app or any MCP client. With a Power BI model it:
- Connects when an admin signs in with Microsoft, read-only by default, and syncs one workspace or all the account can see, on a schedule.
- Reads the model over XMLA: tables, columns, measures (with their DAX and descriptions), relationships, partitions and roles, skipping hidden fields and the date tables Power BI generates. Each model becomes one queryable unit, like a Looker explore.
- Traces lineage through each table's Power Query (M) partition, which names the source server, database, schema and table, so it can answer "where does this number come from?" and rebuild a metric in warehouse SQL.
- Answers in DAX against your measures through the Power BI REST API's executeQueries endpoint; asked "How is Net Revenue calculated?", it reads the measure's DAX.
- Applies access rules. Power BI's row-level security evaluates against the identity that connected, not the person asking, so Dot applies its own row-level rules, when you set them, as a DAX filter on each query.
Besides the capacity in the license table above, the "Dataset Execute Queries REST API" tenant setting must be on. Dot can read the exact value a report visual shows, but refuses visuals no DAX reproduces, such as decomposition trees, key influencers, Q&A and R or Python visuals. The same XMLA path covers Azure Analysis Services. Setup screens are in How Dot uses your Power BI semantic models and on the Power BI integration page; the free plan includes 300 one-time credits with the full Pro feature set, so you can connect a model to Dot for free.
What breaks when measures are undocumented
A semantic model fixes how a number is computed, not which number a question meant. People fill that gap from memory; an AI fills it from names and descriptions. On a 30-task slice of Adyen's DABstep benchmark, better configuration alone took Dot from 10% to 90% with the same underlying model.
Failure mode | What the AI does | Fix |
Ambiguous or duplicate names: [Revenue], [Sales Amt], [Total Sales 2] | Picks the one whose name sounds closest; two people asking the same question get two numbers | One measure per concept. Delete or hide the rest, and use the business name people actually say |
Implicit measures: numeric columns left visible and summed by default | Sums Sales[Net Price] or averages a ratio column instead of using the measure | Write explicit measures for anything people ask about, set default summarization to "Don't summarize" on prices, rates and IDs, and hide raw columns a measure covers |
Missing descriptions | Guesses whether [Active Customers] means 30 or 90 days, or whether [Revenue] includes tax | A description on every visible measure and on ambiguous columns: definition, unit, which date it uses, what's excluded |
Many-to-many and bi-directional relationships | Writes valid DAX that double counts across a bridge or follows an unexpected filter path | Bridge tables with one-to-many relationships, single-direction filters by default, and a described measure that handles the bridge |
Several date roles (order, ship, invoice) | "Sales in March" silently means order date | A measure per role, like [Shipped Sales], with the date named in its description |
Helper objects left visible: [_Base], [Sort Order], scratch measures | Treats a building block as a business metric | Hide them. Copilot and Dot both skip hidden fields |
What Microsoft's guidance adds
Microsoft's data agent guidance makes the same points: use business-friendly names, include only measures that calculate real business metrics, consolidate overlapping ones like Total Sales and Revenue, and avoid implicit measures, which it says produce unpredictable results. A good description answers what a new analyst would ask: "Revenue after discounts and returns, before tax. Excludes intercompany customers. Dated by invoice date." If Copilot drafts them, review each one: a generated description restates the DAX and cannot record the decision behind it.
For many-to-many, Microsoft's guidance recommends a bridging table with one-to-many relationships on both sides, and its bi-directional guidance says to keep two-way filtering to a minimum because it creates ambiguous filter paths.
Display folders and synonyms
Display folders help people browse a long field list; they don't replace descriptions, and not every AI tool reads them (Dot reads names, descriptions and DAX, not folders). Q&A synonyms and linguistic relationships belong to Q&A Setup, which Microsoft is retiring along with Q&A in December 2026, pointing users to Prep data for AI instead. Put alternative names in descriptions or AI instructions rather than building new Q&A synonyms.
A short audit before you point AI at a model
Apply the fixes in the table, then ask the ten questions your team gets most often through your AI tool and compare the answers with the report. None of this is AI-specific: it is what a new analyst needs on day one. For the broader setup, see our guide to conversational analytics; for other BI tools, our Power BI alternatives roundup.
FAQ
Yes. Microsoft renamed datasets to semantic models in November 2023, though the REST API operations still say "dataset".
Not with standard SQL. You query it with DAX, through the XMLA endpoint or the REST API's executeQueries operation; for SQL, query the warehouse tables underneath.
Not on its own. As of October 2026, Pro and Premium Per User users get Copilot only when an admin assigns them to a Fabric Copilot capacity.
Rick Radewagen
Rick is a co-founder of Dot, on a mission to make data accessible to everyone. When he's not building AI-powered analytics, you'll find him obsessing over well-arranged pixels and surprising himself by learning new languages.