
10 Best Basedash Alternatives & Competitors In 2026
When people search for Basedash alternatives, it's usually not because the AI-generated dashboards don't look nice.
It's because the analytics underneath don't go deep enough once real decisions are on the line.
I've tested enough AI-native BI tools to know the pattern:
The first demo feels impressive, the natural language queries work for simple questions, but the moment your team needs governed metrics, repeatable analysis, or automated reporting that leadership can actually trust, the cracks show fast.
That's why in this article, I'll break down the best Basedash alternatives in 2026.
I've evaluated each one across real analytics workflows, covering what each tool does well, where Basedash hits its limits, and which option fits depending on how your team actually works with data.
Let's get into it.
TL;DR
- The best alternative to Basedash on the market is Dot, because it goes beyond translating natural language into SQL and actually does the analysis for you. It produces narrative explanations, recommendations, and automated business reviews that leadership can act on without interpreting dashboards.
- Basedash is a solid starting point for startups that want quick AI-generated dashboards and natural language querying on top of their database. But teams tend to outgrow it once they need a semantic layer, governed metric definitions, automated reporting, or analytics that go deeper than SQL translation.
- The rest of the alternatives split into two camps: traditional BI platforms with strong visualization and governance (Tableau, Looker, Qlik Sense, Sigma) for teams that want hands-on analytics control. And AI-forward or lightweight platforms (ThoughtSpot, Metabase, Mode, Domo, Zoho Analytics) for teams that want faster self-serve insights without heavy setup.
Why do some teams switch away from Basedash?
From what I've seen, Basedash does some things genuinely well.
The AI agent handles simple natural language queries cleanly, the interface feels fast, and the Autopilot feature that scans your data on a schedule and surfaces patterns is a nice touch for small teams that don't have a dedicated analyst.
That said, once you move past basic dashboarding and ad-hoc lookups, the same friction points keep coming up, and they're usually why teams start exploring other options.
1. Pricing jumps quickly with no free plan to start
Basedash dropped its free tier entirely when it pivoted from a database admin panel to an AI-native BI platform.
The entry point is now $250/month for just 2 users, and the Growth plan runs $1,000/month for 25 seats.
For a startup or small data team, that's a steep commitment before you've even validated whether the tool fits.
Independent reviewers have echoed this.
One hands-on evaluation noted that the "$999/month flat price deters very small teams." - ForOperators Review
When you compare that to tools like Metabase (free open-source tier) or Dot (free Starter plan), the lack of a low-risk entry point makes it harder to justify early on.
2. Analytics depth doesn't hold up against dedicated BI tools
Basedash works well for quick lookups and simple dashboards.
But it doesn't have a semantic layer, can't enforce consistent metric definitions across queries, and offers no data modeling or transformation capabilities.
For teams where "revenue" needs to mean the same thing in every report, that's a real gap.
"Advanced analytics depth trails Looker, Tableau, or dedicated data-modeling suites." - ForOperators Review
Once a team grows past 10 or 15 people consuming data, the lack of governance becomes a trust problem, not just a features problem.
3. Initial setup friction and inconsistent chart generation
Getting started with Basedash isn't as smooth as the marketing suggests.
Multiple users report long wait times for data to sync before they can do anything meaningful.
And the AI-generated visualizations don't always land the way you'd expect.
"The first thing that I noticed was that the system was slow - it took roughly 12 hours for the data to sync to Basedash." - ForOperators Review
For teams evaluating multiple tools, a 12-hour wait before you can even test the product is enough to push people toward alternatives that let you query data immediately after connecting.
What are the 10 best Basedash alternatives & competitors in 2026?
The best Basedash alternatives in 2026 are Dot, Tableau, and Looker.
The rest are as follows:
| Tool | What it's best at | Pricing |
|---|---|---|
| Dot | AI-powered data analysis with narrative answers, automated business reviews, and insights delivered via Slack and Teams | Free plan, paid from $799/month |
| Tableau | Advanced data visualization, exploratory analysis, and flexible cloud or self-hosted deployment | Starts from $75/month per creator |
| Looker | Governed, warehouse-native BI with centralized metric definitions and strong embedding | Pricing not public |
| ThoughtSpot | AI-powered self-service analytics with natural language search and automated dashboards | Starts from $25/month per user |
| Qlik Sense | Interactive analytics with a unique associative engine for exploring complex data freely | Pricing not public |
| Sigma | Spreadsheet-style analytics on live warehouse data with an AI-powered app building | Pricing not public |
| Metabase | Fast, open-source self-serve analytics with natural language querying and flexible embedding | Free plan, paid from $100/month |
| Mode | SQL-first analysis with Python and R notebooks for teams blending code-heavy and visual workflows | Pricing not public (free plan available) |
| Domo | All-in-one BI platform combining data integration, dashboards, automation, and AI actions | Pricing not public |
| Zoho Analytics | AI-powered BI with strong connectors and good value, especially for teams already in the Zoho ecosystem | Starts from $60/month |
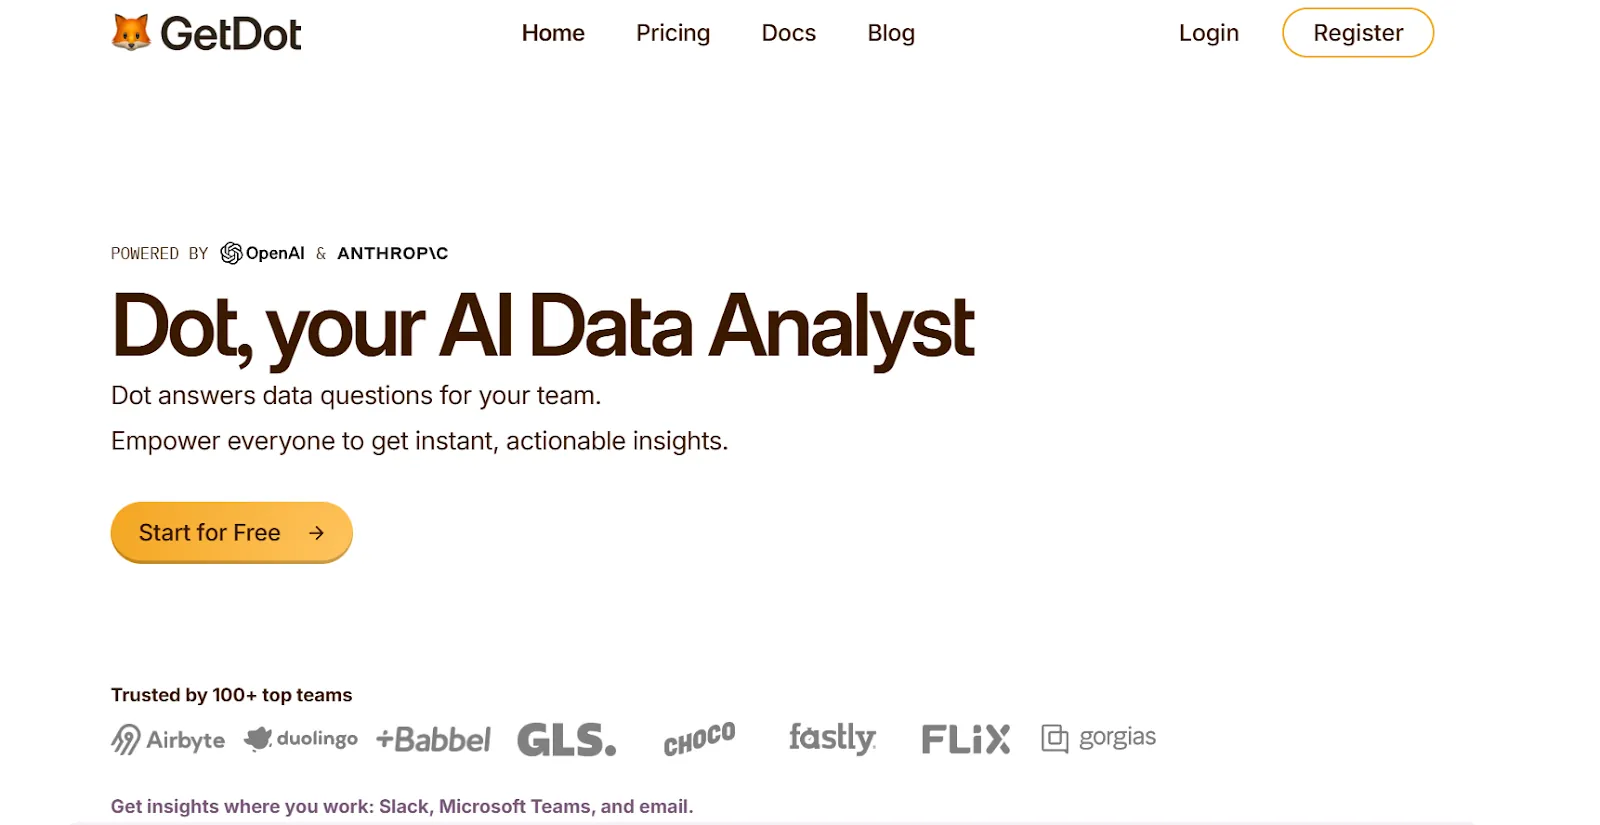
#1: Dot
Dot isn't your typical Basedash-style AI dashboarding tool.
It's an AI data analyst that plugs directly into your data warehouse and performs the analysis on your behalf, producing written explanations, recommendations, and full business reviews rather than just charts and tables.
So instead of typing a question and hoping the AI generates the right SQL, I can ask Dot a real business question and get back a structured answer.
It tells me what happened, why it likely happened, and which areas need attention.
It also produces scheduled executive-ready reports, handles ad-hoc questions in Slack or Teams, and keeps a shared set of business definitions so every answer stays consistent.
In practice, Dot replaces a large portion of the manual reporting and back-and-forth with analysts, rather than just putting an AI wrapper on top of your database.
Here are some of the features that make Dot a strong Basedash alternative.
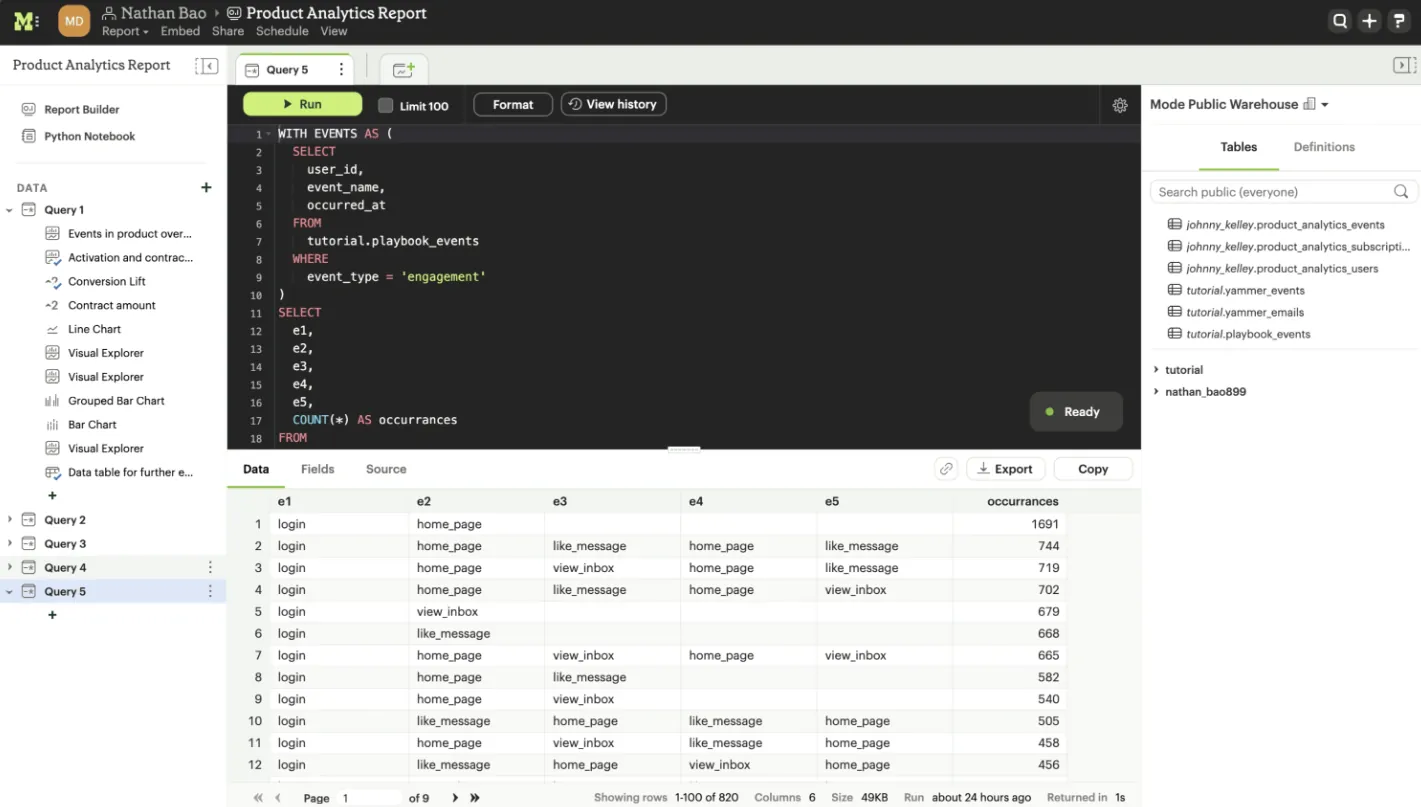
1. Ad-hoc data analysis through Slack or Teams
Basedash's AI agent works inside its own web interface.
You have to open the app, type your question, wait for the SQL to run, and then interpret the result yourself.
That works fine for the person who's already logged in, but it creates a bottleneck for everyone else on the team who just wants a quick answer.
Dot takes a different approach by letting anyone on the team ask plain-English business questions directly inside Slack or Microsoft Teams.
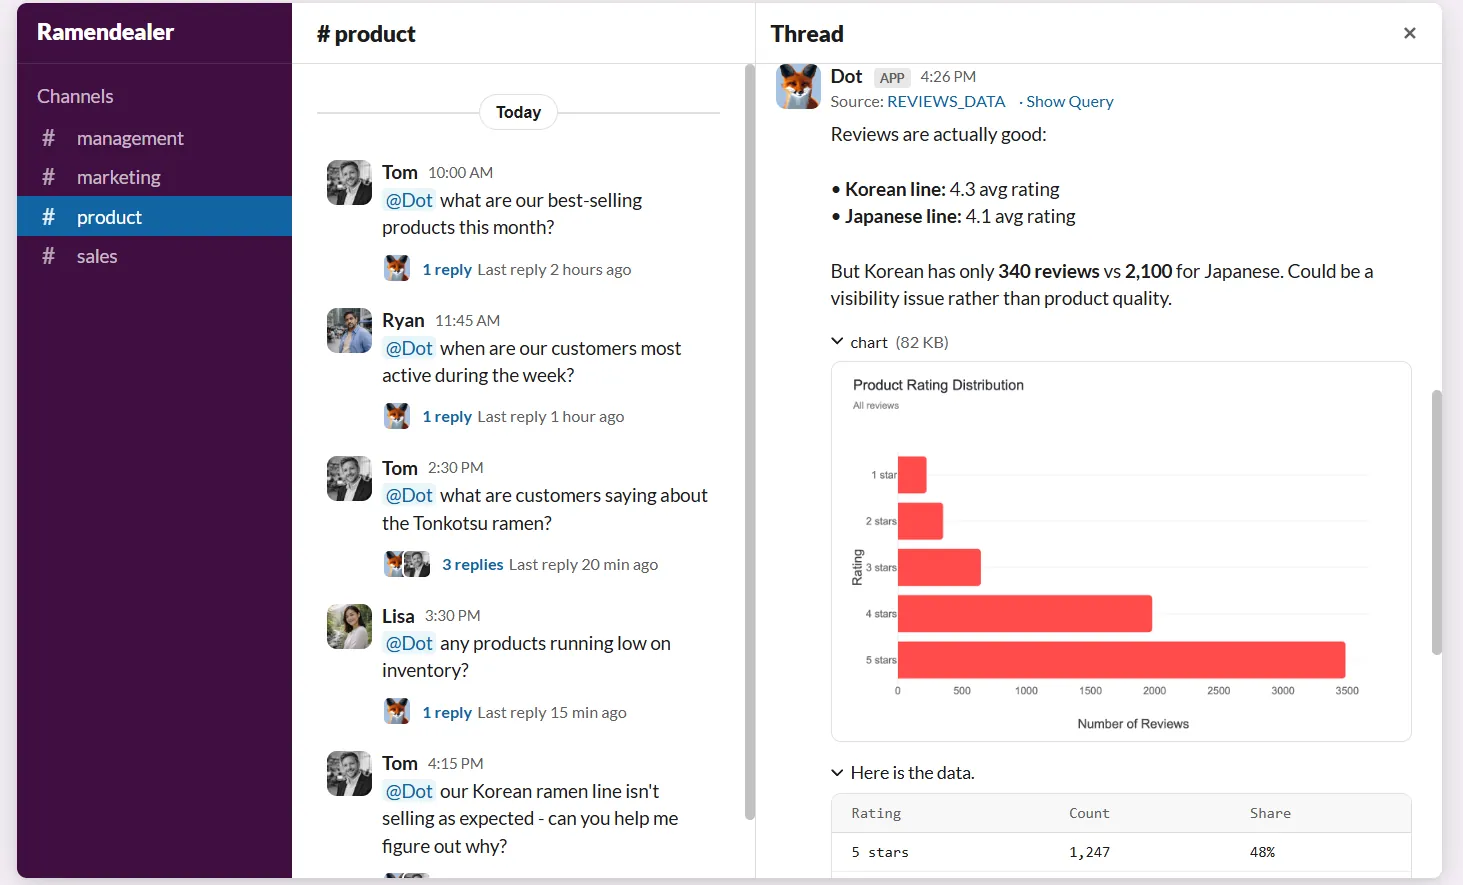
No extra app to install, no login to remember.
The response isn't just a number or a table either.
Dot explains what's happening, highlights which segments or regions are driving the change, and tells you why it matters.
This is especially useful for data teams because it absorbs a huge volume of the repetitive "can you pull this for me?" requests that eat into deeper analytical work.
Business users get answers in minutes without learning SQL, and analysts get their time back for the work that actually requires human judgment.
2. Shared business definitions that stay consistent
One of Basedash's biggest gaps is the lack of a semantic layer.
Every time the AI generates a query, there's no guarantee it's calculating "revenue" or "churn" or "active users" the same way it did yesterday.
That might not matter for a 5-person startup, but it becomes a real issue once multiple teams are consuming data and making decisions based on it.
Dot handles this with a Context Agent that learns and maintains business definitions, metric logic, and documentation across your data environment.
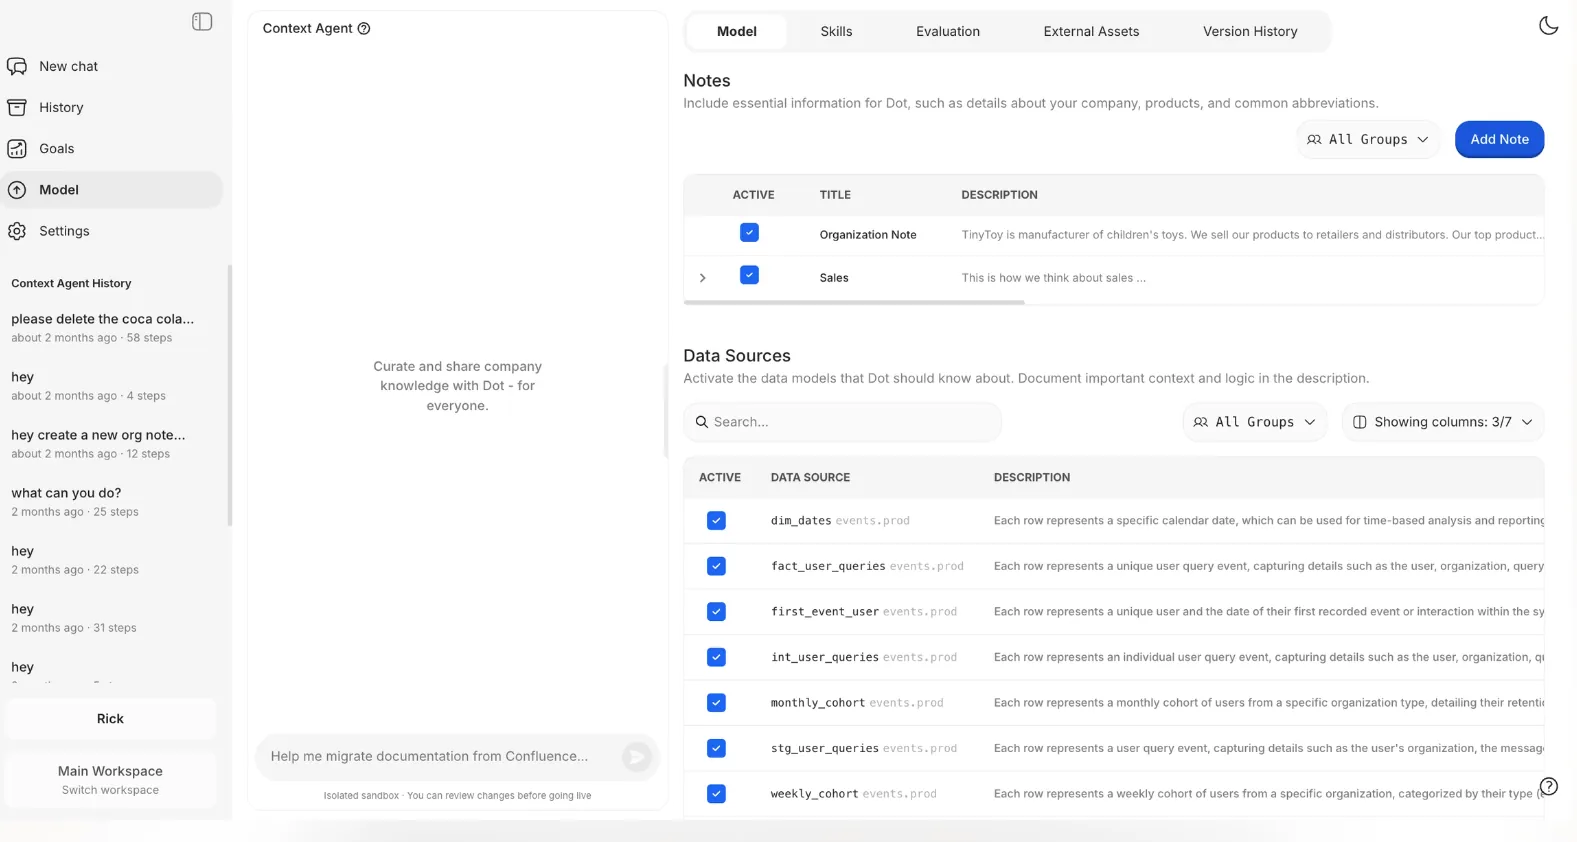
It tracks how key metrics are calculated, which tables should be used, and how different teams refer to the same concepts.
Then it applies that context every time it generates an insight or report.
In practice, this means people stop debating which number is right.
Every answer Dot produces is grounded in the same shared understanding of the business, which builds trust and prevents the slow erosion of confidence that happens when different tools give different numbers.
3. Automated executive business review reports
One of the reasons teams adopt tools like Basedash is to speed up reporting for leadership.
But in reality, Basedash gives you dashboards.
Someone still has to interpret them, pull the key takeaways, and explain what changed and why.
The dashboard shows data. The actual analysis still happens in someone's head.
Dot approaches this differently by automating the full business review, not just the visuals.
It generates written reports on a set schedule (daily, weekly, or monthly) directly from the data warehouse.
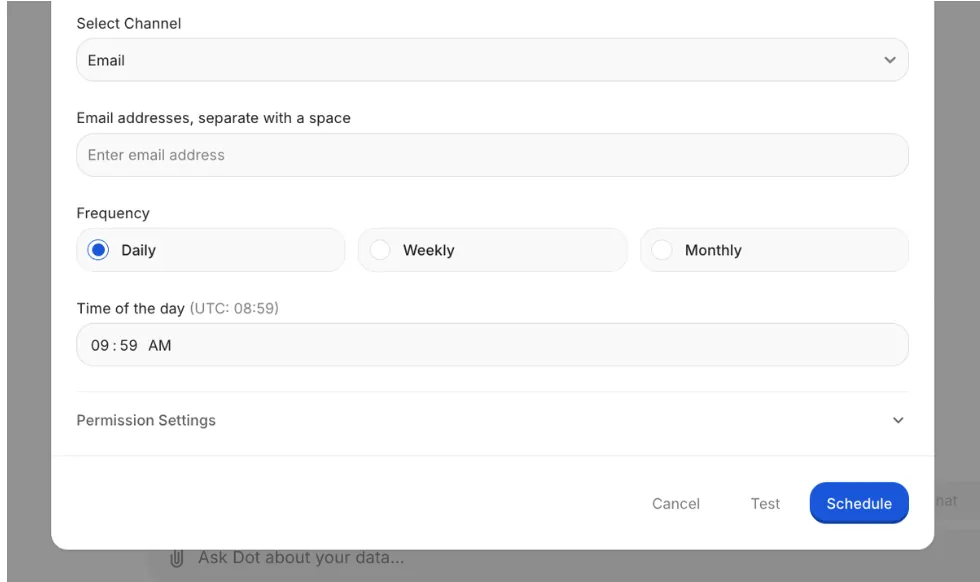
Each report turns raw metrics into a narrative that covers what happened, how it compares to previous periods, and where leadership should focus.
The result is a reporting process that's easier to maintain and far easier to act on.
Leadership gets a clear, readable update without having to interpret dashboards, and data teams stop spending their weeks producing the same reports over and over.
4. Transparent audit trail on every insight
A common concern with AI-generated analytics, and this applies to Basedash too, is trust.
When the AI gives you a number, how do you know it's right?
In Basedash, you can see the generated SQL, but there's no structured audit trail linking every insight back to the exact logic, datasets, and assumptions used.
Dot takes the opposite approach by attaching a full audit trail to every answer it produces.
Each insight links directly back to the underlying SQL queries, Python logic, and datasets, so it's clear exactly where the numbers came from and how they were calculated.
This matters especially for data leaders who need to stand behind the numbers in front of executives.
Instead of saying "the AI said so," teams can trace insights back to the source, validate them in seconds, and move forward with confidence.
Dot's integrations
Dot is designed to sit on top of the tools your team already uses, not force data into a new proprietary model.
It connects directly to modern data warehouses like Snowflake, BigQuery, Redshift, and Databricks, as well as operational databases like Postgres, MySQL, and SQL Server.
Beyond raw data connections, Dot also works with semantic layers and transformation tools like dbt, Looker, Power BI models, and Cube, so it can reuse existing business logic instead of starting from scratch.
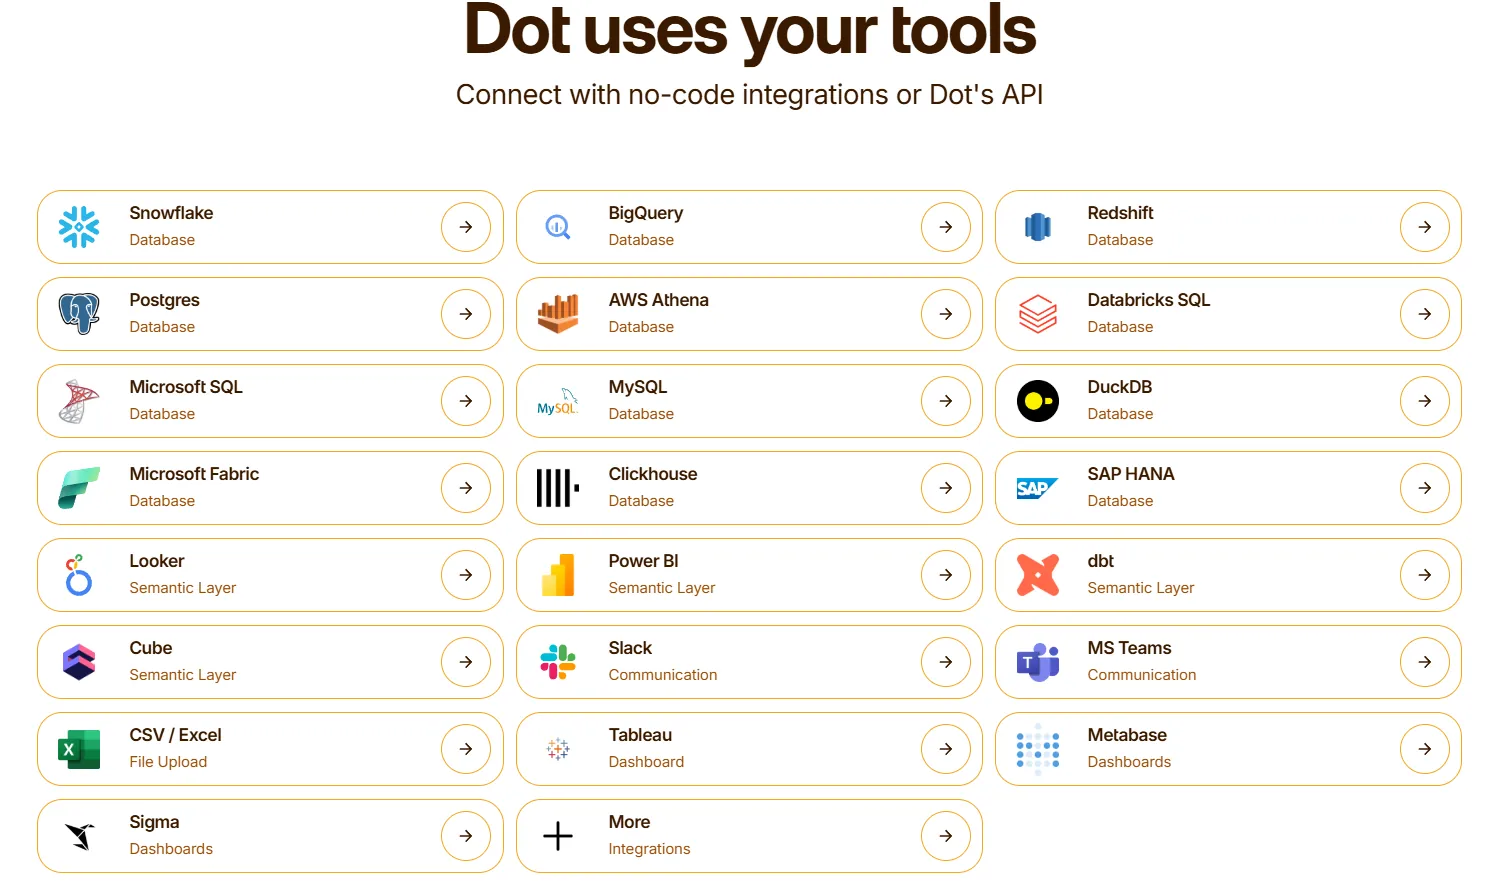
It delivers insights through the channels where work actually happens: Slack, Microsoft Teams, email, and the web app.
It also sits alongside existing BI tools like Tableau or Metabase, complementing them rather than ripping everything out overnight.
Pricing
Dot uses a credit-based pricing model, with plans designed to scale from early experimentation to enterprise-wide usage:
- Starter: Free plan that lets you get started without committing, includes 3 active tables, 100 credits + 10 credits per month, chat-based analysis, and model & evaluation access.
- Standard: $799/month, includes everything in Starter, up to 15 active tables, up to 500 credits per month, additional credits at $1.40 per credit, live chat support, priority onboarding, and API access.
- Enterprise: Custom pricing, includes everything in Standard, unlimited users and admins, unlimited messages, self-hosted environment, dedicated support, custom onboarding and training, and fine-grained access controls.
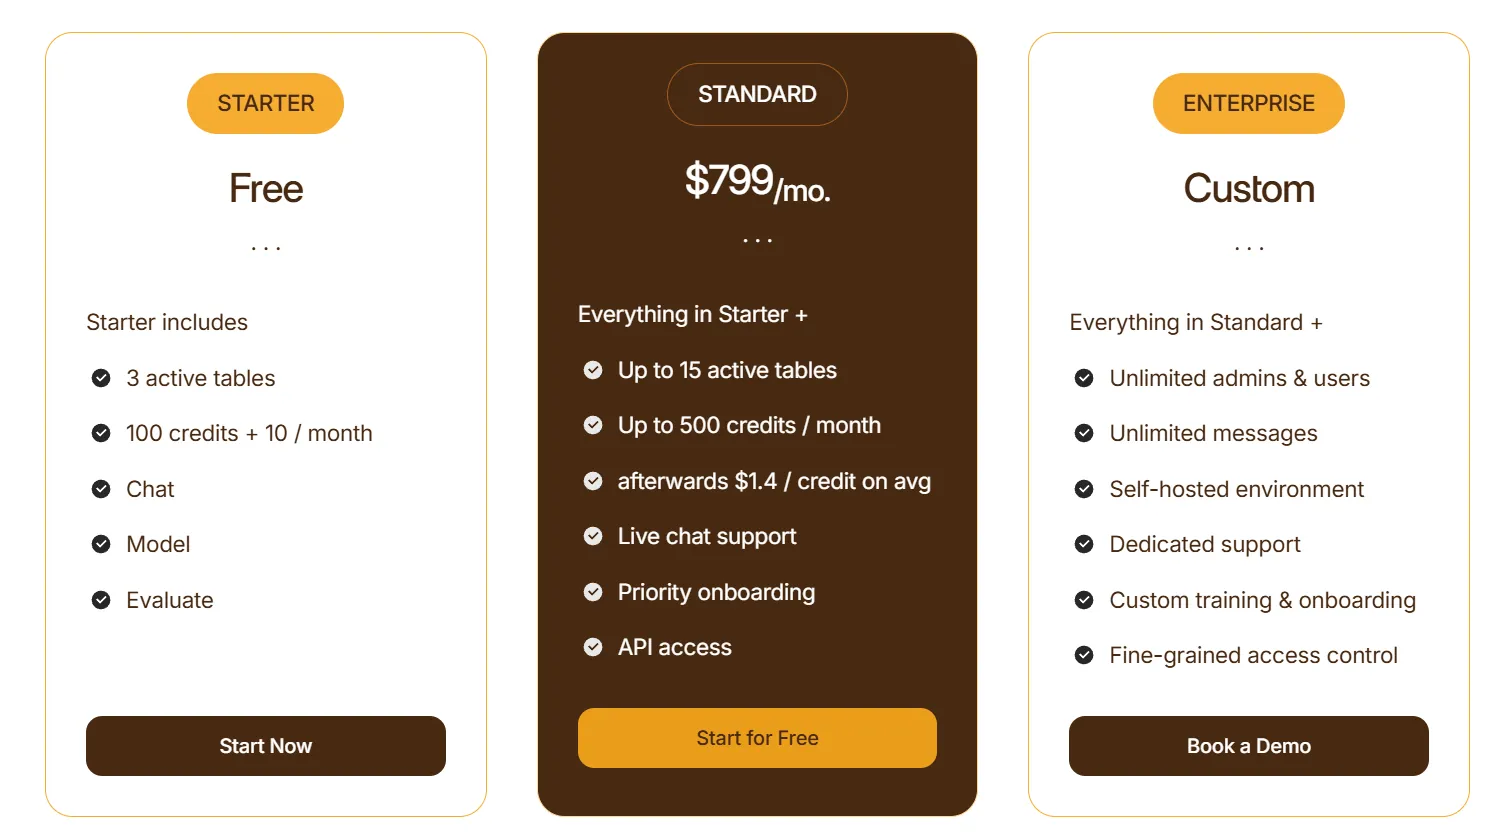
Compared to Basedash's $250/month minimum with no free plan, Dot lets you start for free and scale based on actual usage rather than seat count.
How is Dot different from Basedash?
The core difference between Dot and Basedash isn't the AI. Both let you ask questions in natural language.
The difference is what happens after you ask.
Basedash translates your question into SQL, runs it, and hands you back a table or chart.
You still have to figure out what the data means, why something changed, and what to do about it.
Dot goes further.
It produces narrative answers that explain what happened, identifies the drivers behind the change, and gives you recommendations.
It also automates entire business review reports and maintains consistent metric definitions across the organization.
And it pushes insights into Slack and Teams, so answers show up where decisions actually happen.
Basedash is built to help teams query data faster.
Dot is built to help teams understand their data and act on it, without dashboards as the main interface.
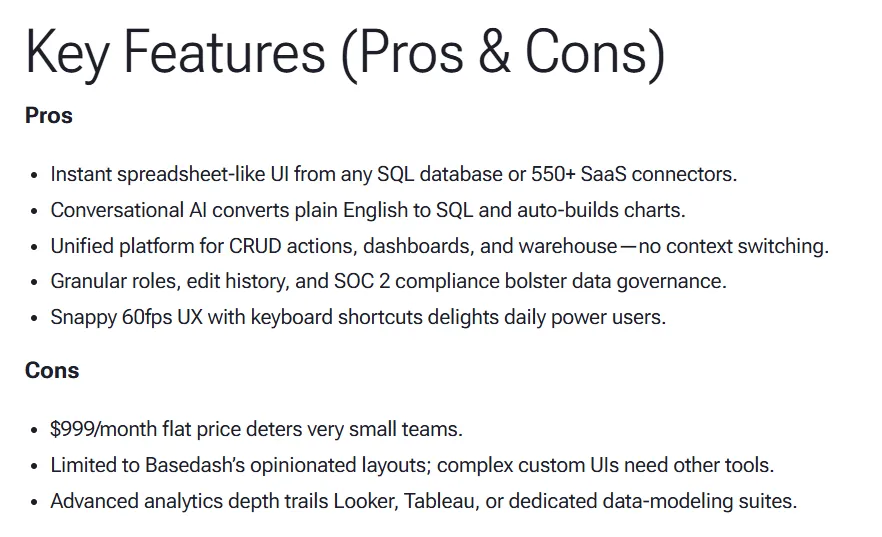
Pros & Cons
✅ Turns recurring reports into automated, written business reviews with context and recommendations.
✅ Answers questions directly in Slack or Teams in minutes.
✅ Shared business context prevents metric drift across teams.
✅ Full audit trail on every insight, linking back to SQL, logic, and datasets.
✅ Warehouse-native, works on top of your existing data stack without copying data.
✅ Credit-based pricing instead of per-seat licensing.
❌ Not a traditional dashboarding tool, so teams that need heavy custom visuals may need to pair it with something else.
#2: Tableau
Best for: Data teams and enterprises that need advanced visualization, hands-on exploratory analysis, and flexible cloud or on-prem deployment.
Similar to: Qlik Sense, Sigma.
Tableau is one of the most established BI platforms on the market, known for its deep visualization engine and interactive dashboarding.
Where Basedash focuses on AI-generated charts from natural language prompts, Tableau gives analysts full control over how data is explored, modeled, and presented.
Features
- Drag-and-drop visual analytics (VizQL): Build highly interactive dashboards with rich chart types, drill-downs, and real-time visual exploration across large and complex datasets.
- AI-powered analytics with Tableau Next: The newest layer introduces agent-based analytics that deliver contextual insights, support natural language questions, and push alerts into tools like Slack and Salesforce.
- Centralized governance and security: Reusable metrics through Tableau Pulse, centralized data management, and security controls make it easier to scale analytics without losing consistency.
Pricing
Tableau charges per user, per month, with different tiers for cloud and server deployment.
Tableau Cloud Standard starts at $75/month per creator, with additional viewer licenses from $15/month per user.
Tableau Cloud Enterprise runs $115/month per creator, with viewer licenses from $35/month per user.
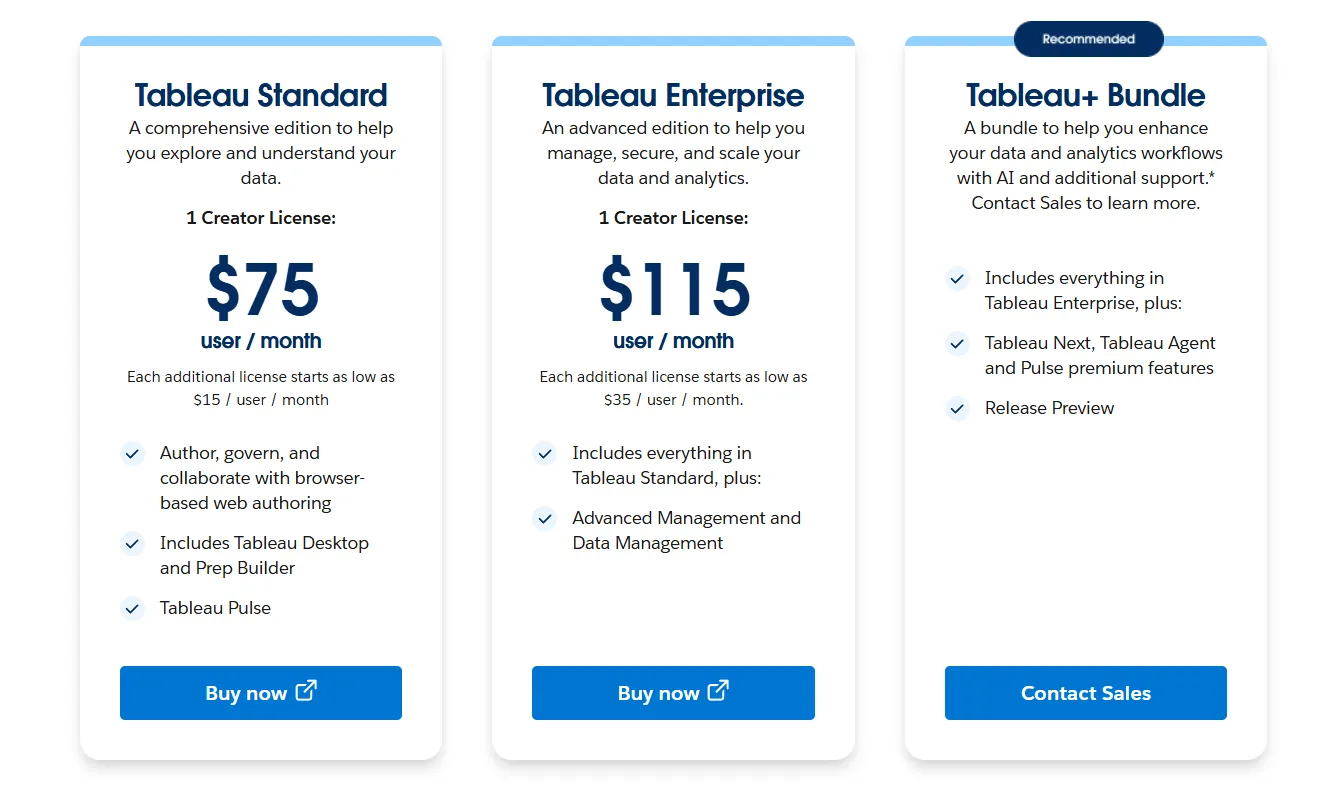
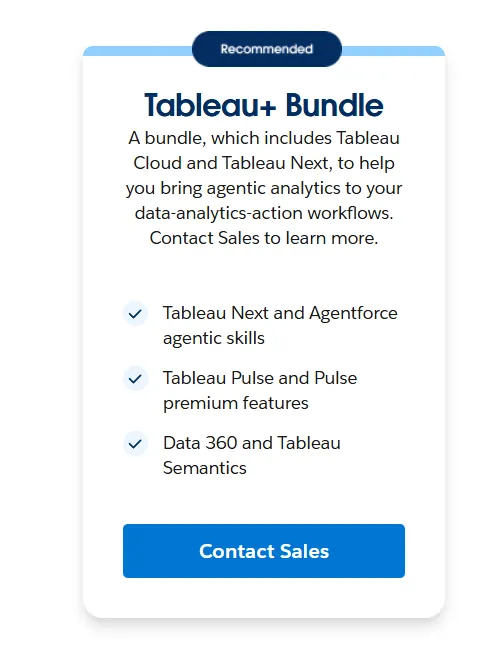
The Tableau+ Bundle (with AI features and Tableau Next) requires custom pricing.
Tableau Server follows a similar structure, with Standard at $75/month per creator and Enterprise at $115/month per creator.
Pros & Cons
✅ Best-in-class data visualization and visual storytelling.
✅ Drag-and-drop exploration that lets analysts iterate quickly without writing code, unlike Power BI where advanced work often requires DAX.
❌ Steep learning curve once you move past basic dashboards.
#3: Looker
Best for: Data teams that want governed, warehouse-native analytics with consistent metric definitions and tight Google Cloud integration.
Similar to: Sigma, Dot.
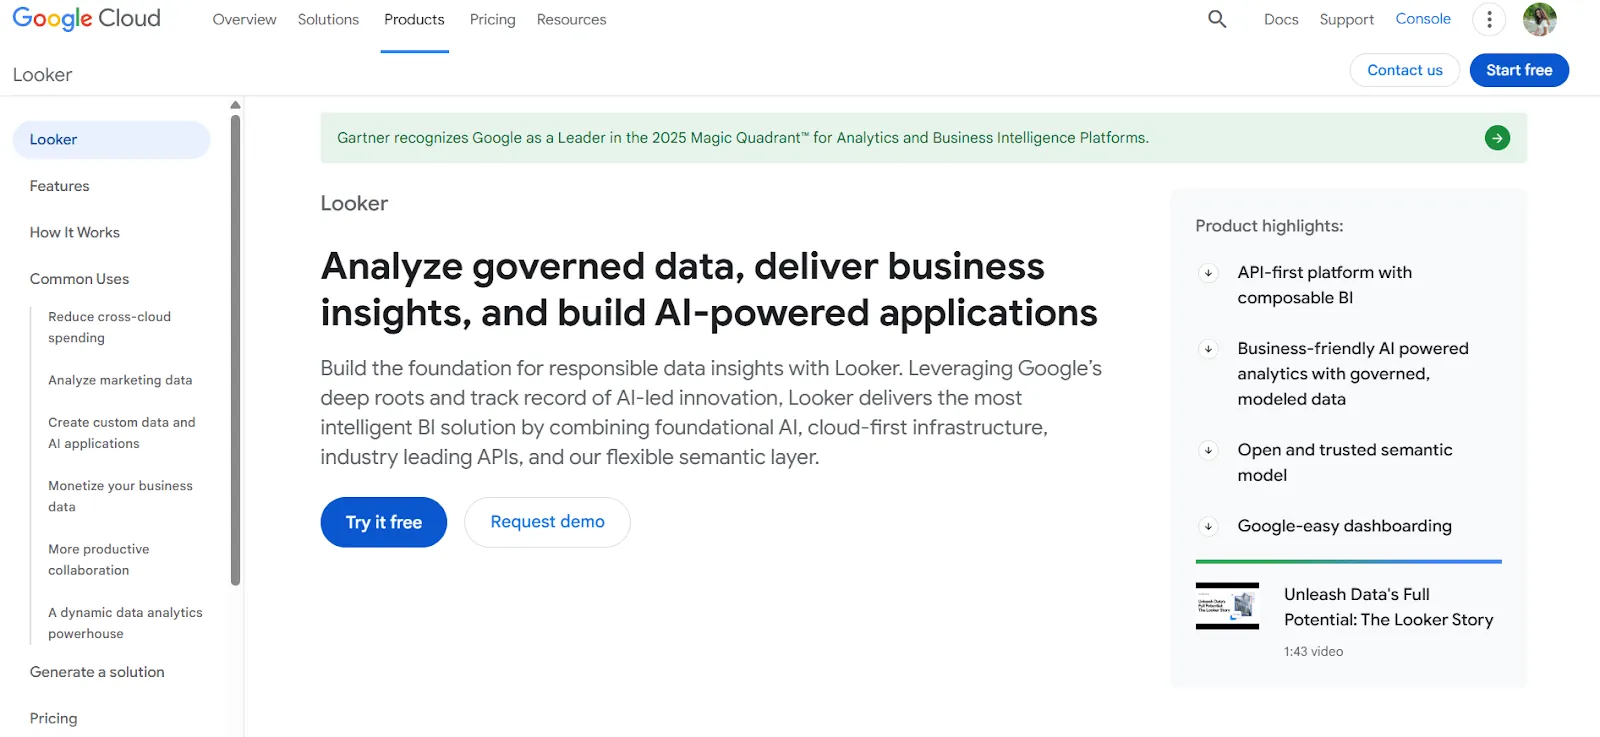
Looker is a BI platform built around a centralized semantic modeling layer called LookML, not standalone dashboards.
It's designed for organizations that care about making sure every team sees the same numbers, which is a direct contrast to Basedash's approach of letting AI generate queries on the fly without governed definitions.
Features
- Centralized metric modeling with LookML: Define your business rules and metric calculations once, and they're applied consistently across every dashboard, report, and embedded view.
- Conversational analytics with Gemini: Users can ask data questions in plain language and get answers without navigating traditional dashboards, powered by Google's Gemini AI.
- Live, governed dashboards: Dashboards query the warehouse directly, so users always see current data without relying on stale extracts or cached snapshots.
Pricing
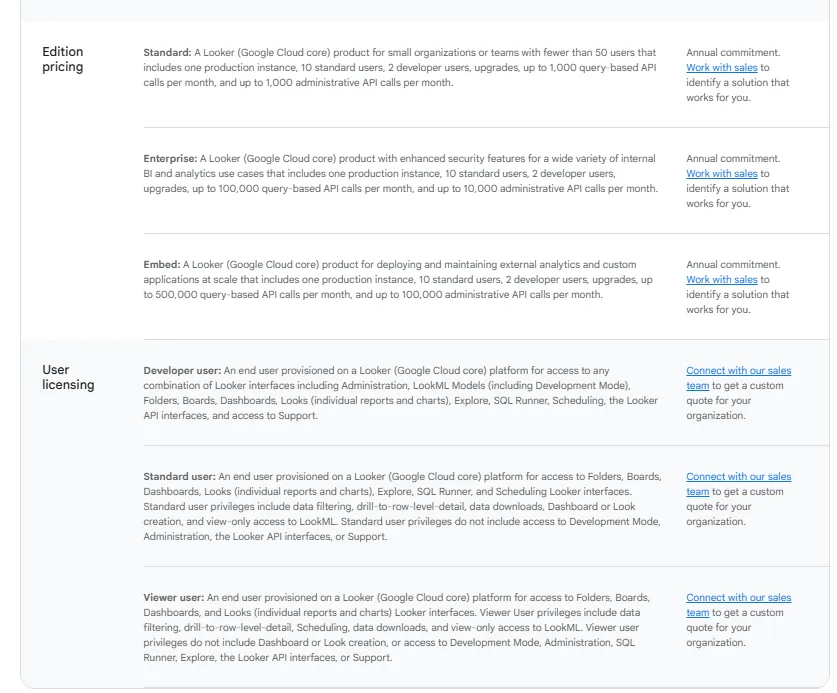
Looker uses a custom, contract-based pricing model split between platform costs and per-user licensing.
Platform editions include Standard (for teams under 50 users), Enterprise (for larger deployments with enhanced security), and Embed (for building analytics into external products).
User licenses come in three tiers: Developer (full LookML access), Standard (exploration and dashboard building), and Viewer (read-only access with filtering).
All pricing is annual and varies based on scale and usage. You'll need to contact Google Cloud sales for a quote.
Pros & Cons
✅ Metrics defined once apply everywhere, so teams always see the same numbers.
✅ Strong embedding capabilities for customer-facing analytics.
❌ Steep learning curve, especially for teams new to LookML, which is part of why some data teams have been exploring Looker alternatives.
#4: ThoughtSpot
Best for: Organizations that want self-service analytics powered by natural language search and AI-generated dashboards, without depending on traditional BI workflows.
Similar to: Dot, Basedash.
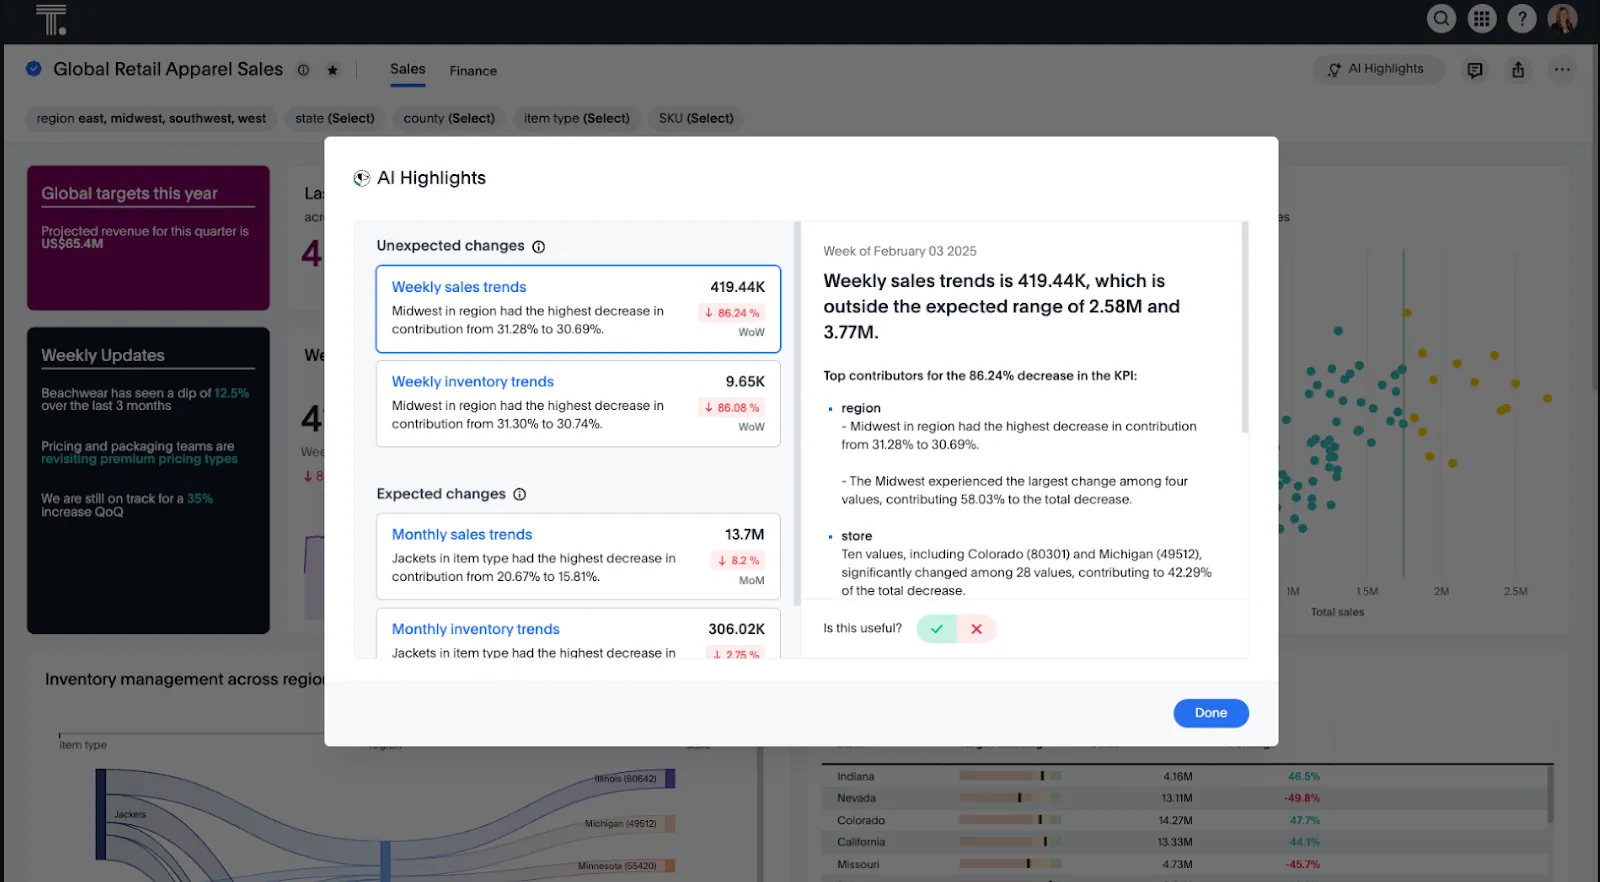
ThoughtSpot is an AI-driven analytics platform designed around letting anyone ask questions in plain English and get instant, governed answers.
It's similar to Basedash in its AI-first approach, but goes significantly deeper with agentic tools like Spotter that automatically generate analyses, dashboards, and insights, even from unstructured data.
Features
- Natural language search on governed data: Type questions in plain English and get instant answers from live, governed datasets without building dashboards first.
- AI agents for automated analysis: Spotter and related agentic tools automatically generate full analyses, surface anomalies, and build dashboards based on what the data shows.
- Automated dashboard creation with SpotterViz: Turn raw data into fully styled, story-driven dashboards instantly, no manual formatting or layout work needed.
Pricing
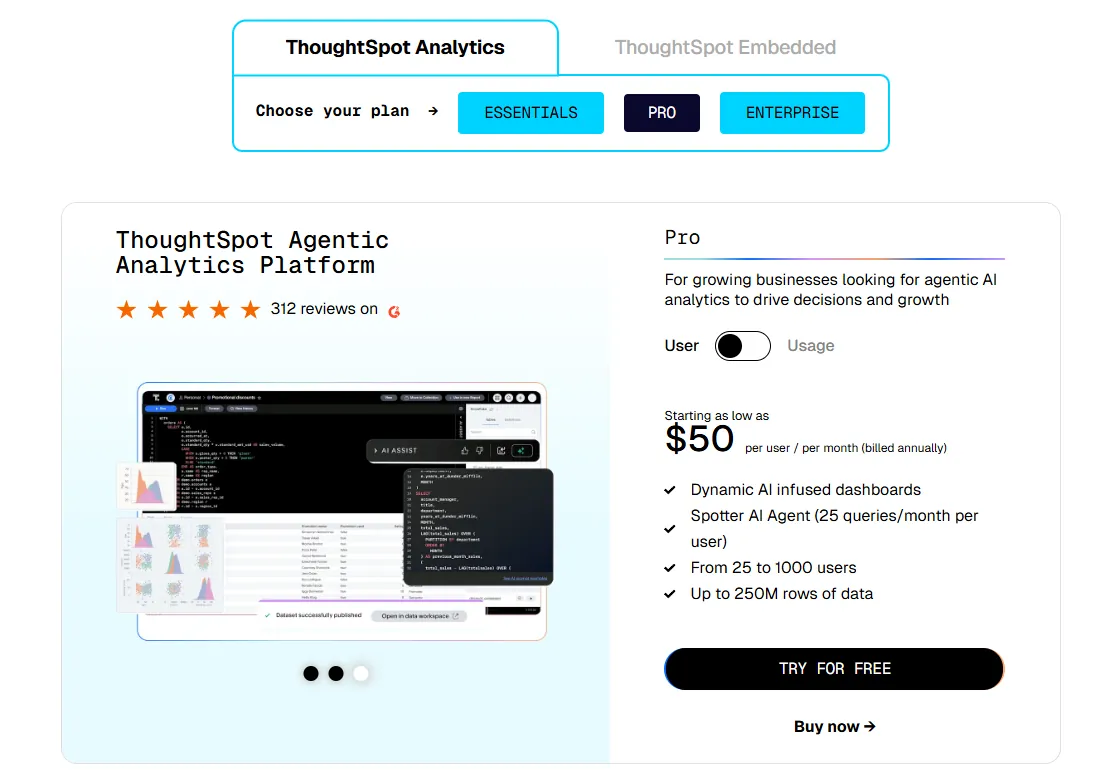
ThoughtSpot Analytics starts at $25/month per user (billed annually) on the Essentials plan for 5-50 users, supporting up to 25M rows.
The Pro plan runs from $50/month per user for 25-1,000 users, with Spotter AI Agent access (25 queries per user per month) and up to 250M rows.
A usage-based Pro option is available from $0.10 per query.
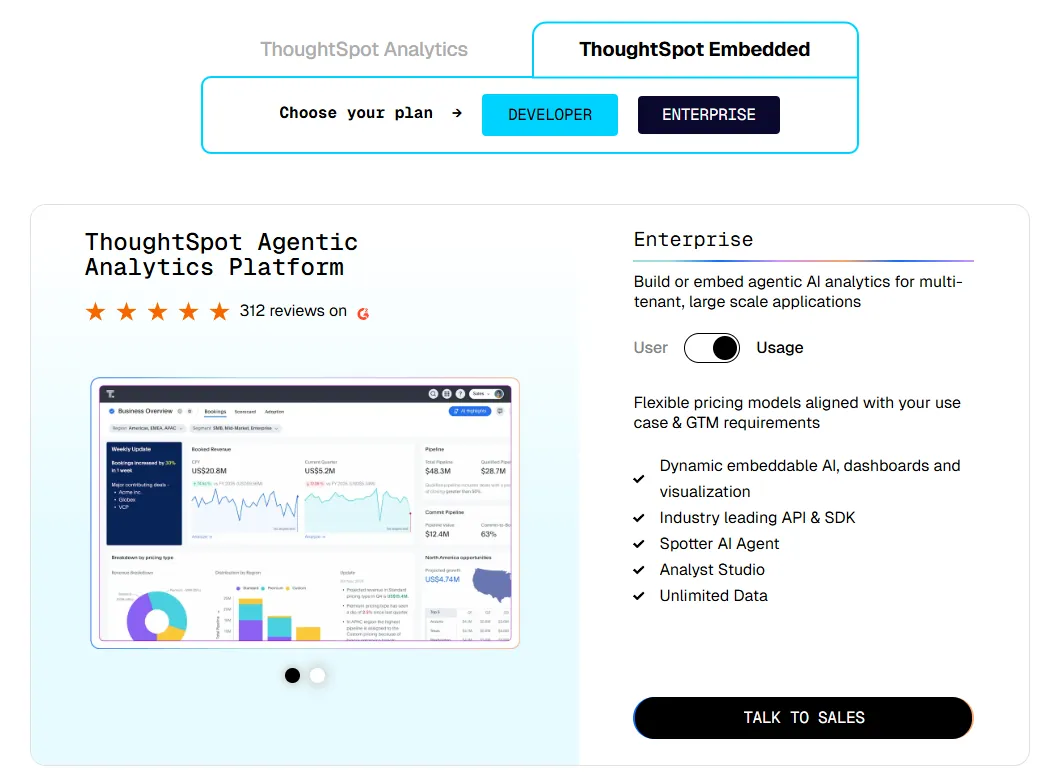
Enterprise pricing is custom, with unlimited users and data.
ThoughtSpot Embedded offers a free Developer tier for 1 year, with Enterprise plans priced on a custom basis.
Pros & Cons
✅ Very approachable for non-technical users thanks to natural language search.
✅ AI surfaces patterns and explanations faster than manual dashboard exploration.
❌ Usage-based pricing makes costs unpredictable at scale.
#5: Qlik Sense
Best for: Organizations that need powerful, interactive analytics for exploring complex data, especially in governed industries that prefer on-prem options.
Similar to: Tableau, Looker.
Qlik Sense stands apart from most BI tools with its associative analytics engine, which lets users explore data in any direction without being locked into predefined queries or drill paths.
Unlike Basedash's linear prompt-to-chart approach, Qlik encourages freeform exploration where selecting any value instantly recalculates everything in context.
Features
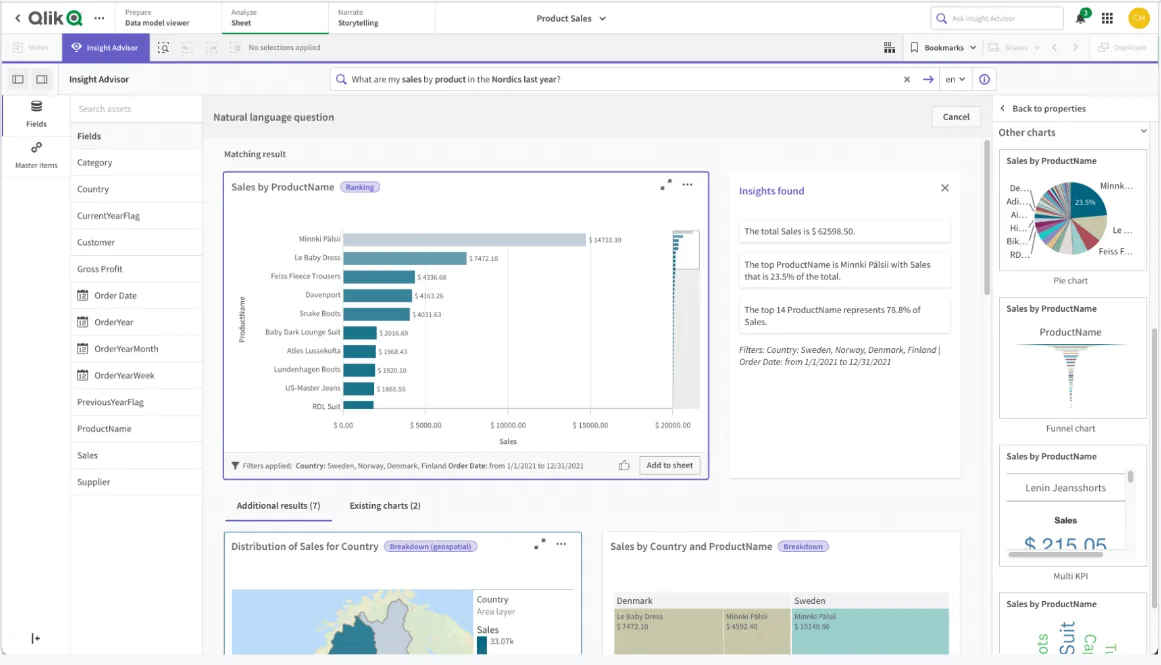
- Associative analytics engine: Explore data freely by clicking any value across charts and tables, with the entire view recalculating instantly to show relationships and outliers.
- AI-augmented analytics: Built-in machine learning generates insights automatically, supports natural language queries, and enables predictive analysis without needing data science skills.
- Real-time alerts and automated actions: Set intelligent thresholds that trigger notifications or automated workflows when data changes in meaningful ways.
Pricing
Qlik doesn't publish pricing for Qlik Sense.
You'll need to contact their sales team for a custom quote based on your deployment and usage needs.

Pros & Cons
✅ Highly flexible, with strong performance on large and complex datasets.
✅ Scales well for enterprise analytics needs.
❌ Expensive, especially for broader organizational rollouts.
#6: Sigma
Best for: Teams that want spreadsheet-familiar analytics and AI-powered workflows on live warehouse data, without complex BI configuration.
Similar to: Looker, Metabase.
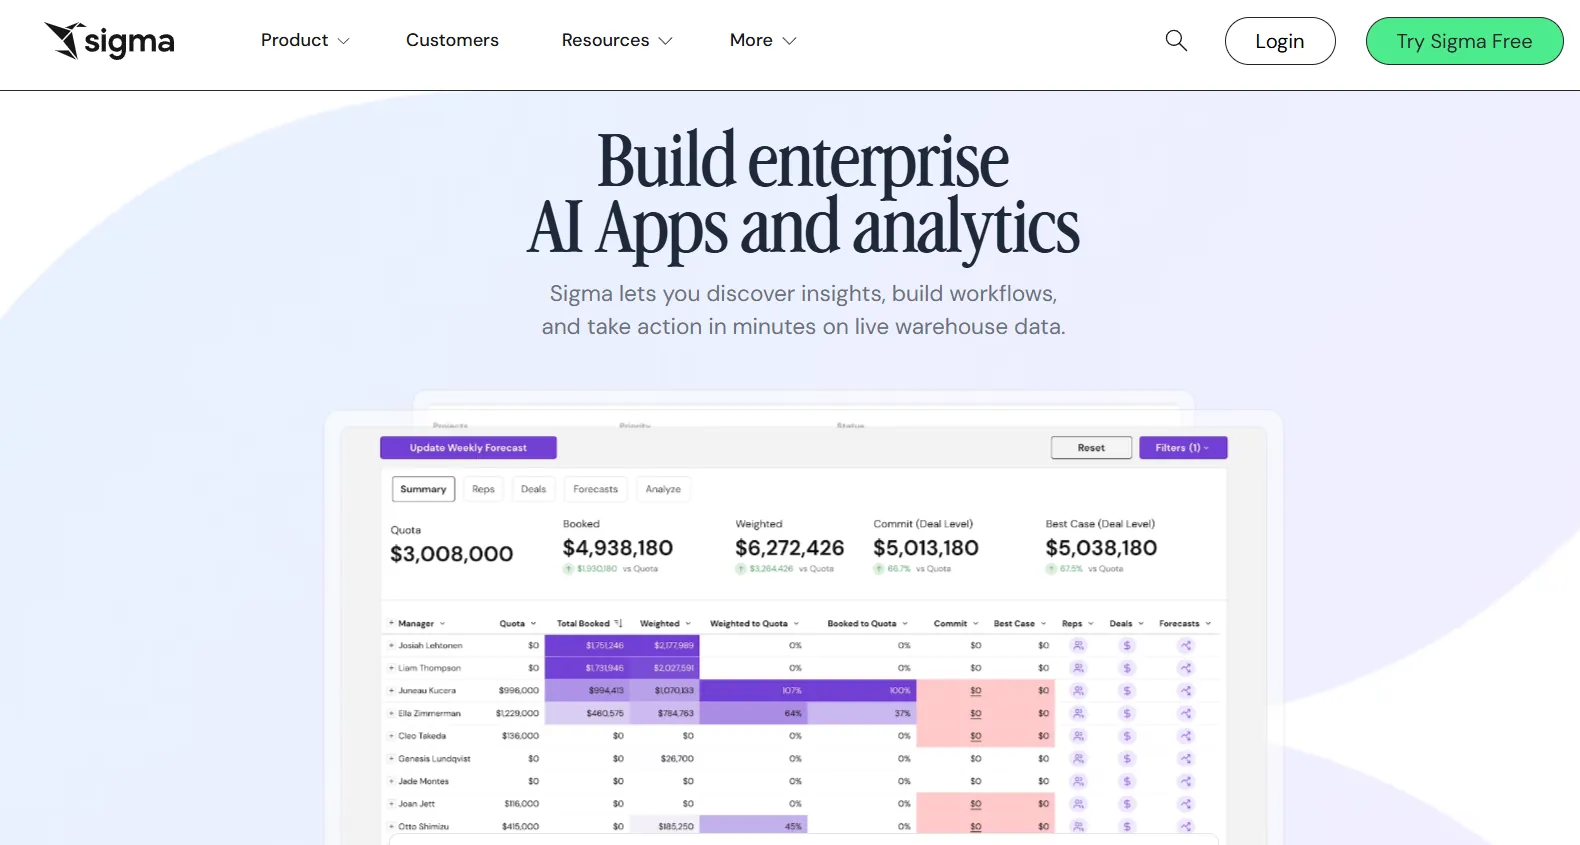
Sigma is a cloud-native analytics platform that connects directly to your data warehouse and lets users work with data using a spreadsheet-style interface.
For teams moving away from Basedash because they want more control over their analysis but don't want to learn a full BI tool, Sigma sits in a useful middle ground.
Features
- Spreadsheet-style interface on live data: Analyze warehouse data using familiar formulas, tables, and logic that feel like Excel, but running on live cloud data instead of static exports.
- AI-powered dashboard and app creation: Use natural language prompts to build dashboards, reports, and complete data applications without code.
- Operational analytics apps: Build interactive apps for forecasting, budgeting, capacity planning, and sales pipelines directly inside the analytics platform.
Pricing
Sigma doesn't publish its pricing publicly.
You can reach out to their sales team to get a custom quote.
Pros & Cons
✅ Feels immediately familiar to anyone who's used Excel.
✅ Always queries live warehouse data, so insights stay current.
❌ Fewer chart types and less visual customization compared to tools like Tableau.
#7: Mode
Best for: Data teams and business users who want SQL analysis, Python and R notebooks, and self-serve reporting in a single workspace.
Similar to: Metabase, Sigma.
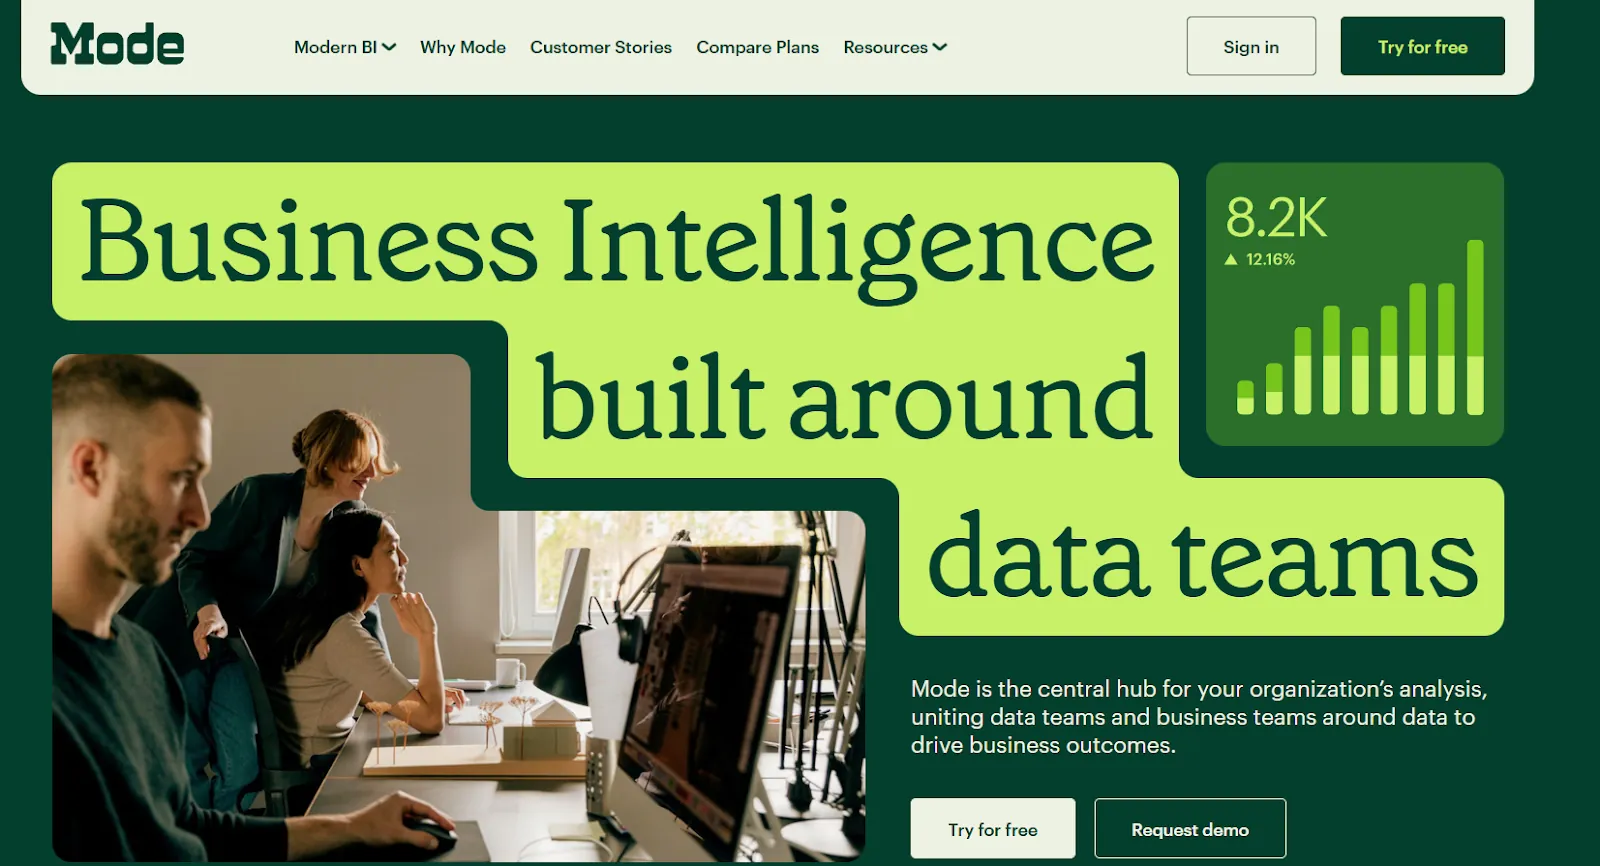
Mode is a BI platform built for teams that blend code-heavy analysis with visual reporting.
If Basedash feels too limiting because there's no way to run Python scripts, build statistical models, or do notebook-style analysis, Mode fills that gap.
Features
- SQL-first ad-hoc analysis: Jump straight into data with a SQL editor that makes it easy to explore, iterate, and answer complex questions without navigating a visual builder.
- Python and R notebooks: Send SQL results into integrated notebooks for deeper statistical analysis, forecasting, or custom modeling, all inside the same workspace.
- Interactive dashboards and sharing: Build visual dashboards from your analyses and share them across teams via scheduled reports, Slack, or email.
Pricing
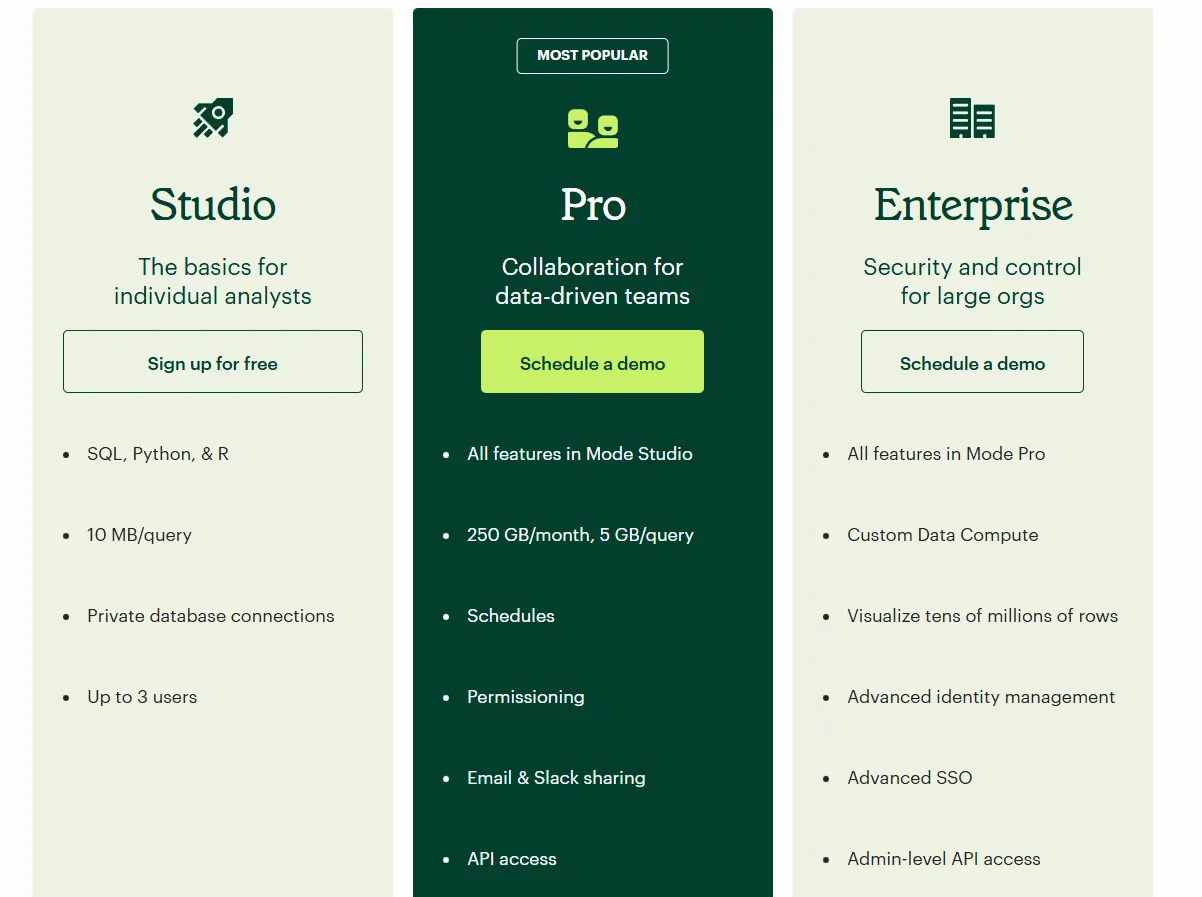
Mode offers three pricing tiers, starting with a free plan for individual analysts and scaling up to enterprise-grade analytics for large organizations:
- Studio: Free plan, includes SQL, Python, and R, private database connections, support for up to 3 users, and query limits of 10 MB per query.
- Pro: Custom price, includes everything in Studio and adds team collaboration features like scheduled reports, permissions, Email and Slack sharing, API access, higher data limits (250 GB per month, 5 GB per query), and standard support.
- Enterprise: Custom price, extends Pro with custom data compute, support for very large datasets, advanced identity management and SSO, admin-level API access, and premium support.
Pros & Cons
✅ Powerful combination of SQL, Python, R, and visual dashboards in one tool, unlike MindsDB, which focuses primarily on ML model deployment.
✅ Clean interface that works well for tracking metrics and feature performance.
❌ Performance can slow down with very large datasets or complex queries.
#8: Metabase
Best for: Startups, product teams, and data-lean organizations that want fast, self-serve analytics with an open-source option and flexible embedding.
Similar to: Mode, Zoho Analytics.
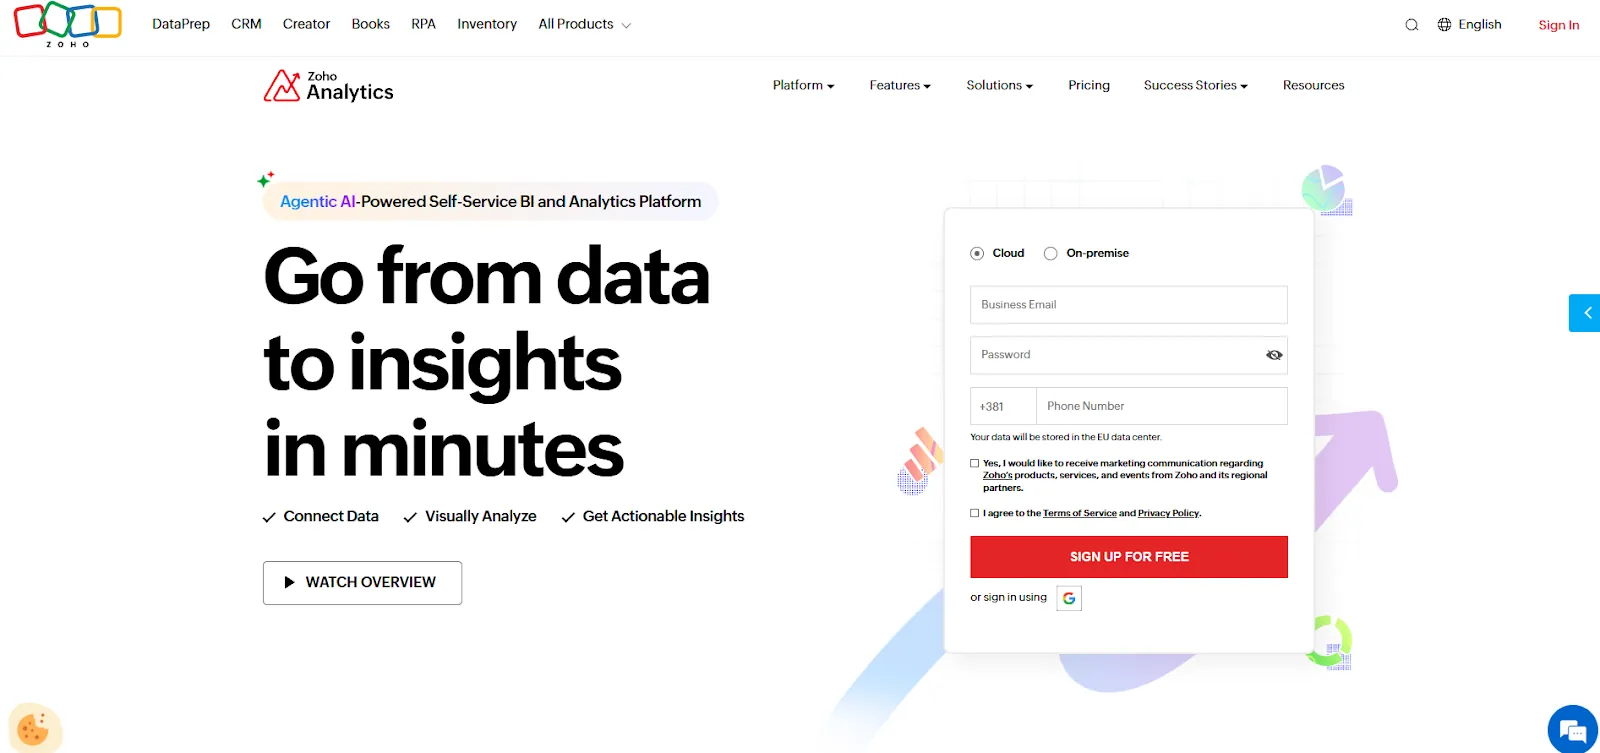
Metabase is an open-source analytics platform that's popular with startups and SaaS companies who want simple, production-ready BI without heavy infrastructure.
It's a natural Basedash alternative for teams who like the "ask questions in plain English" approach but want a free or much cheaper option to get started.
Features
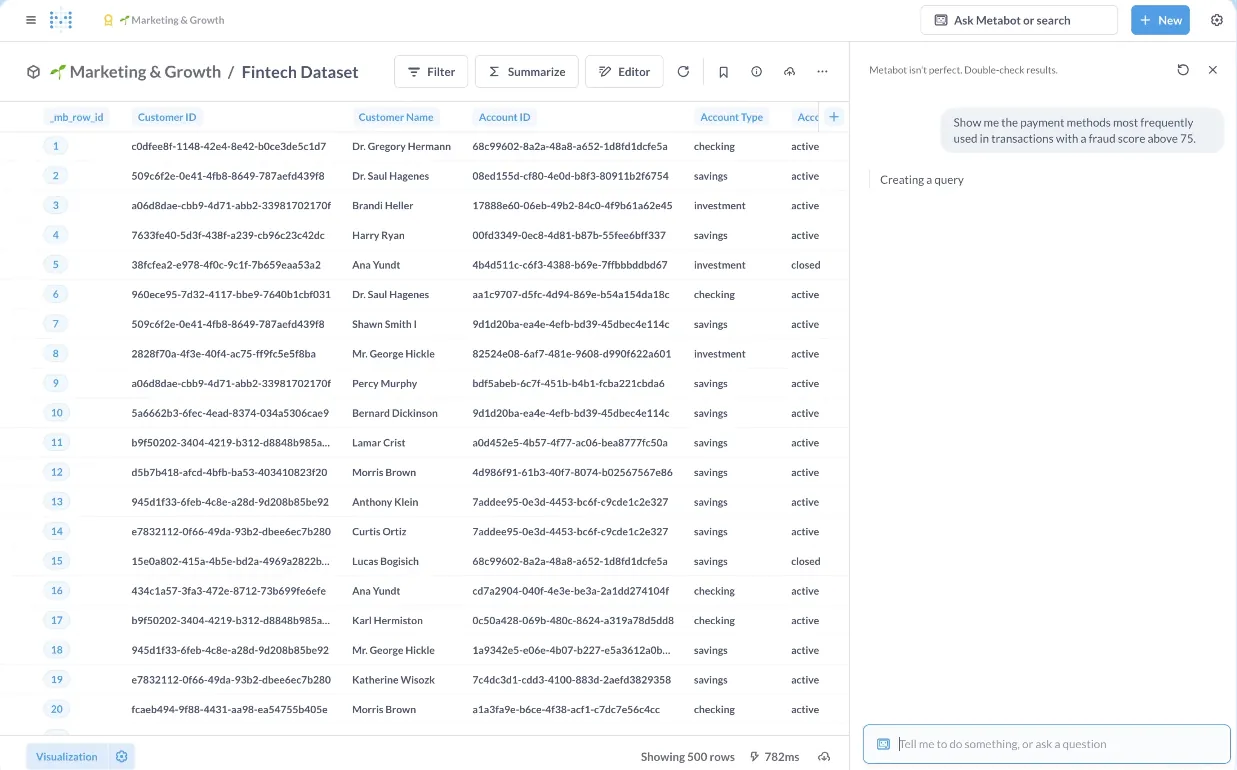
- Natural language querying with Metabot AI: Ask questions in plain English and get AI-generated queries and visualizations on top of your live database.
- No-code and SQL querying: Business users can explore data visually, while analysts can drop into raw SQL and turn queries into reusable, shareable reports.
- Drill-through exploration: Click into any chart to zoom in, filter, break out segments, or view underlying records, so users can investigate changes without writing new queries.
Pricing
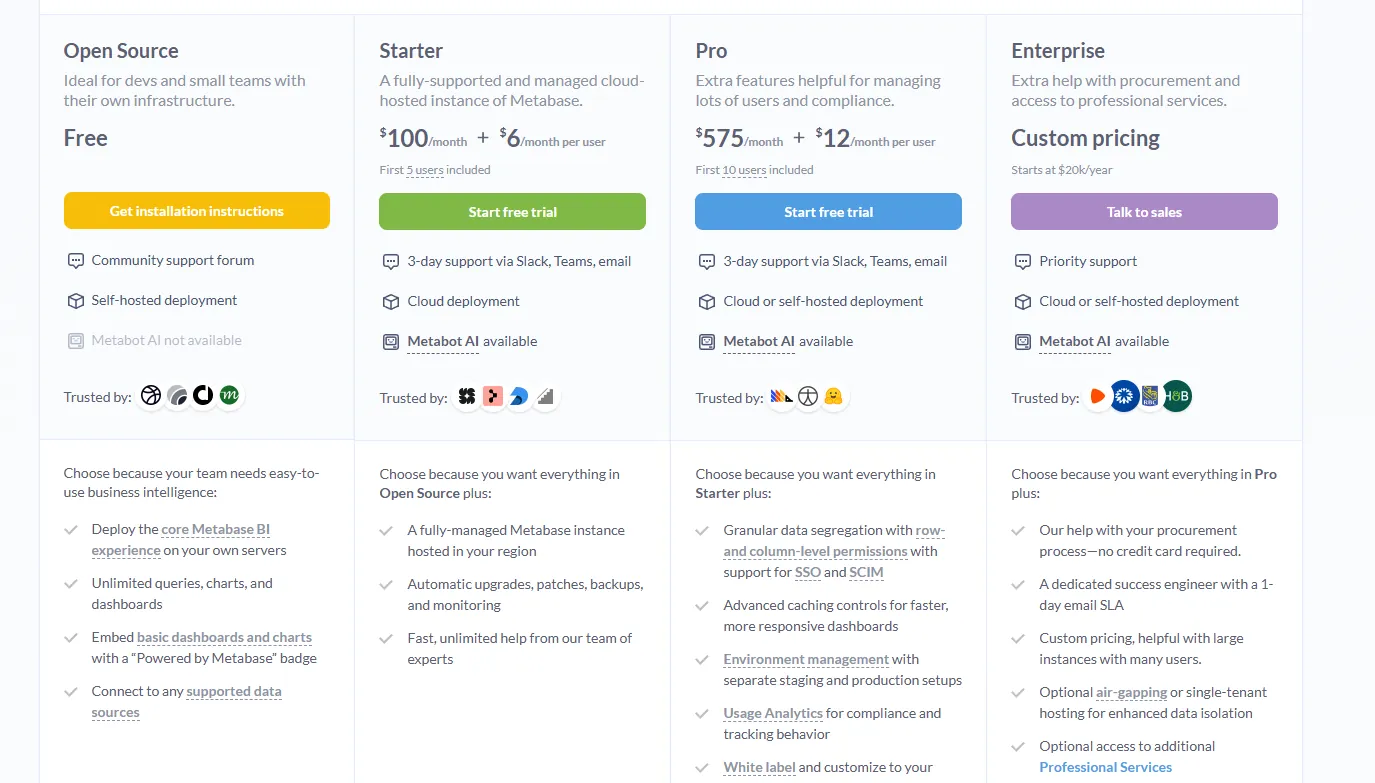
Metabase offers both BI and Embedded Analytics pricing tracks.
- The open-source edition is completely free and self-hosted, with unlimited queries and dashboards.
- Starter (cloud-hosted) costs $100/month with $6/month per additional user, and includes the first 5 users.
- Pro runs $575/month with $12/month per additional user, and adds permissions, SSO, white-labeling, and embedding.
- Enterprise has custom pricing and comes with priority support and dedicated onboarding.
Pros & Cons
✅ Easy to set up and lightweight enough for small teams to run immediately.
✅ Strong drill-through capabilities for exploring data without starting from scratch.
❌ AI features are still basic compared to more mature platforms.
#9: Zoho Analytics
Best for: Teams that want a full-featured BI platform with strong AI, lots of connectors, and good value, especially if they're already using Zoho products.
Similar to: Domo, Metabase.
Zoho Analytics is an AI-powered BI tool built on the Zoho platform that handles everything from data integration and preparation to interactive dashboards and embedded analytics.
For teams leaving Basedash because of pricing, Zoho offers a much more accessible entry point with broader functionality.
Features
- Conversational AI with Zia: Ask Zia questions in natural language to build reports, get predictions, surface insights, and receive data-driven recommendations.
- Data preparation and metrics layer: Clean, transform, and model data using 250 or more no-code transformations, with a centralized metrics layer for consistent definitions.
- Flexible dashboards and embedded analytics: Build interactive dashboards with 50 or more visualization types and embed analytics or AI assistants directly into apps and portals.
Pricing
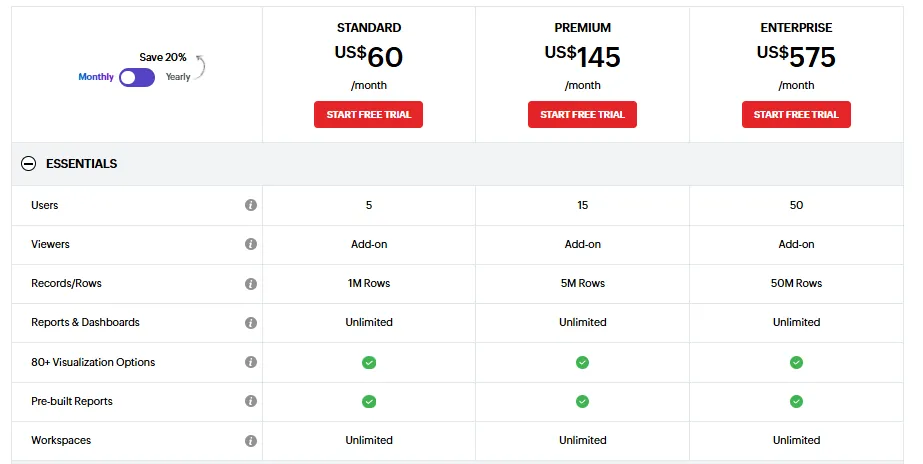
Zoho Analytics has three pricing plans:
- Standard: $60/month, includes up to 5 users, 1M rows, unlimited workspaces, reports and dashboards, basic AI features, etc.
- Premium: $145/month, includes up to 15 users, everything in Standard, plus 5M rows, more advanced data integration options, all AI features (apart from AI studio).
- Enterprise: $575/month, includes up to 50 users, everything in Premium, plus 50M rows, advanced governance and security, and AI studio.
Pros & Cons
✅ Works well with Zoho's ecosystem and popular third-party tools, making setup fast.
✅ Strong visualizations and solid value across all pricing tiers.
❌ Data syncing isn't always real-time, and exports can feel clunky for presentation-ready output.
#10: Domo
Best for: Mid-to-large teams that want an all-in-one platform combining data ingestion, dashboards, automation, and AI-driven insights.
Similar to: Zoho Analytics, ThoughtSpot.
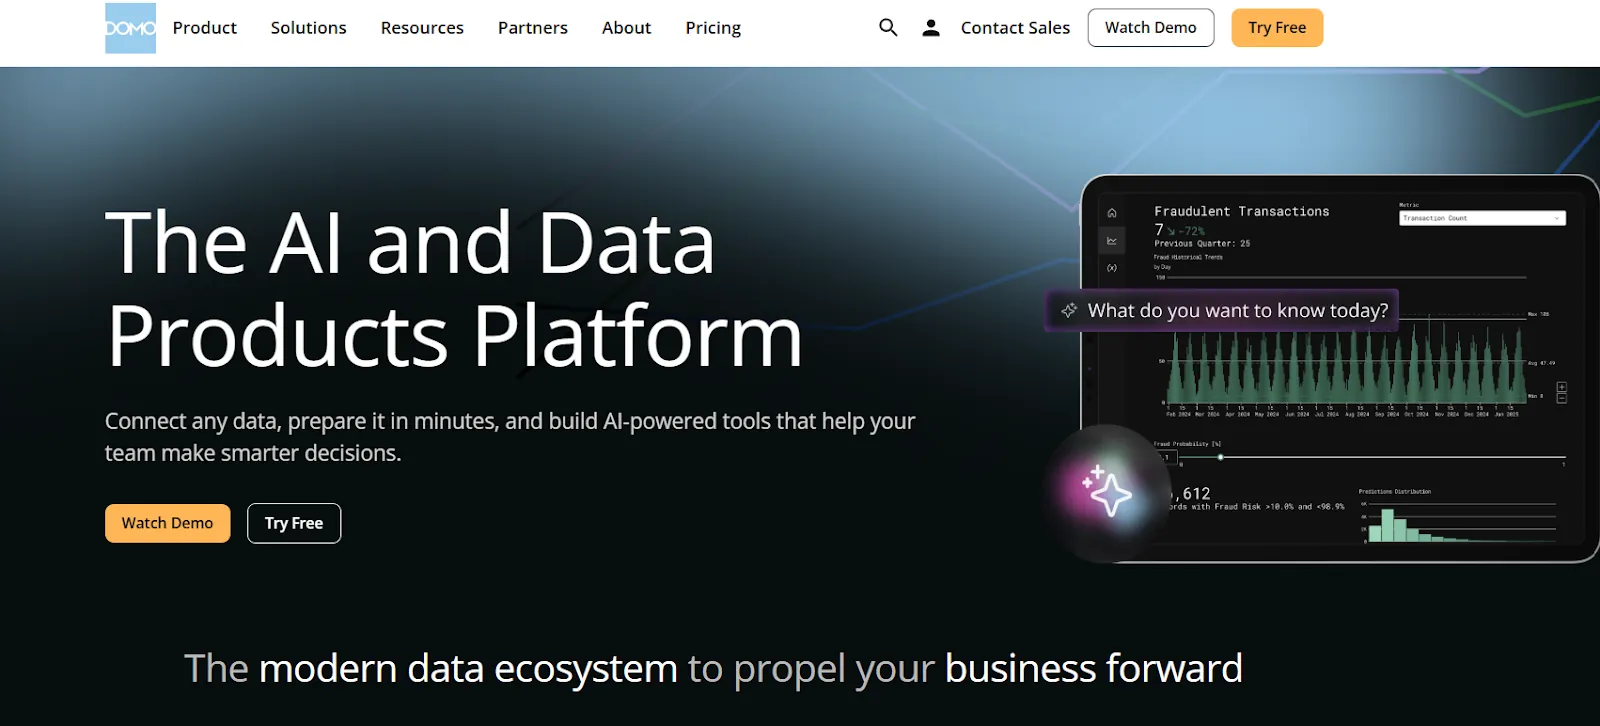
Domo is an end-to-end analytics platform that pulls data from hundreds of sources and turns it into real-time, interactive dashboards.
It goes beyond what Basedash offers by bundling data integration, app building, and workflow automation into a single platform, which can be useful for teams that don't want to stitch together multiple tools.
Features
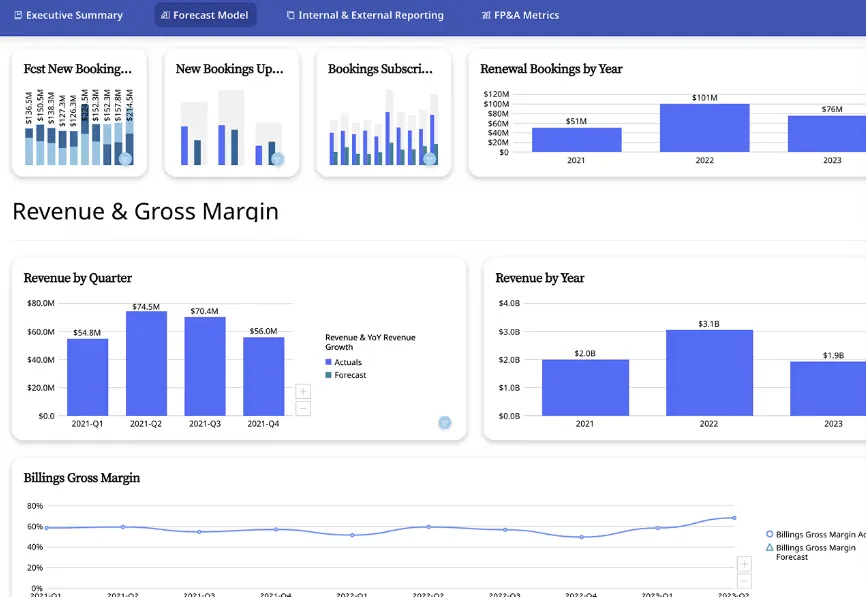
- Real-time interactive dashboards: Build dashboards that update in real time and are easy to explore, share, and embed across teams or customer-facing portals.
- No-code analytics apps: Create custom data apps tailored to specific business workflows without writing code or waiting on developers.
- AI-powered insights and natural language chat: Ask questions in plain language, surface hidden trends, and use AI agents to generate insights and trigger automated actions from dashboards.
Pricing
Domo offers a 30-day free trial with full platform access, unlimited users, and onboarding support.
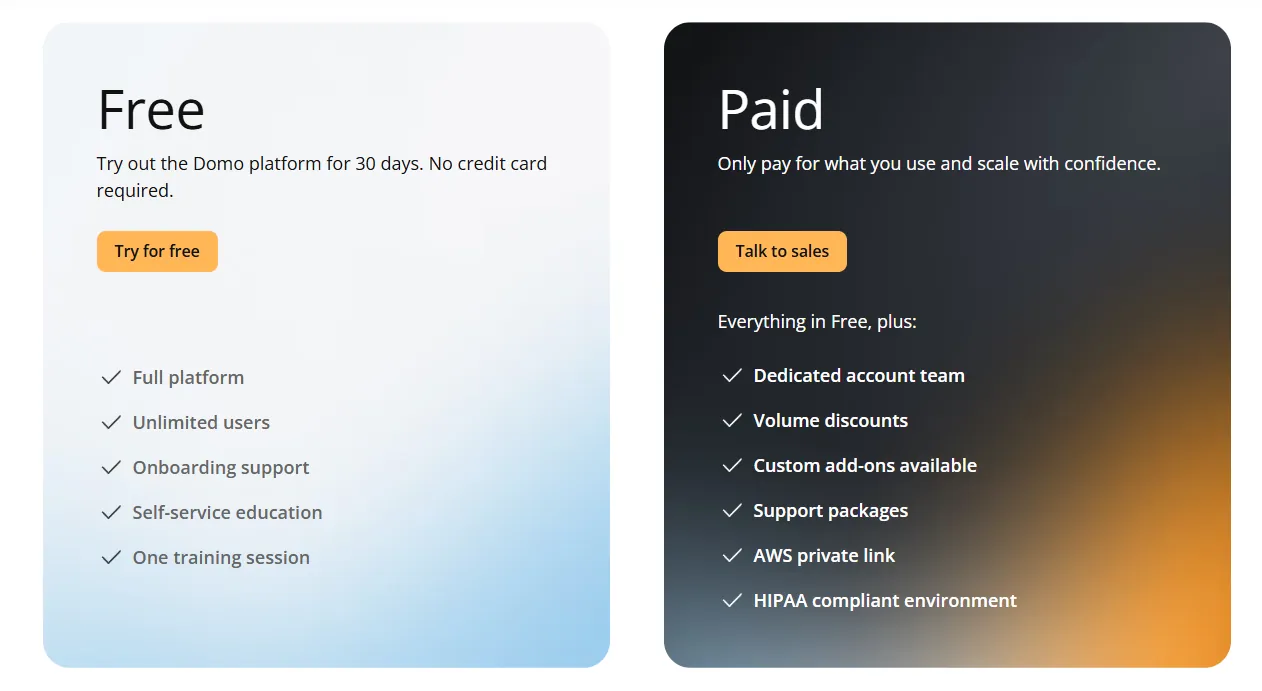
Beyond the trial, pricing is usage-based and designed to scale with your analytics needs.
For specific numbers, you'll need to contact their sales team.
Pros & Cons
✅ Very approachable for non-technical teams, with clean and intuitive dashboards.
✅ Huge connector library makes it easy to centralize data from many tools.
❌ AI features feel uneven and are sometimes pushed ahead of their readiness, which is why some teams have started looking into Domo alternatives.
Which Basedash alternative actually fits how your team works?
Basedash is good at what it was designed for: giving small teams a fast way to ask questions about their database using AI.
But many teams outgrow it once they need consistent metric definitions, automated reporting that goes beyond dashboards, or analytics depth that a traditional BI tool provides.
Most Basedash alternatives still center around the same basic idea: connect to data, build dashboards, let people explore charts.
Dot is different.
It answers business questions with written explanations and recommendations, not just tables and charts.
It automates entire executive business reviews on a set schedule.
It maintains a shared business context, so every answer is consistent across teams.
And it delivers insights where work happens, in Slack, Teams, and email, without asking anyone to log into another dashboard.
No interpreting charts. No waiting on analysts. No debating which number is right.
If your team has outgrown AI-generated dashboards and needs data that actually drives decisions, Dot is worth trying for free.
Alternatively, you can book a demo to learn more about the tool.
Theo Tortorici
Theo writes about AI-powered analytics, data tools, and the future of business intelligence at Dot.