
10 Best Julius AI Alternatives & Competitors In 2026
When people search for Julius AI alternatives, it's usually not because the tool can't analyze a spreadsheet.
It's because the analysis isn't reliable enough to trust when it actually matters.
I've tested Julius AI alongside dozens of analytics tools, and the pattern keeps showing up: it works well for simple, clean datasets.
But the moment you push into complex questions, multi-sheet files, or anything that requires consistent definitions across your team, the cracks show fast.
In this article, I'll break down the 10 best Julius AI alternatives in 2026, covering what each tool does well, where Julius AI falls short, and which option makes sense depending on how your team actually works with data.
TL;DR
- Dot is the best Julius AI alternative in 2026 for data teams and business leaders who need warehouse-connected analysis with narrative insights, automated business review reports, shared business context, and a full audit trail on every answer, delivered directly in Slack or Teams.
- Tableau, Looker, and ThoughtSpot are the strongest options for teams that want traditional or AI-assisted BI with deep visualization, governed metrics, and natural language querying at enterprise scale.
- DataGPT and Tellius are ideal for organizations that specifically need conversational analytics with automated root cause analysis and key driver detection across large datasets.
Why look for Julius AI alternatives?
The goal of this article isn't to tell you that Julius AI is a bad tool and that you should run away from it.
In fact, its customers consistently praise its natural language interface, the quality of its visualizations, and its code transparency.
You can see and edit the Python behind every analysis, which is a nice touch.
But some users warn about a few things you should be prepared for, along with some negative experiences that keep surfacing across review platforms:
#1: AI accuracy issues and inconsistent results across sessions
The most common complaint is that Julius AI can produce different answers to the same question depending on when and how you ask it.
A Trustpilot reviewer describes how the tool creates intermediate databases behind the scenes that lead to conflicting outputs when you ask follow-up questions.
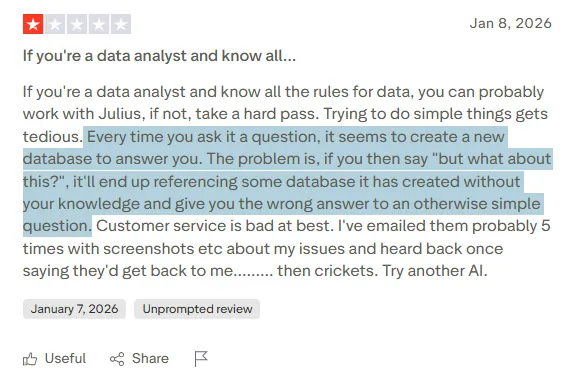
"Every time you ask it a question, it seems to create a new database to answer you. The problem is, if you then say 'but what about this?', it'll end up referencing some database it has created without your knowledge and give you the wrong answer to an otherwise simple question." - Trustpilot Review.
Without a semantic layer or persistent business definitions, there's no guarantee that "revenue" means the same thing across two different analysis sessions.
For teams that need to trust the numbers, that's a real problem.
#2: Poor handling of PDFs, complex files, and multi-sheet data
Julius AI was built for flat files first. CSVs and simple spreadsheets.
Users who try to push beyond that consistently report problems.
One reviewer attempted to extract tables from a PDF and run analysis on the results, only to get unusable output.
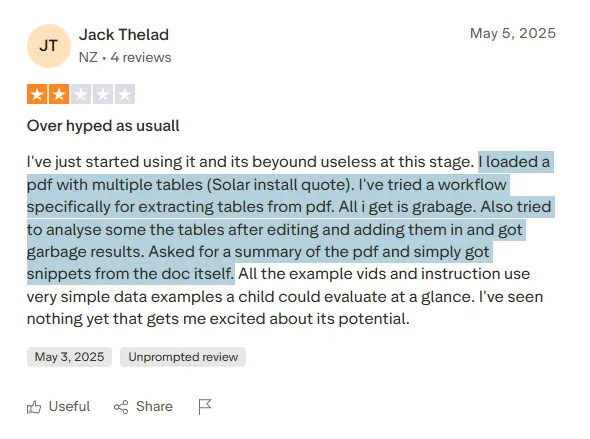
"I loaded a pdf with multiple tables (Solar install quote). I've tried a workflow specifically for extracting tables from pdf. All i get is garbage. Also tried to analyse some the tables after editing and adding them in and got garbage results. Asked for a summary of the pdf and simply got snippets from the doc itself." - Trustpilot Review.
When you move beyond clean, single-sheet data, the tool struggles to interpret structure correctly.
That's a real limitation for anyone working with messy, real-world business data.
#3: Restrictive free tier and unresponsive customer support
Julius AI's free plan gives you just 5 messages per month, and your files auto-delete after one hour. That's barely enough to test whether the tool works for your use case. And when paid users run into issues, getting help has proven difficult.
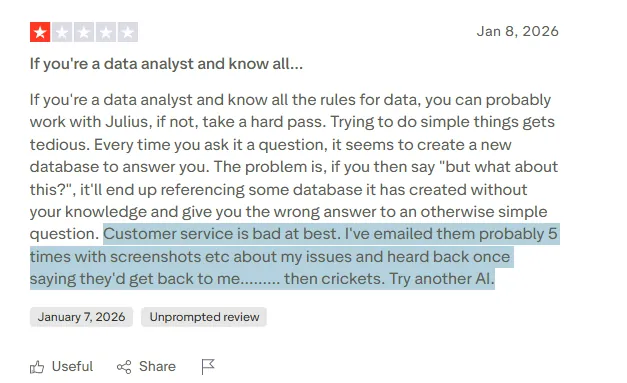
"Customer service is bad at best. I've emailed them probably 5 times with screenshots, etc., about my issues and heard back once, saying they'd get back to me... then crickets. Try another AI." - Trustpilot Review.
What are the best alternatives to Julius AI in 2026?
The best alternatives to Julius AI in 2026 are Dot, Tableau, and ThoughtSpot.
Here's my shortlist of the 10 best Julius AI alternatives on the market:
| Tool | Best For | Pricing |
|---|---|---|
| Dot | Data teams that need warehouse-connected AI analysis with narrative insights, automated business reviews, and full audit trails, delivered in Slack or Teams. | Free plan available. Paid starts at $799 per month. |
| Tableau | Data teams and enterprises that need advanced visualization, exploratory analysis, and flexible cloud or self-hosted deployment. | Starts from $75 per user per month. |
| ThoughtSpot | Organizations that want AI-powered, self-service analytics with natural language search and automated dashboards. | Starts from $25 per user per month. |
| Looker | Data teams that want governed, warehouse-native BI with consistent metrics and tight Google Cloud integration. | Pricing not public. |
| DataGPT | Decision-makers who want analyst-grade answers to complex "why" questions without dashboards or SQL. | Starts from $2,750 per month. |
| Tellius | Business and analytics teams that need fast, explainable answers with automated root cause and key driver analysis. | Pricing not public. |
| Zenlytic | Data teams that want governed, explainable self-serve analytics with a semantic layer that keeps answers consistent. | Pricing not public. |
| Metabase | Startups and product teams that want fast, self-serve analytics with natural language querying and flexible embedding. | Free (open source). Cloud from $100 per month. |
| Microsoft Power BI | Organizations already in the Microsoft ecosystem that want standardized dashboards, reporting, and self-service analytics. | Starts from $14 per user per month. |
| Zoho Analytics | Teams that want affordable BI with AI features and lots of connectors, especially if they already use Zoho apps. | Starts from $60 per month. |
#1: Dot
Dot is the best Julius AI alternative in 2026 for data teams and business stakeholders who need reliable, warehouse-connected analysis with clear explanations, consistent definitions, and decision-ready outputs.
Not just charts and code.
Unlike Julius AI, where you upload a CSV and hope the AI interprets your question correctly each time, Dot connects directly to your data warehouse and maintains a persistent business context across every query.
When someone asks "why did conversion drop last week?" on Monday and someone else asks the same question on Thursday, they get the same answer grounded in the same logic.
That difference matters more than it sounds. Here are the features that make Dot stand out as a Julius AI alternative:
Ad-hoc analysis delivered in Slack or Teams
Julius AI lives inside its own web app. You upload a file, type a question, and wait for a response in the browser.
That works for solo analysis, but it doesn't fit how teams actually operate day to day.
Dot takes a different approach by letting anyone on the team ask business questions directly inside Slack or Microsoft Teams.
Instead of navigating to a separate tool, uploading data, and hoping the AI gets it right, stakeholders type a question where they already work and get a full analysis back in minutes.
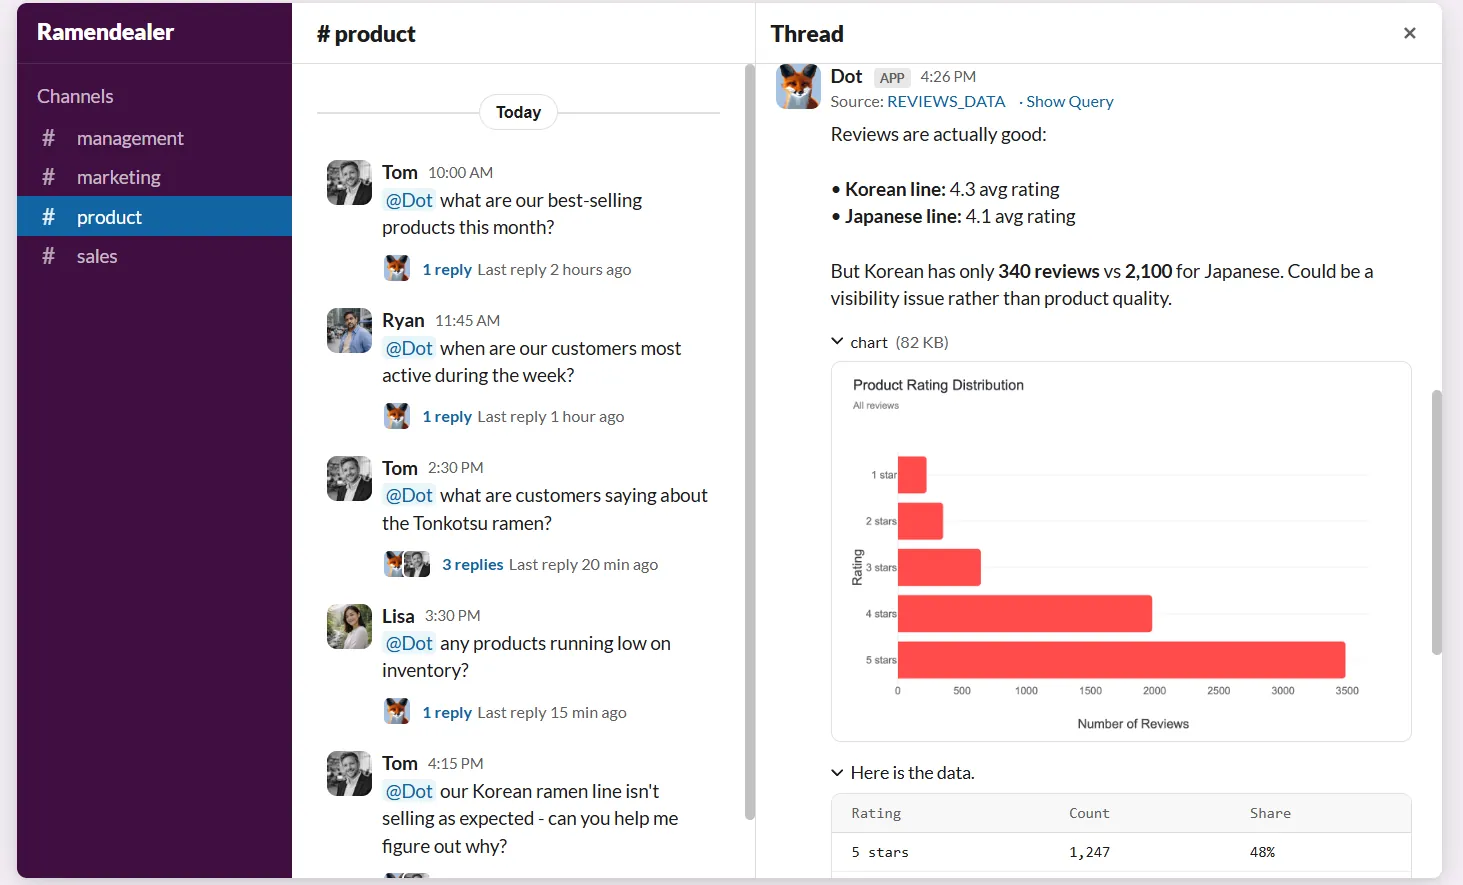
The response goes beyond raw numbers.
It explains what's happening, flags which segments or regions are driving the change, and suggests what to look at next.
- For data teams, this absorbs a huge volume of ad-hoc requests that would normally interrupt planned work.
- Business users get answers without needing to learn SQL or data models.
- Analysts get their time back to focus on deeper, higher-impact work.
💡 Emerge's team experienced this firsthand.
Their Director of Software Engineering, Jeff Albenberg, put it simply: "Team members could just ask Dot a question in Slack and get the answer within seconds – the first time it happened, a lot of us were honestly amazed."
The result? Over 2,000 hours saved per year and a 10x return on investment.
Persistent business context that keeps answers consistent
This is where Julius AI's architecture becomes a real liability.
Every time you start a new chat in Julius, you're starting from scratch.
There's no memory of how your team defines "active user" or which table contains the correct revenue data.
The AI guesses. And it doesn't always guess the same way twice.
Dot solves this with a Context Agent that learns and maintains business definitions, metric logic, and documentation across your entire data environment.
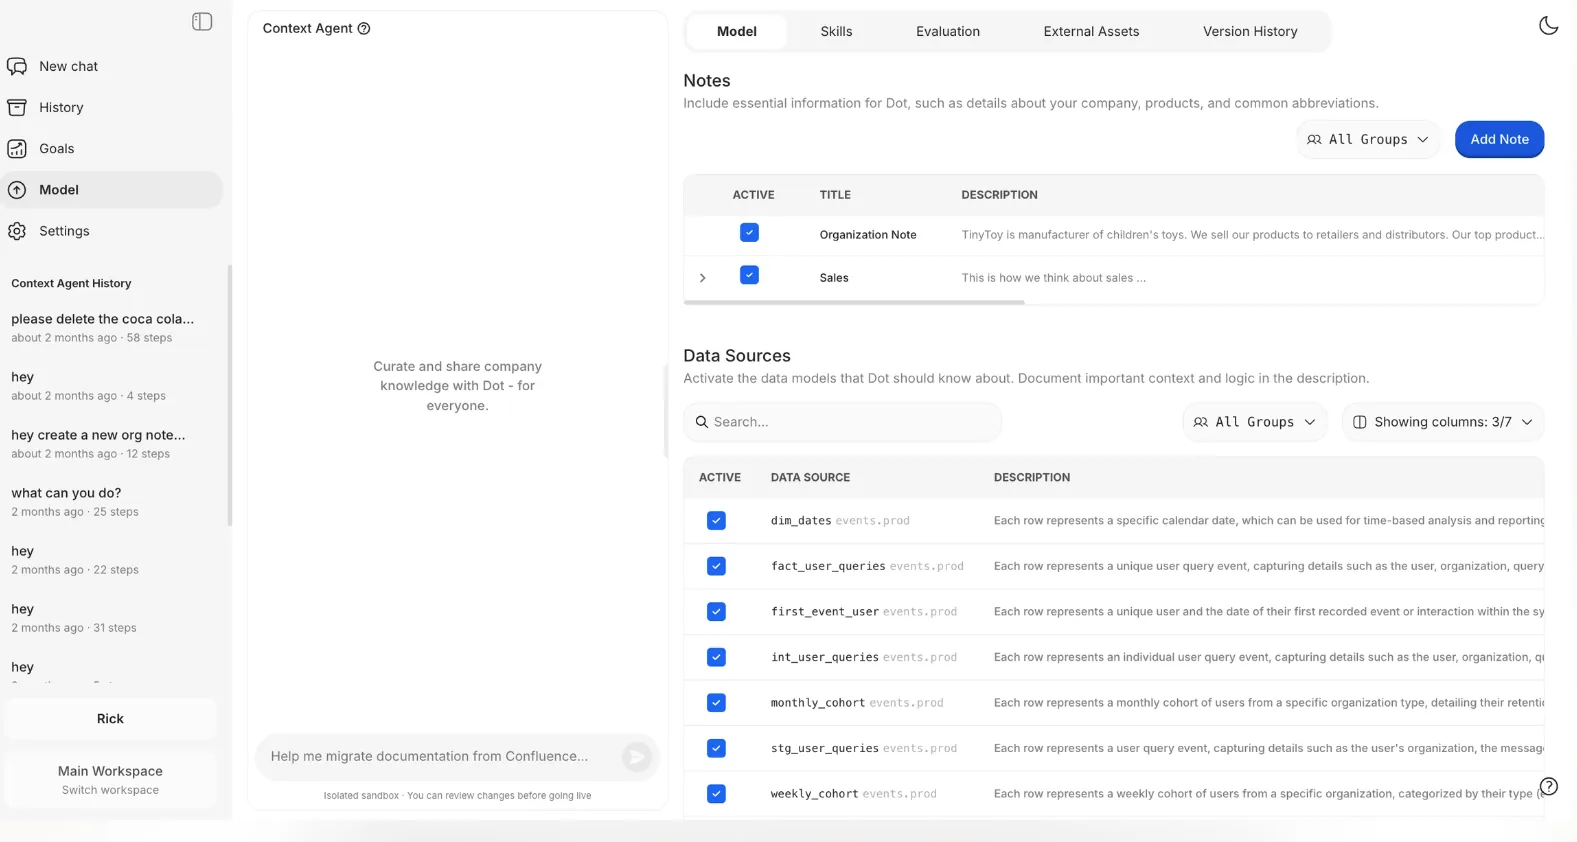
It tracks how key metrics are calculated, which tables should be used, and how different departments talk about the same concepts.
Then it applies that context every time it generates an insight or report.
In practice, your team stops debating "which number is right?" Every answer Dot produces is grounded in the same shared understanding of the business, which builds trust in the data over time.
Automated executive-ready business reviews
One of the biggest gaps in Julius AI is that it's built for one-off questions. Need a weekly or monthly business review?
Someone still has to manually run analyses, screenshot charts, paste them into slides, and write up the narrative explaining what changed.
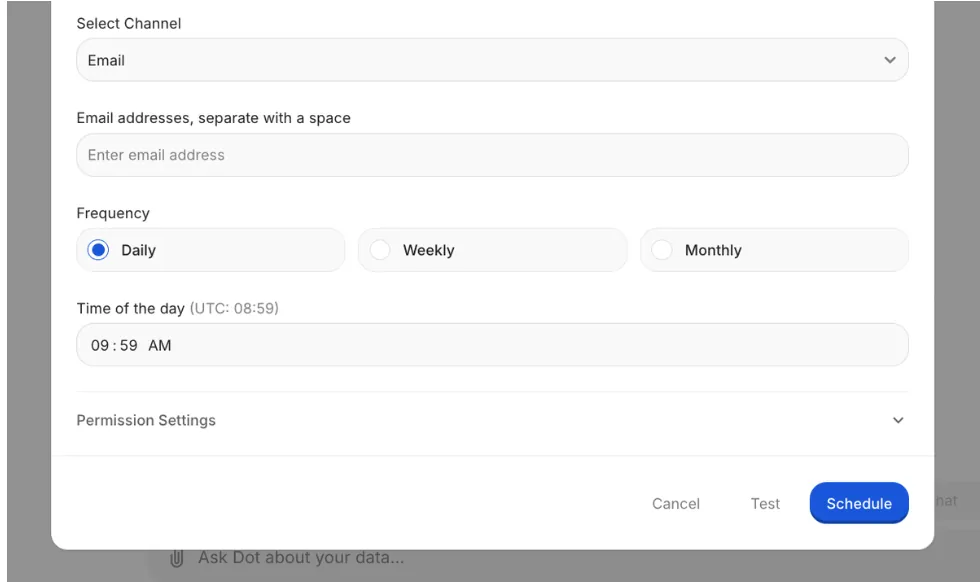
Dot automates the entire process. It generates executive-ready reports on a set schedule (daily, weekly, or monthly) directly from the data warehouse.
These aren't dashboards with numbers that someone has to interpret.
They're written narratives that explain what happened, what changed compared to previous periods, and where leadership should focus attention.
Leadership gets a consistent, easy-to-read update without needing to interpret charts.
Data teams stop spending hours every week producing the same reports manually. The reporting process runs itself.
Full audit trail on every insight
Julius AI shows you the Python code behind each analysis, which is useful.
But Dot goes further by attaching a complete audit trail to every insight it produces, linking directly back to the underlying SQL queries, Python logic, and exact datasets used.
There's no guessing about where numbers came from or how they were calculated. Everything is inspectable.
For data leaders who need to stand behind the numbers in a board meeting or executive review, this turns analytics from "I think this is right" into "here's exactly how we got here."
Dot's integrations
Dot connects directly to modern data warehouses like Snowflake, BigQuery, Redshift, and Databricks, along with operational databases like Postgres, MySQL, and SQL Server.
It also works with semantic layers and transformation tools like dbt, Looker, Power BI models, and Cube, reusing existing business logic instead of forcing teams to recreate it inside yet another tool.
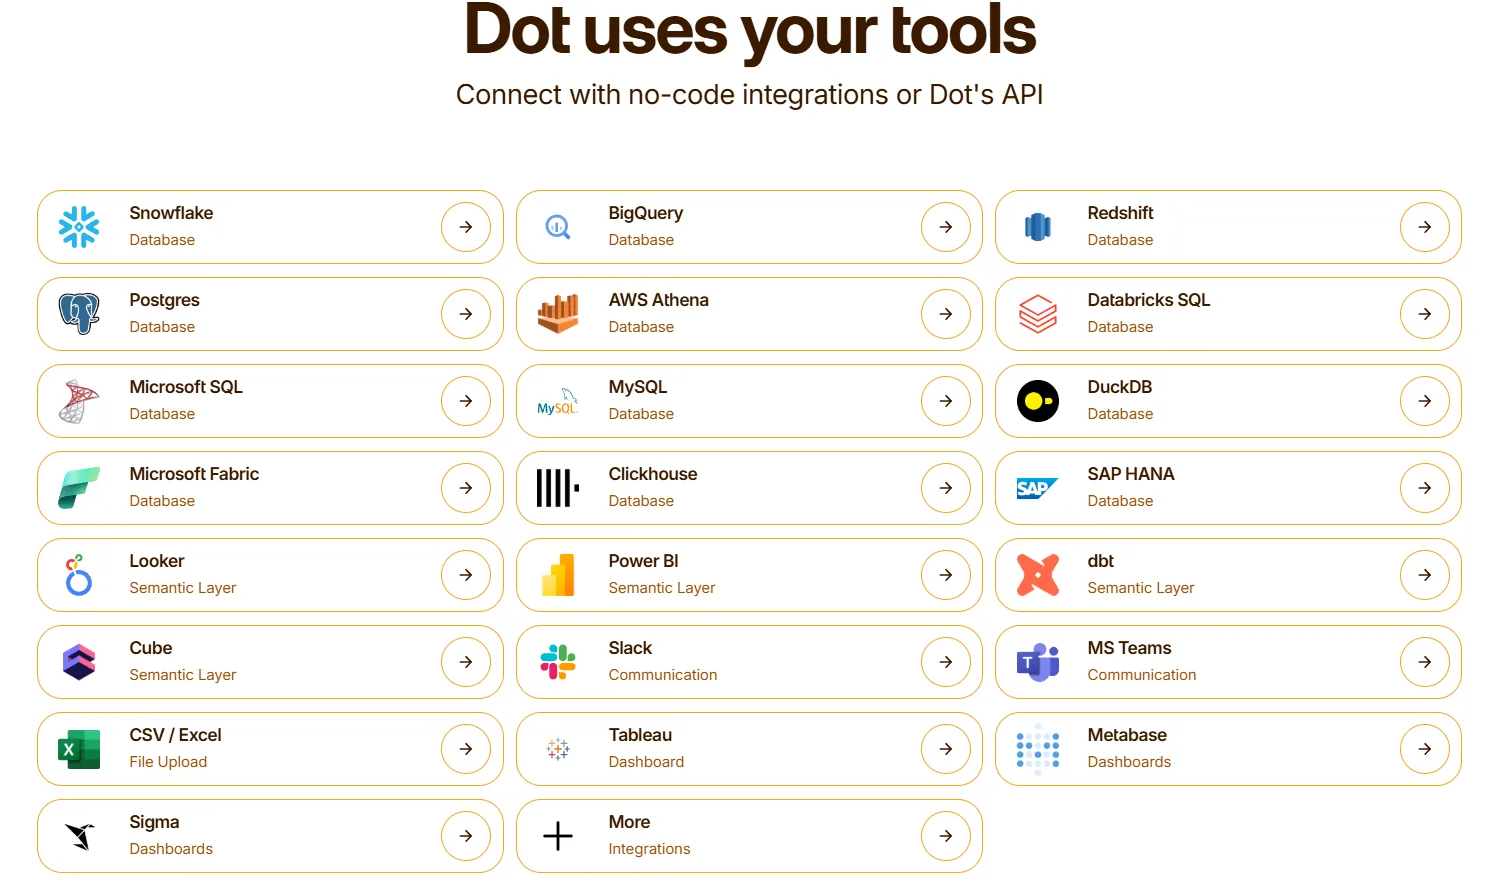
Insights are delivered through Slack, Microsoft Teams, email, and the web app. Dot can sit alongside existing BI tools like Tableau, Metabase, or Sigma, complementing them rather than replacing everything at once.
How is Dot different from Julius AI?
The core difference between Dot and Julius AI isn't features. It's what each tool is designed to do.
Julius AI is a personal AI analyst. You upload a file, ask a question, and get an answer in a browser tab.
It works fine for quick, individual exploration.
But it has no concept of your team's shared definitions, no connection to your live data warehouse, and no way to produce recurring reports or deliver insights where teams actually work.
Dot is built for teams and organizations.
It connects to your warehouse, maintains shared business context, produces scheduled executive reports, and delivers answers in Slack or Teams.
Where Julius AI gives you a chart, Dot gives you a narrative explanation with context, recommendations, and a full audit trail.
At a practical level, Julius AI helps individuals explore data. Dot helps teams understand it and act on it.
Pricing
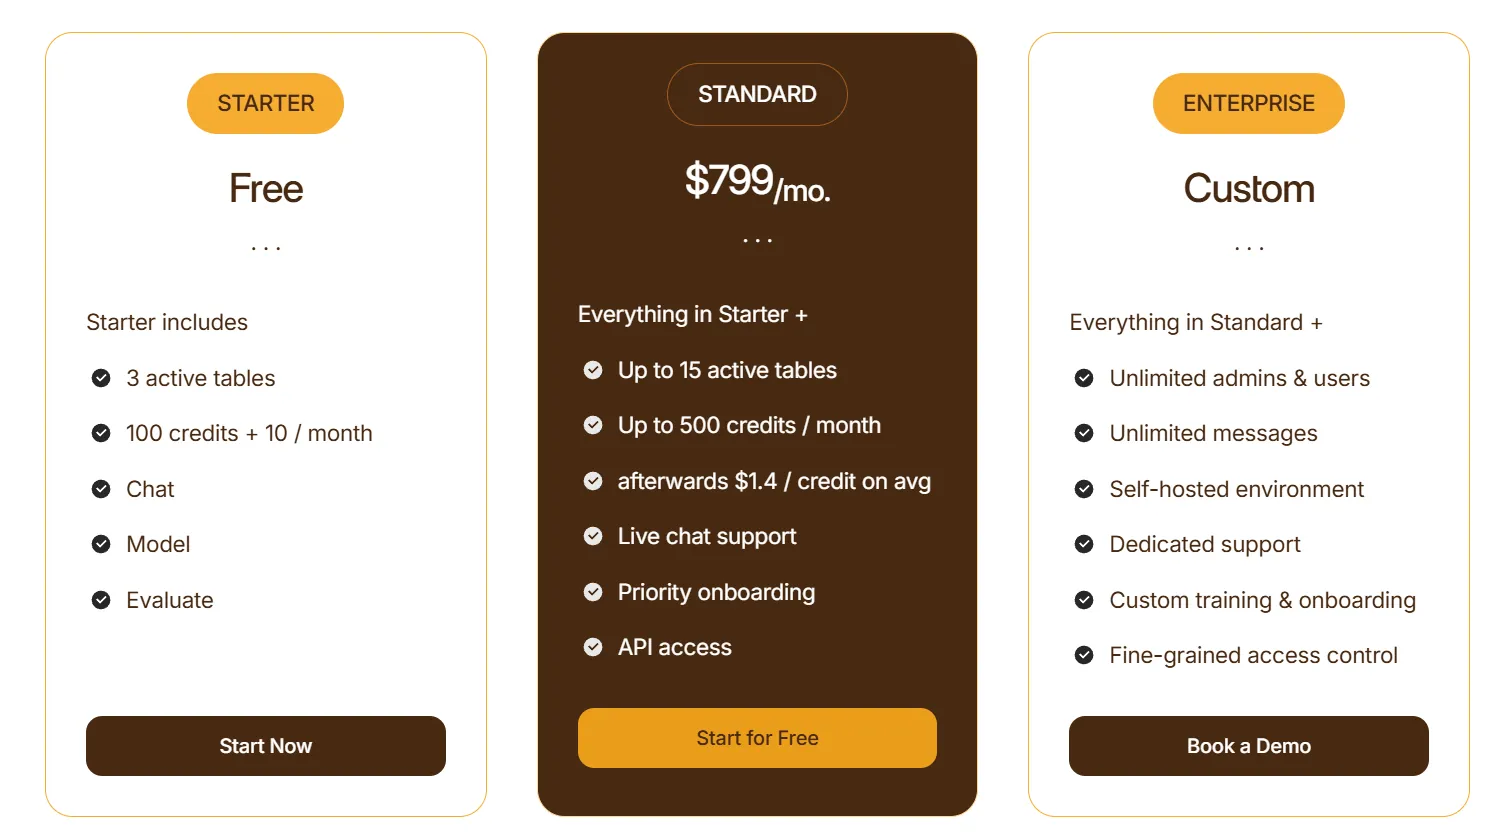
Dot uses a credit-based pricing model:
- Starter: Free plan. Includes 3 active tables, 100 credits (then 10 per month), chat-based analysis, and model access.
- Standard: $799 per month. Includes up to 15 active tables, up to 500 credits per month, additional credits at $1.40 each, live chat support, priority onboarding, and API access.
- Enterprise: Custom pricing. Includes unlimited users and admins, unlimited messages, self-hosted environment, dedicated support, custom onboarding and training, and fine-grained access controls.
Pros & Cons
✅ Connects directly to your data warehouse instead of requiring manual file uploads like Julius AI.
✅ Maintains persistent business context and shared metric definitions, so answers stay consistent across the team.
✅ Automates executive-ready business reviews on a schedule, something Julius AI can't do at all.
✅ Full audit trail on every insight, with links to underlying SQL, logic, and datasets.
✅ Delivers analysis in Slack and Teams instead of locking insights inside a separate app.
✅ Credit-based pricing that doesn't charge per seat for basic access.
❌ Not built for individual, file-upload-style analysis, the way Julius AI is. It's designed for teams with an existing data warehouse.
❌ Not a traditional BI or dashboarding tool.
#2: Tableau
Best for: Data teams and enterprises that need advanced visualization, exploratory analysis, and flexible cloud or on-premise deployment.
Similar to: Looker, Qlik Sense.
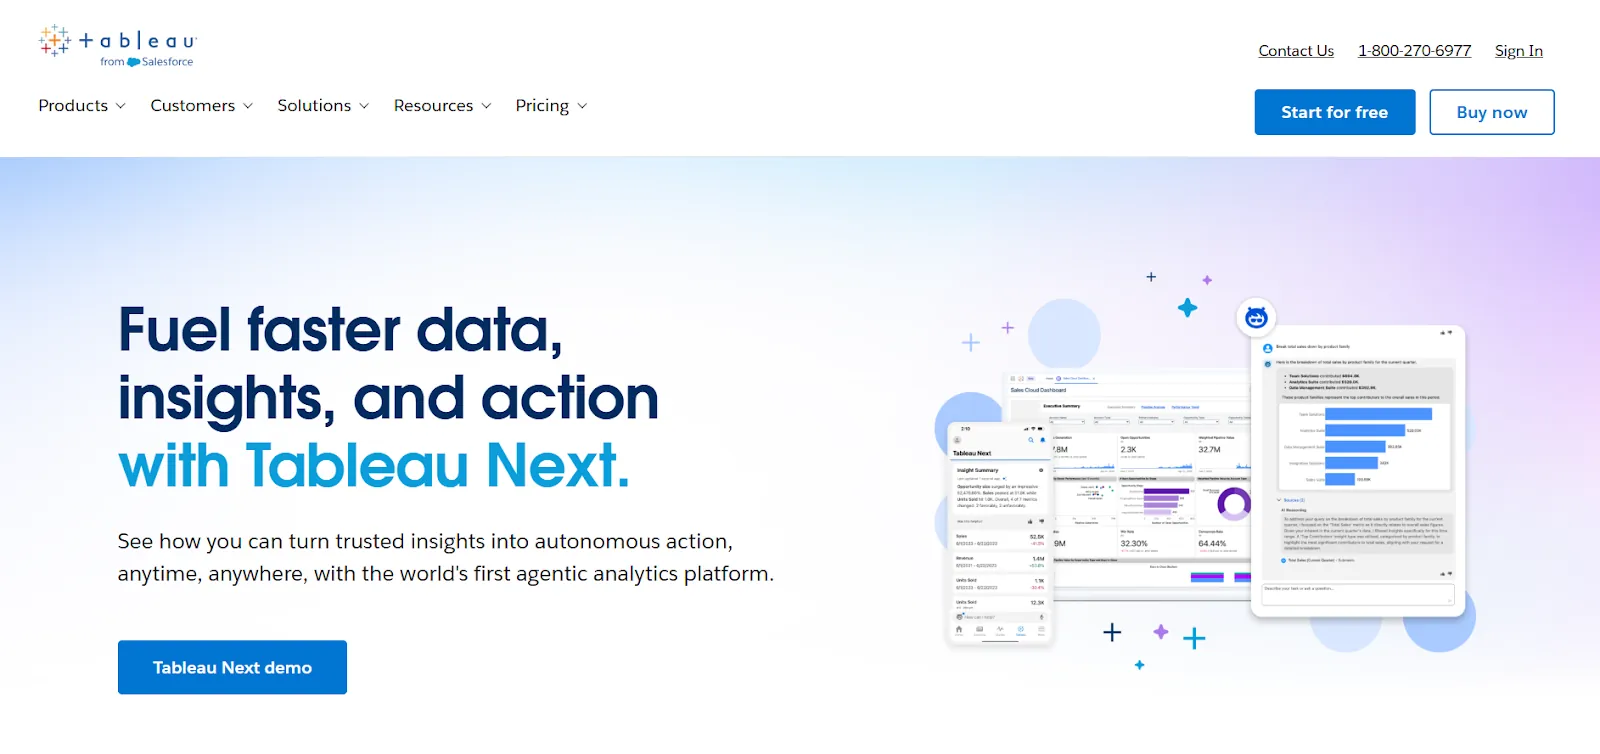
Tableau is one of the most established BI platforms in the market, known for its powerful data visualization engine and hands-on, exploratory approach to analytics.
Unlike Julius AI, which focuses on conversational analysis of uploaded files, Tableau is built for teams that want to explore large, complex datasets visually and build interactive dashboards that scale across departments.
Features
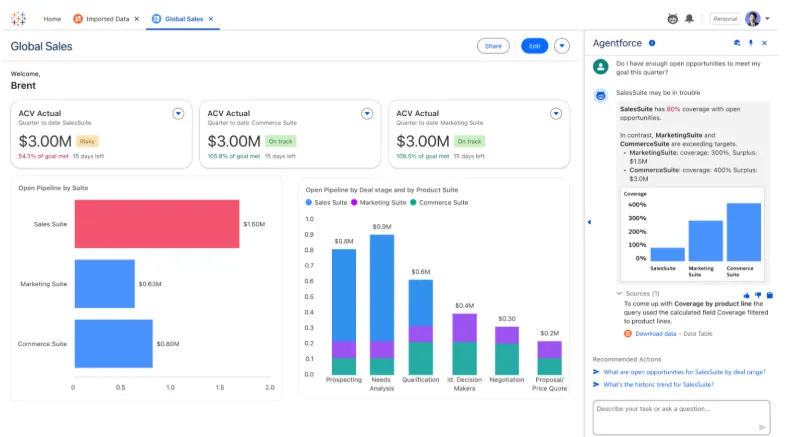
- Visual analytics engine (VizQL): Create interactive dashboards with drag-and-drop controls, rich chart types, and drill-downs that let users explore data patterns without writing code.
- Agentic analytics via Tableau Next: AI-powered agents that deliver personalized insights, answer natural language questions, and trigger actions inside tools like Slack and Salesforce.
- Centralized governance and security: Role-based access, reusable metrics through Tableau Pulse, and data management features that help teams scale analytics without losing control.
Pricing
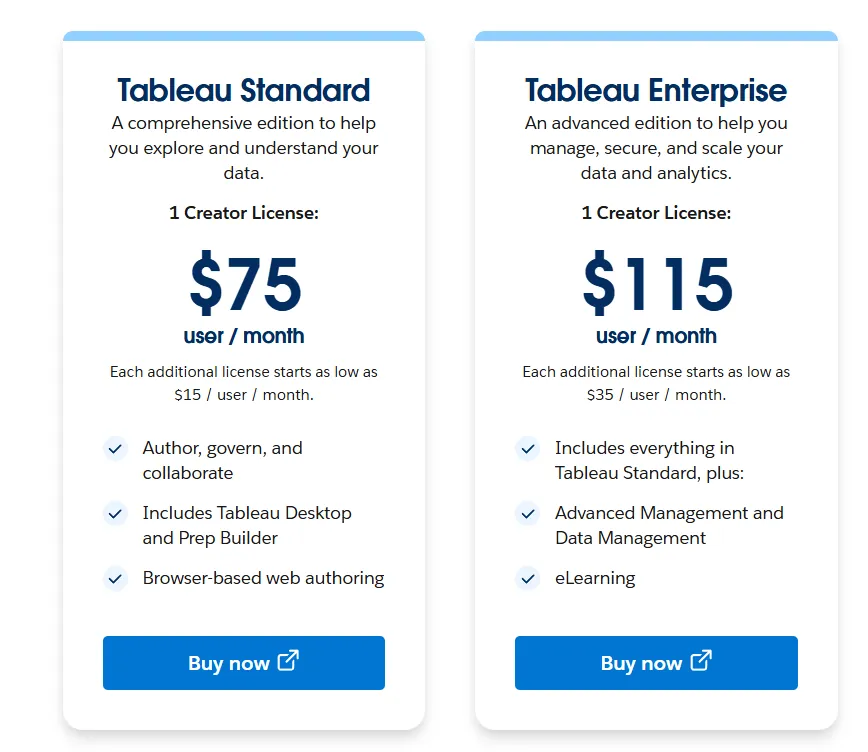
Tableau charges per user, per month, with different plans for cloud and server deployment:
- Tableau Cloud Standard: $75 per creator per month. Additional viewers from $15 per user per month.
- Tableau Cloud Enterprise: $115 per creator per month. Additional viewers from $35 per user per month. Includes advanced governance.
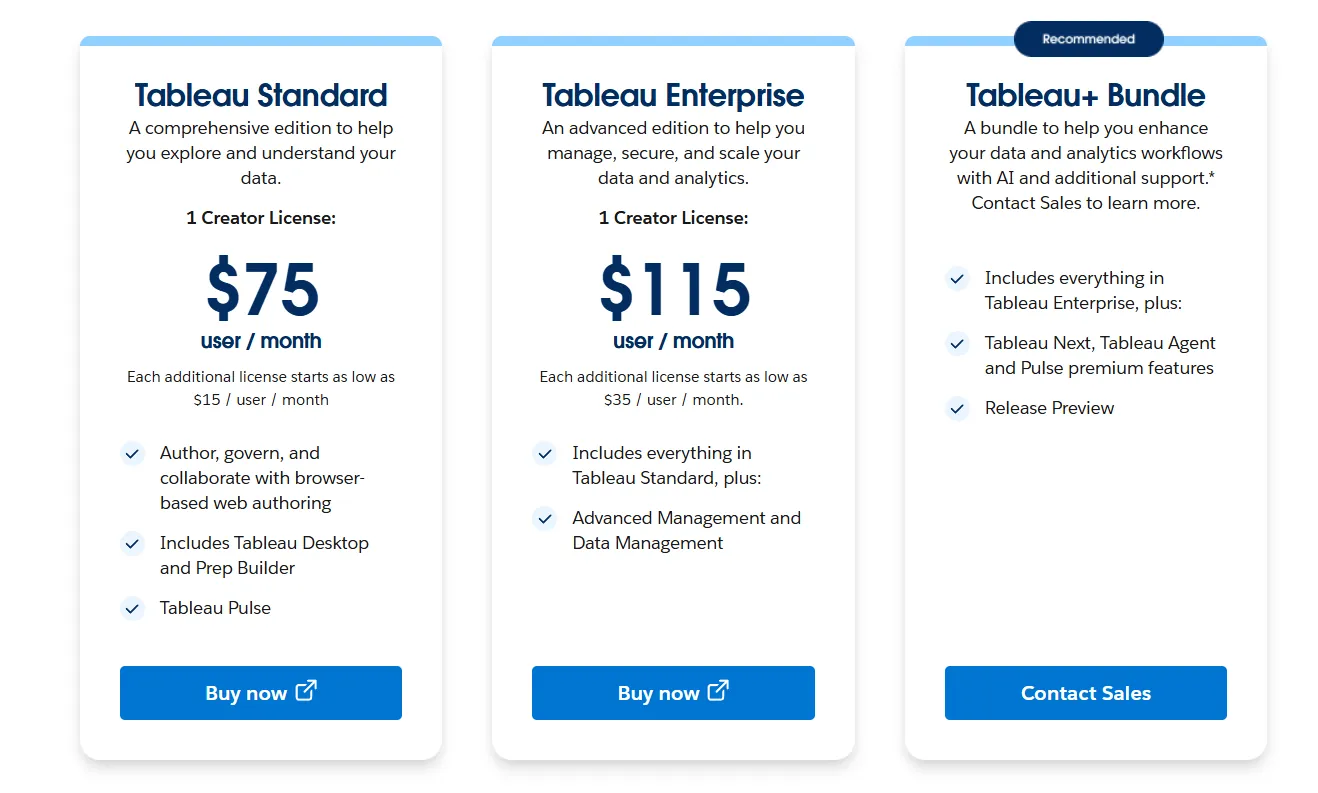
- Tableau Server Standard: $75 per creator per month. Same viewer pricing as Cloud.
- Tableau Next (agentic analytics): Annual contract required. Custom pricing.
Pros & Cons
✅ Best-in-class data visualization and storytelling capabilities.
✅ Drag-and-drop interface that lets users build and iterate on dashboards quickly without heavy coding.
✅ Large ecosystem with deep community support and learning resources.
❌ Steep learning curve once you move past basic dashboards into advanced calculations and data modeling.
❌ Per-user pricing adds up quickly for larger organizations.
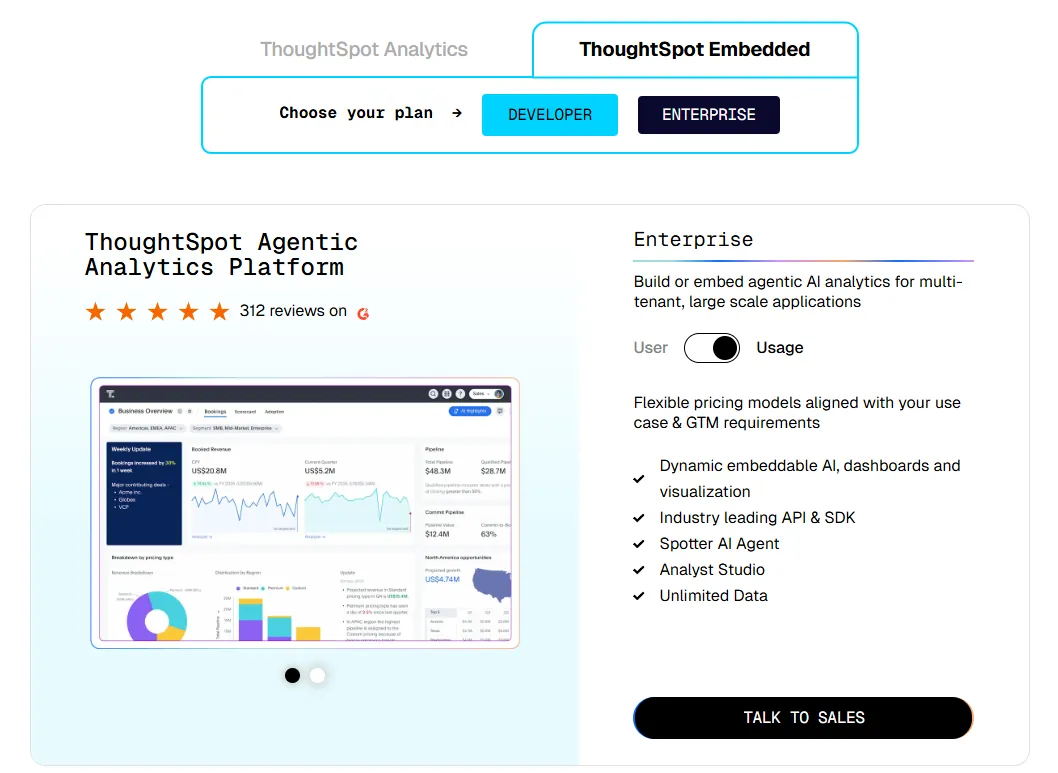
#3: ThoughtSpot
Best for: Organizations that want AI-driven, self-service analytics with natural language search and automated dashboards, without relying on traditional BI workflows.
Similar to: DataGPT, Tellius.
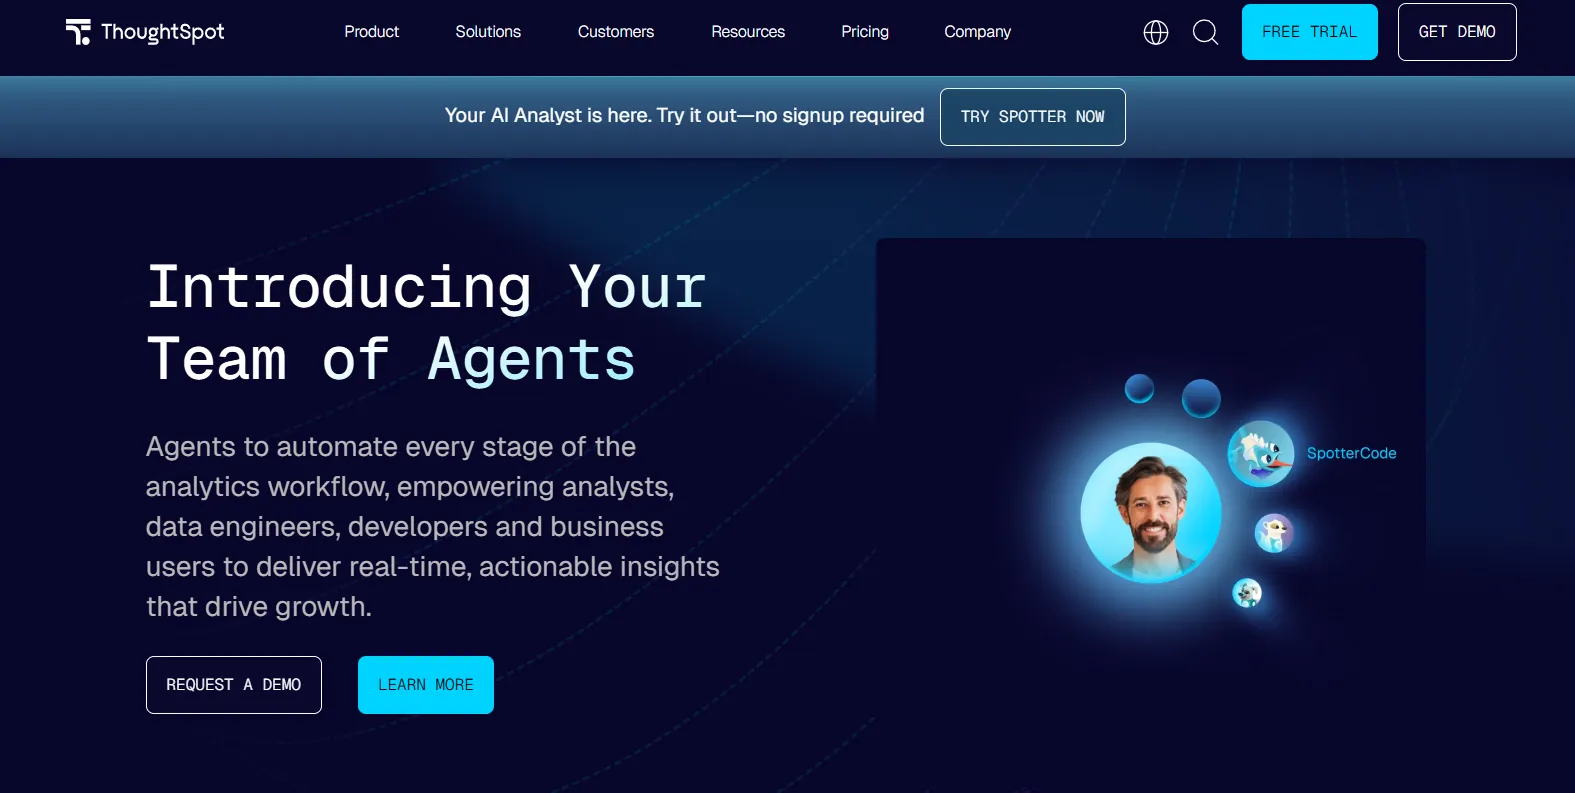
ThoughtSpot is an AI-first analytics platform designed to let users ask questions in plain language and get instant, governed answers from live data.
Unlike Julius AI, which requires you to upload files and start from scratch each session, ThoughtSpot connects to your existing data sources and provides real-time answers that respect your organization's metric definitions and access controls.
Features
- Natural language search: Type questions in plain English and get governed, instant answers backed by live data. No dashboard navigation required.
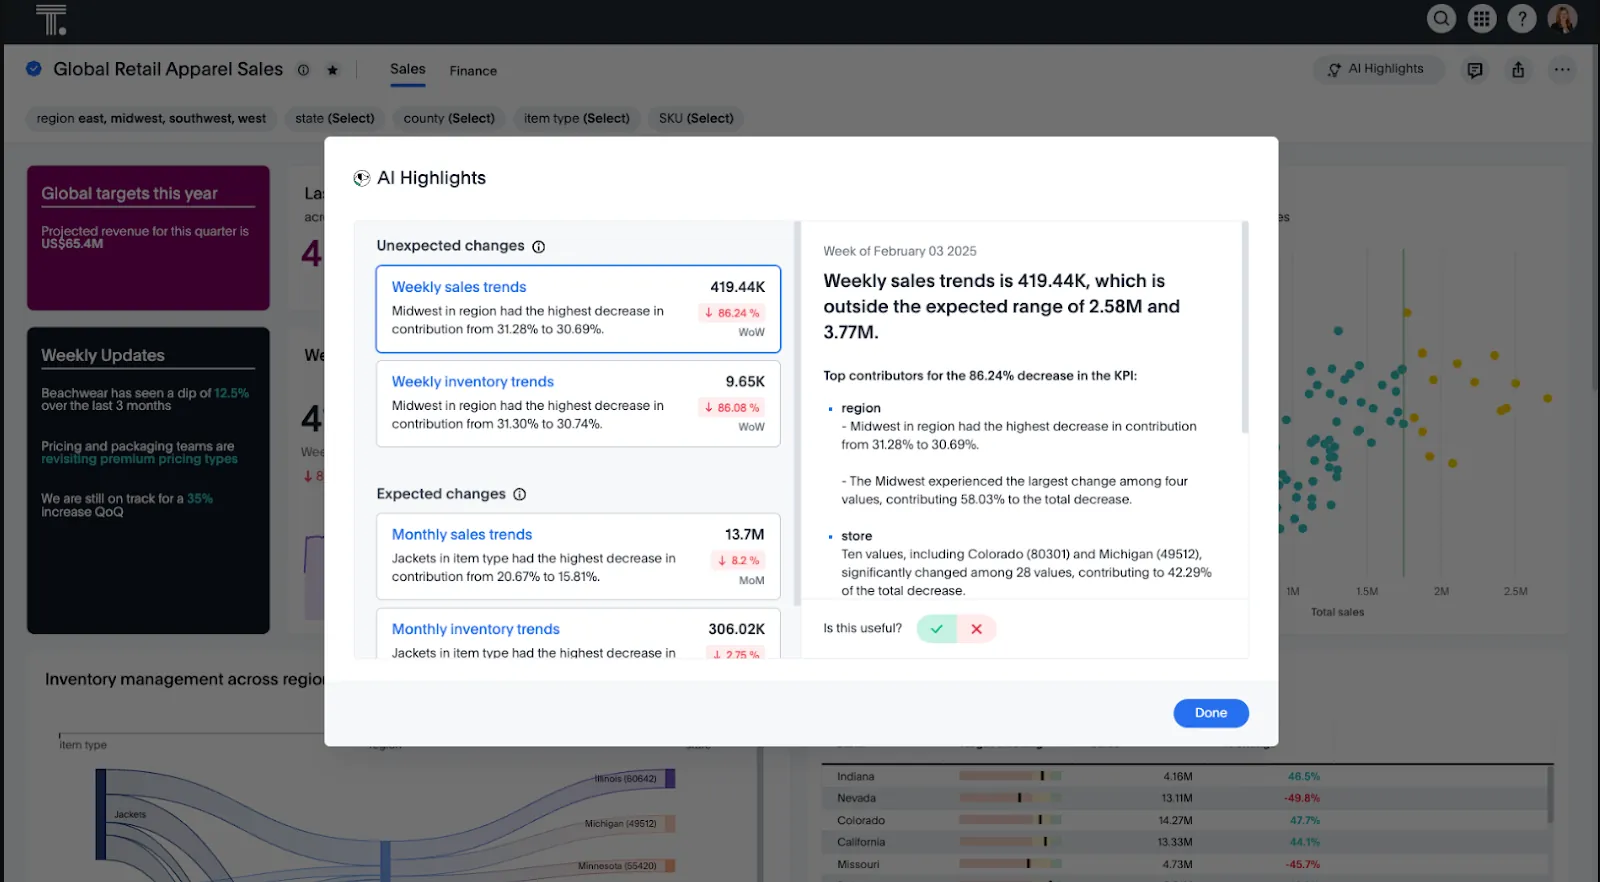
- AI analytics agents (Spotter): Agentic tools that automatically generate analyses, dashboards, and insights from both structured and unstructured data.
- Automated dashboards (SpotterViz): Turn raw data into complete, styled dashboards instantly, without manual layout or chart configuration.
Pricing
ThoughtSpot offers two product lines with flexible pricing:
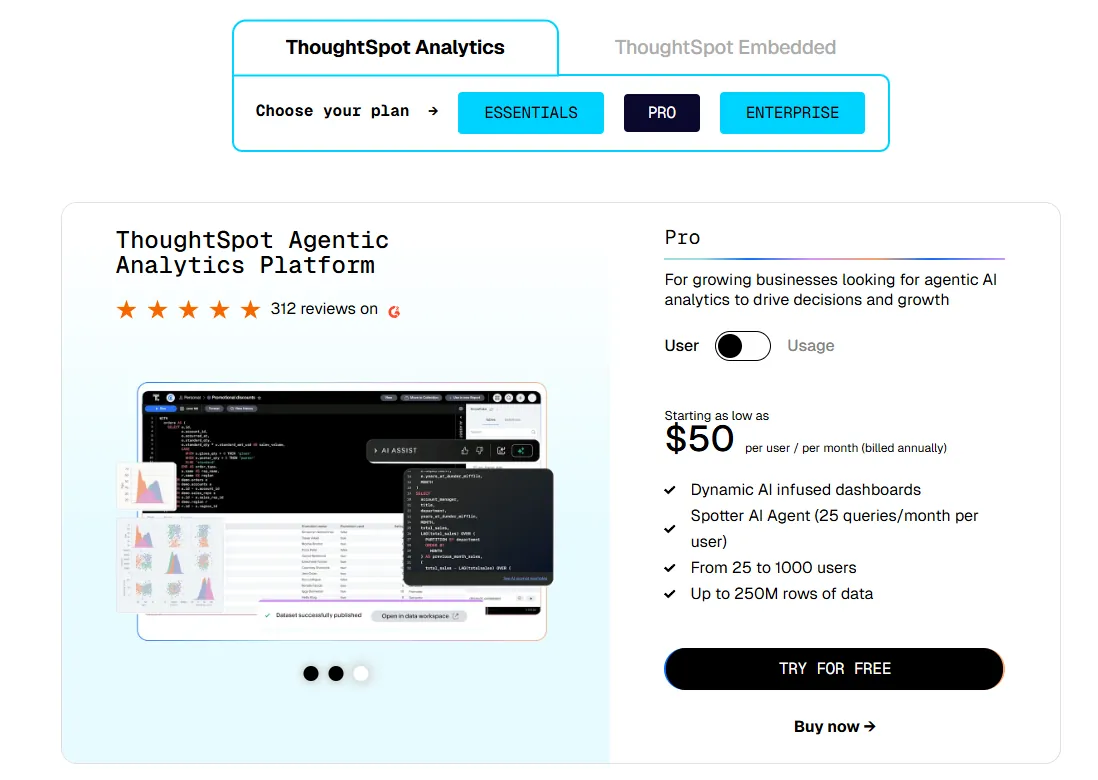
- Essentials: From $25 per user per month (billed annually). For teams of 5 to 50 users. Up to 25M rows.
- Pro (per user): From $50 per user per month (billed annually). Includes Spotter AI Agent. Up to 250M rows.
- Pro (usage-based): From $0.10 per query.
- Enterprise: Custom pricing. Unlimited users and data.
- ThoughtSpot Embedded:
- Developer: Free for 1 year, includes embeddable AI analytics, dashboards, and visualizations, APIs and SDKs, up to 10 users and 25M rows of data.
- Enterprise (user-based): Custom pricing, includes everything in Developer, plus unlimited data.
- Enterprise (usage-based): Custom pricing, everything in Enterprise, plus Spotter AI Agent and Analyst Studio.
Pros & Cons
✅ Easy for non-technical users to get started with natural language search and guided analytics.
✅ AI surfaces patterns, trends, and explanations faster than manual dashboard exploration.
✅ Strong embedding capabilities for customer-facing analytics.
❌ Usage-based and custom pricing make costs harder to predict at scale.
❌ Setup and onboarding can be complex for smaller teams without dedicated data engineers.
#4: Looker
Best for: Teams that want governed, warehouse-native BI with consistent metrics, strong data modeling, and tight Google Cloud integration.
Similar to: Sigma, Tableau.
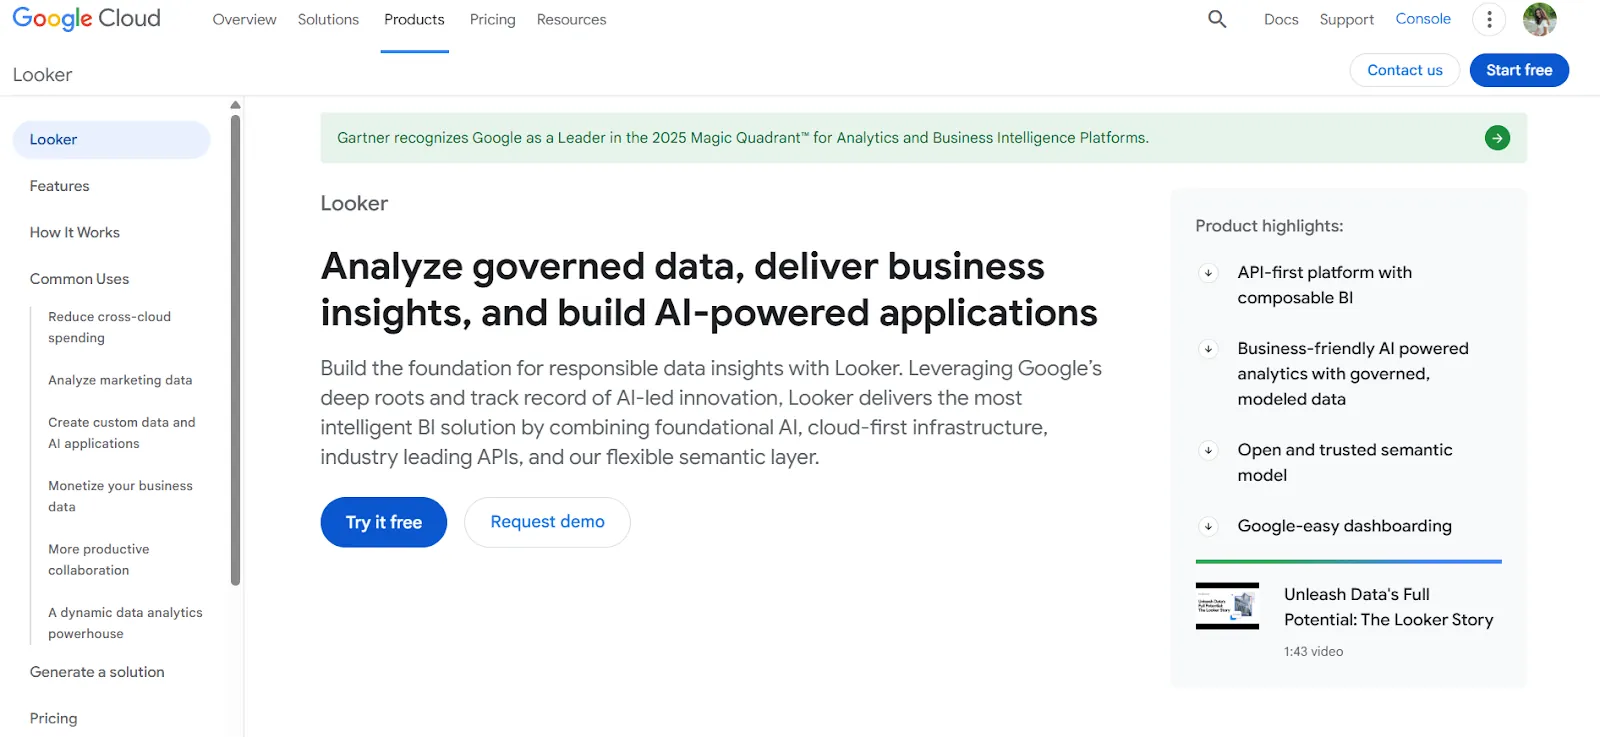
Looker is a BI platform built around a centralized semantic modeling layer called LookML, rather than standalone dashboards.
Unlike Julius AI, where metric definitions can drift between sessions because there's no shared logic layer, Looker ensures that every report and dashboard across the organization uses the same business rules and calculations.
Features
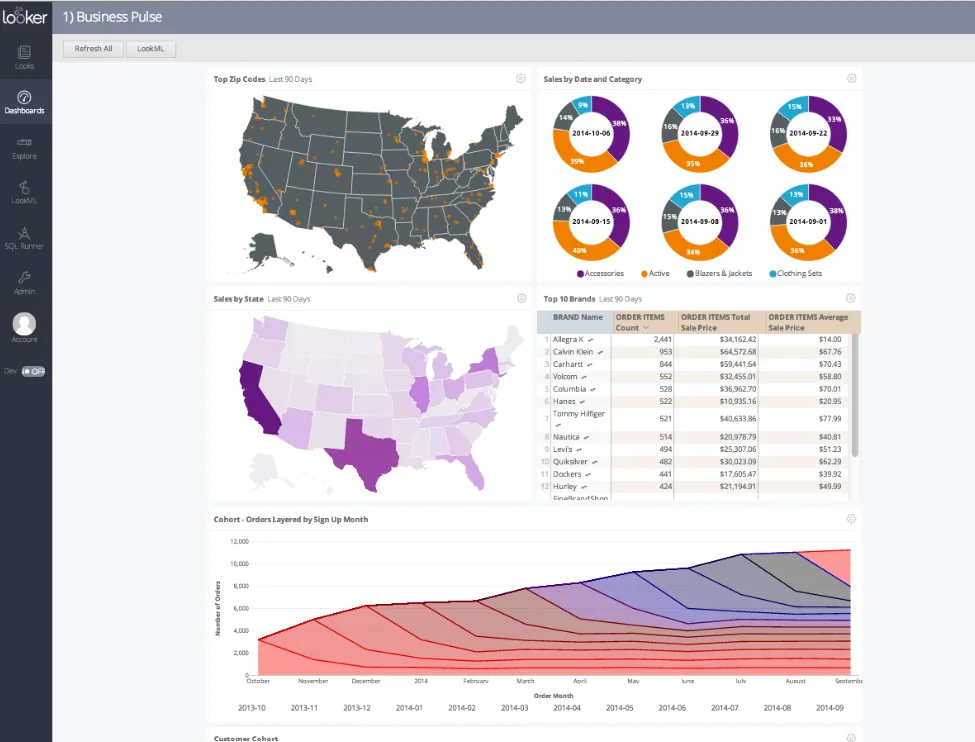
- Centralized semantic modeling (LookML): Define metrics and business rules once, and every team across the organization sees the same numbers in every report.
- Conversational analytics powered by Gemini: Users ask data questions in natural language and get answers without navigating dashboards.
- Live, governed dashboards: Pull data directly from the warehouse in real time, so users always work with current numbers instead of stale extracts.
Pricing
Looker uses a custom, contract-based pricing model with annual billing:
- Standard: For teams under 50 users. Includes 1 production instance, 10 standard users, and 2 developer users.
- Enterprise: For larger internal BI. Enhanced security, up to 100,000 query-based API calls per month.
- Embed: For embedding analytics into external products. Up to 500,000 API calls per month.
All plans are custom-priced. You'll need to contact Google Cloud sales for a quote.
Pros & Cons
✅ Metric consistency across the entire organization.
✅ Strong embedding capabilities for building analytics into internal tools or customer-facing products.
✅ Tight integration with Google Cloud and BigQuery.
❌ Steep learning curve, especially for teams unfamiliar with LookML.
❌ Custom pricing with annual contracts makes it inaccessible for smaller teams.
#5: DataGPT
Best for: Analytics teams that want analyst-grade answers to complex "why" questions without relying on dashboards, SQL, or basic text-to-SQL tools.
Similar to: Tellius, ThoughtSpot.
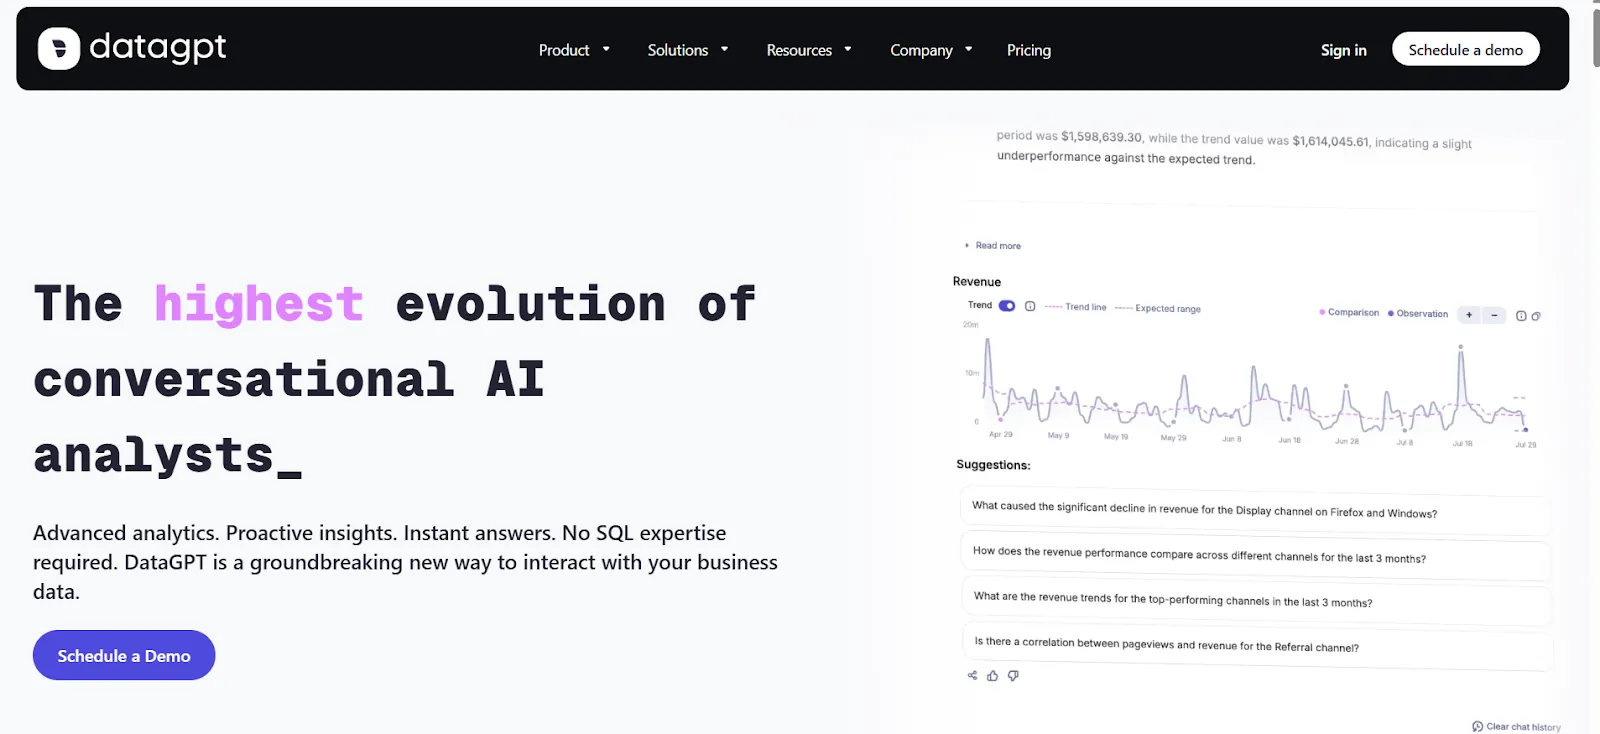
DataGPT is a conversational analytics platform that plans multi-step investigations, runs thousands of queries and statistical tests, and delivers curated results explaining why metrics changed.
Not just what happened.
Unlike Julius AI, which runs a single Python script per question, DataGPT's approach is closer to how an experienced analyst would investigate a complex business question.
Features
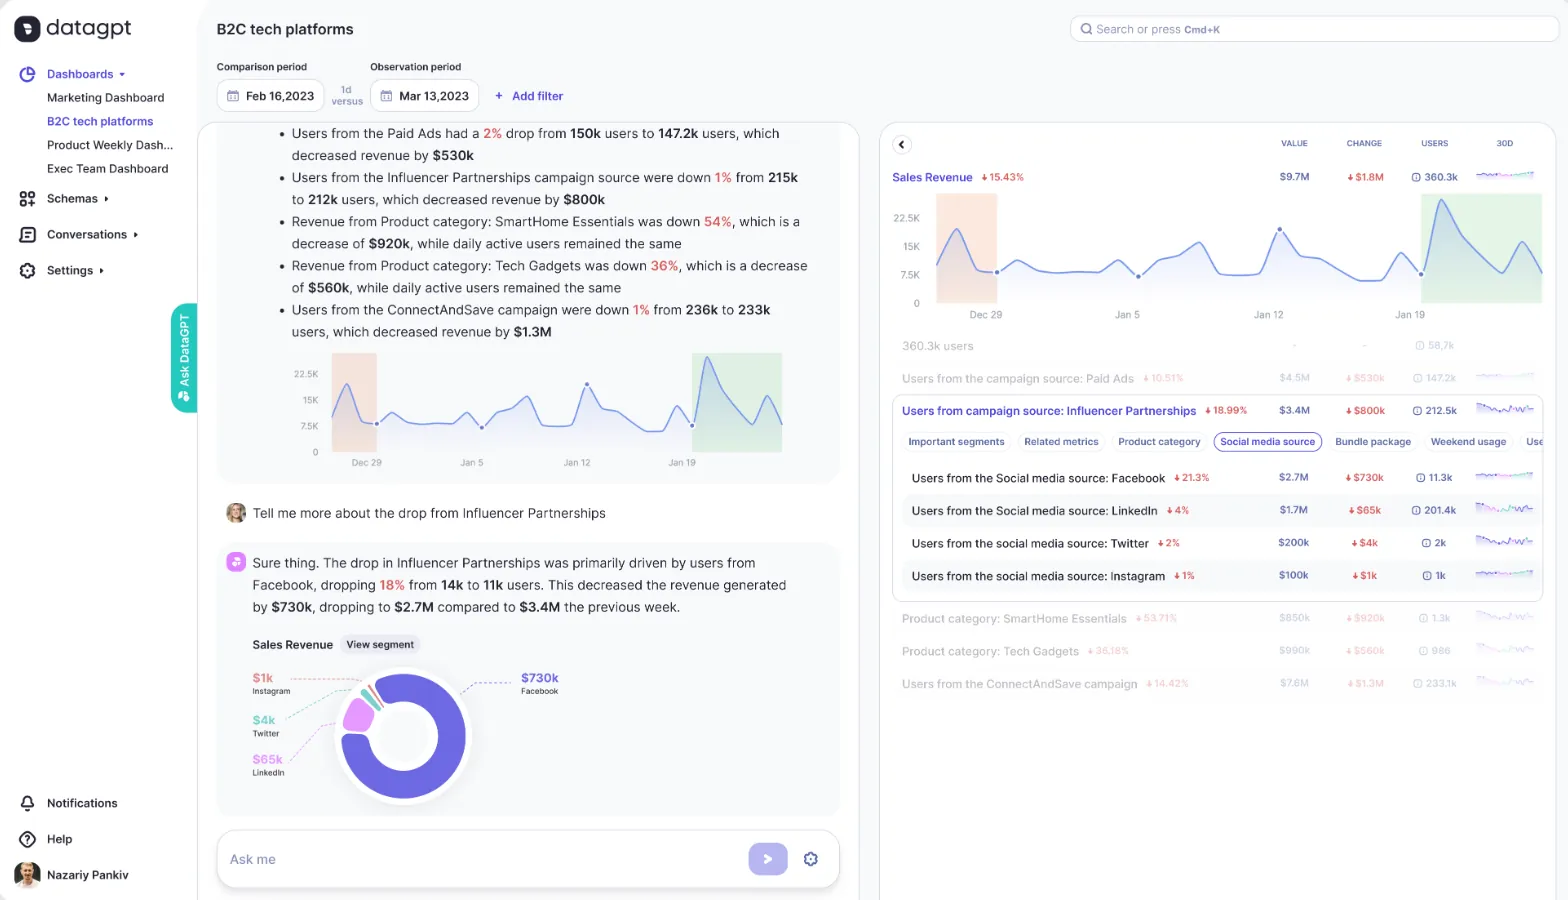
- Multi-step analytical investigations: Ask complex business questions in natural language and receive analyst-level answers that go well beyond simple text-to-SQL translation.
- Proactive daily insights: The platform monitors your data continuously and delivers daily summaries that surface key drivers, anomalies, and emerging trends automatically.
- Data Navigator for self-serve exploration: Explore metrics freely, drill into granular detail, and investigate the drivers behind changes without writing queries.
Pricing
DataGPT offers annual plans for its Classic product:
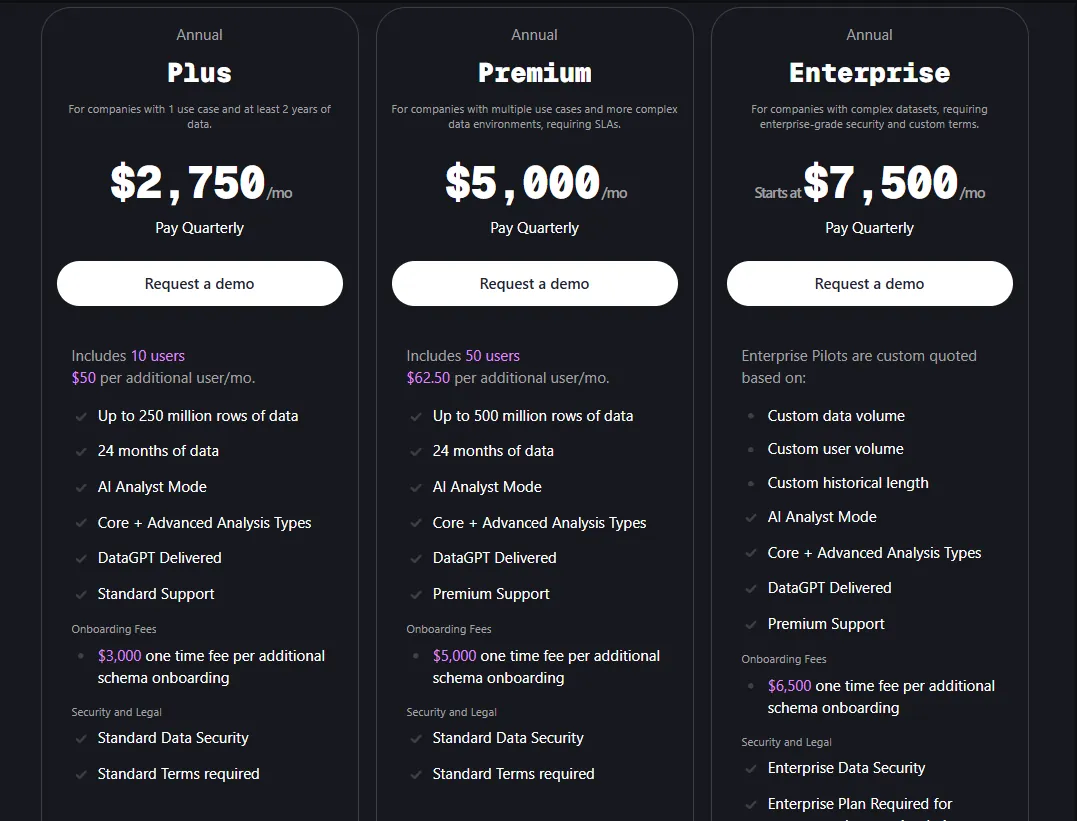
- Classic Plus: $2,750 per month. 10 users, up to 250M rows, 24 months of history. One-time $3,000 onboarding fee.
- Classic Premium: $5,000 per month. 50 users, up to 500M rows. One-time $5,000 onboarding fee.
- Classic Enterprise: Starts at $7,500 per month. Custom user and data volumes. One-time $6,500 onboarding fee.
3-month pilot programs are available: Plus at $10,000, Premium at $15,000, and Enterprise starting at $30,000.
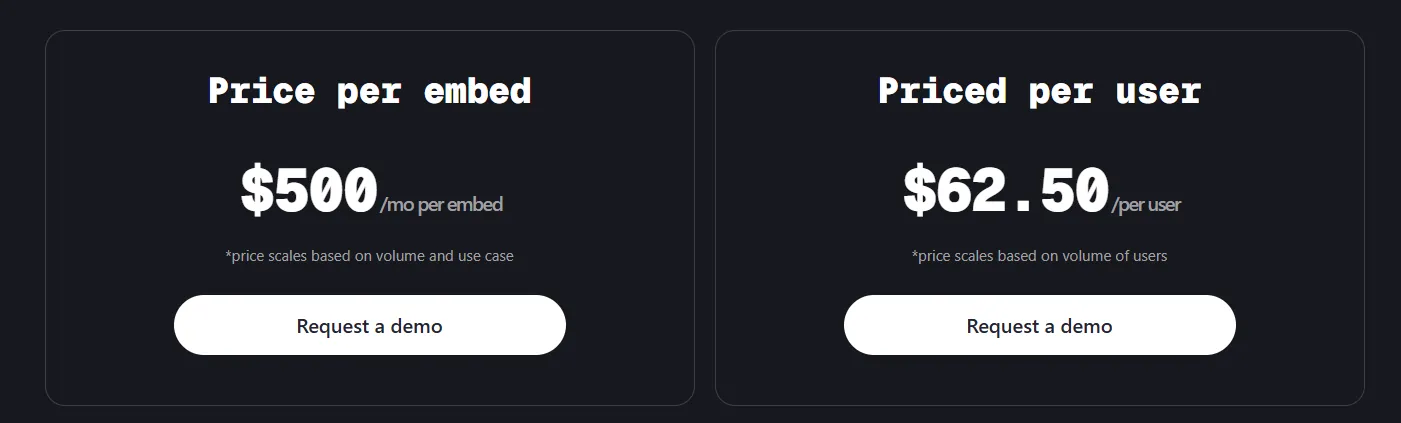
When it comes to the Embedded option, you can choose from two pricing methods:
- $500/month per embed, scaling based on usage and complexity.
- $62.50 per user, scaling with user volume.
Pros & Cons
✅ Handles complex segment comparisons and explains why metrics shift across products, regions, or time periods.
✅ Clean, user-friendly interface that makes advanced analysis accessible to non-technical stakeholders.
❌ Expensive. Entry-level pricing starts at $2,750 per month before onboarding fees.
❌ Annual contracts and pilot minimums make it hard to test without a significant financial commitment.
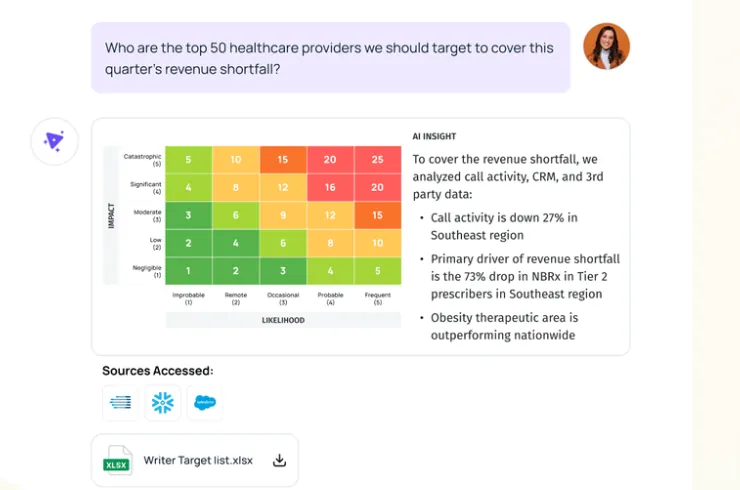
#6: Tellius
Best for: Analytics teams that need fast, explainable answers to complex questions without depending on dashboards, SQL, or constant analyst support.
Similar to: DataGPT, ThoughtSpot.
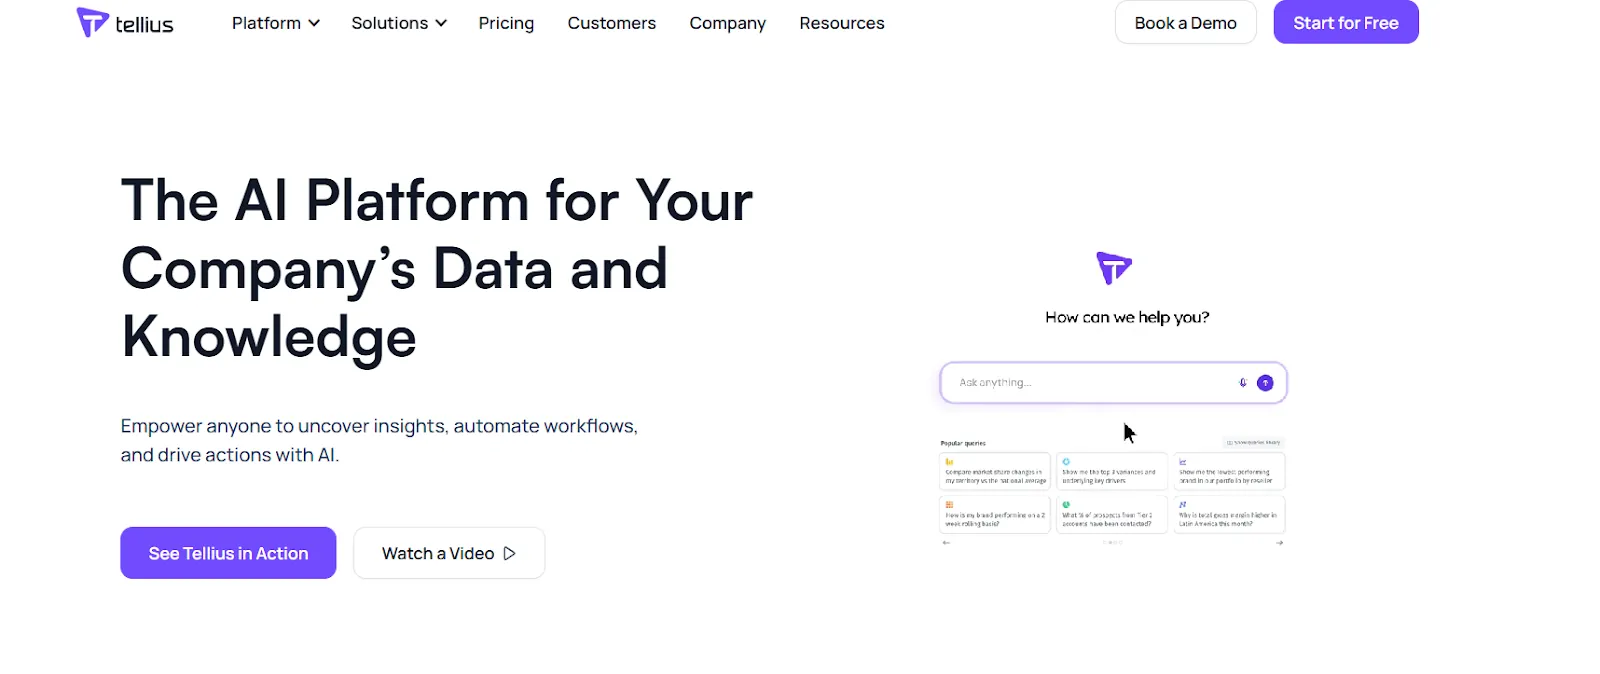
Tellius is an AI-powered analytics platform that lets users ask natural language questions across enterprise data and get instant answers backed by automated root cause and key driver analysis.
Unlike Julius AI, which produces standalone charts from uploaded files, Tellius connects to your data infrastructure and automatically uncovers the "why" behind metric changes across billions of data points.
Features
- Conversational analytics interface: Ask complex business questions in natural language across governed enterprise data and get context-aware answers.
- Automated AI insights: Automatically uncovers root causes, key drivers, trends, cohorts, and anomalies, delivering explainable results with proactive alerts.
- Interactive visualizations and narratives: Turns complex analyses into visual stories with AI-generated summaries that teams can explore, drill into, and share.
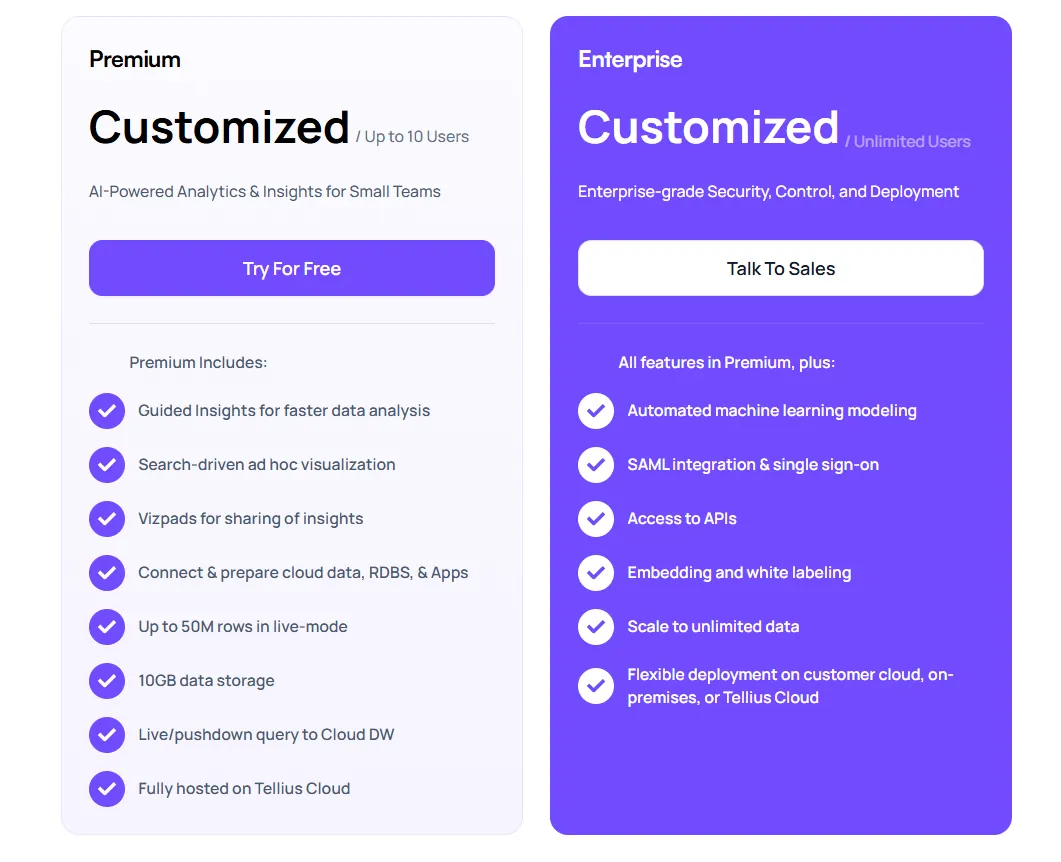
Pricing
Tellius has two pricing tiers, both custom-priced:
- Premium: Up to 10 users. Includes conversational analytics, guided insights, search-driven visualizations, live queries to cloud warehouses, and up to 50M rows in live mode.
- Enterprise: Unlimited users. Adds automated ML modeling, SSO, API access, embedding, and flexible deployment across cloud, customer cloud, or on-premise environments.
Pros & Cons
✅ Visual-first interface that makes it easy to explore results without technical expertise.
✅ Strong automated insights that go beyond what most conversational analytics tools offer.
❌ Custom pricing with no public numbers makes it hard to budget before talking to sales.
❌ Enterprise-focused positioning means smaller teams may find it oversized for their needs.
#7: Zenlytic
Best for: Teams that want governed, explainable self-serve analytics and business users who need good answers without breaking the semantic layer.
Similar to: Looker, Dot.
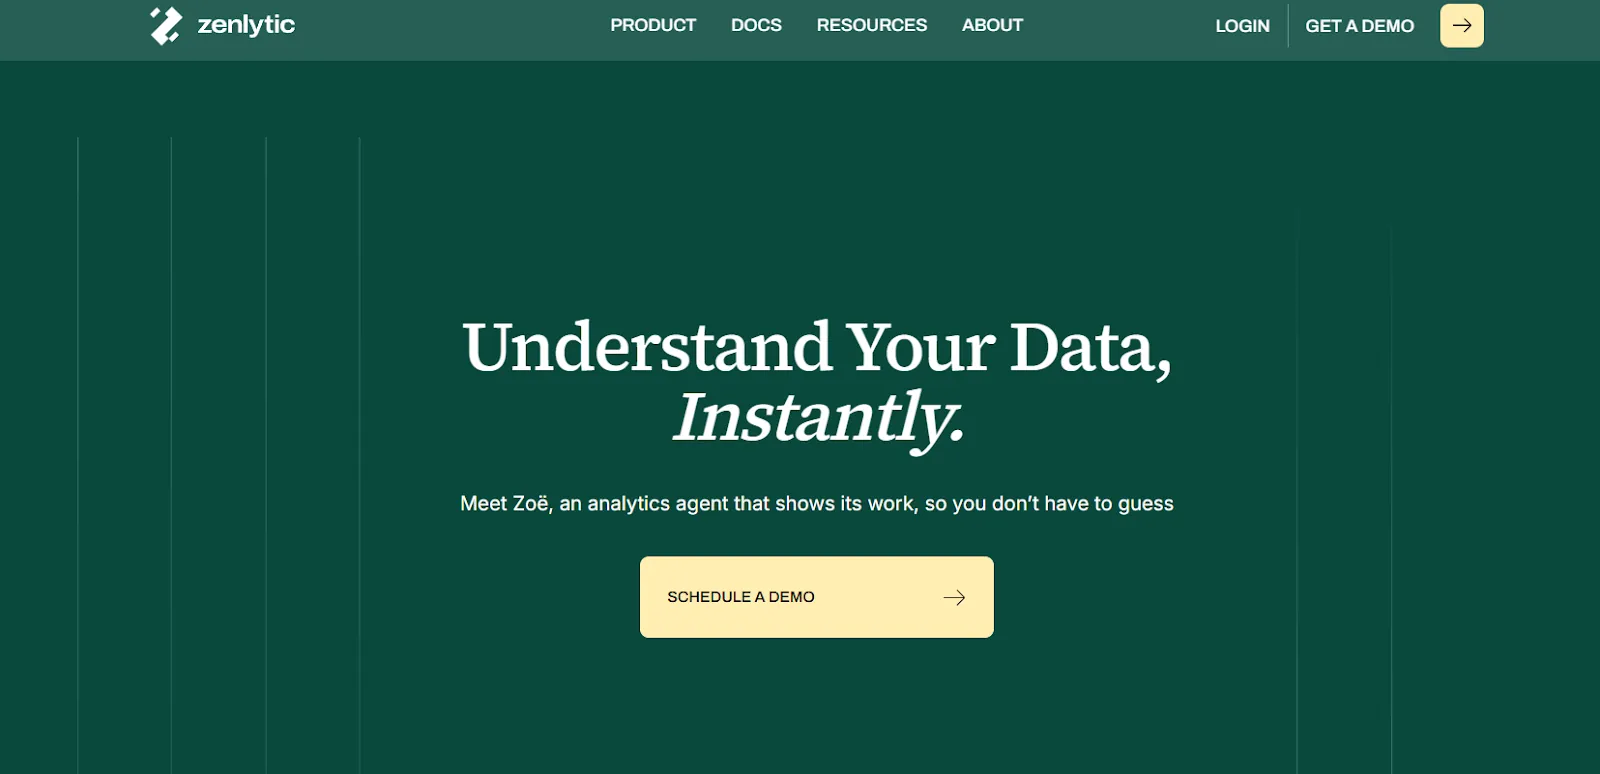
Zenlytic is an analytics platform built around an AI analyst called Zoe that helps users explore data and make decisions quickly while showing exactly how every answer was produced.
Unlike Julius AI, where there's no governing layer to keep answers consistent, Zenlytic combines conversational analytics with a semantic layer so that metric definitions stay locked in across every query.
Features
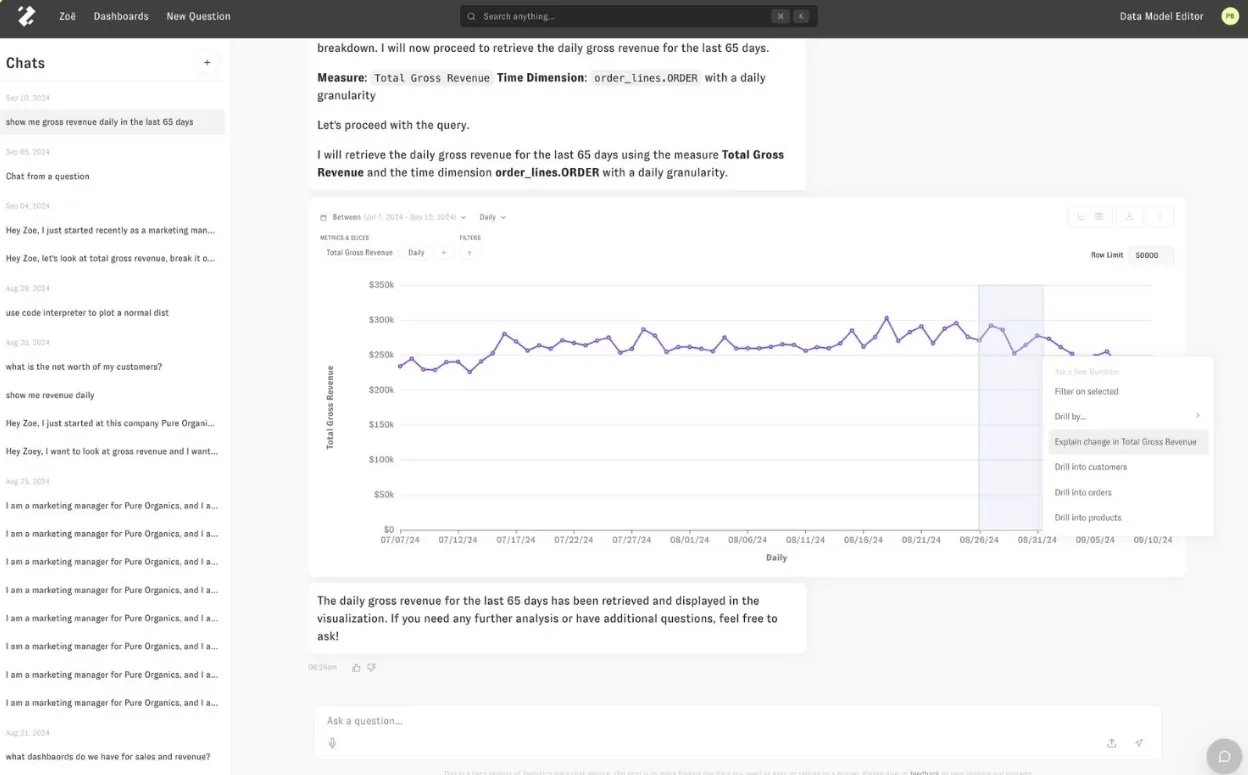
- AI data analyst (Zoë): Helps both technical and non-technical users understand messy, multi-source data by answering natural language questions with instant, verifiable explanations.
- Analytics memory (Memories): Teams can lock in metric definitions, assumptions, and methodologies with a single click, ensuring the AI gives the same consistent answer every time.
- Full citations and explainability: Every answer shows exactly where each number comes from and how it was calculated, so users can click into the data behind each insight.
Pricing
Zenlytic doesn't publish fixed pricing. You can book a demo to see the platform and request a custom quote.
Pros & Cons
✅ Easy to set up and maintain compared to heavier BI platforms.
✅ The "Memories" feature and semantic layer solve the exact consistency problem that Julius AI users complain about.
❌ Limited flexibility for open-ended or unusual analytical questions that fall outside the semantic layer's scope.
❌ No public pricing makes it hard to compare costs before engaging with sales.
#8: Metabase
Best for: Startups, product teams, and lean data organizations that want fast, self-serve analytics with natural language querying and flexible embedding.
Similar to: Mode, Zoho Analytics.
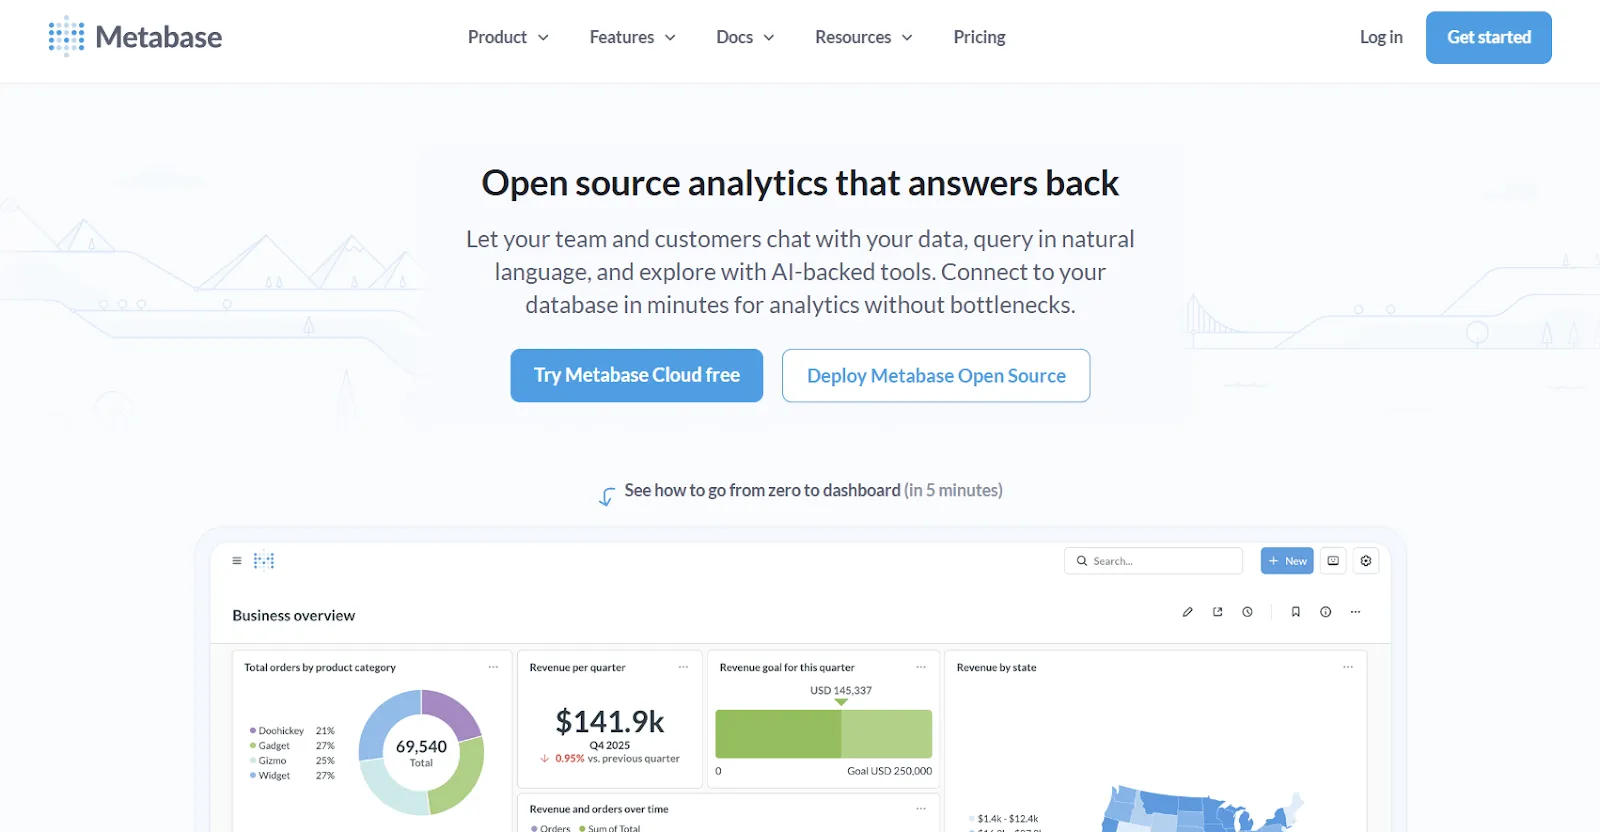
Metabase is an open-source analytics platform designed to help teams explore data, ask questions in plain English, and share insights without bottlenecks.
The platform connects to your live databases and lets anyone on the team build dashboards and run queries.
Features
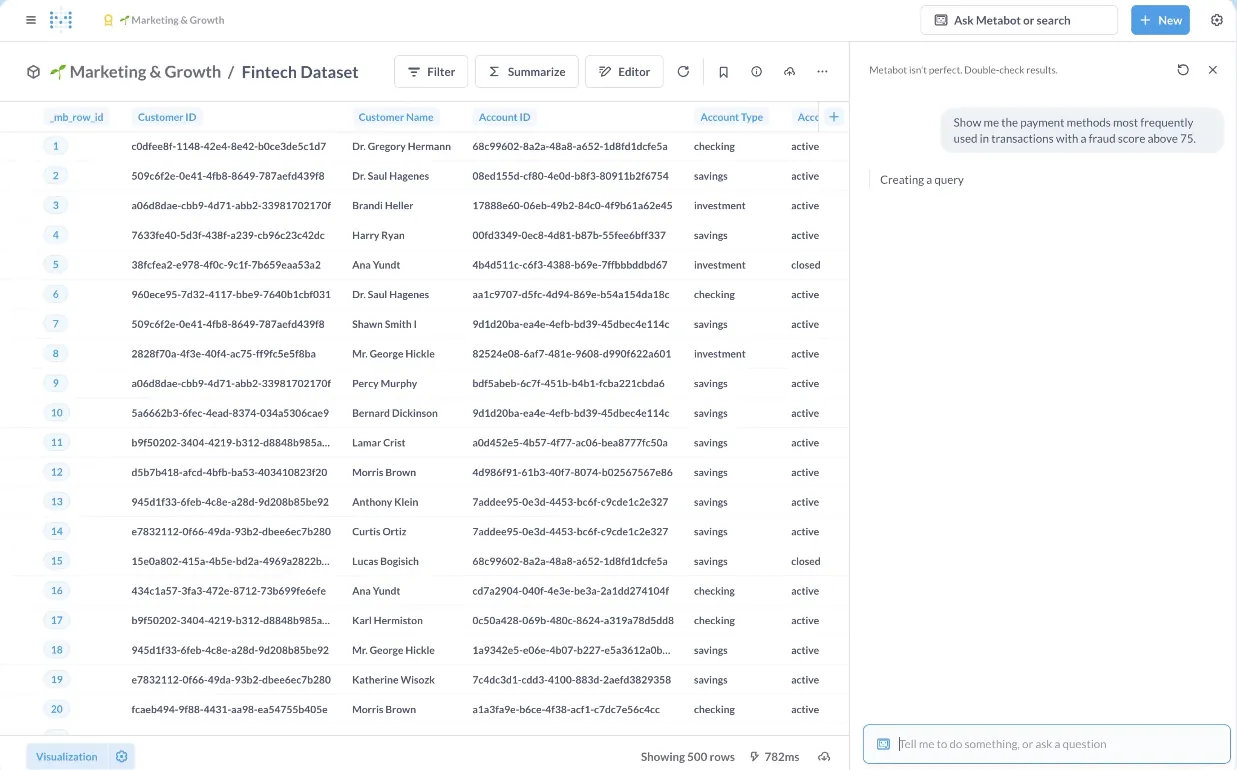
- Natural language querying (Metabot AI): Ask questions in plain English and let AI generate queries and visualizations on top of live database data.
- No-code visual query builder with SQL support: Non-technical users explore data visually, while analysts can write raw SQL and turn queries into reusable reports.
- Drill-through data exploration: Click directly on charts to zoom in, filter, break out data, and auto-generate follow-up reports without writing new queries.
Pricing
Metabase offers multiple pricing tracks:
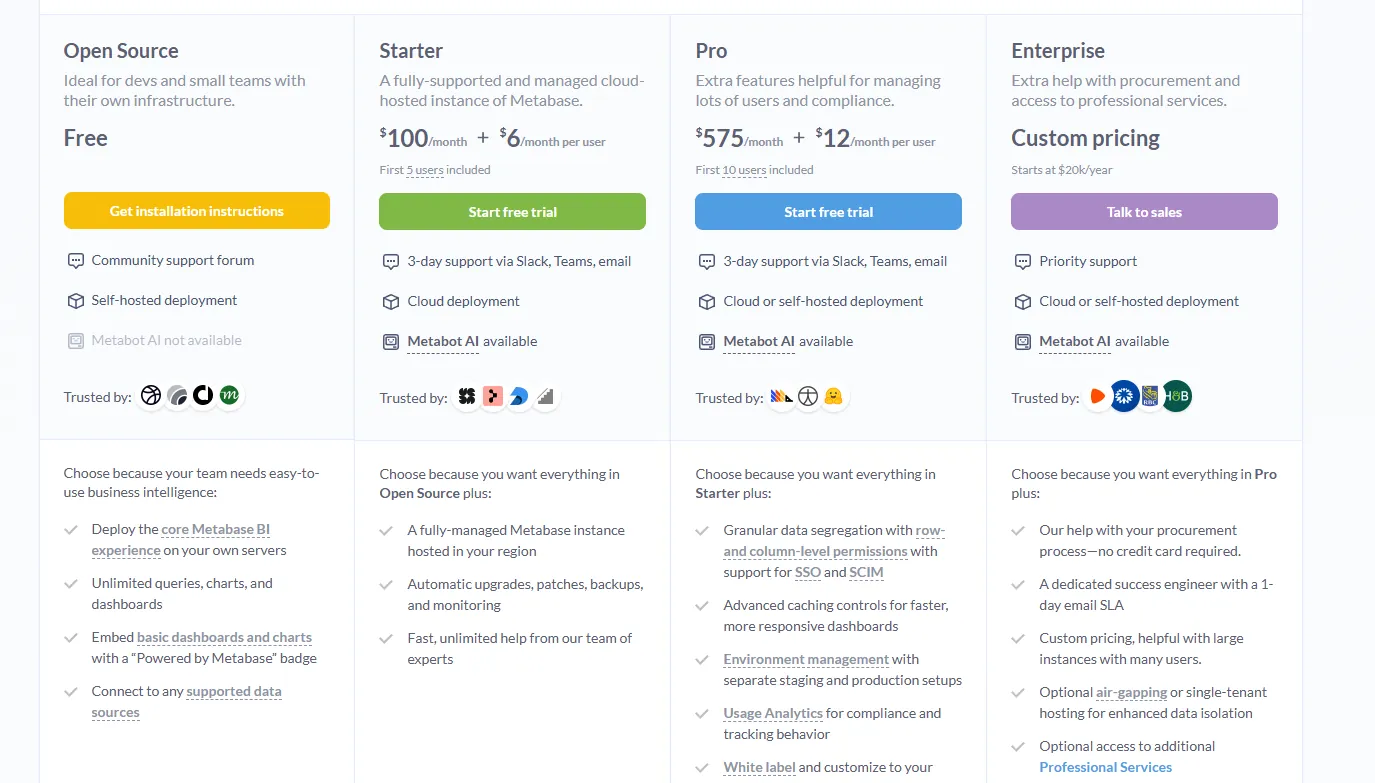
- Open Source (self-hosted): Free. Unlimited queries, charts, and dashboards. Community support only.
- Starter (cloud-hosted): $100 per month, with an additional $6 per user per month after the first 5 users.
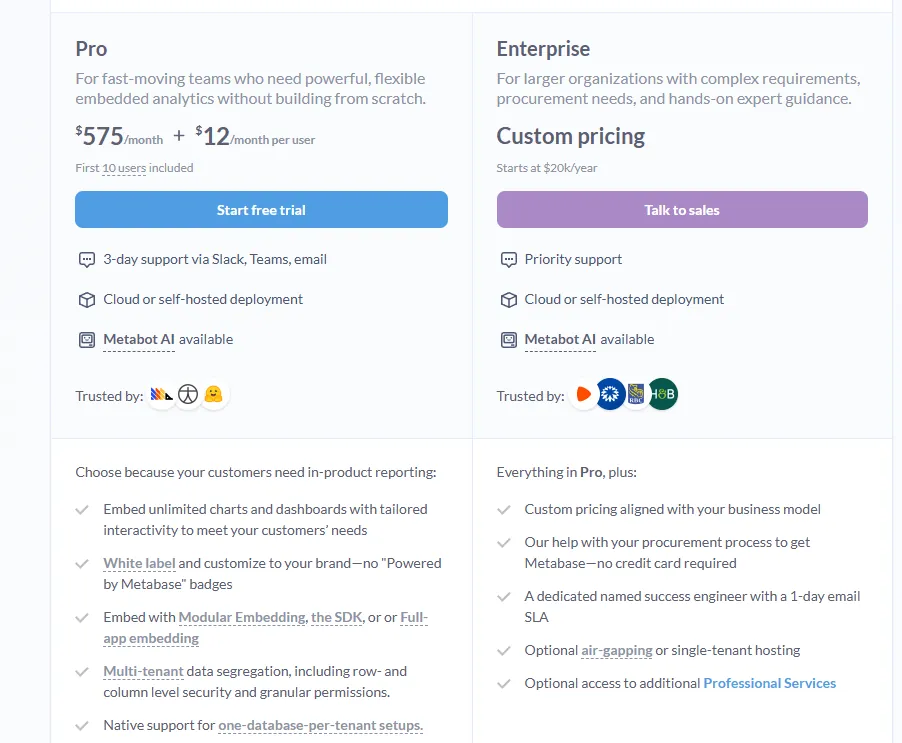
- Pro: $575 per month, with an additional $12 per user per month after the first 10 users. Adds SSO, row-level permissions, white-labeling, and embedded analytics.
- Enterprise: Custom pricing (starts at $20k per year). Priority support, dedicated success engineer, optional air-gapped deployment.
- Embedded Analytics pricing:
- Pro: $575/month + $12/user/month, first 10 users included, includes unlimited embedded dashboards and charts, full white-labeling, modular embedding, SDK, or full-app embedding, multi-tenant security (row- and column-level), one-database-per-tenant support, staging + production environments, usage analytics, internal BI for your team, and option to include Metabot AI (charged extra).
- Enterprise: Custom pricing (starts at $20k/year), includes everything in Pro, plus a dedicated success engineer, priority support, optional single-tenant or air-gapped hosting, and optional professional services.
Pros & Cons
✅ Free open-source tier with no usage limits makes it the most affordable option on this list.
✅ Fast to set up and lightweight, especially with common databases like PostgreSQL, MySQL, and Snowflake.
❌ Weaker for advanced analytics like complex calculations, deep data modeling, or large-scale governance.
❌ AI assistance (Metabot) is still basic compared to purpose-built AI analytics tools.
#9: Microsoft Power BI
Best for: Organizations already invested in the Microsoft ecosystem that want standardized dashboards, reporting, and self-service analytics at scale, at a low per-user cost.
Similar to: Tableau, Looker.
Microsoft Power BI is an enterprise BI platform for building interactive dashboards, reports, and visualizations on top of structured data.
While Julius AI is designed for individual, file-based analysis, Power BI is built for team-wide reporting with governance controls, role-based security, and deep integration the broader Microsoft stack.
Features
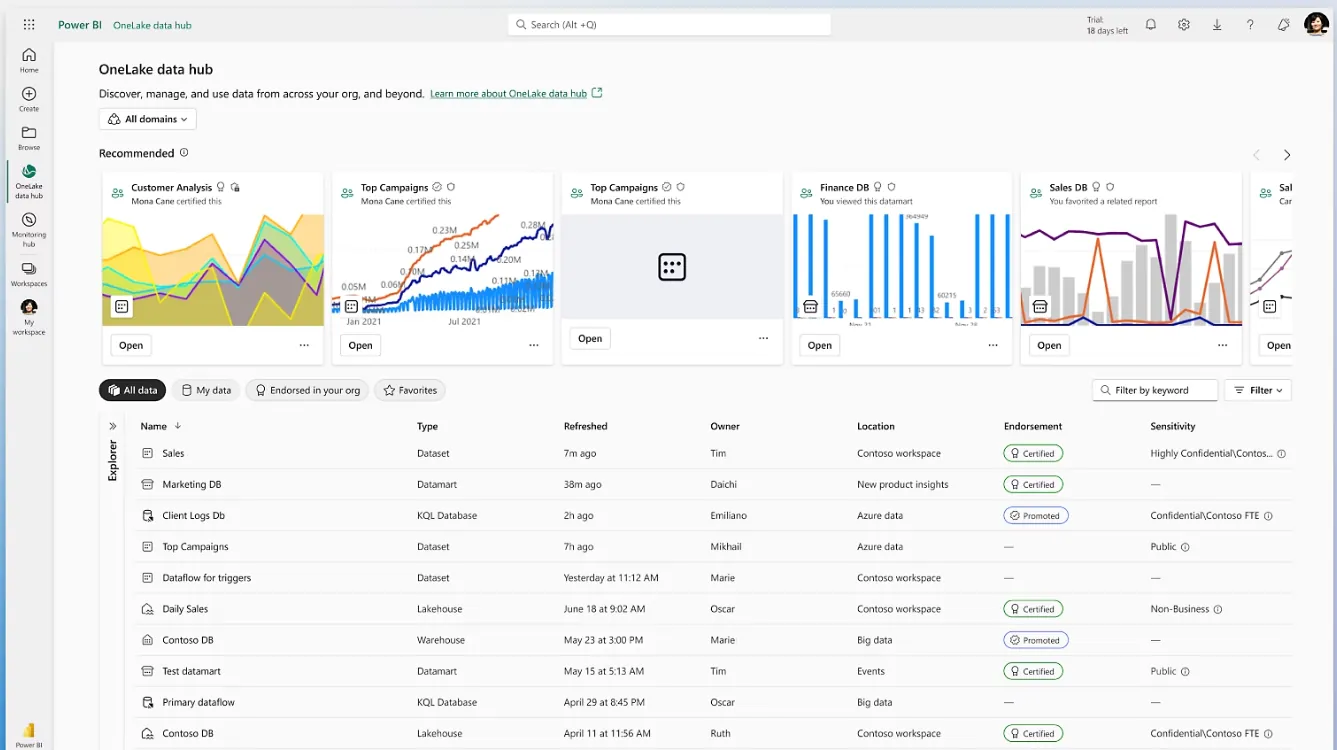
- Interactive dashboards and reports: Build multi-visual dashboards with filters, drill-downs, and cross-report linking that scale across departments and business units.
- Enterprise governance and security: Row-level security, sensitivity labels, and Microsoft Entra ID integration help large organizations manage access and compliance.
- AI-assisted insights with Copilot: Natural language querying, forecasting, anomaly detection, and automated insight generation built directly into the reporting interface.
Pricing
Power BI uses per-user pricing with a generous free tier:
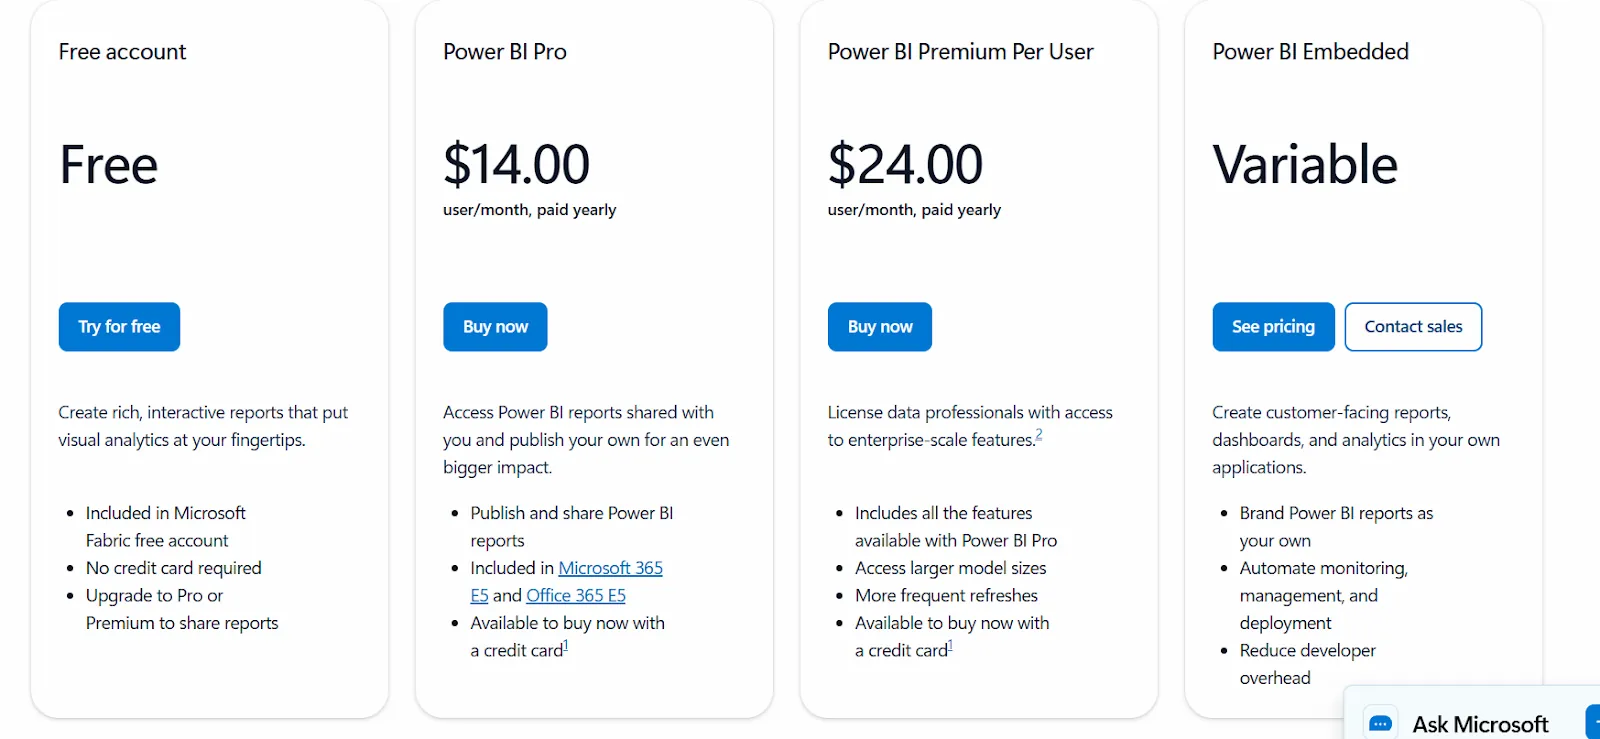
- Free: Build reports and dashboards for personal use. No sharing or collaboration.
- Power BI Pro: $14 per user per month. Includes publishing, sharing, workspace collaboration, and Teams embedding.
- Power BI Premium Per User: $24 per user per month. Adds larger model sizes, more frequent refreshes, paginated reports, and advanced AI.
- Power BI Embedded: Custom pricing for customer-facing analytics in your own applications.
Pros & Cons
✅ The most affordable per-user pricing of any enterprise BI tool on this list.
✅ Deep integration with Excel, Teams, and the Microsoft ecosystem reduces adoption friction.
❌ Steep learning curve once you move into DAX formulas, data modeling, and advanced report optimization.
❌ Performance slows noticeably with large datasets and complex visuals.
#10: Zoho Analytics
Best for: Teams that want a capable BI platform with AI features, hundreds of connectors, and an interface that works for both analysts and business users.
Similar to: Metabase, Microsoft Power BI.
Zoho Analytics is an AI-powered BI platform built on the Zoho ecosystem that helps teams pull in data from multiple sources, prepare it, and turn it into interactive dashboards and insights.
The platform offers a full BI environment with data preparation, scheduled reporting, embedded analytics, and a conversational AI assistant called Zia.
Features
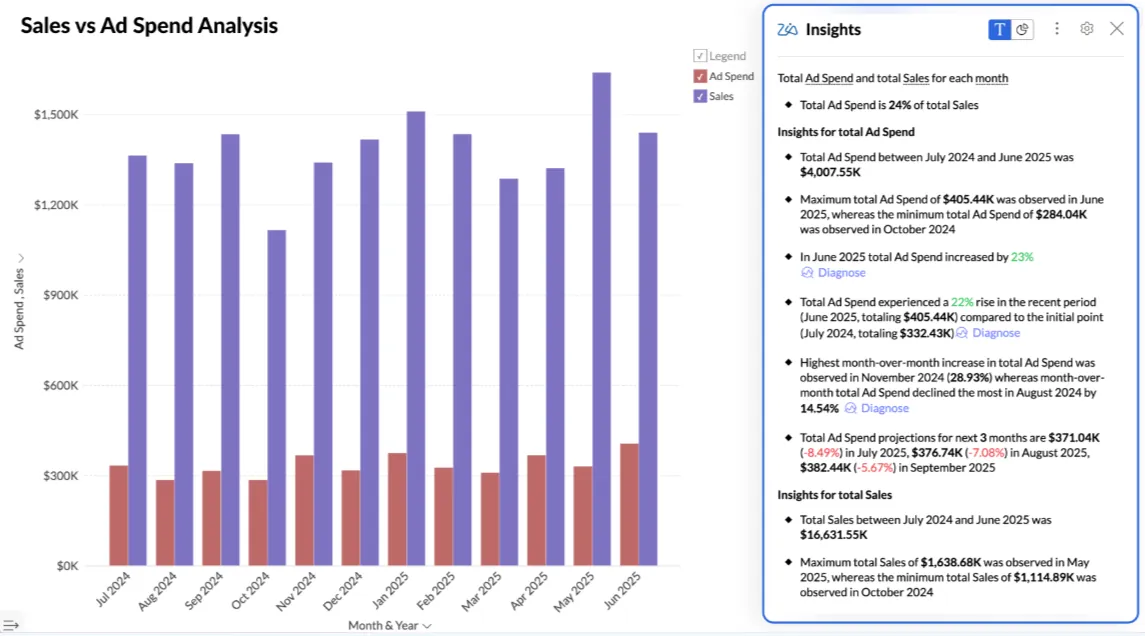
- Conversational AI (Ask Zia): Use natural language to analyze data, build reports, get predictions, and receive AI-generated recommendations through Zoho's built-in assistant.
- Data preparation with 250 transformations: Clean, transform, enrich, and model data with no-code tools while managing business metrics centrally for consistency across reports.
- Embedded BI and flexible dashboards: Create interactive dashboards with 50 visualization types and embed analytics or AI assistants into apps, portals, or customer-facing products.
Pricing
Zoho Analytics offers three public pricing tiers:
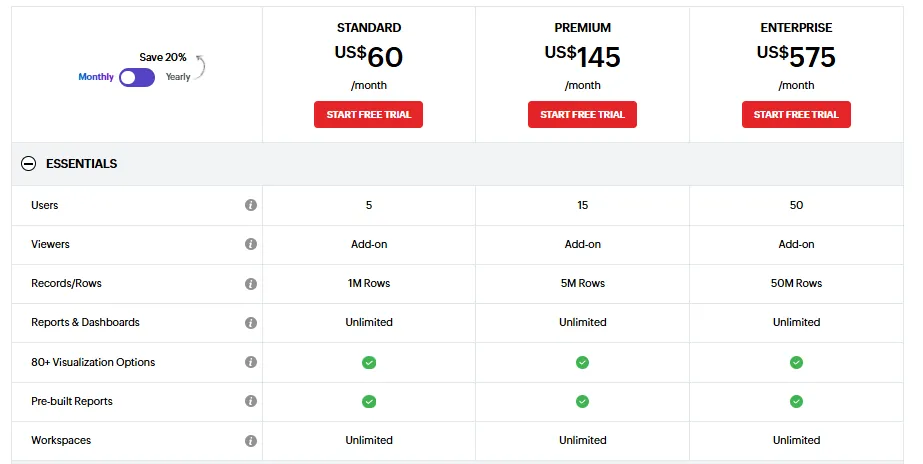
- Standard: $60 per month. Up to 5 users, 1M rows, unlimited workspaces and dashboards, basic AI features.
- Premium: $145 per month. Up to 15 users, 5M rows, all AI features except AI Studio, advanced data integration options.
- Enterprise: $575 per month. Up to 50 users, 50M rows, advanced governance and security, AI Studio included.
Pros & Cons
✅ Tight integration with Zoho apps and popular third-party tools makes setup fast and reporting easy.
✅ Good value for money with intuitive dashboards and solid visualizations accessible to both business users and analysts.
❌ Data syncing isn't always real-time, and exports to Excel can feel clunky when you need presentation-ready output.
❌ AI assistant (Zia) is helpful for basic queries but doesn't match the depth of purpose-built AI analytics platforms.
Which Julius AI alternative actually fits how your team works?
Julius AI is a decent tool for quick, individual data exploration.
Upload a spreadsheet, ask a question, get a chart.
For simple analysis on clean data, it does the job.
But teams outgrow it the moment they need answers they can trust across sessions, analysis that connects to live business data, or reports that don't require someone to manually re-run every week.
Most Julius AI alternatives on this list still revolve around the same idea: better dashboards, better visuals, better governance, but still requiring manual interpretation and maintenance.
Dot is different.
Instead of asking teams to upload files and build charts, Dot does the analysis for you.
You ask a business question, and Dot investigates the data. It explains what changed and why. It delivers a clear narrative with recommendations and shows its work with a full audit trail.
No file uploads. No inconsistent answers. No analyst bottlenecks.
If your team is still spending hours every week pulling the same reports, or decisions are slowing down because insights take too long to surface, Dot is worth a look.
Sign up for Dot's free plan or book a demo to see how teams replace manual reporting with automated, decision-ready insights.
Theo Tortorici
Theo writes about AI-powered analytics, data tools, and the future of business intelligence at Dot.