
Follow the Money: Insights from FEC Data on US Elections 2024
Money fuels elections, revealing not only who's running the race but also who's backing them — and why. Using Federal Election Commission (FEC) data, I delved into the numbers to answer key questions about contributions and spending in the 2023–24 election cycle (data as of October 16, 2024).
You can find the complete results at this link.
Here's a quick overview of our key findings:
1. Donald Trump's Absence from the Top Five
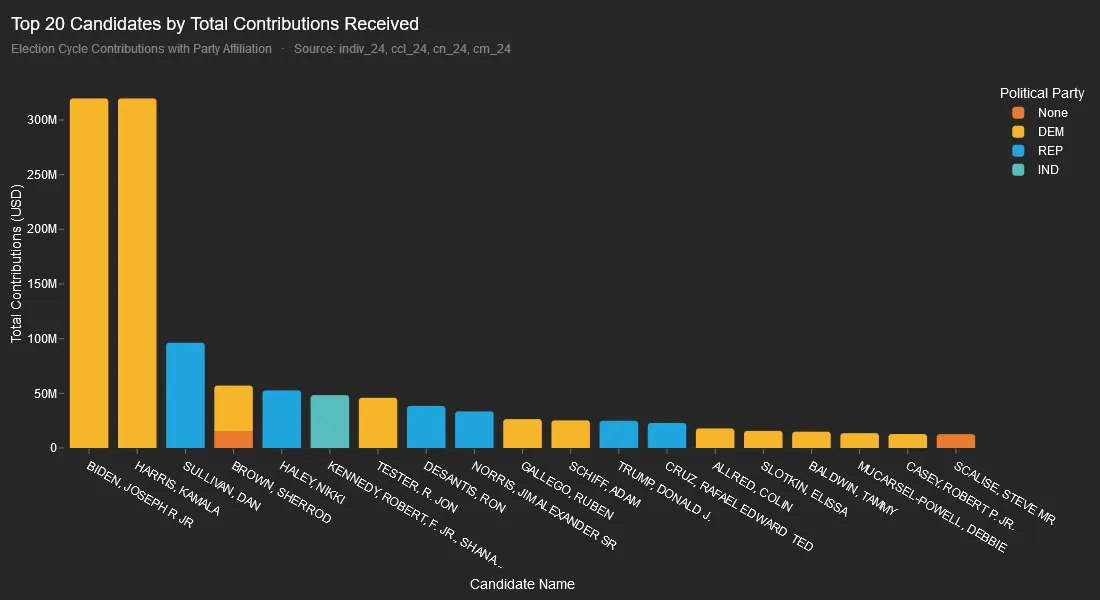
Surprisingly, Donald Trump, despite being the winning candidate, raised only $25 million, placing him in 13th position. In contrast, Kamala Harris and Joe Biden topped the list with $300 million each, together accounting for 60% of total contributions among the top 10 candidates.
2. Democrats Receiving Higher Contributions
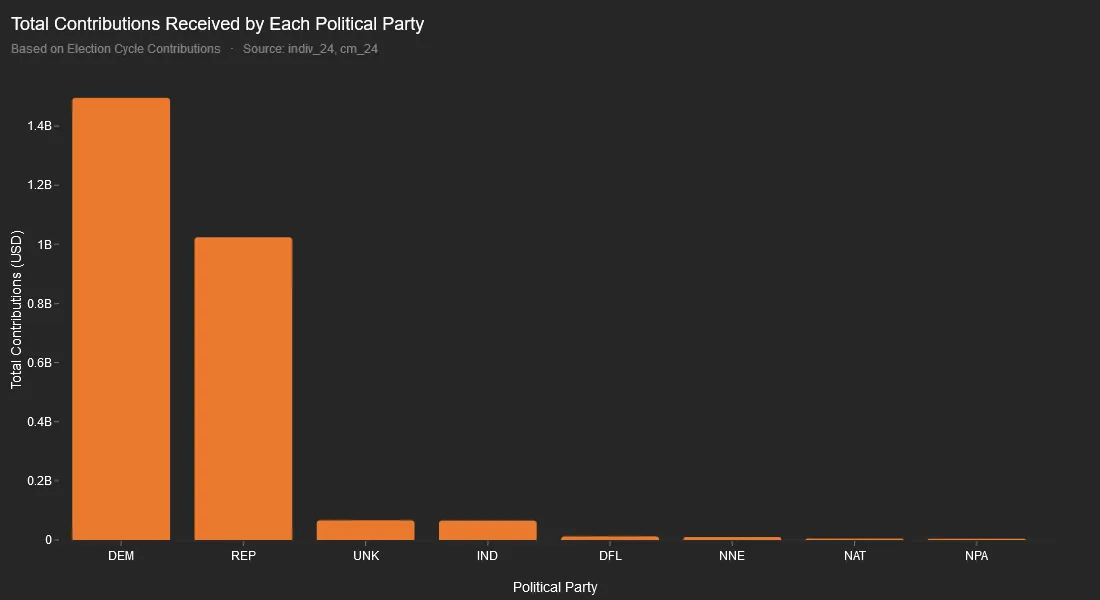
Democrats received $1.49 billion in contributions, compared to the Republicans' $1.02 billion, a margin of $470 million. (which is surprising, as I expected the numbers to be roughly even)
3. Donor Diversification Across Candidates
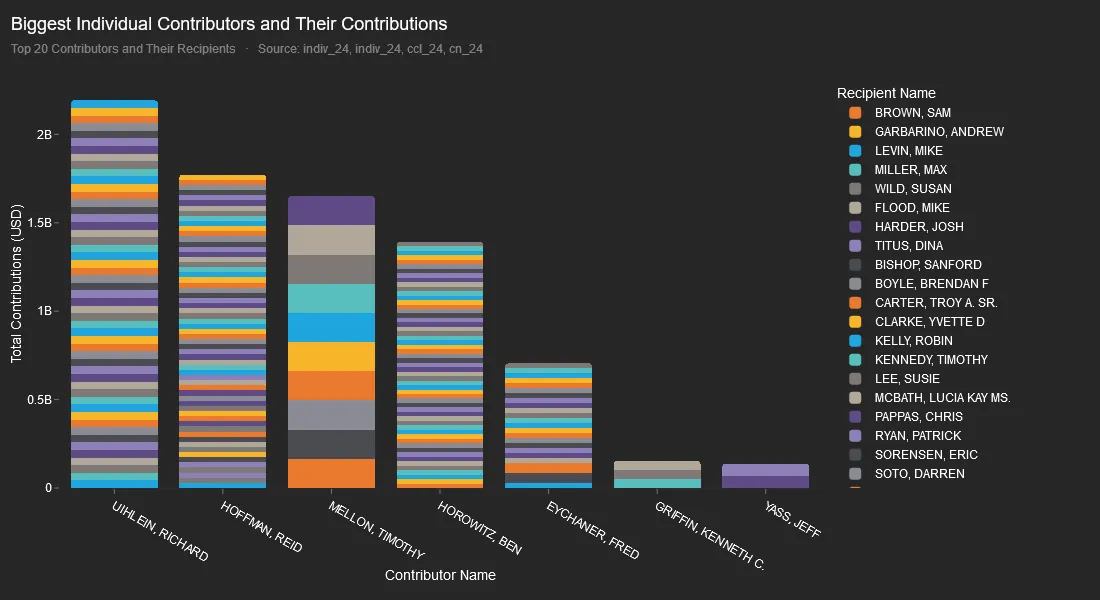
Like savvy investors, top contributors have diversified their donations across multiple candidates. However, most donors support multiple candidates exclusively within their preferred political party (see below). For example, Reid Hoffman has contributed to 88 candidates, all from the Democratic party.
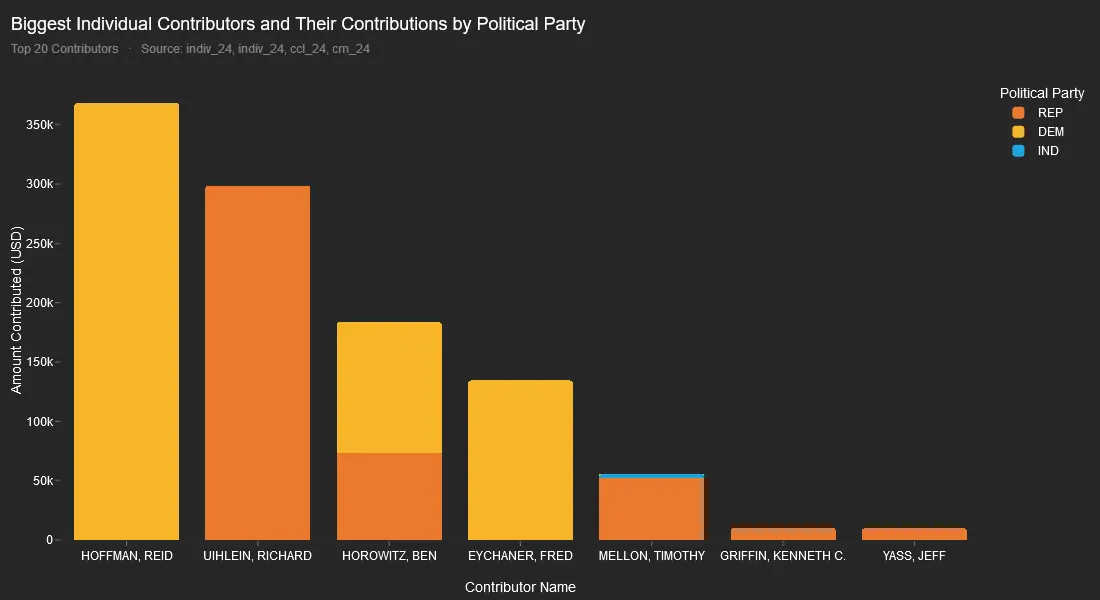
Note: The varying positions in the list stem from incomplete data linking committees to their political parties.
4. Democratic Spending vs. Republican Spending
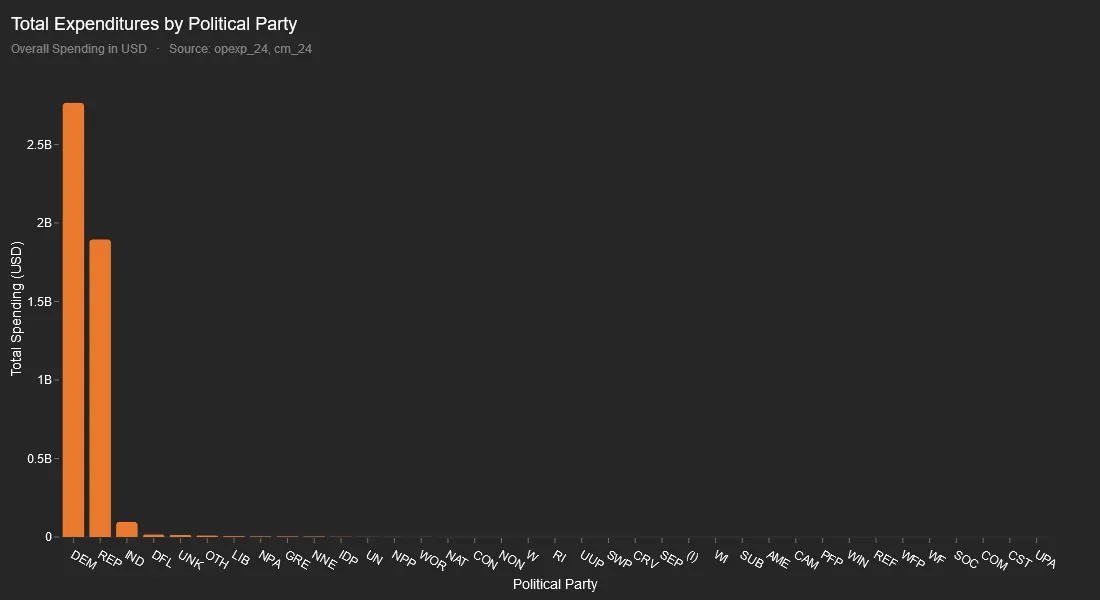
This is perhaps the most shocking finding: Democratic spending totalled $2.7 billion, nearly 42% higher than Republican spending of $1.9 billion.
This was so surprising that we had to double-check the data, but according to the FEC records, this is indeed the case.
5. Spending across states
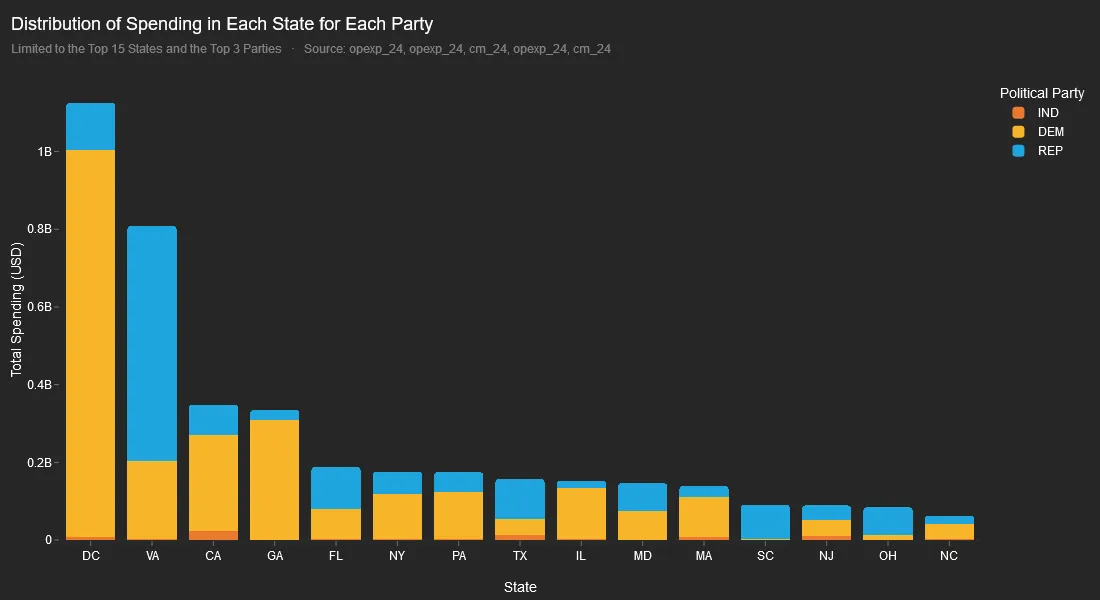
Democrats spent the most in D.C., with expenditures reaching $0.9 Billion, while Republicans focused their spending in Virginia, allocating $605 million. Interestingly, in swing states like Pennsylvania, Democratic spending outpaced Republican efforts by $50 million.
A Note on Methodology
The data was sourced from the FEC's official website, and every effort has been made to ensure accuracy. However, given the complexities of election data, errors are possible — please interpret these findings with caution.
The primary challenge involved data linkages: 12,600 committees had no corresponding candidate, and about 1,800 candidates lacked corresponding committees.
More significantly, the committee-party linkage contained major gaps — 11,022 committees (nearly 50%) had no associated political party.
As a result, many transactions (which only contained committee IDs) couldn't be mapped to specific candidates or parties. These gaps in the data may explain some of the surprising disparities we discovered.
While these limitations introduce some uncertainty, the available data still provides a solid foundation for meaningful analysis.
Below is a technical deep-dive into how we achieved this and some of the challenges we faced along the way.
Step 1: Acquiring the Data
At first, I turned to the publicly available FEC BigQuery dataset — a convenient option for accessing historical election data. However, the dataset did not include 2024-cycle updates, despite its stated weekly update frequency.
Luckily, the FEC maintains up-to-date bulk data on its official website. While helpful, this came with two challenges:
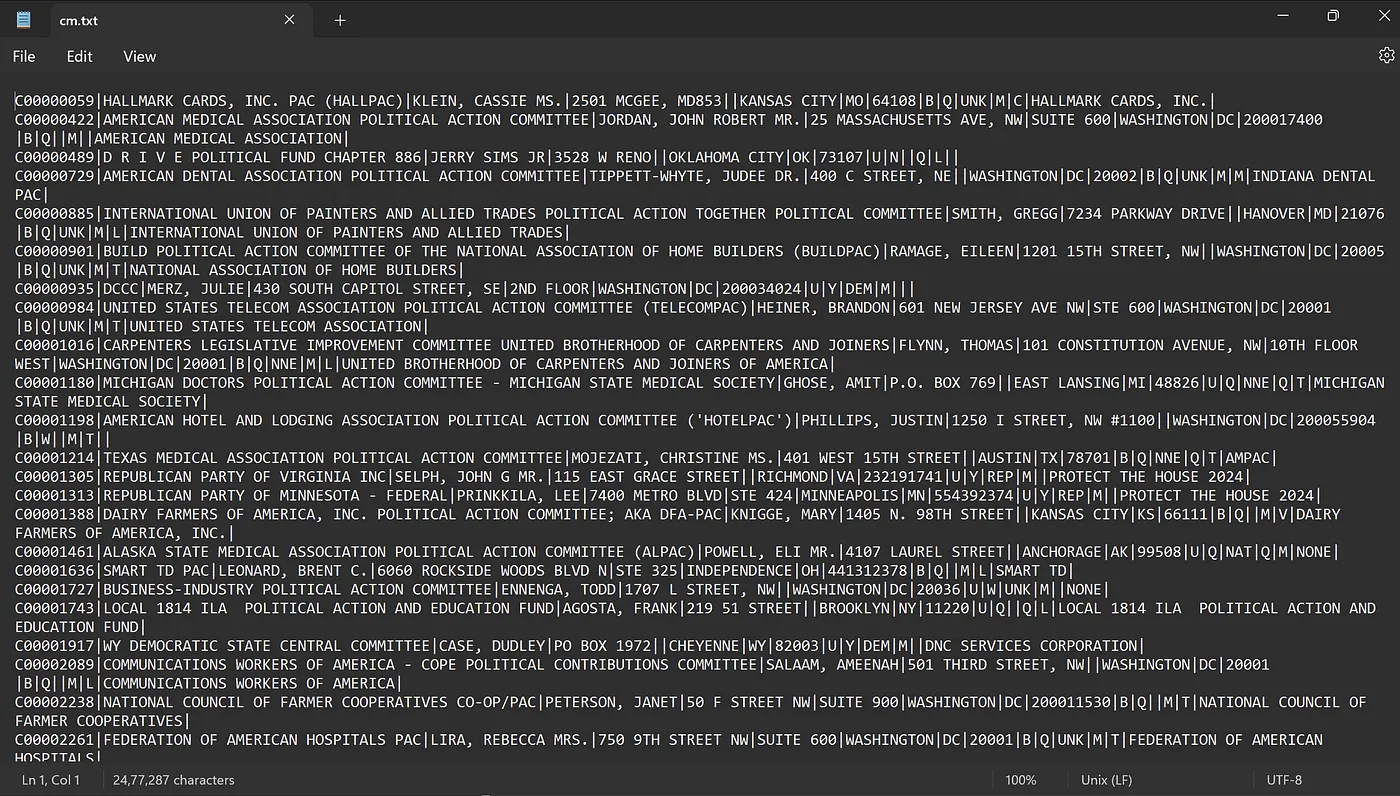
File Format: The data was provided in .txt format, not .csv.
Big Data Readiness: The raw data wasn't preloaded into a warehouse like BigQuery, necessitating manual processing.
These issues were relatively easy to address. I wrote a Python script to convert the .txt files into .csv format for upload into BigQuery.
Step 2: Processing the Data
Here's the Python script used to handle file conversion efficiently, including buffering for large files (some as big as 8GB).

A quick look at the data showed that there are missing data in many places. There is nothing much we can do about that and we are doing with what we have.
Step 3: Uploading to BigQuery
The easiest way to do this is to upload the csv files to a storage bucket and then create tables from these.
Step 4: Connecting Getdot.ai with BigQuery
We are going to be using getdot for our analysis and exploration. Connecting with BQ is rather simple.
Related reading:
That is pretty much it! We can now use the chat-like interface from dot to answer whatever questions we have about the data.
Anand Ani
Anand is a co-founder of Dot. He builds the AI systems that turn natural language into trustworthy data answers. Before Dot, he spent years making complex data pipelines feel simple.