
10 Best Lightdash Alternatives & Competitors In 2026
In this article, I'll walk through the 10 best Lightdash alternatives in 2026 across AI-powered analytics platforms, warehouse-native BI tools with semantic layers, and open-source self-service options, covering their features, pricing, and pros and cons.
TL;DR
- Dot is the best Lightdash alternative for teams that want full written analysis instead of more dashboards, with its multi-step root-cause investigation, scheduled executive reports, business context, and audit trail on every insight.
- If your team picked Lightdash because of dbt-native modeling and a code-first workflow, Looker, Omni, and Holistics give analytics engineers a similar architecture with broader feature sets and more mature ecosystems.
- For self-hosted or budget-friendly paths, Metabase and Apache Superset offer open-source roots, fast setup, and analyst-led workflows without the strict dbt dependency Lightdash imposes.
What are the best Lightdash alternatives in 2026?
The best Lightdash alternatives in 2026 are: Dot, Looker, and Metabase.
Here's a breakdown:
Tool | Use Case | Price |
Dot | An AI data analyst that turns warehouse data into written analysis, scheduled exec reports, and Slack-based answers instead of static dashboards. | Free plan; Paid from $180/month. |
ThoughtSpot | Search-based analytics where business users type questions and get charts and explanations back without writing SQL. | From $25/user/month (annual). |
Domo | All-in-one cloud BI that combines data ingestion, dashboards, automation, and AI agents in one platform. | Custom pricing (30-day free trial). |
Looker | Governed, warehouse-native BI organized around the LookML semantic layer for consistent metrics across the org. | Custom pricing (annual contract). |
Omni | Modern semantic-layer BI that pairs governed metrics with spreadsheet-style exploration on live warehouse data. | Custom pricing. |
Holistics | Code-first BI with strong dbt support, Git-based modeling, and self-serve reporting for business teams. | From $960/month. |
Sigma | Spreadsheet-style analytics on live cloud warehouse data, popular with finance and ops teams. | Custom pricing. |
Metabase | Open-source BI with a no-code query builder, light AI assistance, and quick self-service dashboards. | Free (Open Source); Cloud from $100/month. |
Apache Superset | Fully open-source BI for technical teams that want full control over visualizations and infrastructure. | Free (Open Source). |
Evidence | Open-source, BI-as-code platform that builds polished reports and data products from SQL and markdown. | Free (Open Source); Team (Cloud) from $15/user/month. |
What are the best AI-powered Lightdash alternatives?
Here are the best AI-powered Lightdash alternatives in 2026:
#1: Dot
Dot is the best AI-powered Lightdash alternative on the market for teams that want decision-ready analysis without spending another quarter modeling dimensions and metrics from scratch.
We're not trying to replace your dbt project or rebuild your semantic layer.
Our platform sits on top of the work you've already done, including your existing dbt models, Looker LookML, or Power BI definitions, and turns business questions into structured analysis with full reasoning attached.
Here's how that plays out day to day: 👇
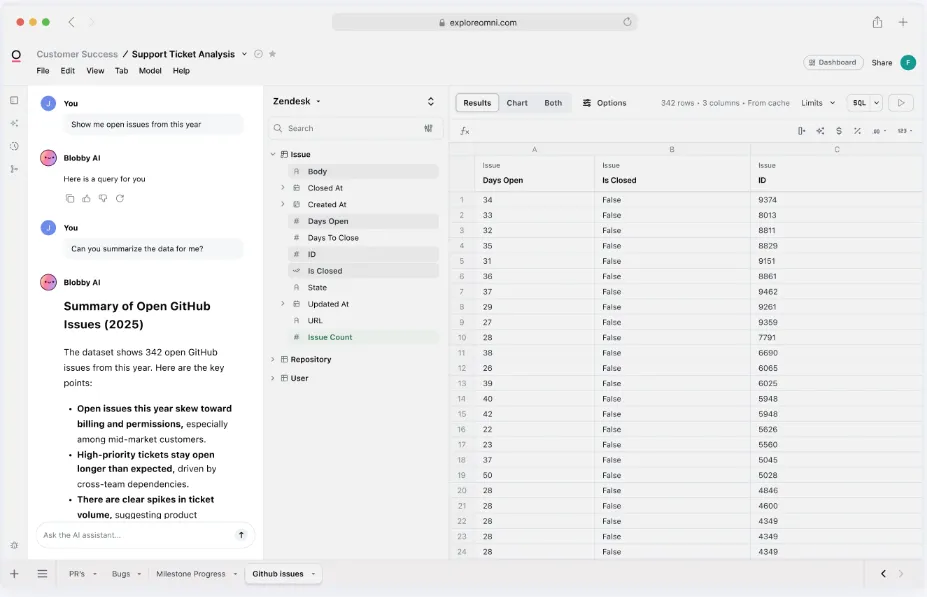
Ask plain-English business questions in Slack and get the analysis back
Take a Tuesday morning where your VP of Sales pings the data team: trial-to-paid conversion dropped 18% week over week, and they need the full breakdown before the 11 AM exec sync.
In a traditional dashboard-first workflow, an analyst opens the conversion dashboard, slices by source, then by cohort, then realizes the drop is concentrated in one campaign and writes it up around 2 PM.
With Dot, the VP types the question into Slack themselves.
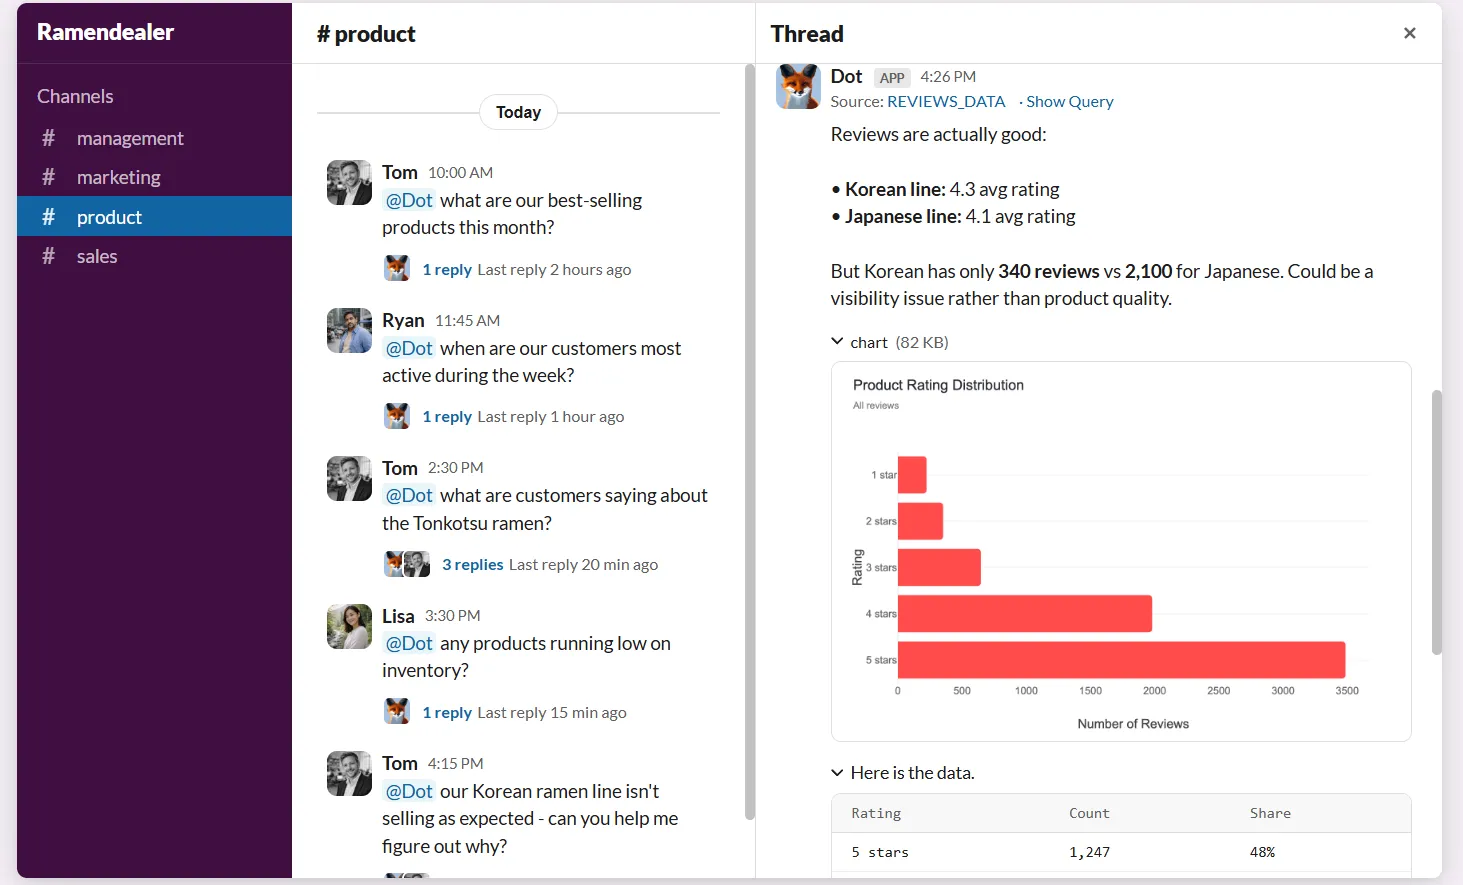
Within a few minutes, the answer comes back: a structured breakdown by acquisition channel, the two campaigns responsible for most of the drop, and a flag on a sudden spike in onboarding step-3 abandonment.
The data team isn't interrupted once, and the response arrives with the SQL Dot run, the tables it pulled from, and a clear recommendation on what to investigate next.
Automated executive reports that your leadership will actually read
Recurring reports are where most data teams quietly lose hours every week.
- The Monday metrics deck.
- The Wednesday board update.
- The end-of-month cohort review.
Each one starts as a thoughtful artifact and ends as a chart screenshot pasted into slides.
Dot replaces that work with scheduled PowerPoint reports that pull live data from your warehouse and write the narrative for you.
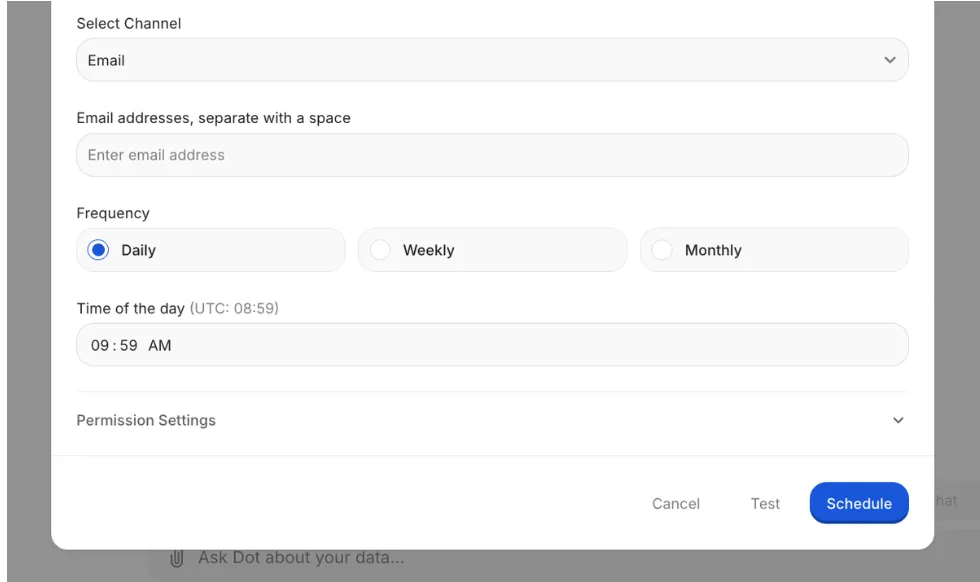
Not exported screenshots from your existing BI tool.
A real written analysis covering what happened, how the numbers compare to last period, where the trends are heading, and which specific findings deserve a closer look.
A Context Agent that keeps definitions consistent across your stack
Run a semantic layer at any growing company for long enough, and the same problem appears: definitions drift.
Marketing's "active user" diverges from product's, finance's churn calculation excludes a cohort, the dbt project, and a Notion page all describe slightly different logic for what should be the same metric.
Dot's Context Agent crawls your dbt models, your existing semantic layer, your data catalog, and any internal documentation, then builds a single business vocabulary that every query and report references.
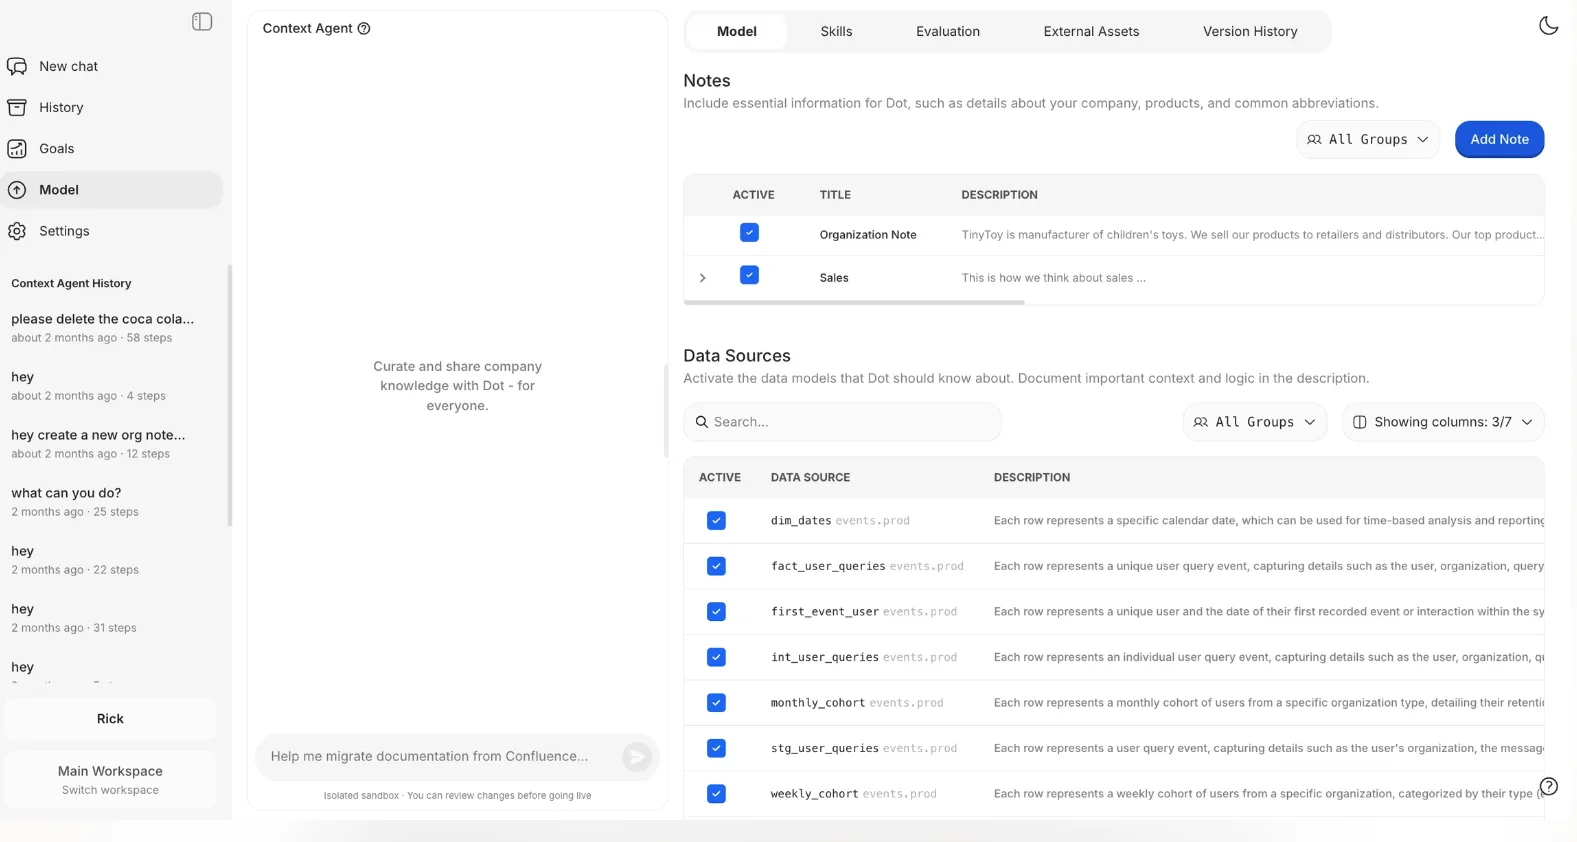
When something's missing, Dot fills the gap. When two definitions conflict, it surfaces the conflict instead of silently picking one.
Whoever asks the question and whenever they ask, the underlying logic is the same.
Full audit trail on every insight
Trust gets quietly eroded in BI rollouts when nobody can answer "where did that number come from."
A dashboard might say churn ticked up six points last quarter, but if your CFO asks about the source and the trail runs through three SQL files, a calculated field, and a derived table, the insight loses weight before the meeting ends.
Every answer Dot produces ships with footnotes.
Real ones, with links to the SQL query Dot ran, the Python code it used for any calculations, and the exact tables and columns it pulled from.
If a number looks off, anyone on the team can click in, walk the logic, and verify it in minutes. That shifts the conversation from "the report says so" to "here's exactly how we got there."
Dot pricing
Dot offers a free plan with 300 one-time credits and full access to Pro features, so you can test the platform on real warehouse data before committing to anything.
There are three paid plans:
- Pro: $180/month, with 150 credits per month, $1.80 per credit overage, and unlimited users.
- Team: $720/month, with 800 credits per month, $1.44 per credit overage, SSO, row-level security, embedded analytics, BI migration support, and dedicated support.
- Enterprise: Custom pricing, with unlimited credits, volume discounts, self-hosted deployment, audit logs, an SLA, and a dedicated account manager.
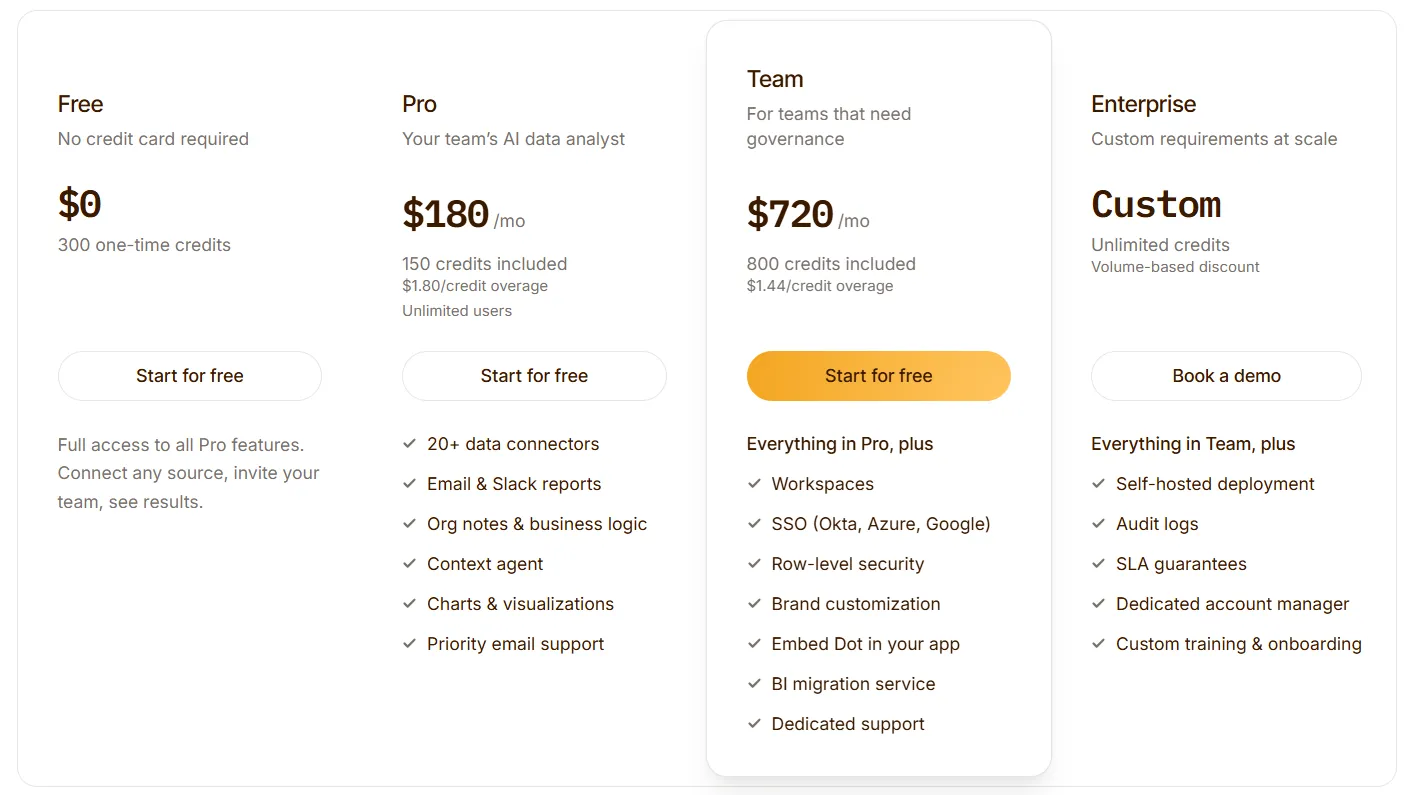
➡️ Annual billing saves 10% across all paid plans.
Dot pros and cons
✅ Replaces hours of recurring report-building with scheduled, narrative business reviews.
✅ Plain-English questions in Slack or Teams come back with full analysis, not just answered questions.
✅ Shared business context keeps every team referencing the same definitions.
✅ Every insight links to the SQL, Python, and datasets behind it.
✅ Credit-based pricing with unlimited users.
❌ Not a dashboarding replacement, so visualization-heavy teams will want a BI layer alongside.
❌ Requires a connected warehouse or modeled data source.
#2: ThoughtSpot
Best for: Business teams that want fast, search-based answers from a governed semantic model without depending on analysts to build every chart.
Similar to: Dot, Supaboard.
ThoughtSpot rebuilt its product around Spotter, a conversational analytics agent that takes plain-English questions and returns charts, follow-up suggestions, and explanations in seconds.
For teams trialing lighter AI tools like Julius AI, it's the more polished, enterprise-grade step up.
ThoughtSpot's top features
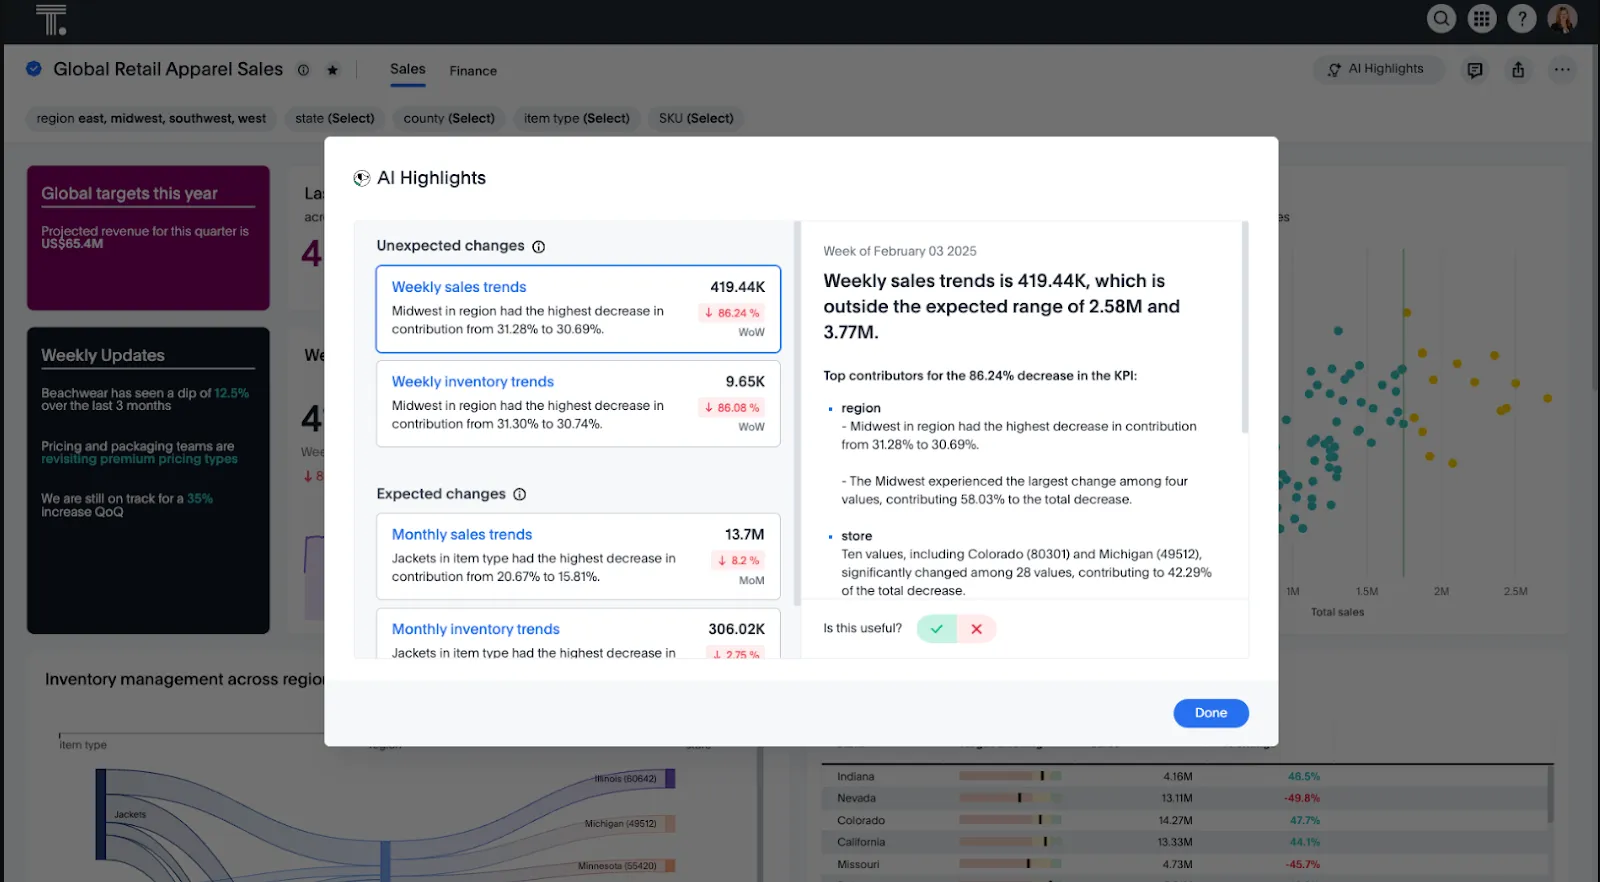
- Search-based analytics: Type business questions in plain language and get instant visual answers without navigating dashboards.
- AI insights with Spotter: Handles iterative questioning, surfaces patterns in the data, and keeps an analyst out of the middle of every follow-up.
- Embedded analytics: Drop search-driven analytics into your own product or internal tooling with full visual customization.
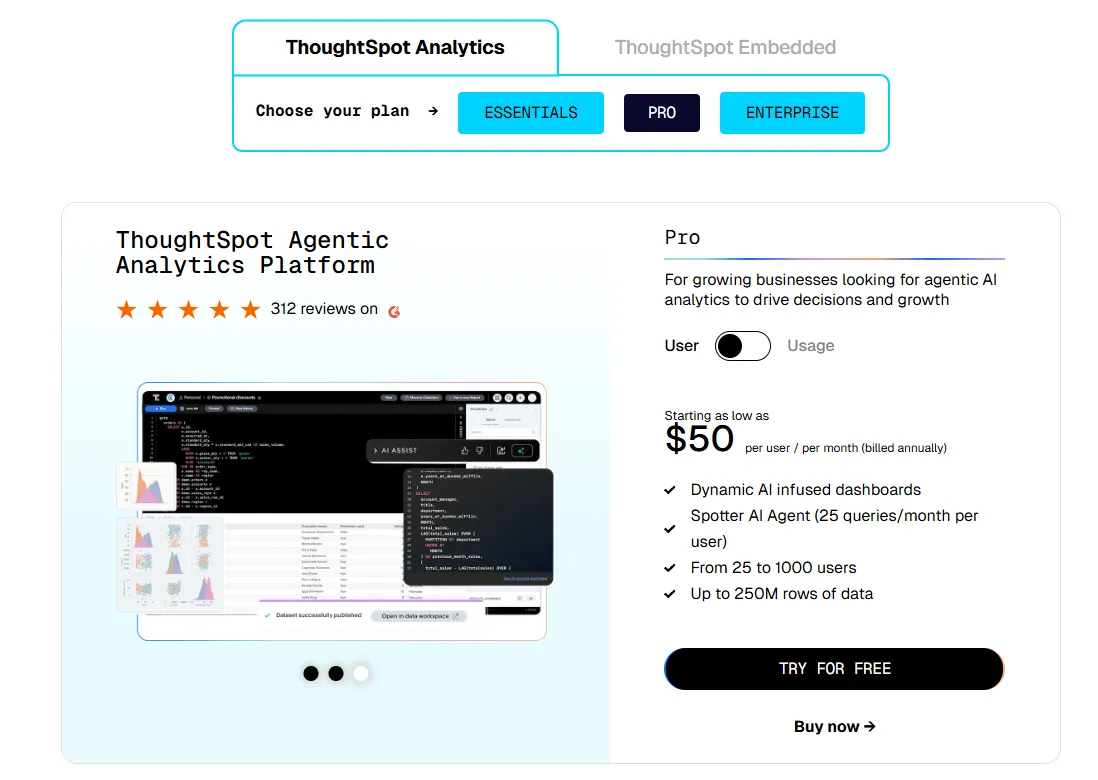
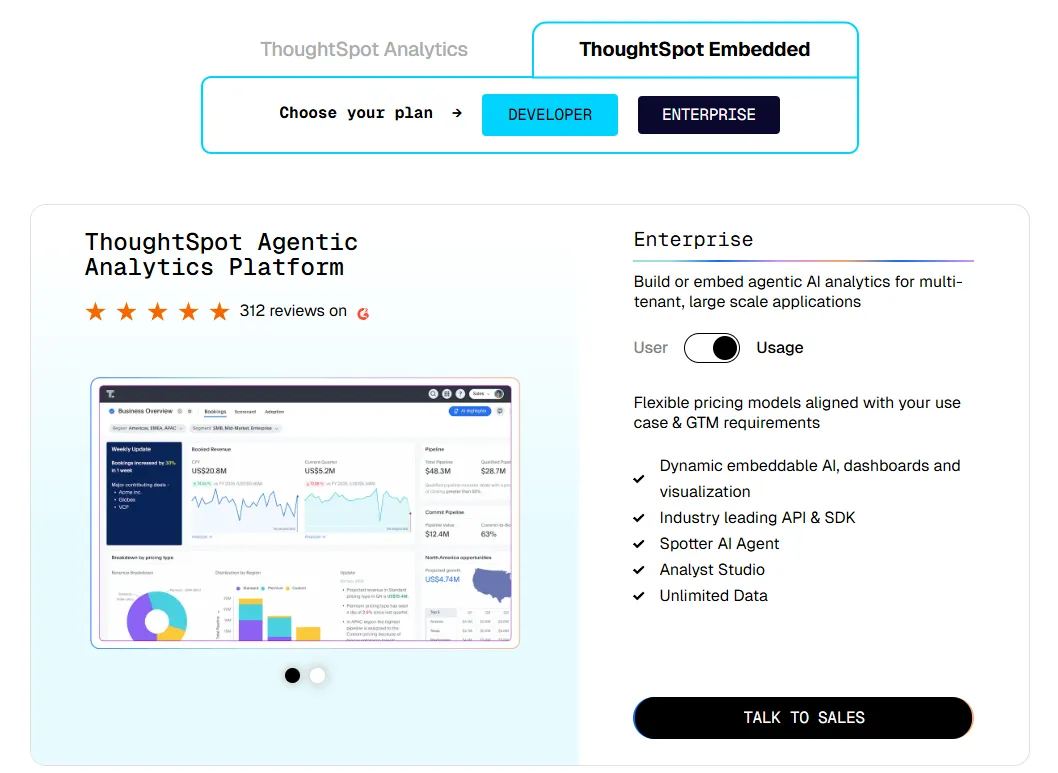
ThoughtSpot pricing
ThoughtSpot offers two separate products - ThoughtSpot Analytics for internal BI and ThoughtSpot Embedded for building analytics into applications - each with flexible pricing depending on scale and usage:
- ThoughtSpot Analytics:
- Essentials: From $25 per user per month (billed annually), for teams of 5-50 users, includes dynamic interactive dashboards and AI-powered insights and supports up to 25M rows of data.
- Pro (per user pricing): From $50 per user per month (billed annually), for 25–1,000 users, includes everything in Essentials, plus AI-infused dashboards and Spotter AI Agent (25 queries per user/month), and supports up to 250M rows of data.
- Pro (usage-based): From $0.10 per query, includes everything in Pro per user, and adds Analyst Studio.
- Enterprise (user or usage-based): Custom pricing, includes everything in Pro, plus unlimited users and data.
- ThoughtSpot Embedded:
- Developer: Free for 1 year, includes embeddable AI analytics, dashboards, and visualizations, APIs and SDKs, up to 10 users and 25M rows of data.
- Enterprise (user-based): Custom pricing, includes everything in Developer, plus unlimited data.
- Enterprise (usage-based): Custom pricing, everything in Enterprise, plus Spotter AI Agent and Analyst Studio.
ThoughtSpot pros and cons
✅ Approachable for non-technical users.
✅ AI surfaces patterns faster than manual dashboard exploration.
❌ Two pricing structures (per user vs. usage-based) can get confusing at scale.
#3: Domo
Best for: Mid-market and enterprise teams that want a single platform handling data ingestion, dashboards, automation, and AI agents in one place.
Similar to: Power BI, Tableau.
Of every tool on this list, Domo offers the most: ingestion, modeling, dashboards, alerting, and AI, all bundled into one platform that connects to hundreds of data sources out of the box.
Domo's top features
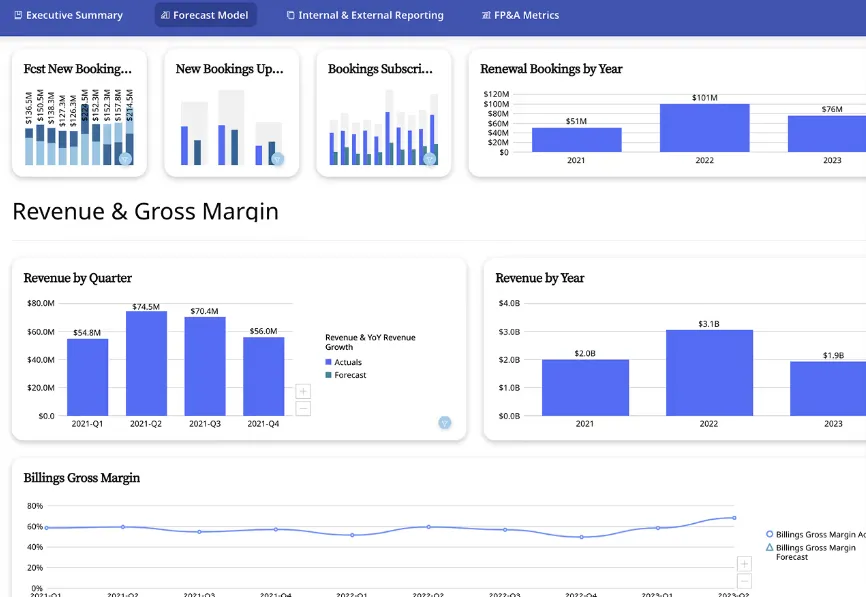
- Interactive dashboards and sharing: Build live, drillable dashboards and share them across teams or embed them in customer-facing apps.
- No-code analytics apps: Build custom data apps tied to specific business workflows without involving a developer.
- AI-powered chat and insights: Ask questions in natural language, surface trends, and use AI agents to trigger actions from dashboards.
Domo pricing
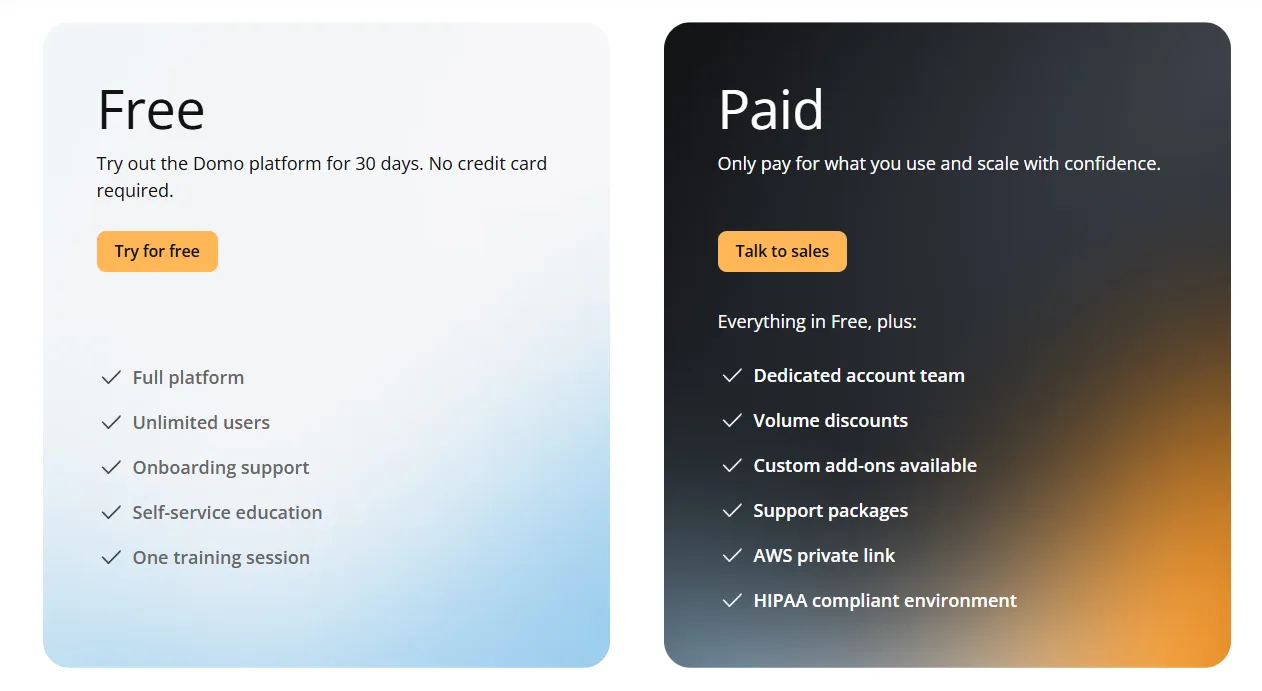
Domo has one paid plan and a free trial:
- Free trial: 30 days, no credit card required, includes unlimited users, full platform access, onboarding support, self-service education, and one guided training session.
- Paid plan: Usage-based pricing designed to scale as your analytics needs grow, includes everything in the trial and adds a dedicated account team, volume discounts, custom add-ons, and support packages.
Domo pros and cons
✅ Friendly for non-technical users.
✅ Wide connector library covering a long list of SaaS tools.
❌ Pricing is not disclosed. We covered affordable options in our Domo alternatives breakdown.
What are the best warehouse-native and semantic-layer alternatives to Lightdash?
Here are the best warehouse-native and semantic-layer alternatives in 2026:
#1: Looker
Best for: Data teams that want a centralized, version-controlled semantic layer with deep Google Cloud integration and tight governance.
Similar to: Omni, Holistics.
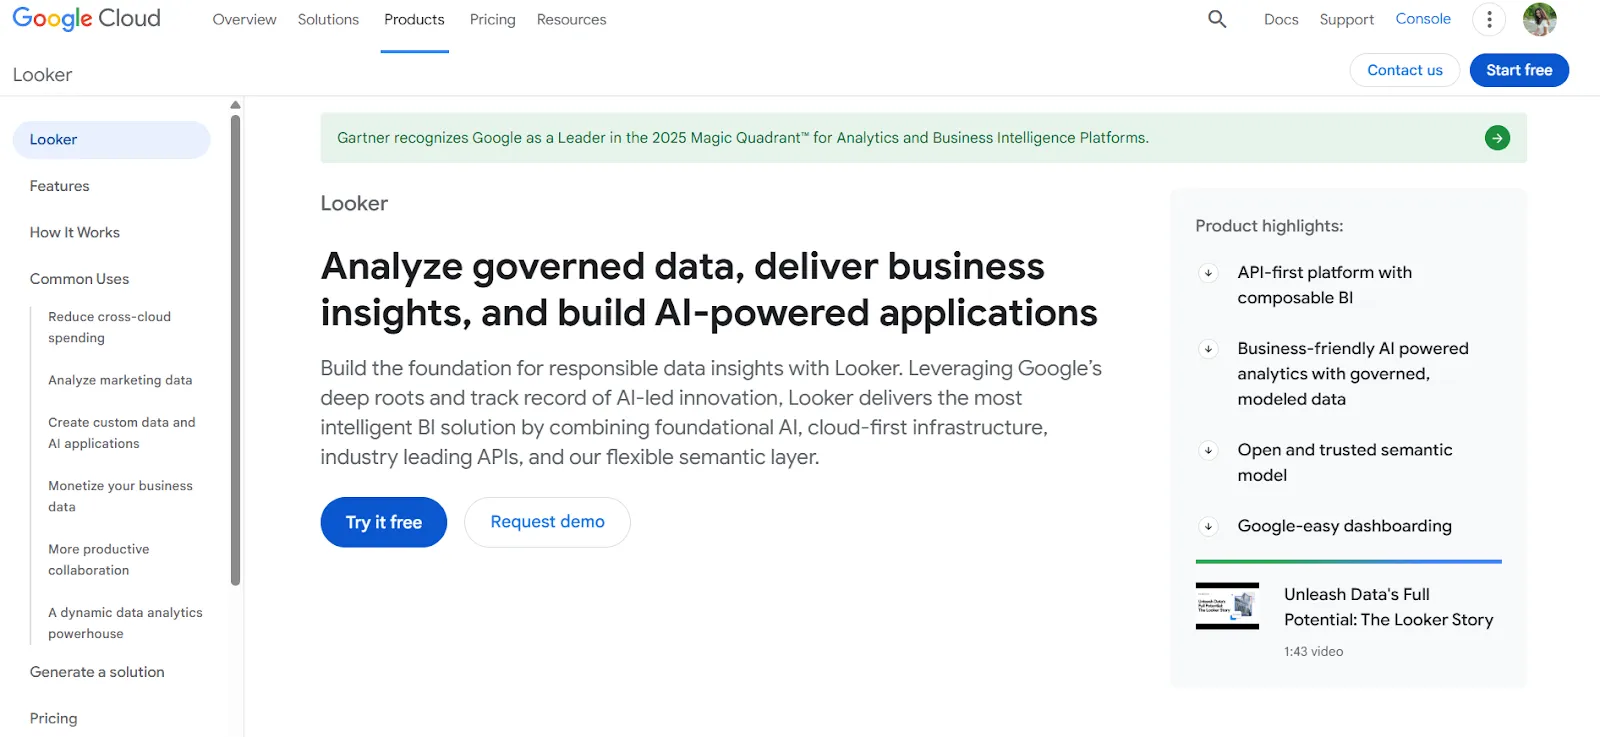
LookML, Looker's modeling language, is what most data teams know it for.
Every metric, dimension, and business rule lives in a single repository, and every dashboard or downstream tool reads from that same model.
It's also folded in Gemini-powered conversational analytics for natural-language access on top of the same governed model.
Looker's top features
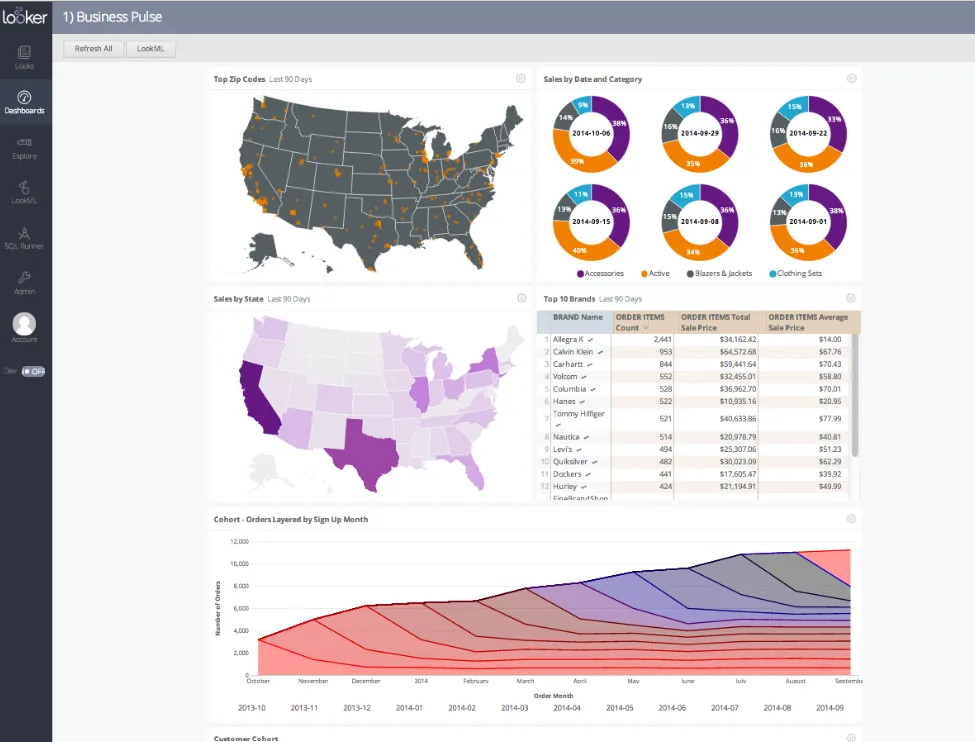
- LookML semantic modeling: Metrics and business rules are defined once and referenced everywhere, so the number you see in a dashboard matches the one in a scheduled email or an embedded chart.
- Gemini-powered conversational analytics: Users ask questions in plain language and get answers grounded in the LookML model.
- Real-time, governed dashboards: Dashboards query the warehouse live, so users always see current numbers without waiting on extracts.
Looker pricing
Looker uses a custom, contract-based pricing model made up of two parts: platform pricing (the cost of running a Looker instance) and user licensing (the cost per user type).
Pricing is annual for all plans.
- Platform editions:
- Standard: Designed for small teams or organizations with fewer than 50 users, includes 1 production instance, 10 standard users + 2 developer users, up to 1,000 query-based API calls/month, and up to 1,000 admin API calls/month.
- Enterprise: Built for larger internal BI and analytics use cases, includes everything in Standard, plus enhanced security features, up to 100,000 query-based API calls/month, and up to 10,000 admin API calls/month.
- Embed: Designed for embedding analytics into external products or applications, includes everything in Standard, plus up to 500,000 query-based API calls/month and up to 100,000 admin API calls/month.
- User licensing:
- Developer users: Full access to Looker, including LookML development, administration, APIs, and advanced tooling.
- Standard users: Can explore data, build dashboards and reports, run SQL, and schedule content.
- Viewer users: Read-only access to dashboards and reports, with filtering and drill-down.
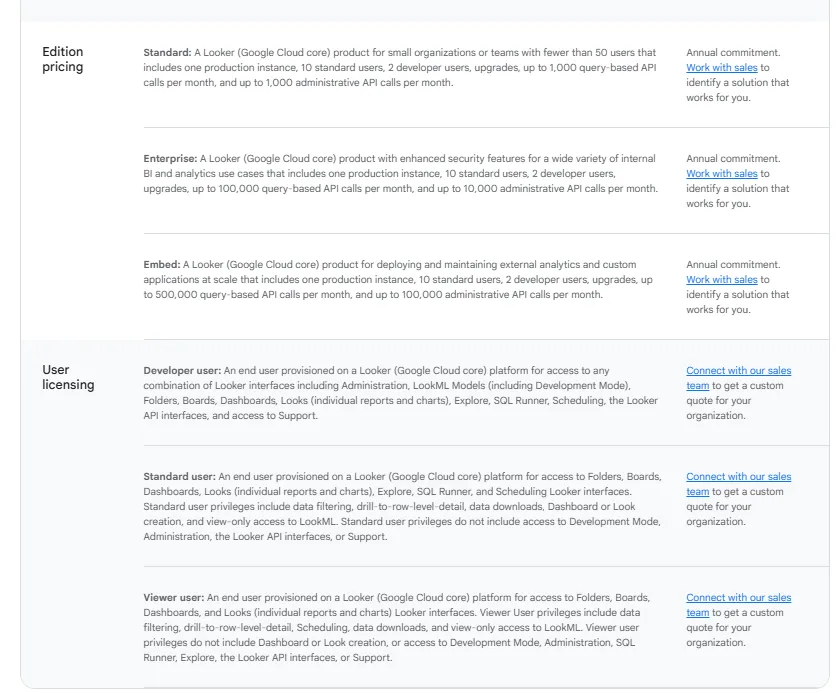
Pricing is custom on all plans and varies based on scale, permissions, and usage.
Looker pros and cons
✅ Keeps metrics consistent across every report and downstream tool.
✅ Mature embedding capabilities for customer-facing analytics.
❌ There's a bit of a learning curve at first, which can require a bit more education upfront to maximize all of its capabilities, according to a G2 review.
#2: Omni
Best for: Data teams that want a flexible, modern semantic layer without the rigidity of LookML or the modeling overhead of older BI platforms.
Similar to: Looker, Lightdash.
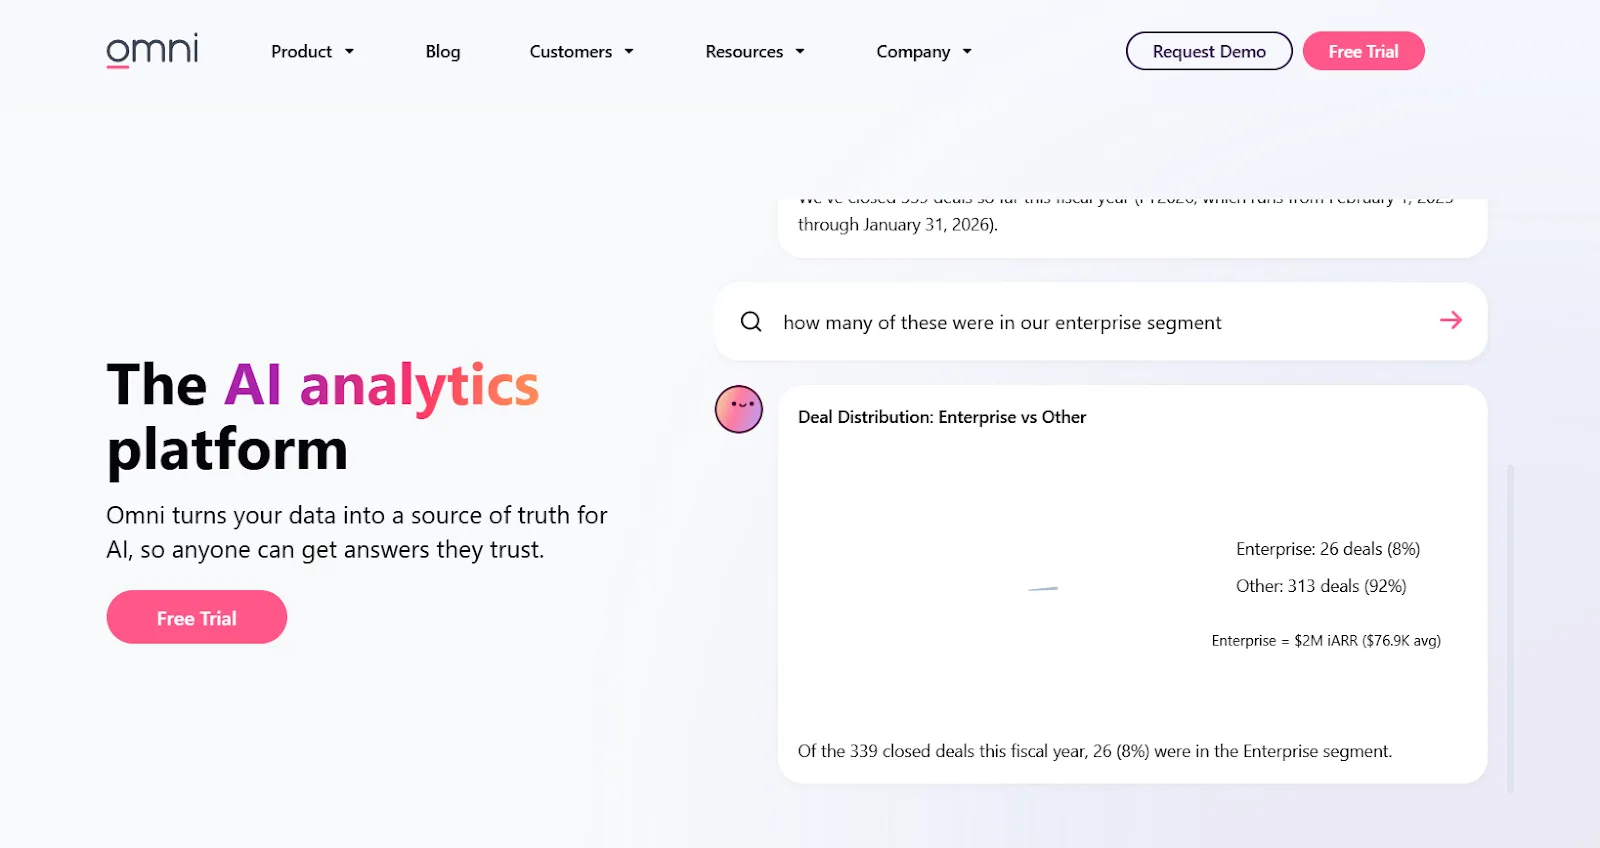
Omni came out of a team that previously worked on Looker, with a clear thesis: keep the metrics-first semantic layer, drop the LookML rigor, and let business users explore freely without breaking governance.
It connects to cloud warehouses and aims at the sweet spot between governed and exploratory.
Omni's top features
- Metrics-first modeling: Define metrics centrally with reusable, governed calculations that don't require LookML-level rigor to maintain.
- Spreadsheet-style exploration: Analyze live warehouse data through a familiar spreadsheet view while still pulling from governed metrics.
- AI-assisted dashboards: Use AI directly inside dashboards to generate queries, explain trends, and recommend follow-ups.
Omni pricing
Omni doesn't publish pricing on its website.
You can request a free trial and ask their team for a quote.
Omni pros and cons
✅ Drag-and-drop interface keeps non-technical users productive.
✅ Strong dbt integration and direct warehouse querying.
#3: Holistics
Best for: Teams that want analytics-as-code with strong dbt integration and governed self-service, without paying enterprise prices.
Similar to: Lightdash, Looker.
If Lightdash and Holistics had a shared manifesto, it would be "BI belongs in code."
Holistics takes that philosophy further than most: business logic, datasets, metrics, dashboards, and even data delivery are all defined in their declarative DSL.
The closest philosophical cousin to Lightdash on this list, with heavy overlap on the dbt-friendly, version-controlled approach.
Holistics' top features
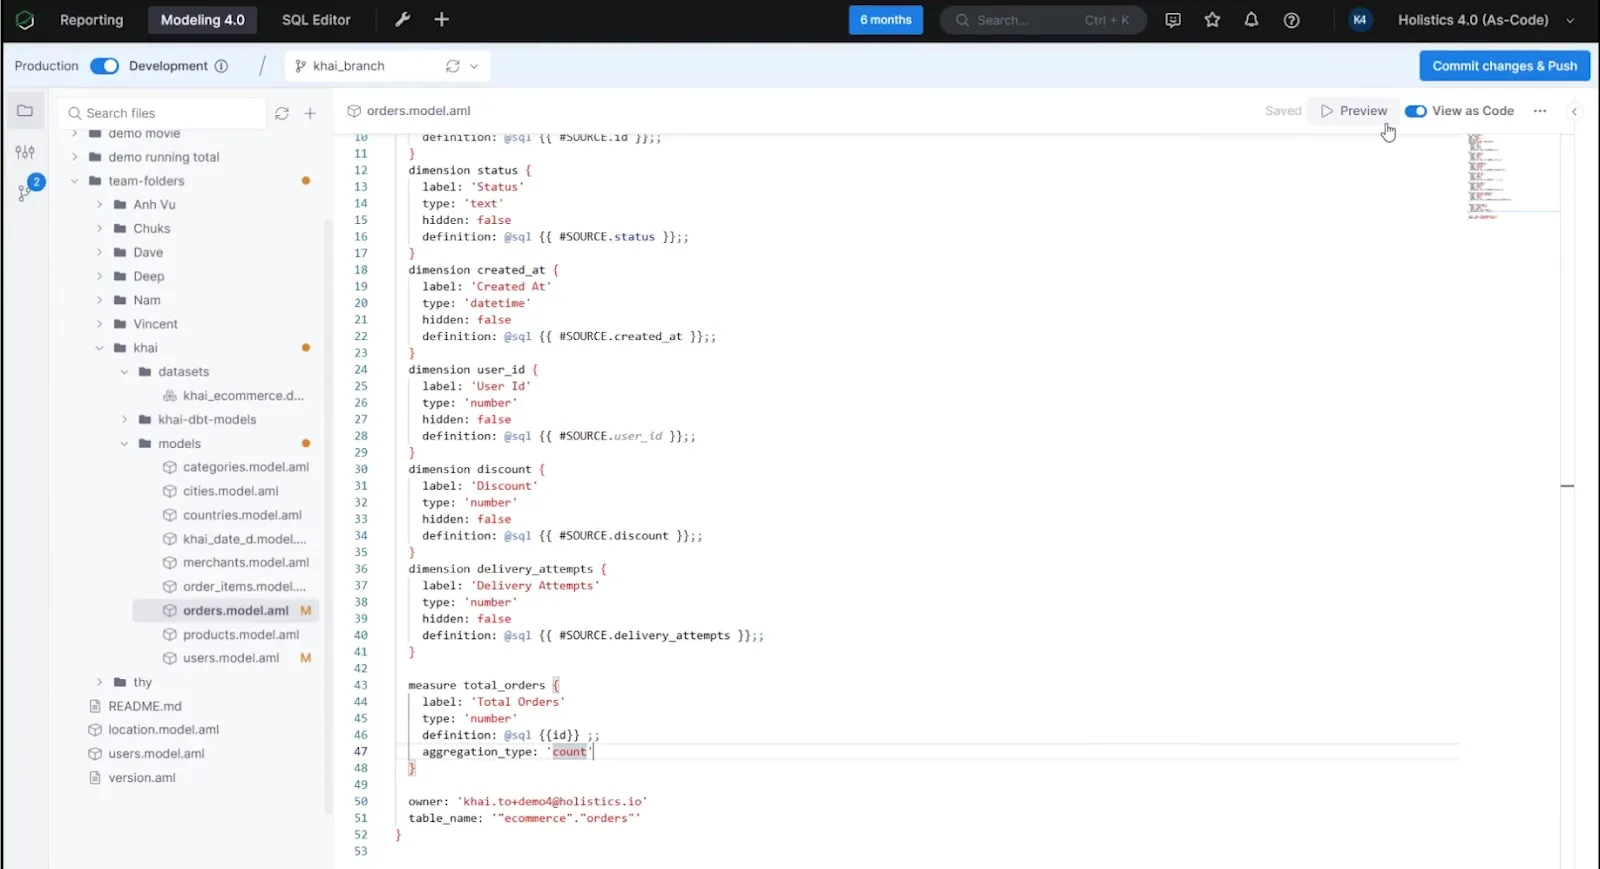
- Self-service for business users: Non-technical teams build their own reports and dashboards through a visual interface using pre-modeled metrics.
- Analytics-as-code: Build everything (datasets, metrics, joins, transformations) in code that goes through code review, version control, and deployment workflows like the rest of your engineering stack.
- Centralized data modeling: Define logic once, enforce it everywhere, with consistency across every dashboard and report.
Holistics pricing
Holistics prices by reports and users, with add-ons for advanced security:
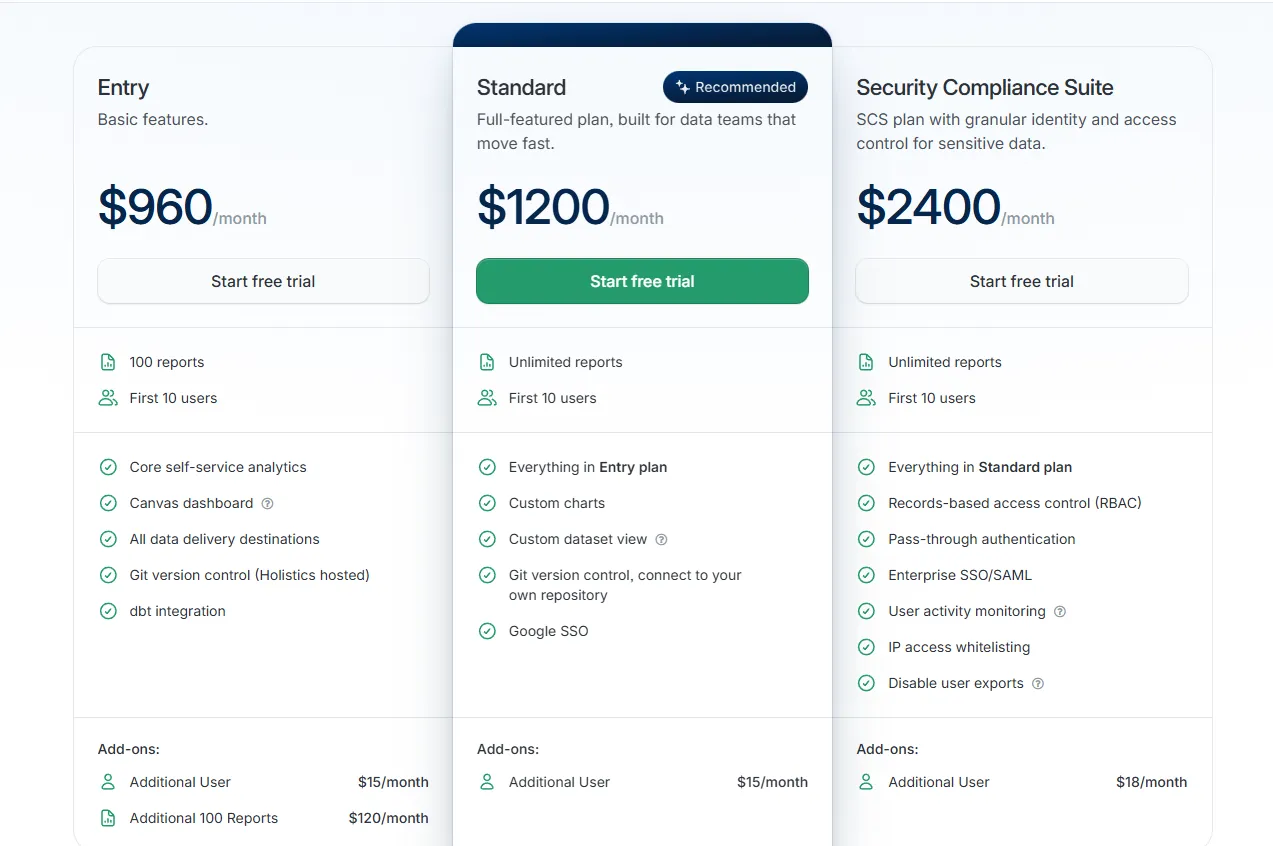
- Entry: $960/month for 100 reports and 10 users, covering core self-service analytics, Canvas dashboards, all delivery destinations, hosted Git version control, and dbt integration. Extra users run $15/month, and each additional 100-report block costs $120/month.
- Standard: $1,200/month for unlimited reports and 10 users, adding custom charts, custom dataset views, your own Git repository connection, and Google SSO. Extra users at $15/month.
- Security Compliance Suite: $2,400/month, layering on RBAC, pass-through authentication, enterprise SSO with SAML, activity monitoring, IP whitelisting, and export controls. Extra users at $18/month.
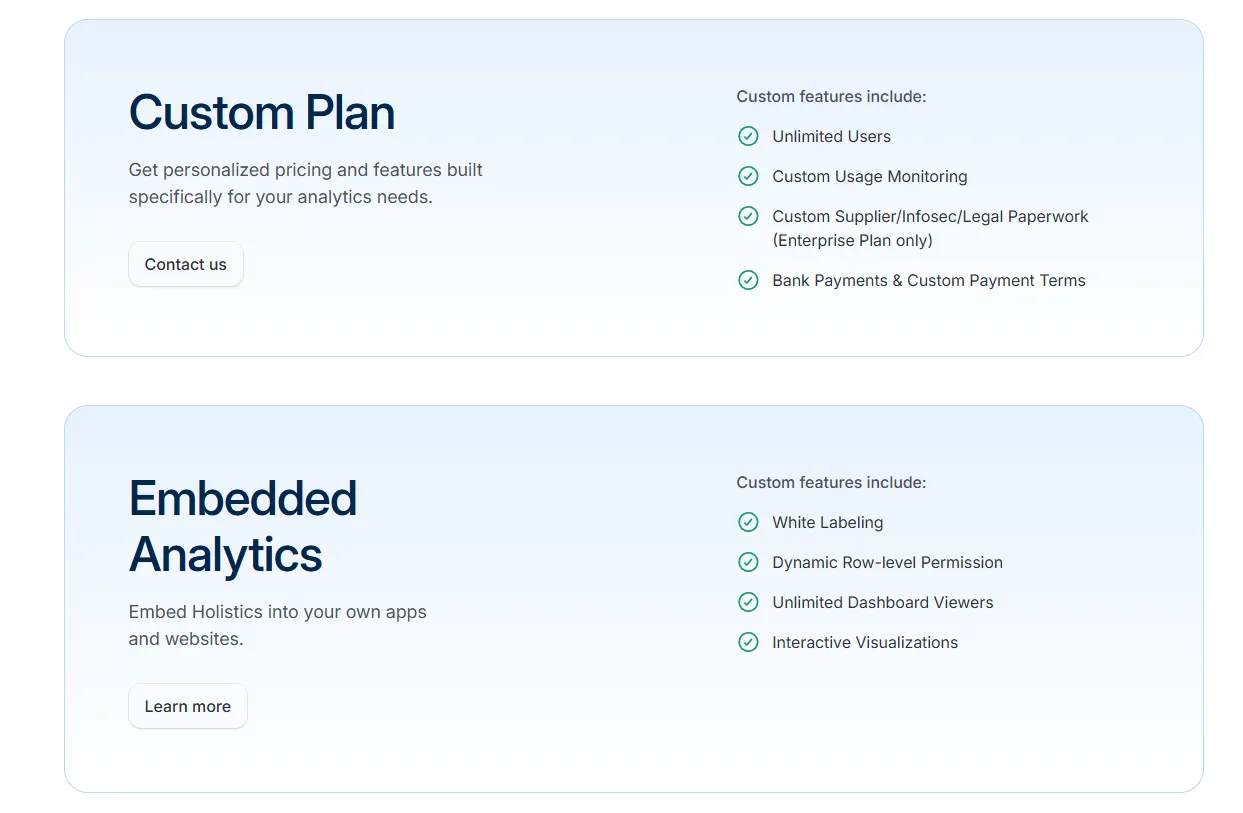
- Custom Plan: Tailored pricing for organizations that need unlimited users, custom monitoring, or advanced compliance configurations.
- Embedded Analytics: Custom pricing for white-labeled dashboards, dynamic row-level permissions, and unlimited viewer access.
Holistics pros and cons
✅ Code-first workflow with Git version control built in for analytics changes.
✅ Powerful dashboards with deep drill-downs through AQL and the Canvas builder.
❌ Starts from $960/month, which can be expensive for SMEs.
#4: Sigma
Best for: Finance and ops teams that want spreadsheet-style analytics directly on live warehouse data without exporting to Excel.
Similar to: Omni.
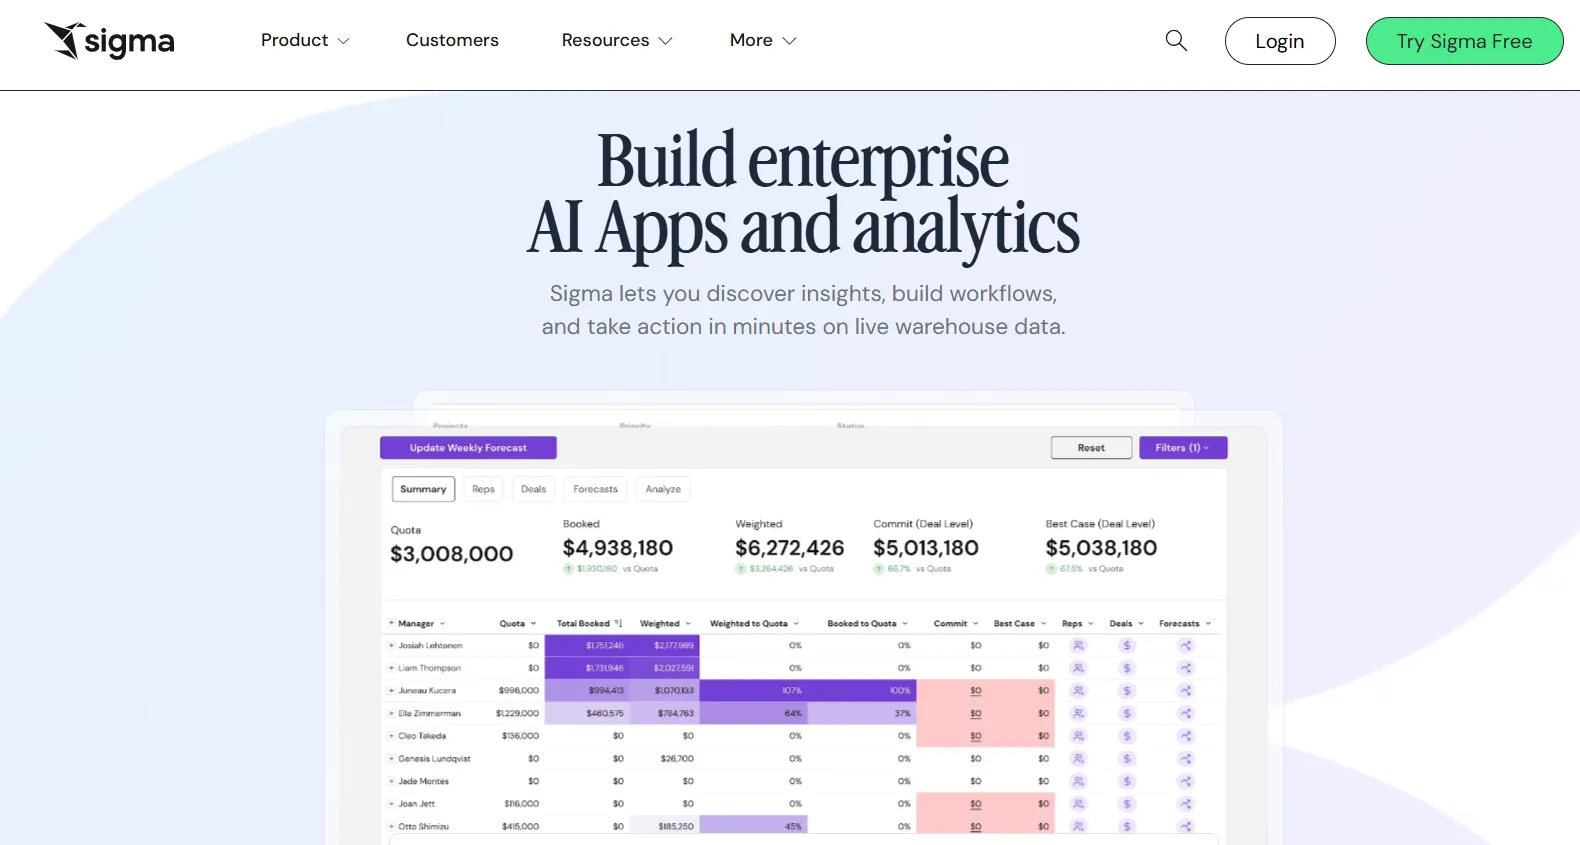
Sigma's bet is that finance and ops teams already know spreadsheets, so the easiest way to get them analyzing warehouse data is to put a familiar Excel-like interface on top of Snowflake, BigQuery, or Databricks.
Sigma's top features
- Spreadsheet interface on live data: Work with billions of rows directly in your warehouse using formulas, tables, and logic that feel like Excel.
- AI-powered apps and dashboards: Use natural language and AI to build dashboards, reports, and operational AI apps tied to live data.
- Collaborative workbooks: Build dashboards in shared workbooks where teams comment, version, and iterate together.
Sigma pricing
Sigma keeps pricing private. Their sales team handles custom quotes.
Sigma pros and cons
✅ Familiar spreadsheet interface lowers the barrier for finance and ops users.
✅ Live warehouse queries with zero ETL overhead.
✅ Sigma’s AI assistant speeds up common analyses.
What are the best open-source and self-service alternatives to Lightdash?
Here are the best open-source and self-service Lightdash alternatives in 2026:
#1: Metabase
Best for: Startups, product teams, and small data teams that want quick, self-service analytics with low setup cost and a friendly UI.
Similar to: Apache Superset.
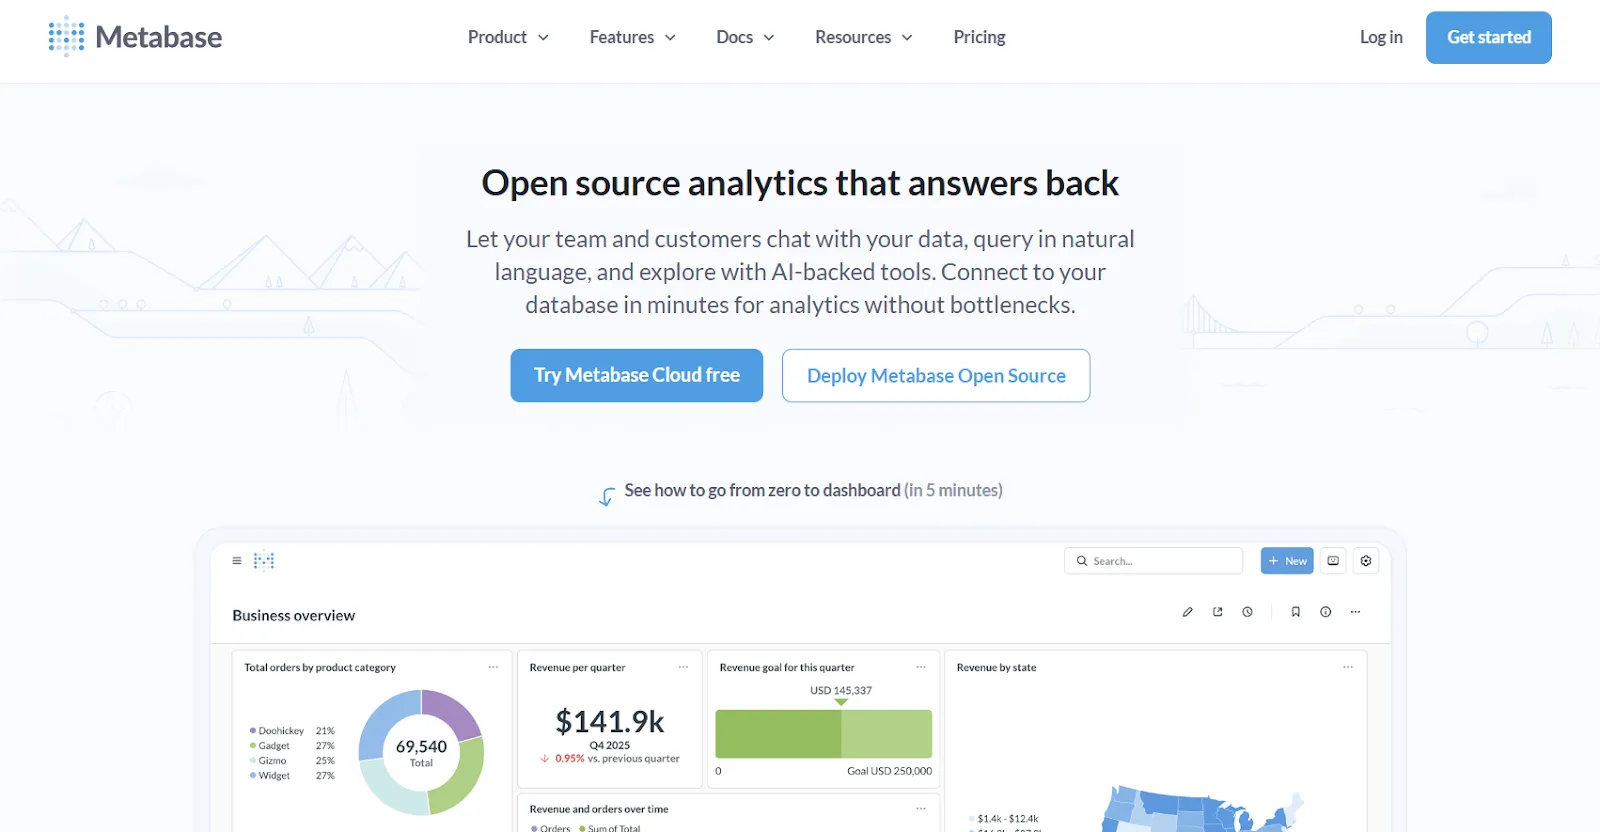
Of the open-source options on this list, Metabase is the most approachable. The setup is light, the UI is friendly, and you don't need a dedicated analytics engineer to make it useful in week one.
It supports both visual query building and raw SQL, plus a natural-language layer through Metabot AI for plain-English questions.
Metabase's top features
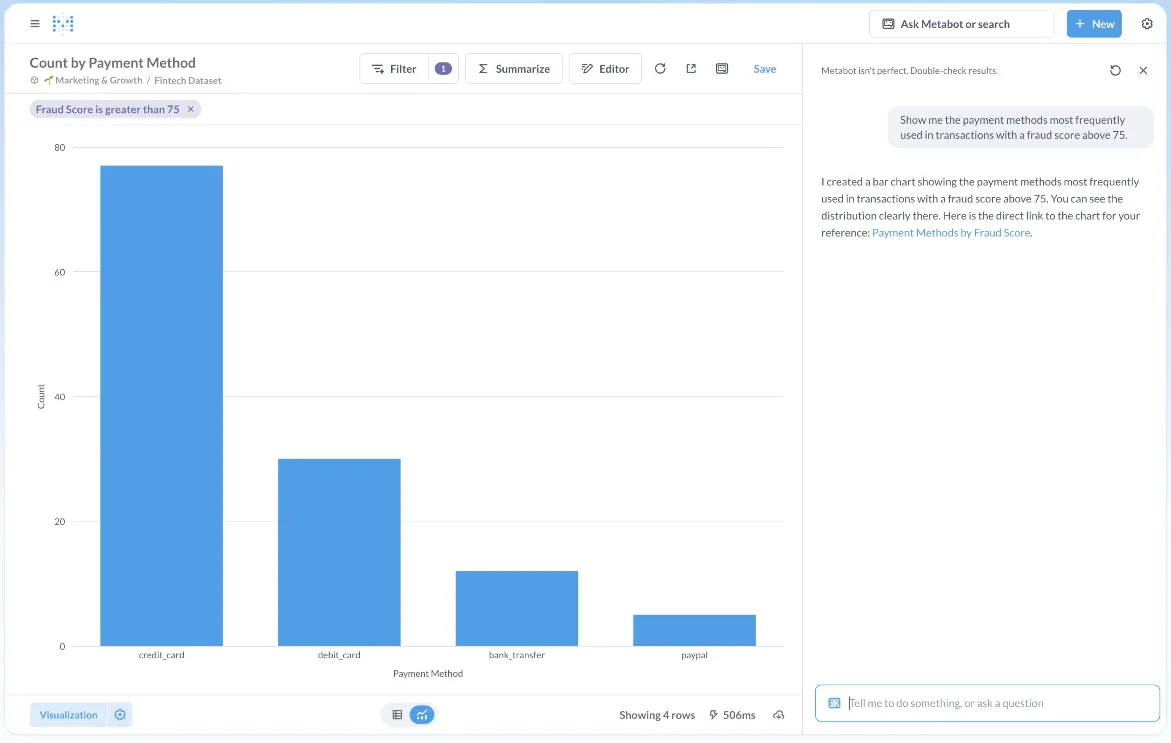
- Natural-language analytics with Metabot AI: Ask questions in plain English and let AI generate the queries and charts on top of live data.
- Visual query builder: Non-technical users build queries through a step-by-step UI, while analysts drop into raw SQL when they need to.
- Drill-through exploration: Click any chart to filter, break it down, view source records, or auto-generate follow-up reports.
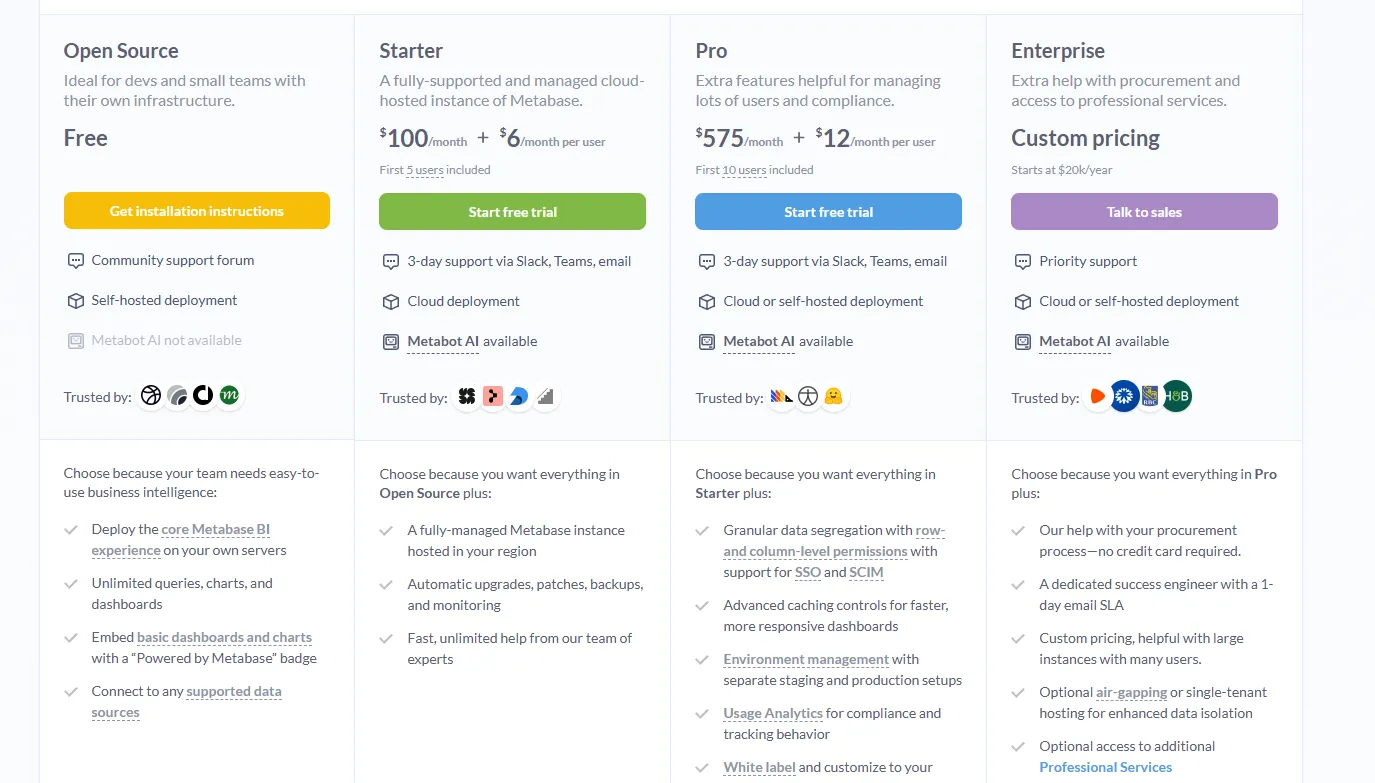
Metabase pricing
Metabase offers two pricing options depending on how you use the product: internal business intelligence or customer-facing embedded analytics.
- Business Intelligence:
- Open Source (Self-hosted): Free, self-hosted deployment, includes unlimited queries, charts, and dashboards, connects to all supported data sources, basic embedding with “Powered by Metabase” branding, community support only.
- Starter (Cloud-hosted): $100/month + $6/user/month, first 5 users included, includes everything in Open Source, plus option to include Metabot AI (charged extra), automatic upgrades, backups, and monitoring, support via Slack, Teams, and email (3-day SLA).
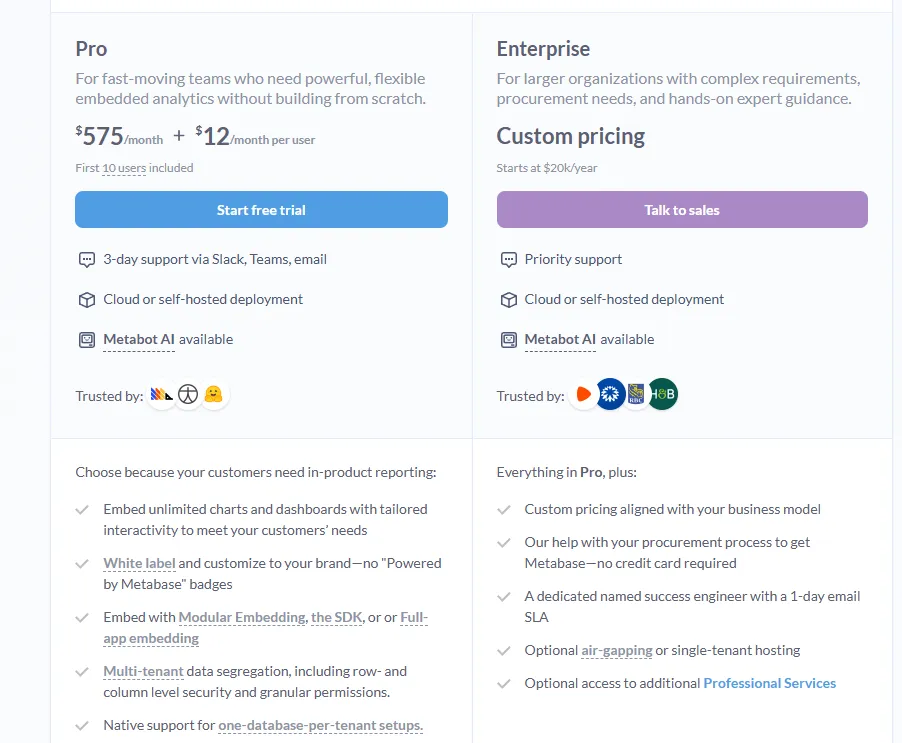
- Pro: $575/month + $12/user/month, first 10 users included, cloud or self-hosted deployment, includes everything in Starter, plus row- and column-level permissions, SSO and SCIM support, advanced caching and performance controls, staging + production environments, usage analytics and audit visibility, white-labeling, and embedded analytics capabilities.
- Enterprise: Custom pricing (starts at $20k/year), includes everything in Pro, plus priority support, dedicated success engineer (1-day email SLA), optional single-tenant or air-gapped deployment, and optional professional services.
- Embedded Analytics pricing:
- Pro: $575/month + $12/user/month, first 10 users included, includes unlimited embedded dashboards and charts, full white-labeling, modular embedding, SDK, or full-app embedding, multi-tenant security (row- and column-level), one-database-per-tenant support, staging + production environments, usage analytics, internal BI for your team, and option to include Metabot AI (charged extra).
- Enterprise: Custom pricing (starts at $20k/year), includes everything in Pro, plus a dedicated success engineer, priority support, optional single-tenant or air-gapped hosting, and optional professional services.
Metabase pros and cons
✅ Easy for both technical and non-technical users.
✅ Fast setup on common databases like Postgres, MySQL, and Snowflake.
✅ Cost-effective open-source path with a real cloud option above it.
❌ A user on G2 believes that Metabase could benefit from having an AI assistant that understands the databases and assists in building queries
#2: Apache Superset
Best for: Technical data teams that want a fully open-source platform with deep customization and complete infrastructure control.
Similar to: Metabase, Lightdash.
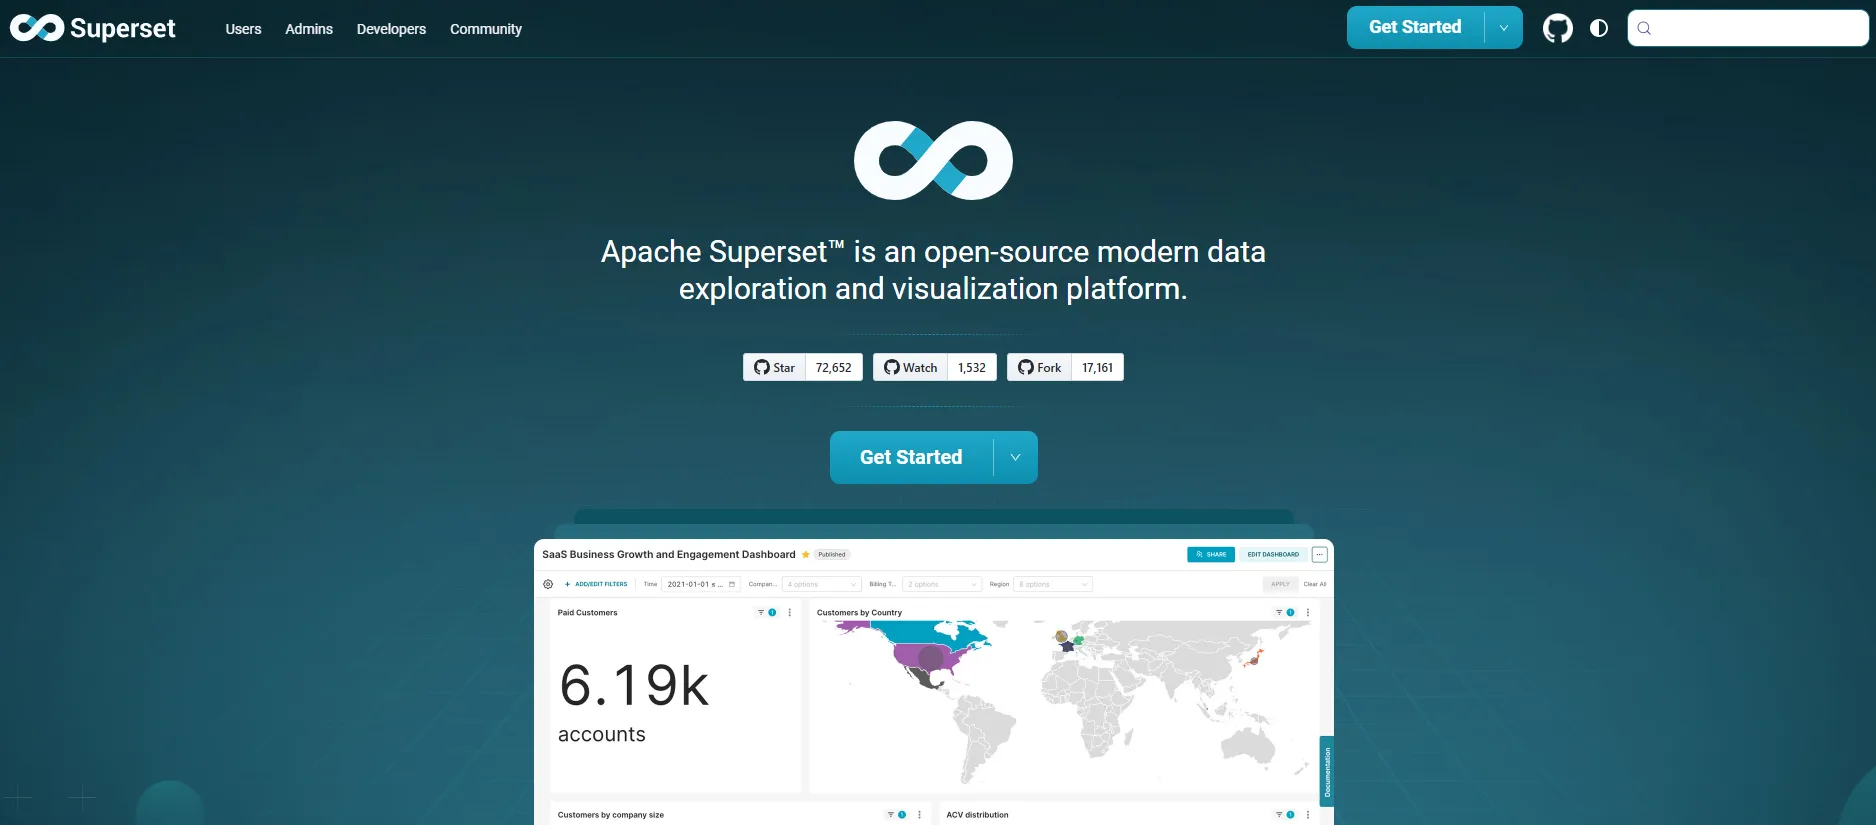
Originally built at Airbnb and donated to the Apache Foundation, Superset is fully open-source under the Apache 2.0 license and has matured into one of the most-deployed BI tools in production at scale.
It's the option for teams that don't mind running and maintaining their own BI stack in exchange for unrestricted customization and zero licensing fees.
Apache Superset's top features
- Wide visualization library: Build interactive charts using time-series, geospatial, pivot tables, heatmaps, and dozens more types powered by Apache ECharts.
- SQL Lab IDE: Write, test, and save SQL queries directly in Superset, with autocomplete, saved queries, and multi-database support.
- Caching and performance tuning: Built-in caching layers improve dashboard load times and reduce database load in heavy-usage environments.
Apache Superset pricing
Apache Superset itself is free under the Apache 2.0 license. That covers the software but not the infrastructure or engineering required to run it.
You'll generally pay for cloud hosting (AWS, GCP, Azure), engineering time for setup and maintenance, DevOps support, security configuration, and version upgrades.
Apache Superset pros and cons
✅ Truly free at the software layer.
✅ Big visualization library and flexible filtering for technical users.
❌ Hosting, security, and upgrades will land entirely on your team.
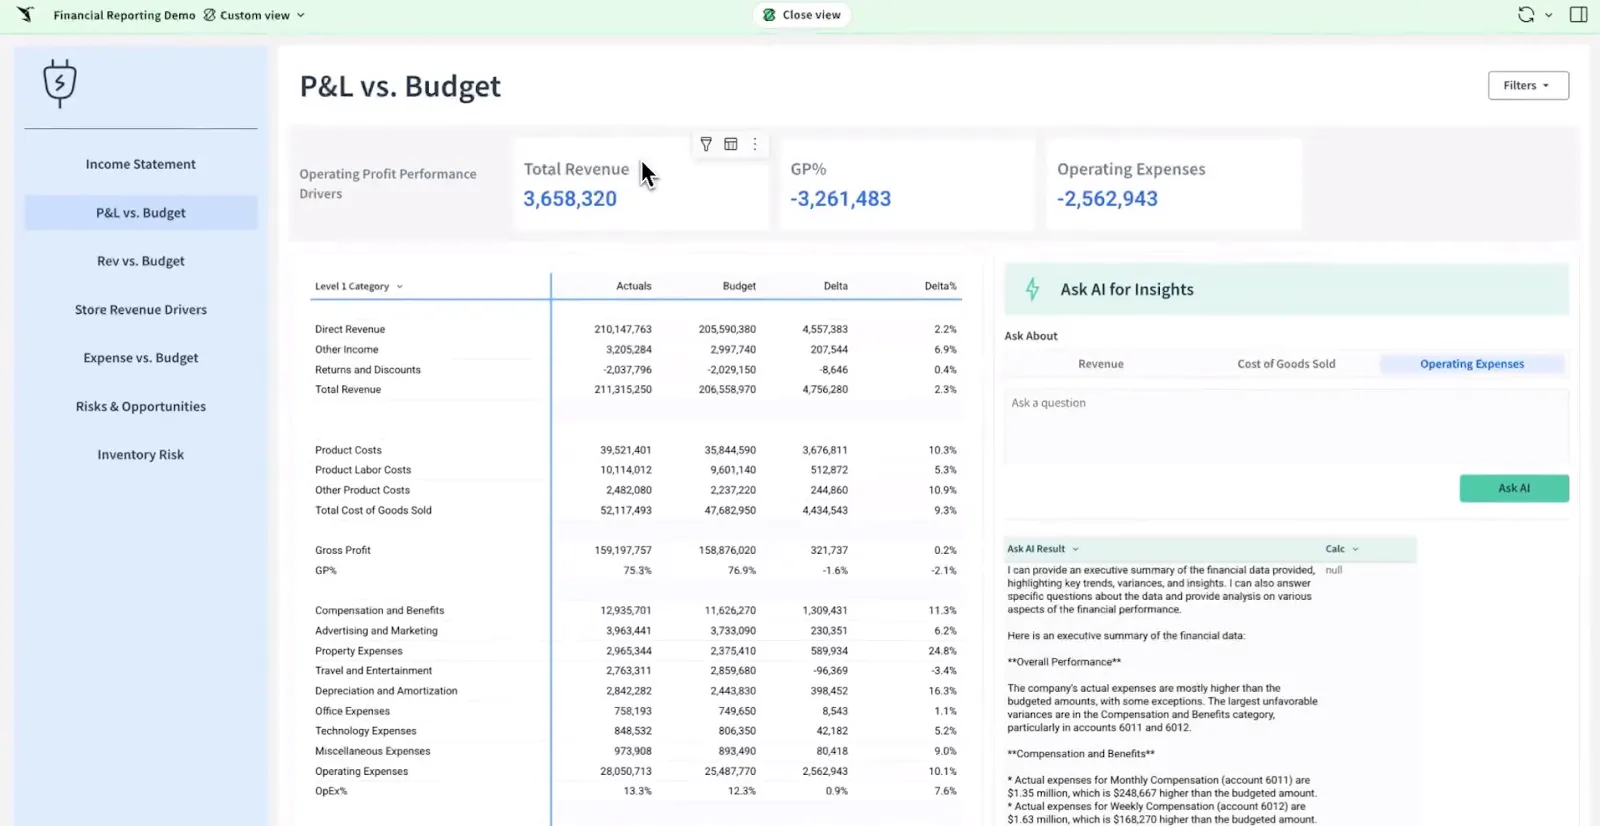
#3: Evidence
Best for: Technical data teams that want polished, version-controlled reports and data products built from SQL and markdown rather than a drag-and-drop dashboard builder.
Similar to: Lightdash, Apache Superset.
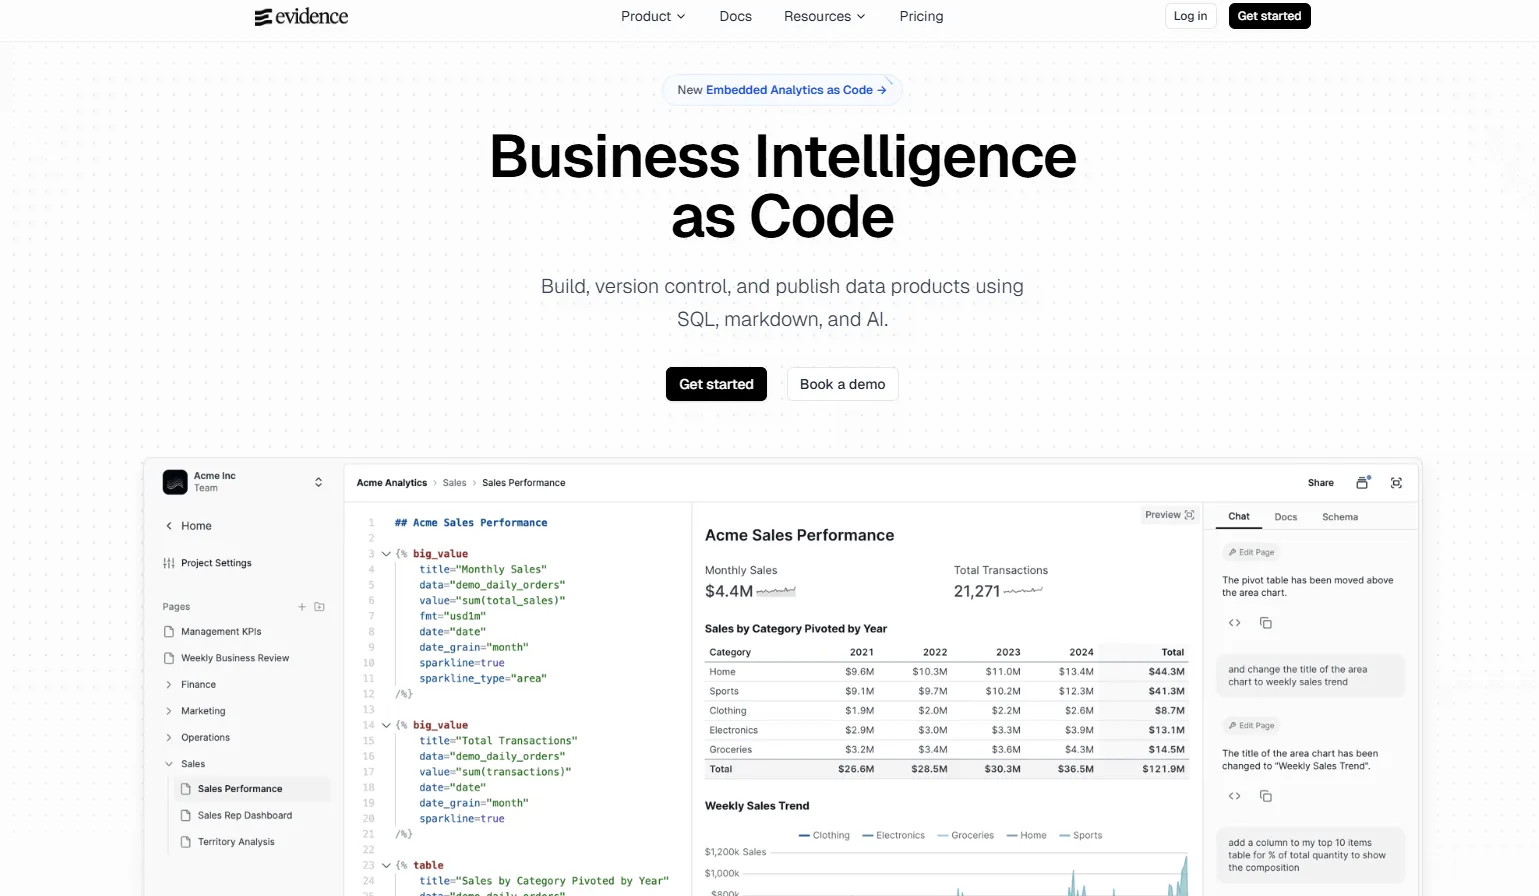
Evidence takes the BI-as-code idea Lightdash applies to dashboards and runs it further: every report, page, and visualization is written in SQL and markdown, version-controlled in Git, and deployed like a static site.
The tool is open-source under the MIT license, which makes it one of the most permissive options on this list, and it pairs well with teams who already think of their analytics as software they ship.
Evidence's top features
- SQL and markdown reports: Write queries inline with markdown to build interactive reports, dashboards, and full-page narratives in a single codebase.
- Git-native development workflow: Branch, review, and merge changes to analytics the same way your engineering team handles application code.
- Evidence Studio: Web-based IDE with schema-aware autocomplete, real-time previews, integrated git, and an AI assistant for scaffolding analyses from natural language.
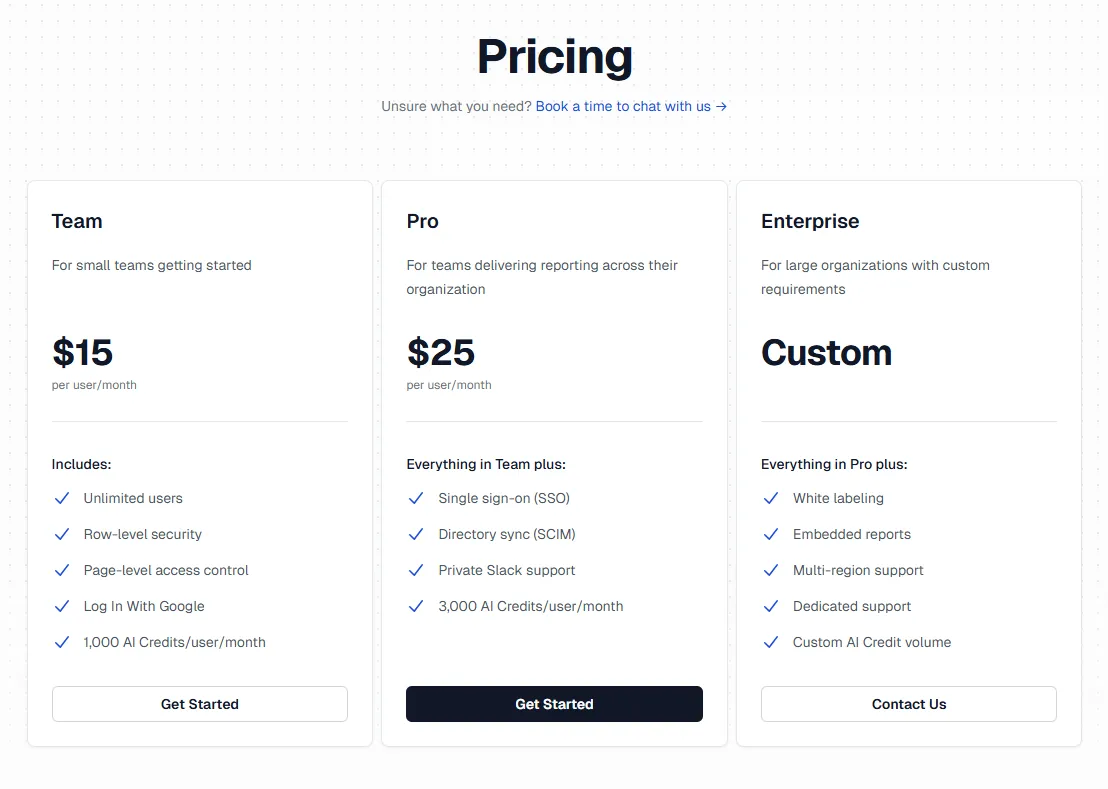
Evidence pricing
Evidence has an open-source self-hosted edition under the MIT license, plus a cloud product (Evidence Studio) for teams that want a hosted environment with collaboration, governance, and AI features.
- Open Source (self-hosted): Free, with the full Evidence framework, all data source connectors, and self-hosting on your own infrastructure or any static site host (Vercel, Netlify, etc.).
- Team (Cloud): $15 per user per month, with unlimited users, row-level security, page-level access control, Google login, and 1,000 AI credits per user per month.
- Pro (Cloud): $25 per user per month, adds SSO, SCIM directory sync, private Slack support, and 3,000 AI credits per user per month.
- Enterprise: Custom per-user pricing, adds white labeling, embedded reports, multi-region support, dedicated support, and custom AI credit volume.
Evidence pros and cons
✅ Polished, publication-quality reports out of the box, closer to a designed document than a typical BI dashboard.
✅ MIT license, so genuinely permissive for self-hosting and embedding.
✅ Git-based workflow is native, not bolted on.
❌ Requires SQL and basic markdown, so non-technical stakeholders most likely can't author reports.
Which Lightdash alternative actually fits how your team works?
That's the rundown of the 10 best Lightdash alternatives in 2026 across AI-powered analytics, warehouse-native BI, and open-source paths.
- Some of these tools double down on what Lightdash already does well: dbt-friendly modeling, governed self-service, and code-first workflows.
- Others take a different angle: visual exploration, spreadsheet-style analysis, or notebook-driven analytics for analyst teams.
But some of them follow the same broad pattern: you ask a question, you get a chart or short answer back, and you do the interpretation yourself.
Dot doesn't work like that.
Instead of asking your team to build and interpret another set of charts (or read another AI-generated answer), Dot does the analysis for you.
You ask a business question, and Dot investigates the data, explains what changed and why, writes up a clear narrative with recommendations, and shows its work with a full audit trail.
If your team wants written analysis instead of more dashboards, scheduled exec reports instead of weekly screenshot-stitching, and AI that does the work rather than just answering the question, Dot is one of the few platforms on this list built specifically for that outcome.
Here's what you'll get by signing up for Dot:
- Free plan with 300 one-time credits and full access to Pro features, so you can test on real warehouse data before paying anything.
- Automated executive business review reports delivered on your schedule, straight from your warehouse.
- Ad-hoc analysis through Slack, Microsoft Teams, email, or the web app, so insights show up where decisions actually happen.
- A Context Agent that maintains shared business definitions and prevents metric drift across teams.
- Full audit trail on every insight, with transparent links to the underlying SQL, Python logic, and datasets.
- Direct connections to Snowflake, BigQuery, Redshift, Databricks, Postgres, MySQL, and SQL Server.
- Reuse of your existing dbt, Looker, and Power BI metric definitions, so nothing has to be rebuilt.
- SOC 2 Type II compliance with role-based access and row-level security built in.
- Credit-based pricing that doesn't scale with headcount, so you can roll Dot out across the whole team.
➡️ Start for free or book a demo to talk to our team.
⚠️ Disclaimer: This article was last updated on 1st of May, 2026 and if there's any misinterpretation of the information, please contact us and we will fact check it.
Theo Tortorici
Theo writes about AI-powered analytics, data tools, and the future of business intelligence at Dot.