
10 Best AskEnola Alternatives & Competitors In 2026
I'll review the 10 best AskEnola alternatives and competitors in 2026 across AI data analyst platforms, established enterprise BI tools, and warehouse-native or self-serve BI solutions, covering features, pricing, and pros and cons.
TL;DR
- Dot offers the best AskEnola alternative in 2026 for founders, RevOps, finance, and data teams who want narrative answers delivered straight into Slack and Teams, scheduled executive business review reports, and a Context Agent that keeps business definitions consistent across the company.
- If you want established, enterprise-grade dashboarding and visual analytics at scale, Tableau, Microsoft Power BI, and Qlik Sense are the platforms most teams already know.
- For governed warehouse-native modeling, spreadsheet-style analysis on live data, or a lightweight open-source approach, Looker, Sigma, and Metabase are strong picks for technical teams that want more control over how analytics get built and shared.
What are the best AskEnola alternatives in 2026?
The best AskEnola alternatives in 2026 are: Dot, ThoughtSpot, and Supaboard.
Here's a breakdown:
Tool | Use Case | Price |
Dot | An AI data analyst that delivers narrative insights, scheduled executive reports, and full audit trails inside Slack, Teams, or the web app. | Free plan; Paid from $180/month. |
ThoughtSpot | Search-driven analytics with natural language and AI agents for self-service exploration. | From $25/user/month (annual). |
Supaboard | AI-built dashboards and natural-language analytics for fast no-code setup. | From $85/month. |
Domo | All-in-one cloud BI combining data ingestion, dashboards, automation, and AI agents. | Custom pricing (30-day free trial). |
Tableau | Advanced visual analytics with Tableau Next agentic capabilities for enterprise reporting. | From $75/creator/month. |
Microsoft Power BI | Standardized dashboards and self-service reporting inside the Microsoft ecosystem. | Free plan; Pro from $14/user/month. |
Qlik Sense | Associative analytics engine for free-form exploration of complex datasets. | Custom pricing. |
Looker | Governed, warehouse-native BI built around the LookML semantic layer. | Custom pricing (annual). |
Sigma | Spreadsheet-style analytics on live warehouse data for finance and ops teams. | Custom pricing. |
Metabase | Open-source BI for fast self-service analytics with optional embedded use cases. | Free (Open Source); Cloud from $100/month. |
What are the best AI data analyst and conversational analytics platforms?
If your team wants answers from data without building or maintaining dashboards, AI data analyst tools take a fundamentally different approach to BI.
Instead of asking you to explore charts and draw conclusions on your own, these platforms use natural language and structured analytical reasoning to surface insights, explain what's behind them, and recommend a next step.
➡️ Want a wider view of this category? Check out our guide to thebest AI data analyst software.
Here are the best AI data analyst and conversational analytics platforms in 2026:
#1: Dot
Dot is the best AskEnola alternative in 2026 for data teams who want to ask questions directly in Slack or Teams and get clear, narrative answers with recommendations in minutes.
However, our solution is not one of these platforms that either give you a slightly smarter dashboard or a chatbot wrapped around a SQL query.
Dot is built around the idea that the analysis itself can be handled by the system, so business stakeholders get straight answers in minutes, and the data team gets back the hours they used to spend grinding through repetitive ad-hoc requests.
Let's go through the features that make Dot a strong pick for AskEnola alternative shoppers: 👇
Ad-hoc business analysis inside Slack and Teams
Most people on a business team don't sit in a BI tool all day. They live in Slack, Teams, or email, and that's where their questions surface in the first place.
Dot meets them there.
A CRO three days out from a board meeting can type "Where did pipeline coverage land against the Q1 plan, and what's driving the gap in EMEA?" directly into a Slack channel, and Dot returns a structured answer.
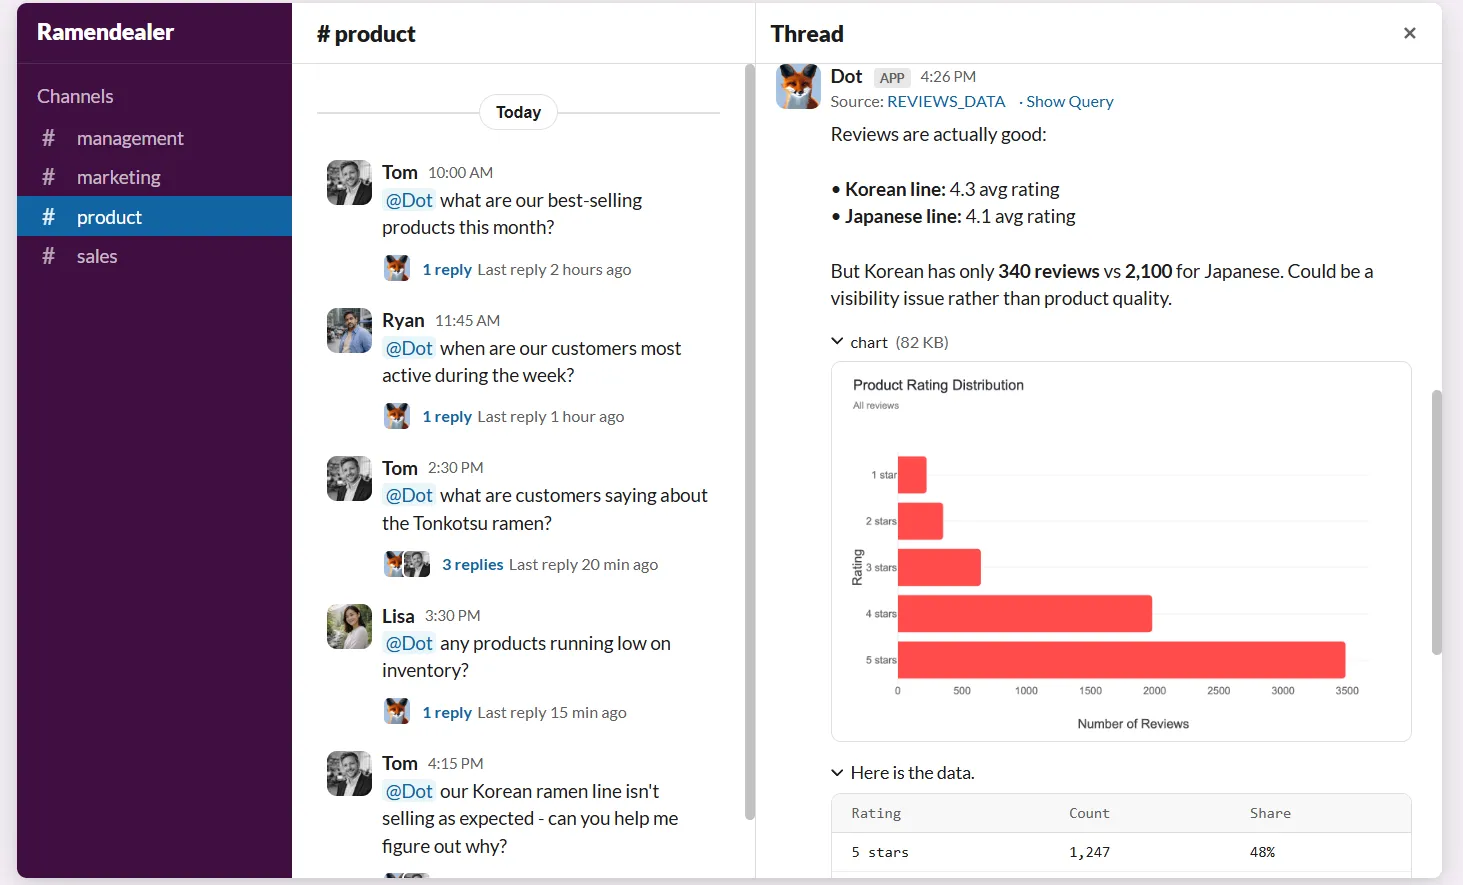
The response covers what the data shows, the segments and regions driving the result, and the SQL that produced the numbers.
So instead of routing through a separate tool or waiting on the data team, the analysis lands inside the same thread where the decision is being discussed.
Scheduled executive business review reports
Recurring reports are quietly one of the biggest time drains on a data team.
Pull the queries, drop the charts into slides, write a summary, send it out, and start the same loop again next Monday.
Dot replaces that loop with scheduled PowerPoint reports that pull live data straight from your warehouse and write the narrative for you.
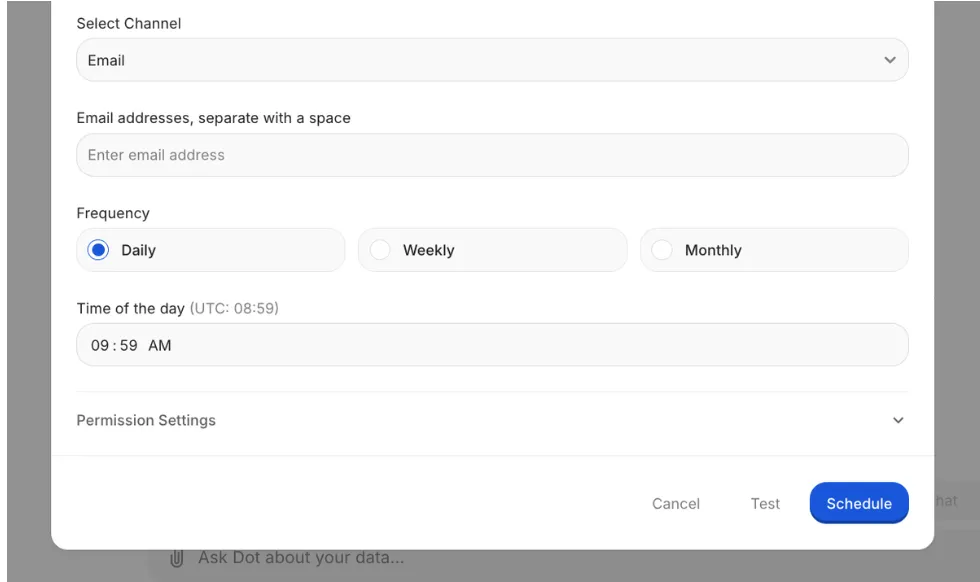
But it's not a chart screenshot pasted into a deck.
It's a written analysis covering what happened during the period, how it compares to the previous one, where the trend lines are pointing, and which areas the leadership team should focus on next.
The report ships out on whatever cadence you set, and the data team gets back the hours they used to spend rebuilding the same deck every week.
Context Agent for shared business definitions
Here's a pattern that comes up at almost any growth-stage company with more than one source of truth.
Marketing reports MQL conversion at 14%, sales reports it at 19%, the board deck shows 22%, and nobody can trace the gap back to a single, agreed-upon definition.
Dot's Context Agent fixes this in the background.
It reads through your existing dbt models, data catalog, Looker definitions, and Confluence docs, then assembles a shared business context layer that every Dot answer references.
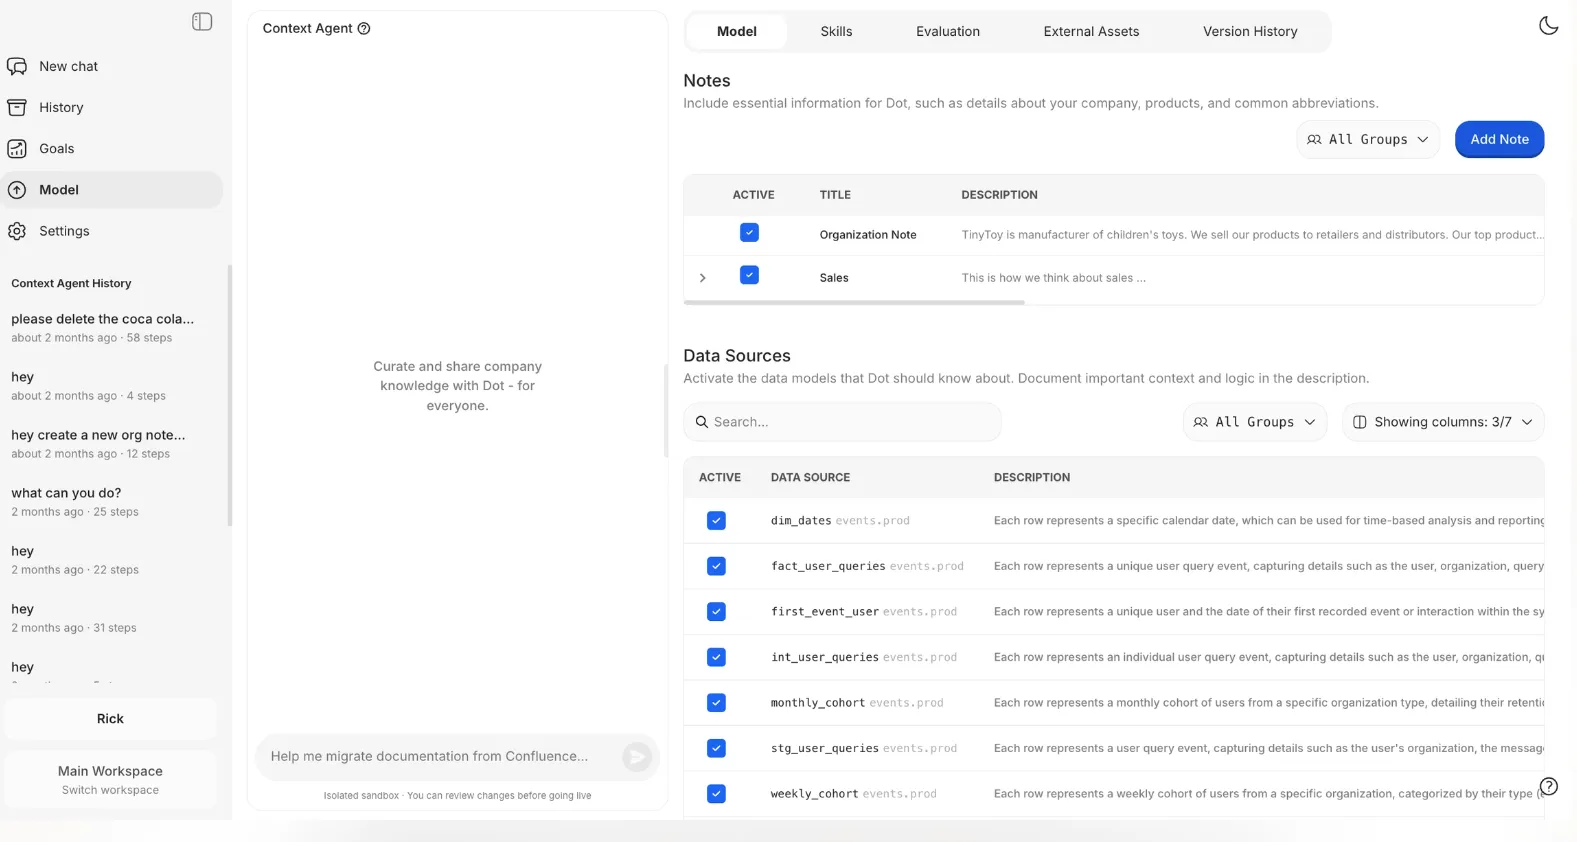
The result is that the answer your CFO gets at 6 AM Monday lines up with the answer your analyst validated Friday afternoon, even when they ask slightly different questions.
Full audit trail on every insight
Most BI tools assume the chart you're looking at is correct.
The harder part is being able to prove it on the spot.
If a finance lead asks where the 89% net revenue retention figure came from, and there's no way to trace it back to the exact query, the table joins, and the filter logic, the number stops carrying weight in a board conversation.
Every Dot answer comes with footnotes. You get clickable links to the SQL Dot ran, the Python it used for any heavier calculations, and the source datasets it pulled from.
Anyone on the team can click into the underlying logic, validate it, or correct it, which changes the way teams talk about data.
It stops being "the dashboard says so" and starts being "here's exactly how we got to this number."
Dot's integrations
Dot is built to fit on top of the stack you already run, without asking your team to swap anything out.
It pulls data from Snowflake, BigQuery, Redshift, Databricks, Postgres, MySQL, and SQL Server.
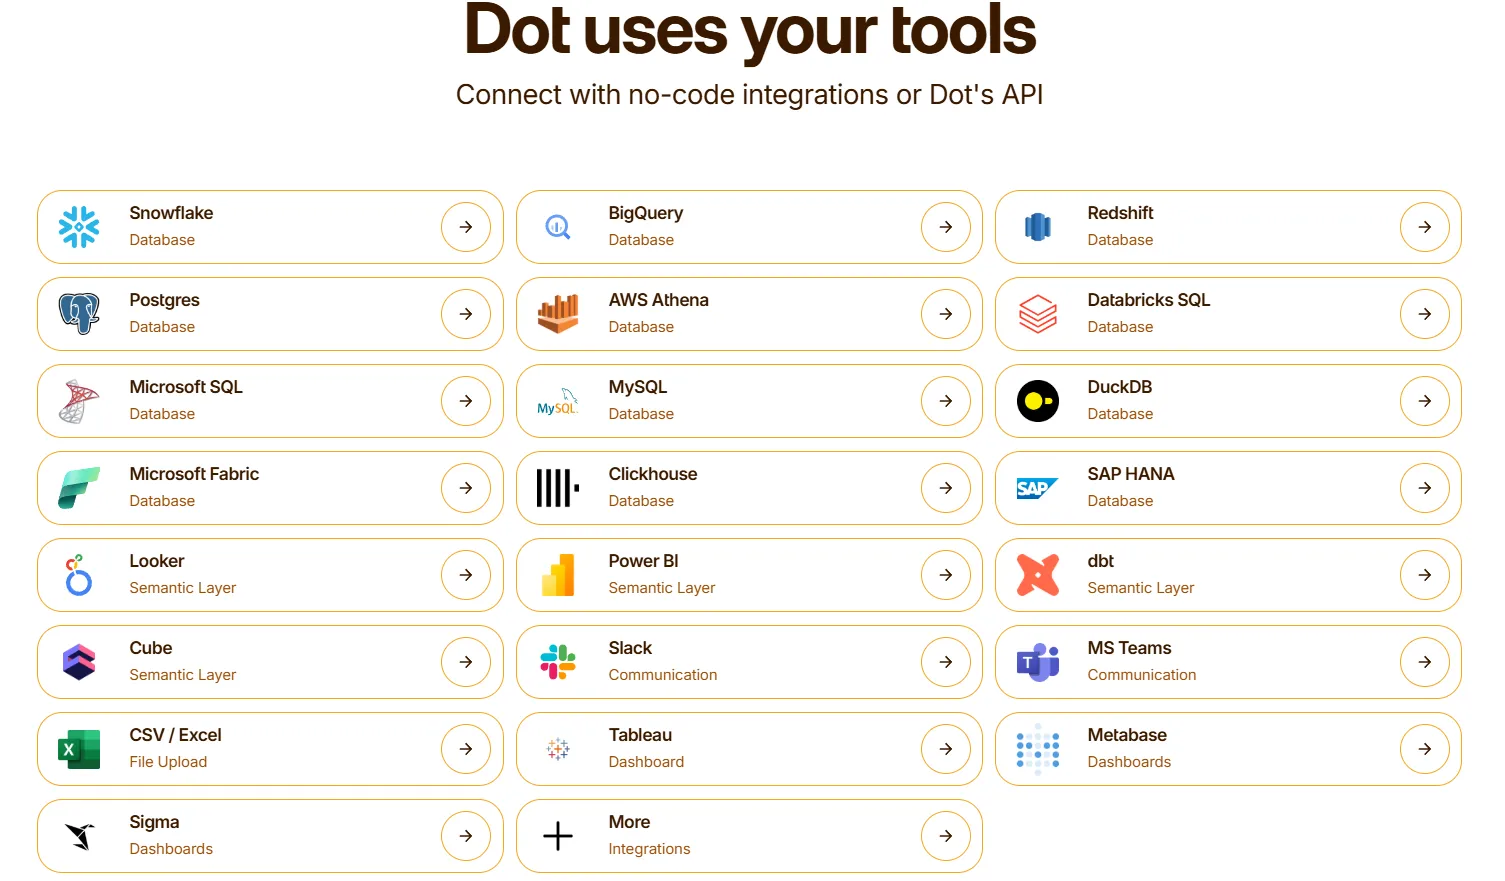
For semantic logic, Dot reuses what's already defined in dbt, Looker, Power BI semantic models, and Cube, so the metrics already governed in those layers carry through automatically.
On the delivery side, answers can land in Slack, Microsoft Teams, email, or the web app, whichever channel your team is most likely to actually open.
What makes Dot different from AskEnola
AskEnola is a web-based command center built around BADIR™, a five-step framework optimized for finance and revenue reporting like bookings, MRR retention, and the monthly CFO package.
Dot is built differently on three fronts.
- First, Dot delivers answers into Slack, Microsoft Teams, and email, so questions get answered in the threads where decisions are already happening, not inside a separate UI.
- Second, every Dot answer ships with clickable footnotes to the exact SQL, Python, and source datasets behind the number, so a finance lead can verify a figure in seconds rather than trust the framework.
- Third, Dot reuses the semantic models your team already maintains in dbt, Looker, Power BI, and Cube, on top of a wider warehouse list that includes Databricks, Postgres, SQL Server, ClickHouse, and Oracle.
That breadth shows up in customer outcomes like Duolingo saving 12,000+ analyst hours, Choco hitting 18x ROI, and Emerge cutting analysis turnaround by 99%.
It also shows up in benchmarks: on the DABStep test of 450+ financial analysis tasks designed by Adyen and HuggingFace, Dot scored 96% accuracy in roughly 60 seconds per question, against 62% for trained human analysts taking 3+ hours.
Dot pricing
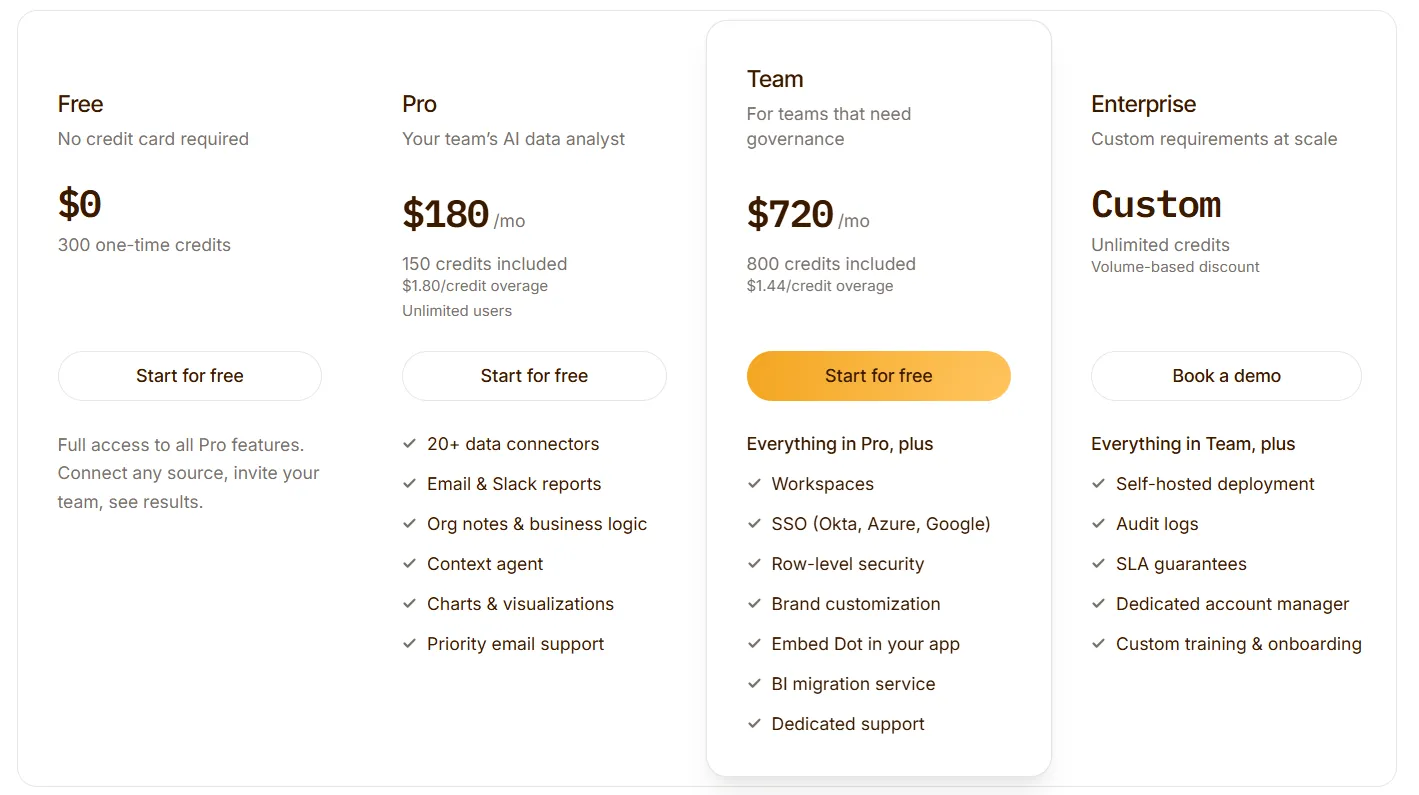
Dot has a free plan with 300 one-time credits and full access to Pro features, so you can test the platform before committing to anything.
There are three paid plans:
- Pro: $180/month, includes 150 credits per month, $1.80 per credit overage, and unlimited users.
- Team: $720/month, includes 800 credits per month, $1.44 per credit overage, SSO, row-level security, embedded analytics, BI migration support, and dedicated support.
- Enterprise: Custom pricing, includes unlimited credits, volume discounts, self-hosted deployment, audit logs, SLA, and a dedicated account manager.
➡️ Annual billing saves 10% across all paid plans.
Dot pros and cons
✅ Output is structured written analysis with recommendations, not a chart that needs interpreting.
✅ Recurring PowerPoint review reports remove a meaningful chunk of weekly slide-building from the data team's plate.
✅ Footnotes on every answer point to the exact SQL run, Python used, and datasets pulled.
✅ Picks up your existing dbt, Looker, and Power BI semantic definitions instead of asking you to model again from scratch.
✅ Credit-based pricing scales with usage rather than seat count.
❌ Requires a modern data warehouse on the back end.
#2: ThoughtSpot
Best for: Non-technical business users who'd rather type a question than navigate a dashboard.
Similar to: Dot, Supaboard.
Search is the entry point for ThoughtSpot. Users type questions in plain English, and the platform returns instant charts, tables, and explanations.
Teams that have outgrown other AI data analysts often land here when they want enterprise-grade governance and AI agents on top of search.
ThoughtSpot's top features
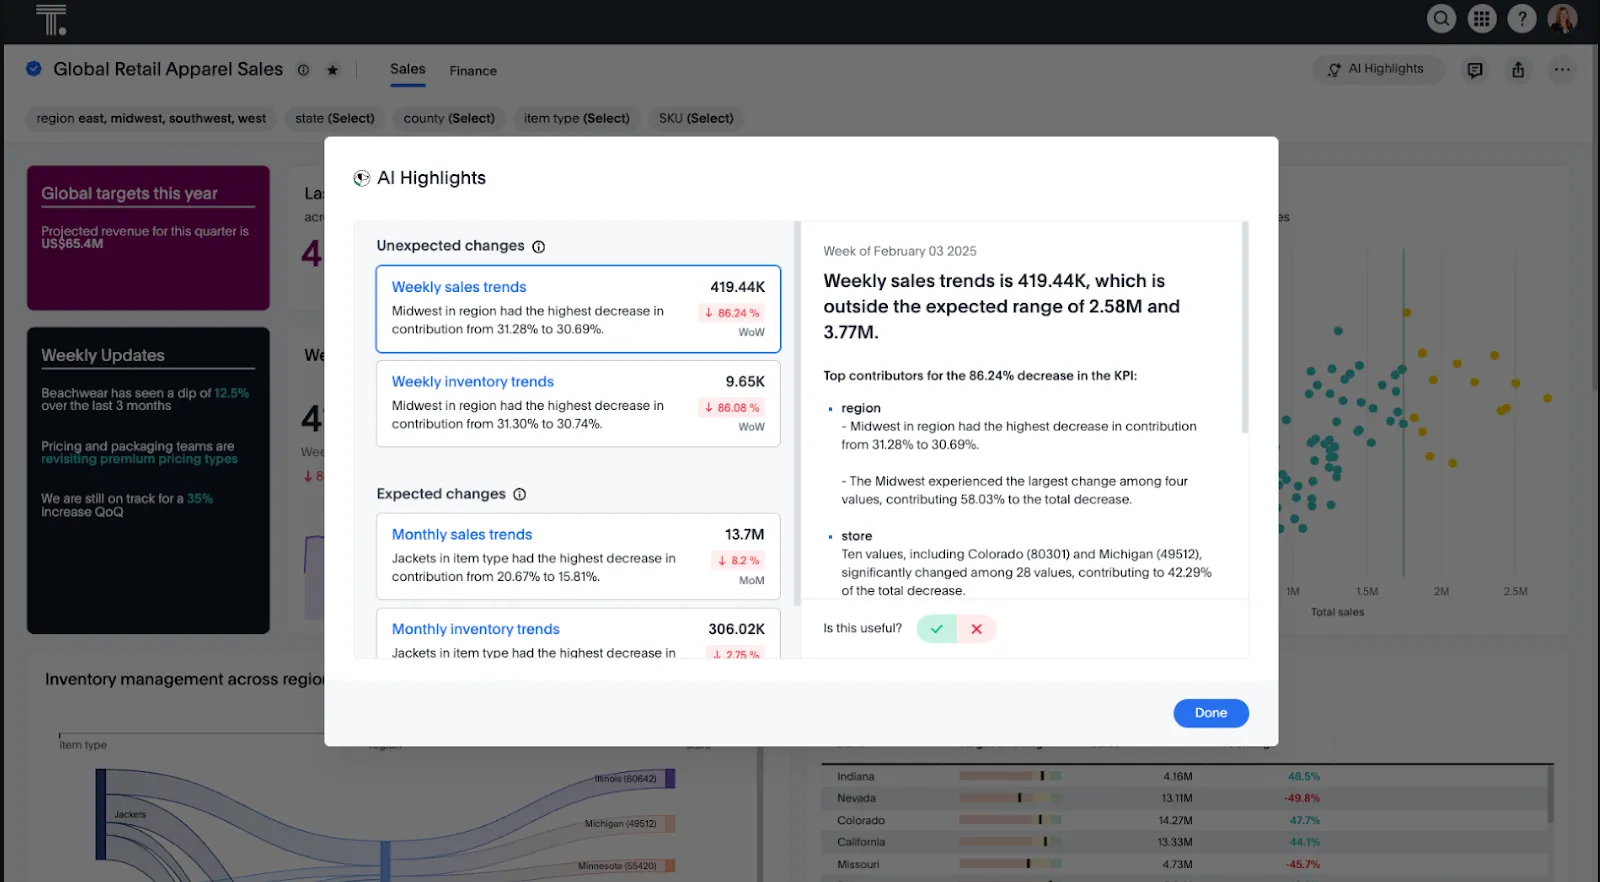
- Search-style analytics: Type business questions as natural English and receive charts, tables, and explanations back without writing a query.
- Spotter AI agent: An AI analyst that proactively flags trends, anomalies, and pattern shifts across the data sources you've connected.
- Embedded analytics: Plug search-style analytics into your own SaaS product or internal applications, with theming and SDK customization.
ThoughtSpot pricing
ThoughtSpot offers two separate products: ThoughtSpot Analytics for internal BI and ThoughtSpot Embedded for building analytics into applications - each with flexible pricing depending on scale and usage:
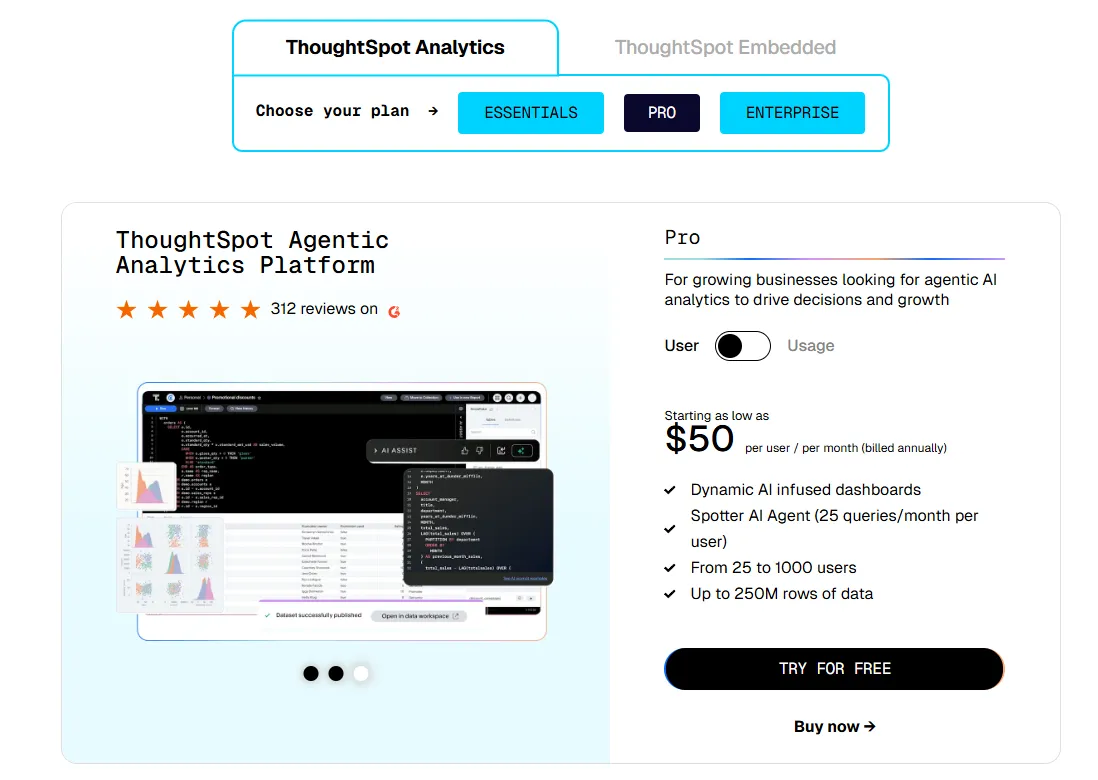
- ThoughtSpot Analytics:
- Essentials: From $25 per user per month (billed annually), for teams of 5-50 users, includes dynamic interactive dashboards and AI-powered insights and supports up to 25M rows of data.
- Pro (per user pricing): From $50 per user per month (billed annually), for 25–1,000 users, includes everything in Essentials, plus AI-infused dashboards and Spotter AI Agent (25 queries per user/month), and supports up to 250M rows of data.
- Pro (usage-based): From $0.10 per query, includes everything in Pro per user, and adds Analyst Studio.
- Enterprise (user or usage-based): Custom pricing, includes everything in Pro, plus unlimited users and data.
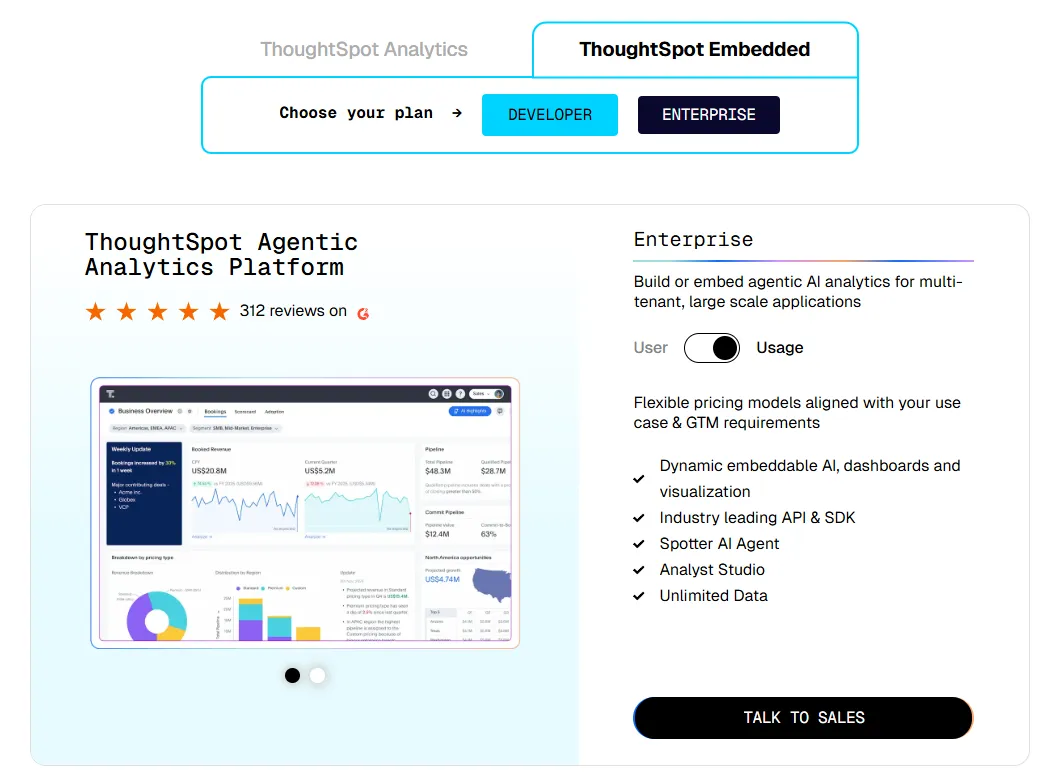
- ThoughtSpot Embedded:
- Developer: Free for 1 year, includes embeddable AI analytics, dashboards, and visualizations, APIs and SDKs, up to 10 users and 25M rows of data.
- Enterprise (user-based): Custom pricing, includes everything in Developer, plus unlimited data.
- Enterprise (usage-based): Custom pricing, everything in Enterprise, plus Spotter AI Agent and Analyst Studio.
ThoughtSpot pros and cons
✅ Lower friction for business users than most legacy BI platforms.
✅ The Spotter agent shortens the gap between asking a question and getting an interpretive answer.
❌ Two pricing structures (per user vs. usage-based) can get confusing at scale.
#3: Supaboard
Best for: Smaller teams that need analytics up and running without spending weeks on data modeling.
Similar to: Dot, ThoughtSpot, Basedash.
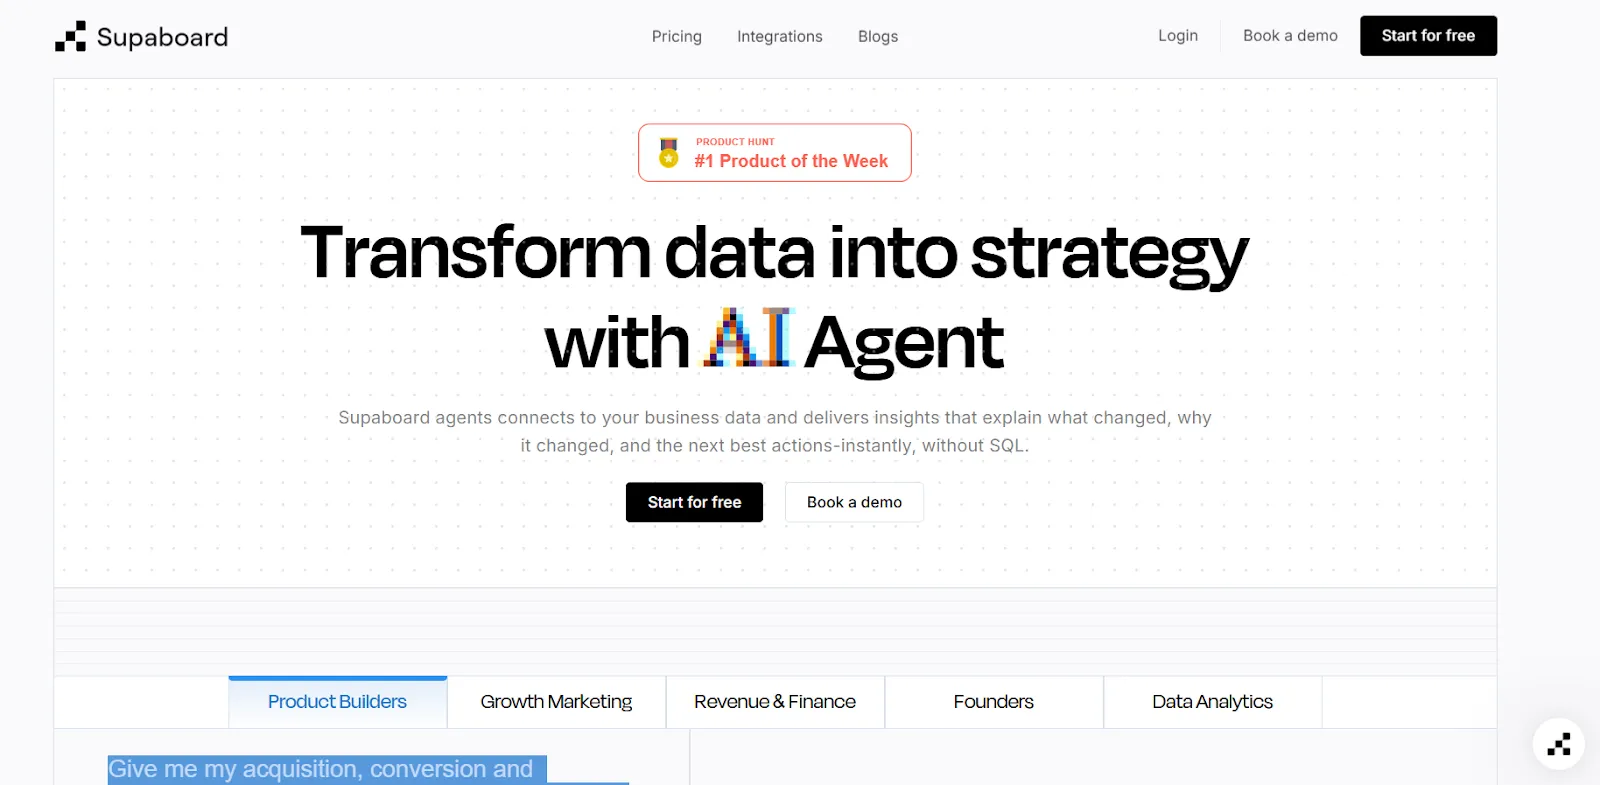
Plug Supaboard into your data sources and it auto-generates dashboards, KPIs, and insights, no SQL or heavy setup required.
Speed and accessibility for business users put it in roughly the same neighborhood as some of the best AI data analyst tools on the market.
Supaboard's top features
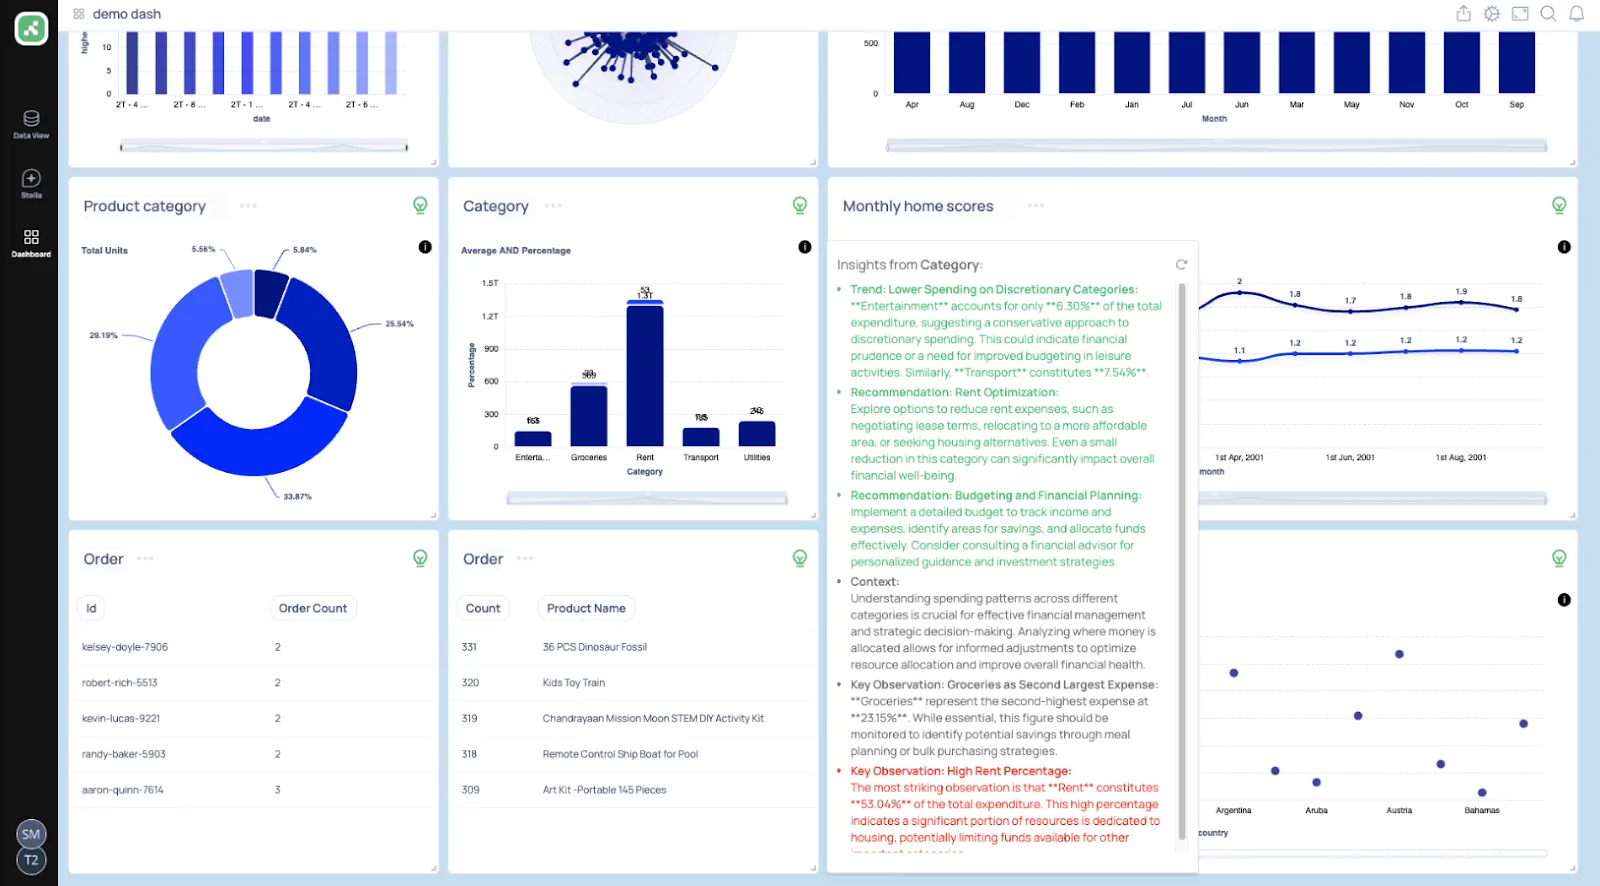
- Trainable AI agents: Configure AI agents on your business logic, KPIs, and SLAs so the insights they return reflect how your company actually thinks about data.
- Natural-language data chat: Drop everyday-language questions into the chat and receive charts, KPIs, written explanations, and follow-up suggestions.
- AI-generated real-time dashboards: Describe the dashboard you need and Supaboard assembles it from interactive panels and KPIs that refresh against live data.
Supaboard pricing
Three plans cover Supaboard's pricing:
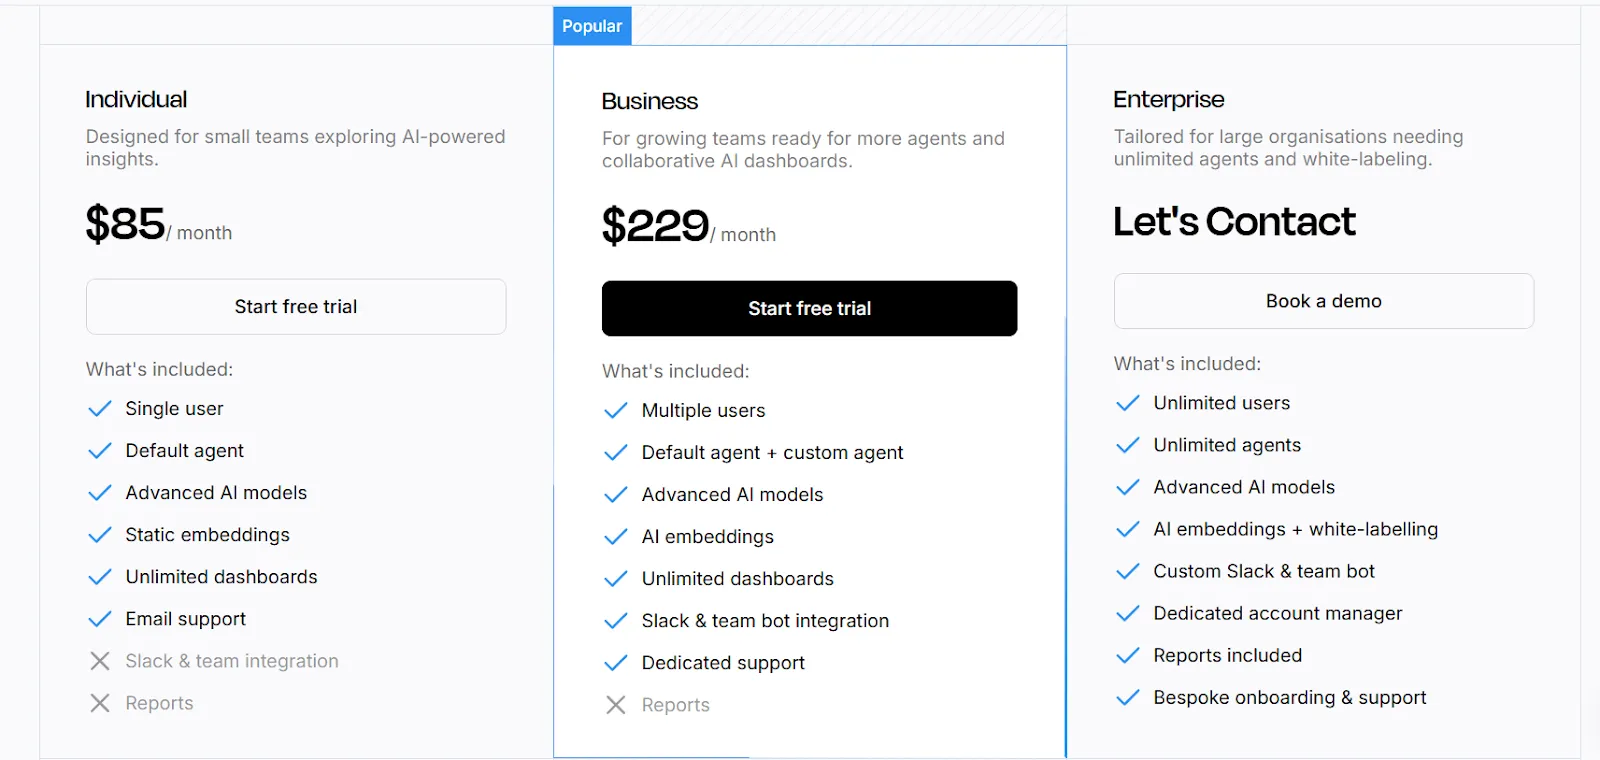
- Individual: $85/month, includes a single user, default AI agent, advanced AI models, static embeddings, unlimited dashboards, and email support.
- Business: $229/month, includes everything in Individual, plus multiple users, custom agents, AI embeddings, Slack and team bot integration, and dedicated support.
- Enterprise: Custom pricing, includes everything in Business, plus unlimited users and agents, AI embeddings with white-labeling, custom Slack and team bot integrations, a dedicated account manager, reports, and bespoke onboarding.
Supaboard pros and cons
✅ Quick to wire up across CSVs, KPI files, and standard data sources.
✅ Plain-language querying makes the platform usable by people outside the data team.
❌ It's a relatively newer entrant, so the community and integration ecosystem are still growing.
#4: Domo
Best for: Mid-market and enterprise teams looking to consolidate data integration, dashboards, automation, and AI under one platform.
Similar to: Qlik Sense, Power BI.
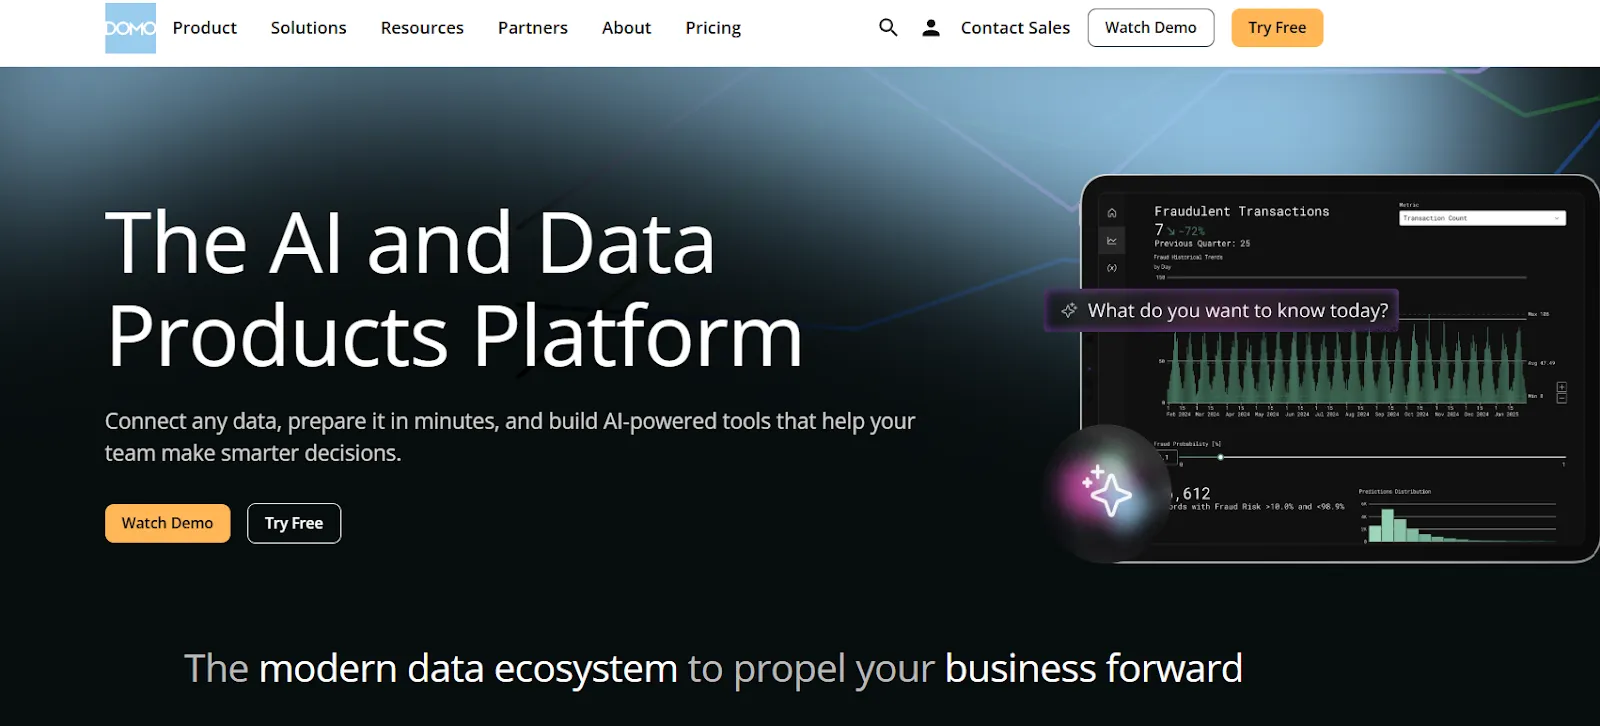
End-to-end is the angle here. Domo connects across a wide range of data sources and turns them into interactive, real-time dashboards.
Pairing reporting with automation and AI agents under one roof puts it in a different category from other AI tools likeTextQL orMindsDB.
Domo's top features
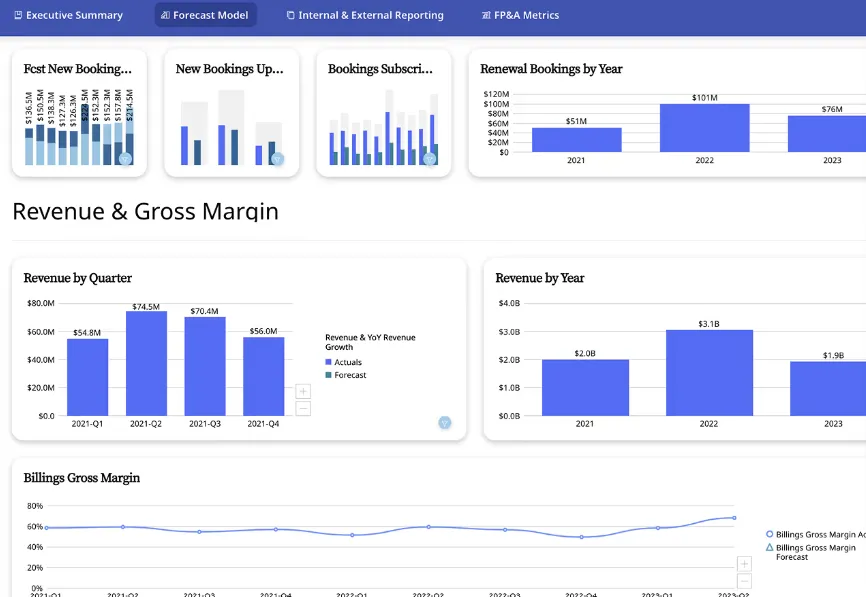
- Real-time dashboards: Assemble live dashboards that are easy to share inside the company or embed inside a product or partner portal.
- No-code data apps: Construct workflow-specific apps on top of your data without writing code or pulling engineering hours.
- Conversational AI and agents: Ask plain-English questions, surface emerging patterns, and let AI agents take automated actions tied to dashboard alerts.
Domo pricing
Domo has one paid plan and a free trial:
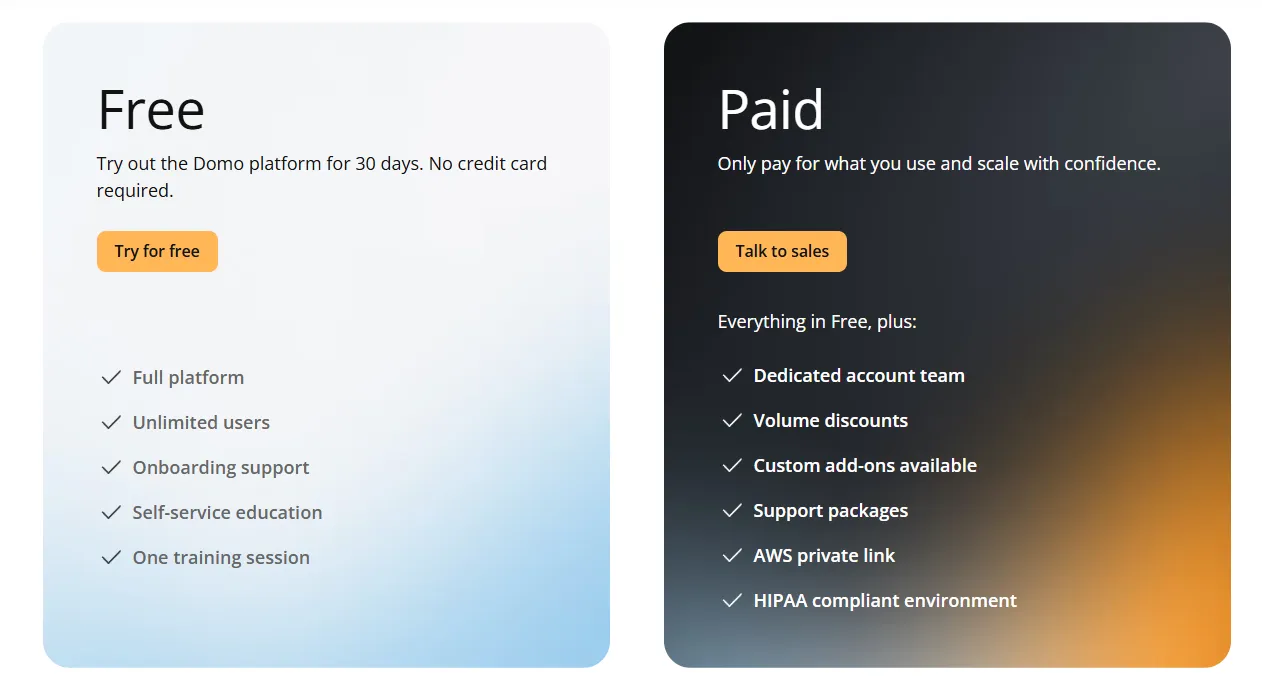
- Free trial: 30 days, no credit card required, includes unlimited users, full platform access, onboarding support, self-service education, and one guided training session.
- Paid plan: Usage-based pricing designed to scale as your analytics needs grow, includes everything in the trial and adds a dedicated account team, volume discounts, custom add-ons, and support packages.
Domo pros and cons
✅ Reasonably approachable for teams that mostly work inside dashboards.
✅ Wide connector library that simplifies pulling in data from across the SaaS stack.
❌ Pricing is not disclosed. We covered affordable options in our Domo alternatives breakdown.
What are the best established enterprise BI tools?
If your organization wants well-known, battle-tested dashboarding and visualization at scale, established enterprise BI platforms are still the most familiar choice.
They've been around the longest, have the largest user communities, and handle the kind of cross-department, multi-region reporting that smaller tools sometimes can't match.
➡️ For a wider view of this category, check out my guide to thebest BI tools for data visualization.
These are the established enterprise BI platforms to evaluate as AskEnola alternatives in 2026:
#1: Tableau
Best for: Enterprise data teams that run deep visual analytics across complex datasets, with cloud or self-hosted deployment.
Similar to: Looker, Qlik Sense.

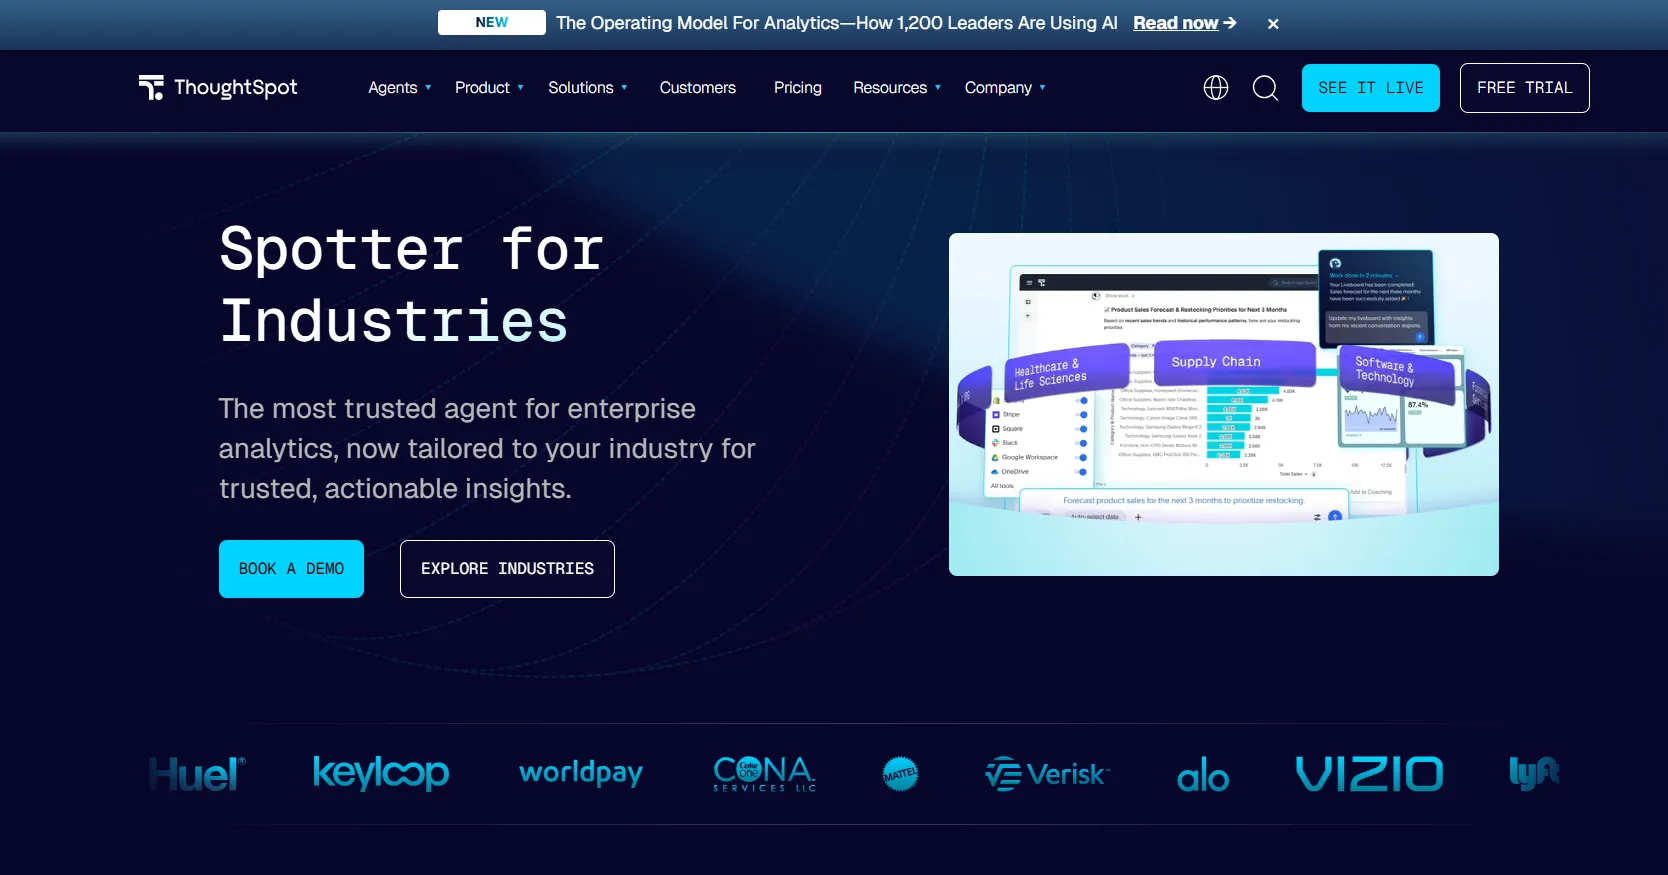
Tableau has been around longer than most BI tools and has built its reputation on drag-and-drop visual exploration and interactive dashboards.
The platform is now expanding through Tableau Next, which layers Agentforce-powered agentic analytics and natural-language access on top of the classic exploration experience.
Tableau's top features
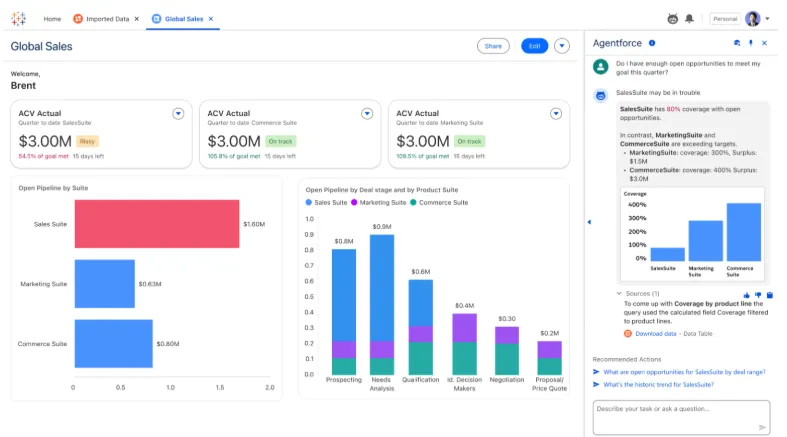
- VizQL visual analytics: Drag and drop fields onto a canvas to assemble interactive dashboards, with drill-down and filtering across high-volume datasets.
- Tableau Next agentic analytics: AI agents handle natural-language questions, deliver personalized insights, and run actions inside Slack and Salesforce workflows.
- Enterprise governance: Reusable metrics defined through Tableau Pulse, central governance policies, and access controls designed for organizations rolling analytics out widely.
- Multiple deployment options: Choose between Tableau Cloud, Tableau Server (self-hosted), or Tableau Next, depending on whether you need managed cloud or on-prem control.
Tableau pricing
Tableau uses per-user, per-month pricing, with separate plans depending on whether you deploy Tableau in the cloud, on your own servers, or as part of its newer AI-driven offering:
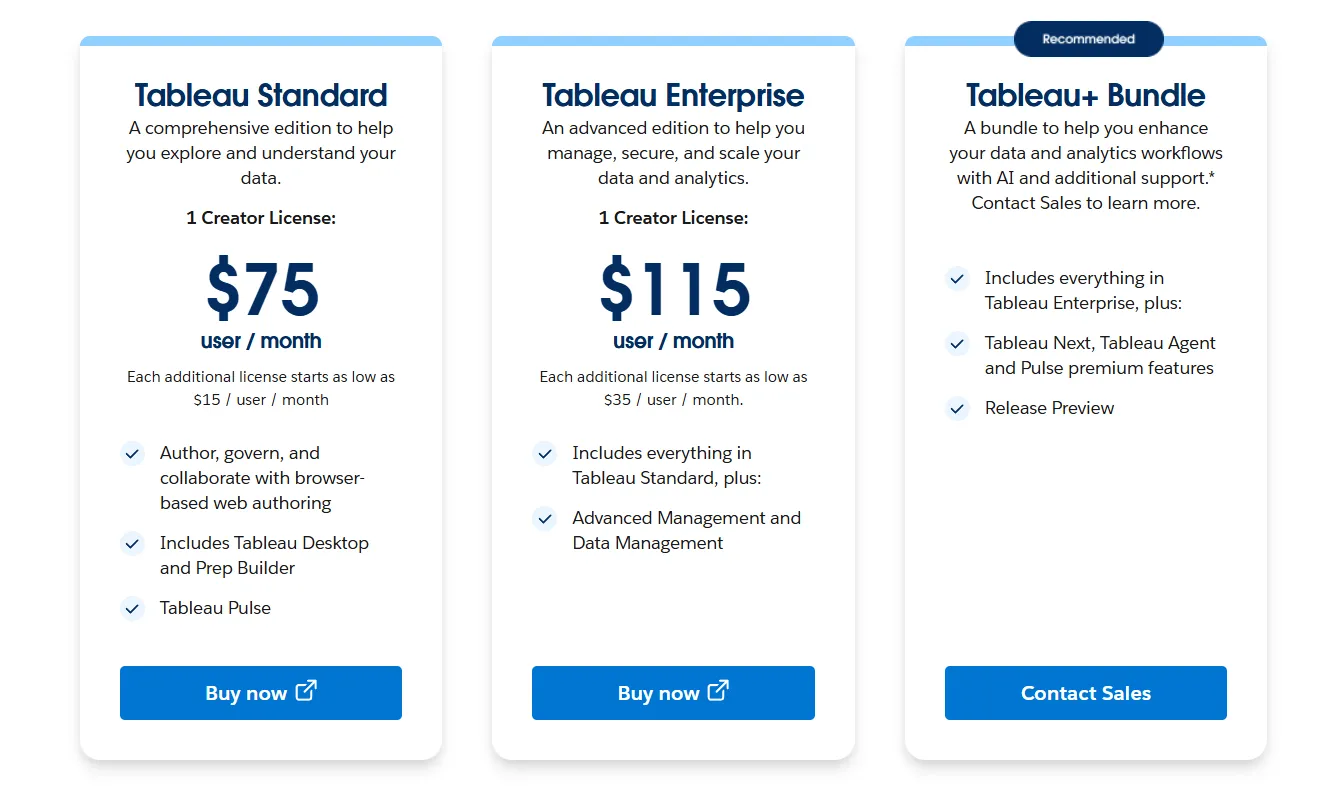
- Tableau Cloud has three pricing plans:
- Tableau Standard: $75 per 1 creator per month, with each additional license from $15 per user/month, includes browser-based authoring and collaboration, Tableau Desktop and Prep Builder, Tableau Pulse for metrics and insights.
- Tableau Enterprise: $115 per 1 creator per month, with each additional license from $35 per user/month, includes everything in Standard, plus Advanced Management and Data Management for governance and scale.
- Tableau+ Bundle (Cloud + AI): Custom pricing, includes everything in Tableau Enterprise, plus Tableau Next, Tableau Agent, and Pulse premium features, with access to release previews and early AI capabilities.
- Tableau Server has two pricing plans:
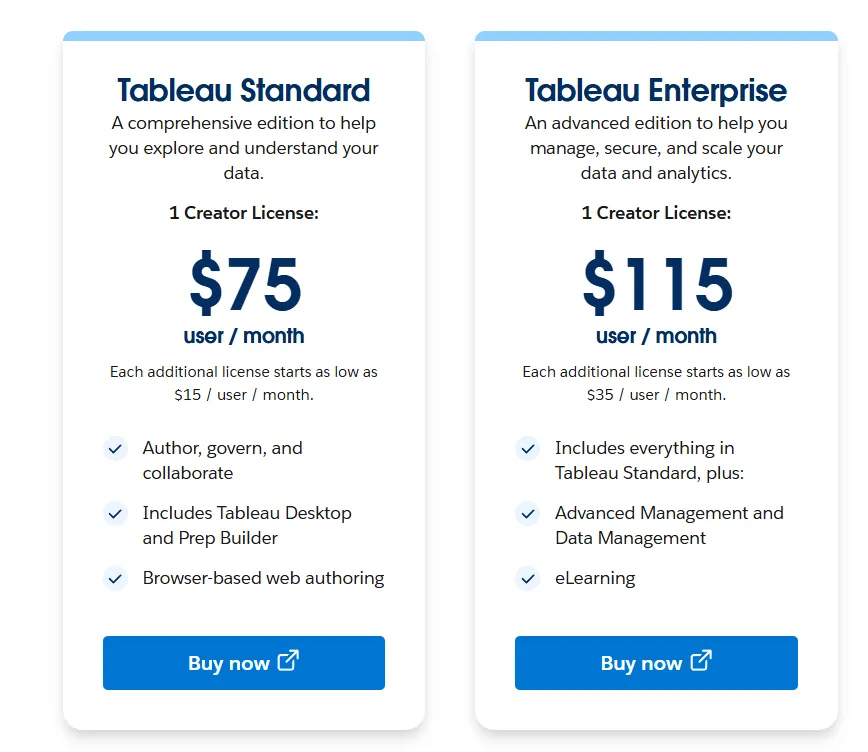
- Tableau Standard: $75 per 1 creator per month, with each additional license from $15 per user/month, includes authoring, governance, and collaboration and Tableau Desktop and Prep Builder.
- Tableau Enterprise: $115 per 1 creator per month, with each additional license from $35 per user/month, includes everything in Standard, plus Advanced Management, Data Management, and eLearning.
- Tableau Next (agentic analytics): Requires an annual contract, includes agentic analytics via Agentforce, Tableau Semantics, Tableau Pulse (including premium), and Data 360.
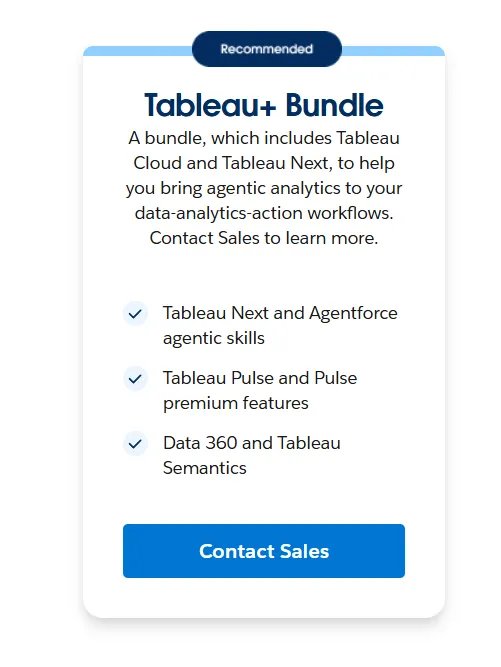
Tableau pros and cons
✅ Visualization quality and analytical depth are among the strongest in the BI category.
✅ Drag-and-drop authoring keeps the platform usable even without much code.
✅ Mature community, deep training resources, and an established partner ecosystem.
❌ Per-user pricing can scale fast for organizations rolling out broadly.
#2: Microsoft Power BI
Best for: Microsoft-first organizations rolling out standardized dashboards and self-service reporting across departments.
Similar to: Tableau, Looker.
On Power BI, you build interactive dashboards, paginated reports, and visualizations on top of structured data sources.
Deep ties into Excel, Teams, SharePoint, and the rest of the Microsoft work stack are a big part of why it's so widely adopted across Microsoft-first organizations.
Power BI's top features
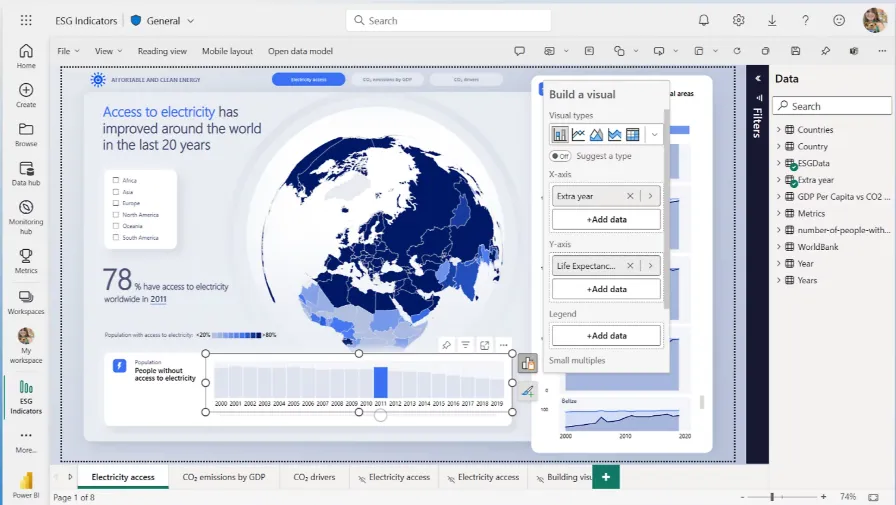
- Interactive dashboards and reports: Layer charts, filters, and drill-down paths to investigate data across cross-functional teams.
- Governance built on Microsoft identity: Role-based access, row-level security, sensitivity labels, and Microsoft Entra ID for managing who sees what at scale.
- AI-assisted reporting: Copilot, quick insights, forecasting, and anomaly detection bring pattern recognition into the dashboard authoring flow.
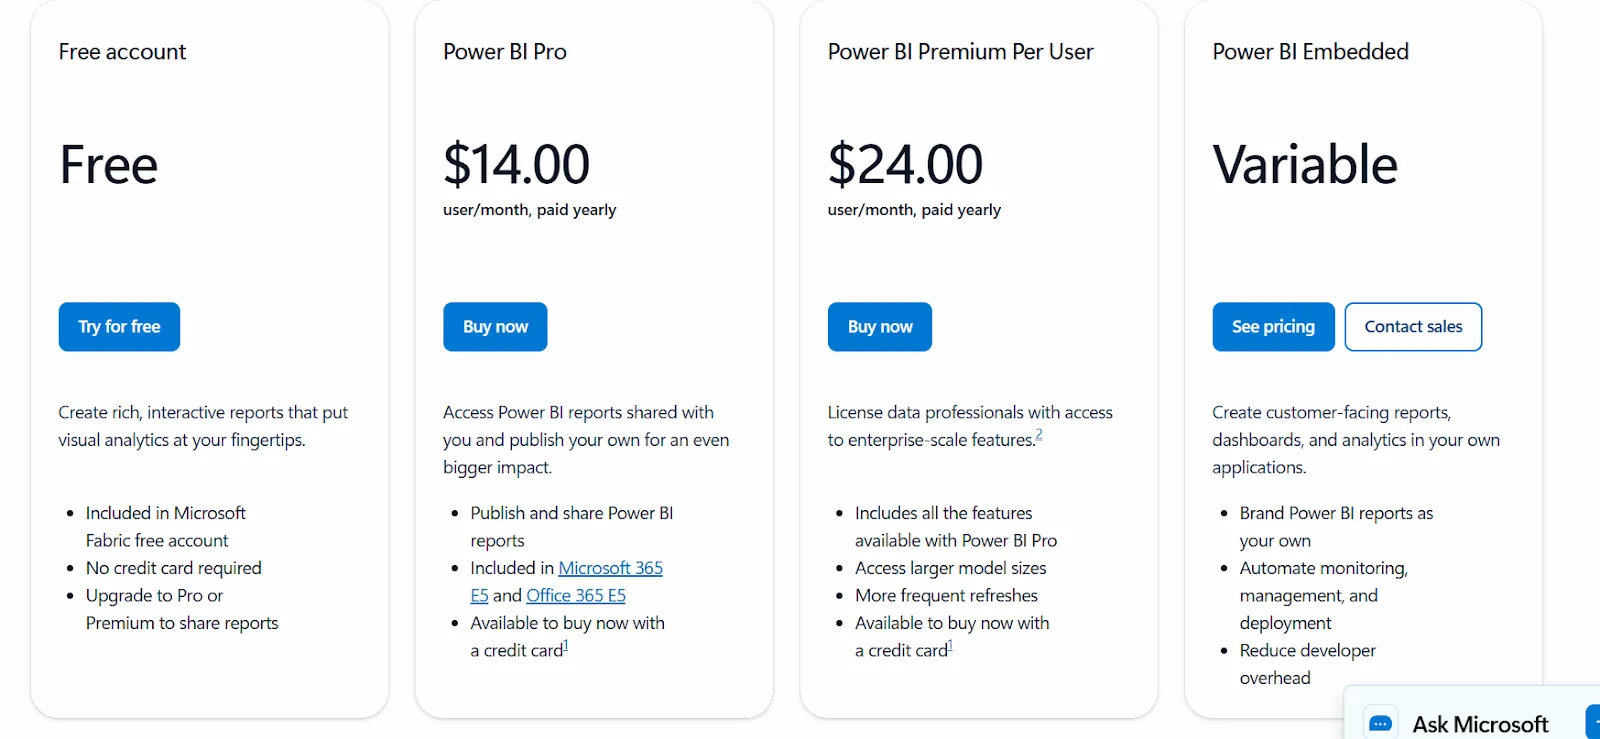
Power BI pricing
Per-user and capacity-based licensing structures the Power BI lineup:
- Free: Build dashboards and reports for individual use, with no team sharing or collaboration features.
- Power BI Pro: $14/user/month, covers report publishing, sharing, workspace collaboration, and embedding in Teams or SharePoint.
- Power BI Premium Per User: $24/user/month, expands model size limits, refresh frequency, paginated reporting, and AI capabilities.
- Power BI Embedded: Custom pricing for analytics embedded in your own customer-facing apps.
Power BI pros and cons
✅ Solid dashboard and visualization output for both finance reports and operational use cases.
✅ Tight integration with the rest of the Microsoft work stack.
✅ Relatively low entry price at $14/user/month for individual contributors.
❌ For beginners, the learning curve can feel steep, particularly when you start working with data modeling and DAX formulas, according to a G2 review.
#3: Qlik Sense
Best for: Regulated industries and on-prem-first IT shops doing free-form exploration across complex datasets.
Similar to: Tableau, Power BI.
Qlik Sense runs on an associative analytics engine, which lets users pivot freely through data without being constrained by predefined queries or fixed dashboard paths.
That makes it a strong pick for analysts who want unrestricted exploration across large or complex datasets.
Qlik Sense's top features
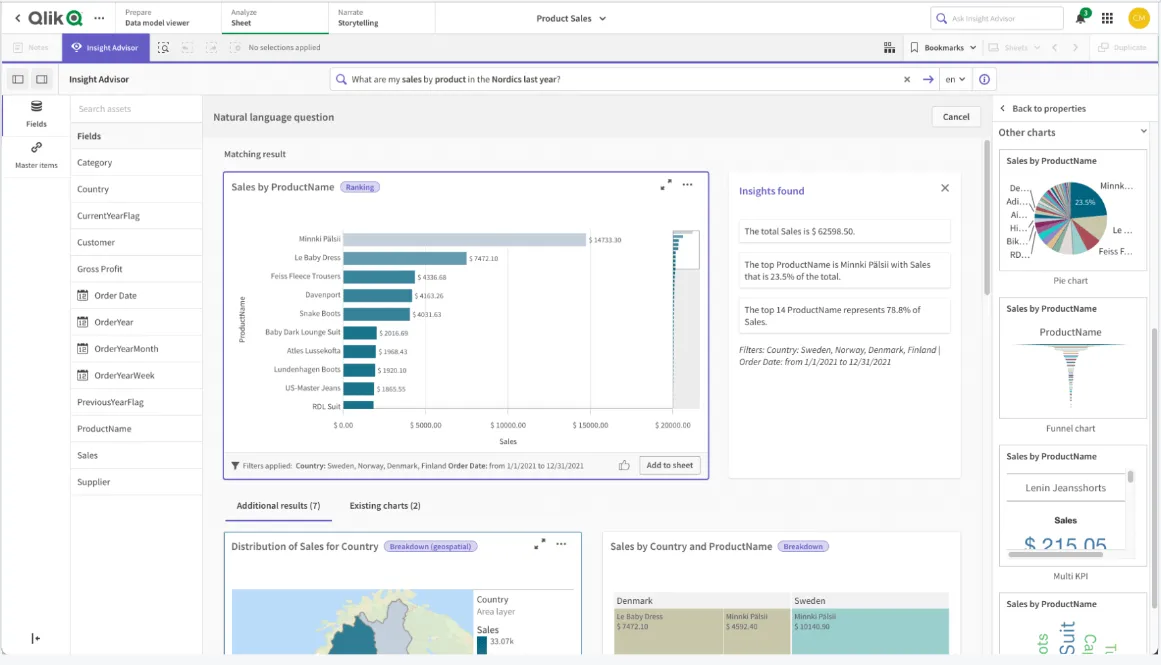
- Associative analytics engine: Move through values across charts and tables freely, with instant recalculations that keep the surrounding context in view.
- Augmented analytics with AI and ML: Built-in AI surfaces insights automatically, supports natural-language search, and powers predictive use cases.
- Real-time alerts and automation: Monitor data continuously and trigger automated actions when thresholds are crossed.
Qlik Sense pricing
There's no public pricing page for Qlik Sense. You'd need to reach out to their sales team for a custom quote.

Qlik Sense pros and cons
✅ Highly flexible engine that handles sophisticated, multi-dimensional analytics.
✅ Holds up well at large enterprise scale with high data volumes.
❌ One user on G2 mentions that sometimes there are loading issues, especially when business intelligence is running updates.
What are the best warehouse-native and self-serve BI tools?
Some teams want analytics that connect directly to the warehouse, keep metrics consistent through a semantic layer or governed model, and give analysts and business users a simple way to explore data without too much overhead.
➡️ Looking specifically for AI-augmented dashboarding tools? Check out my guide to thebest AI dashboard software.
And the warehouse-native and self-serve BI tools worth a look as AskEnola alternatives in 2026:
#1: Looker
Best for: Engineering-led data teams in Google Cloud who want every metric defined in one semantic layer.
Similar to:Lightdash, Holistics.
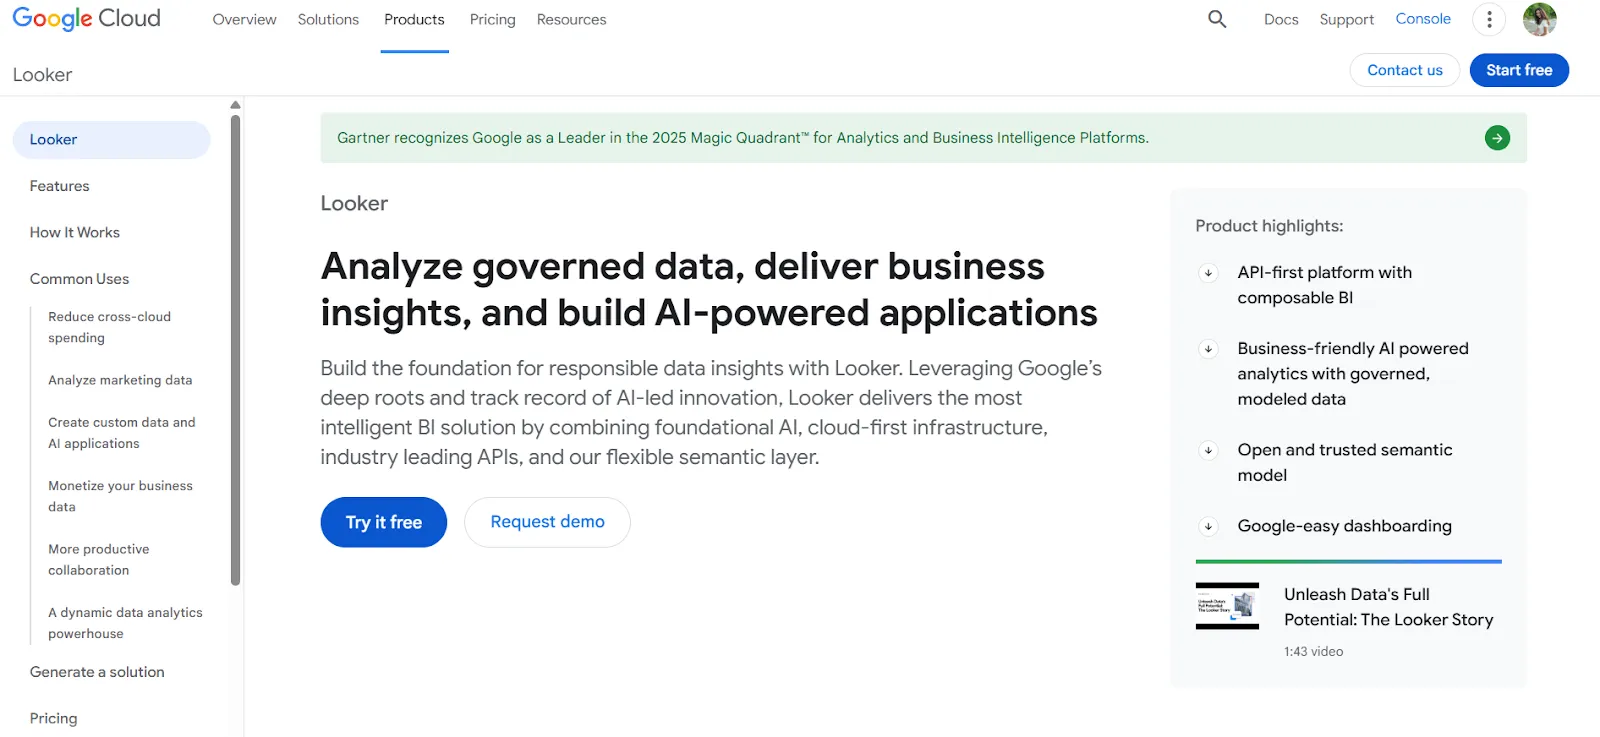
Looker organizes BI around a centralized modeling language called LookML, where metrics and business rules sit in a single layer that every report references.
It also includes Gemini-powered conversational analytics for users who want to ask questions in natural language instead of building reports.
Looker's top features
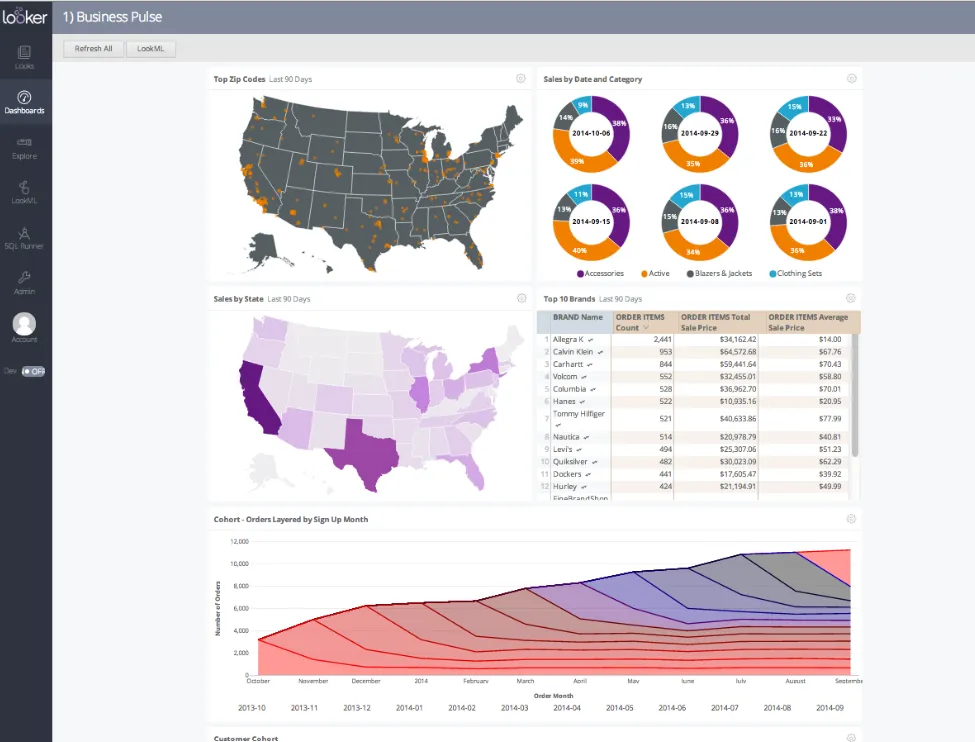
- LookML semantic modeling: Codify metric definitions and business logic in one shared layer, so the same numbers appear everywhere they're referenced.
- Gemini-powered conversational analytics: Ask data questions in natural English and skip the dashboard navigation step entirely.
- Live, governed dashboards: Reports query the warehouse directly, so filters and drill-downs still respect the underlying LookML definitions.
Looker pricing
Looker uses a custom, contract-based pricing model made up of two parts: platform pricing (the cost of running a Looker instance) and user licensing (the cost per user type).
Pricing is annual for all plans.
- Platform editions:
- Standard: Designed for small teams or organizations with fewer than 50 users, includes 1 production instance, 10 standard users + 2 developer users, up to 1,000 query-based API calls/month, and up to 1,000 admin API calls/month.
- Enterprise: Built for larger internal BI and analytics use cases, includes everything in Standard, plus enhanced security features, up to 100,000 query-based API calls/month, and up to 10,000 admin API calls/month.
- Embed: Designed for embedding analytics into external products or applications, includes everything in Standard, plus up to 500,000 query-based API calls/month and up to 100,000 admin API calls/month.
- User licensing:
- Developer users: Full access to Looker, including LookML development, administration, APIs, and advanced tooling.
- Standard users: Can explore data, build dashboards and reports, run SQL, and schedule content.
- Viewer users: Read-only access to dashboards and reports, with filtering and drill-down.
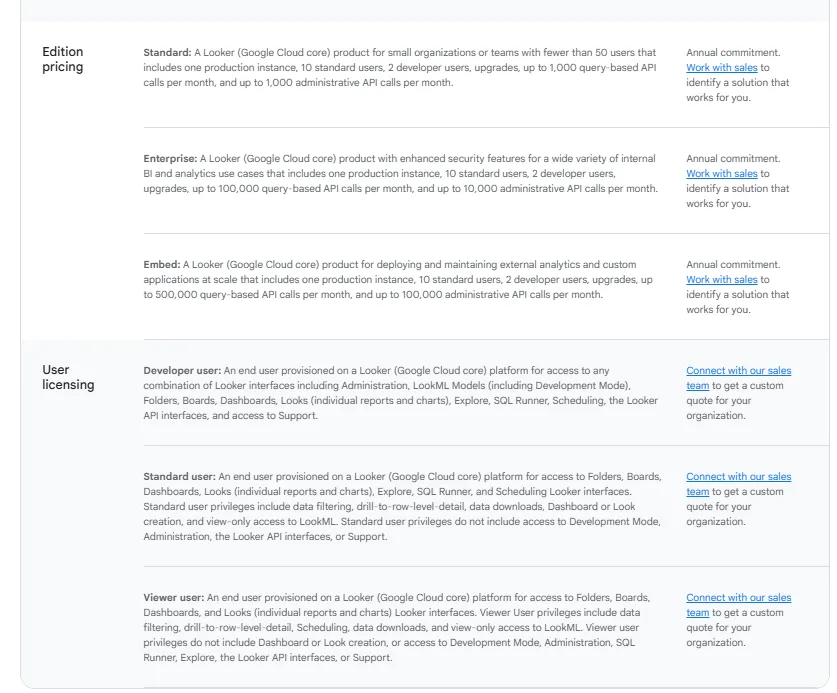
Pricing is custom on all plans and varies based on scale, permissions, and usage.
Looker pros and cons
✅ LookML acts as a single source of truth for company-wide metrics.
✅ Built-in support for embedding analytics inside your own customer-facing product.
❌ There's a bit of a learning curve at first, which can require a bit more education upfront to maximize all of its capabilities, according to a G2 review.
#2: Sigma
Best for: Finance and ops practitioners who'd rather analyze live warehouse data in a spreadsheet than open a BI tool.
Similar to:Omni, Metabase, Zenlytic.
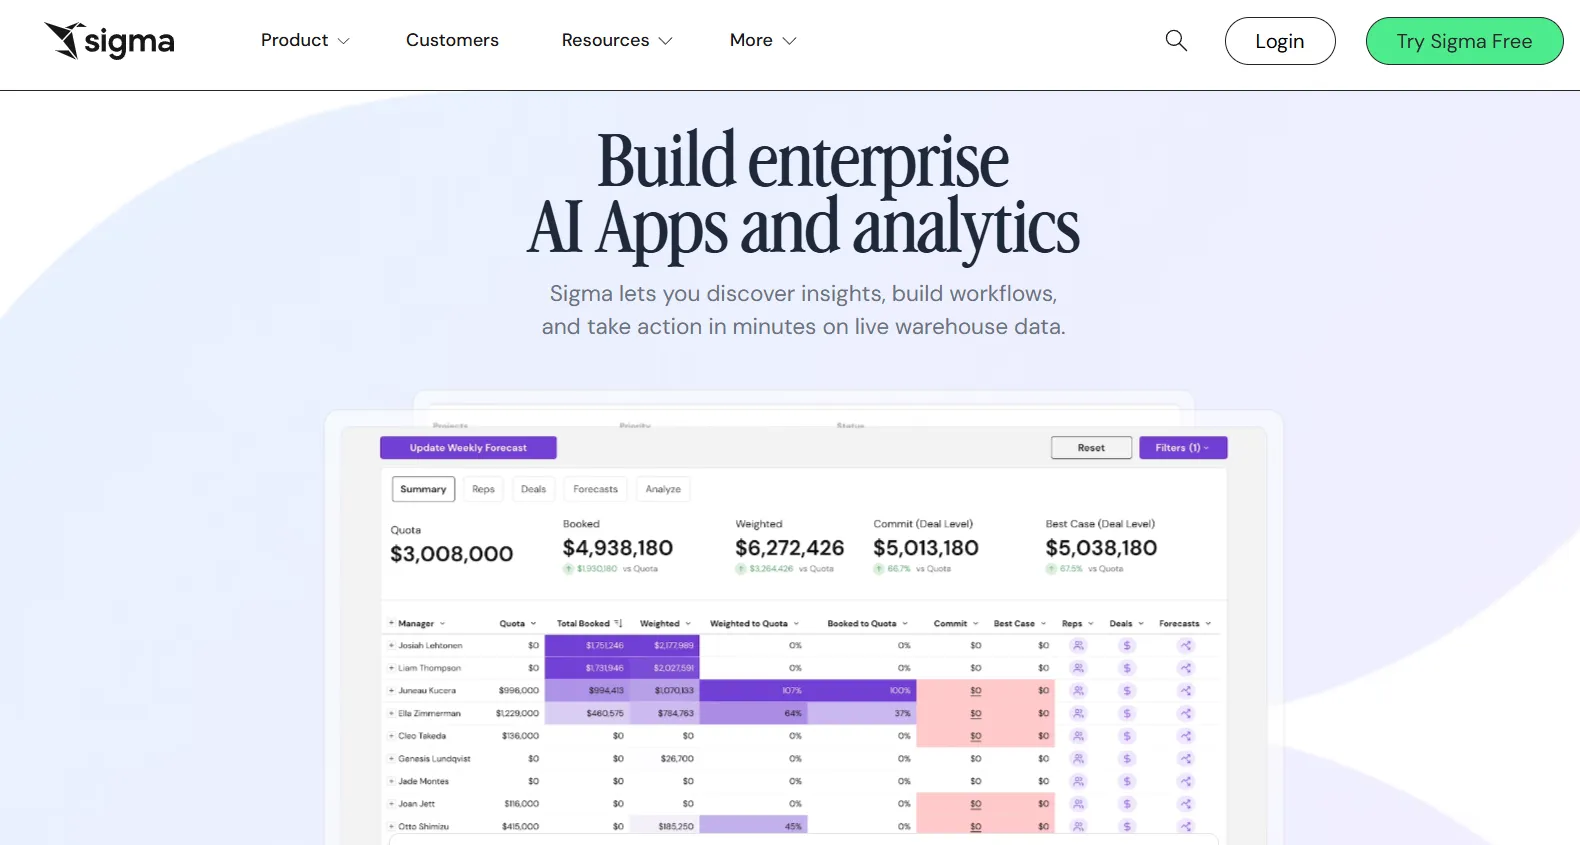
Sigma turns the warehouse into something a business user can actually open and work in, through a familiar Excel-style interface.
It connects directly to Snowflake, BigQuery, and Databricks without copying data anywhere.
Sigma's top features
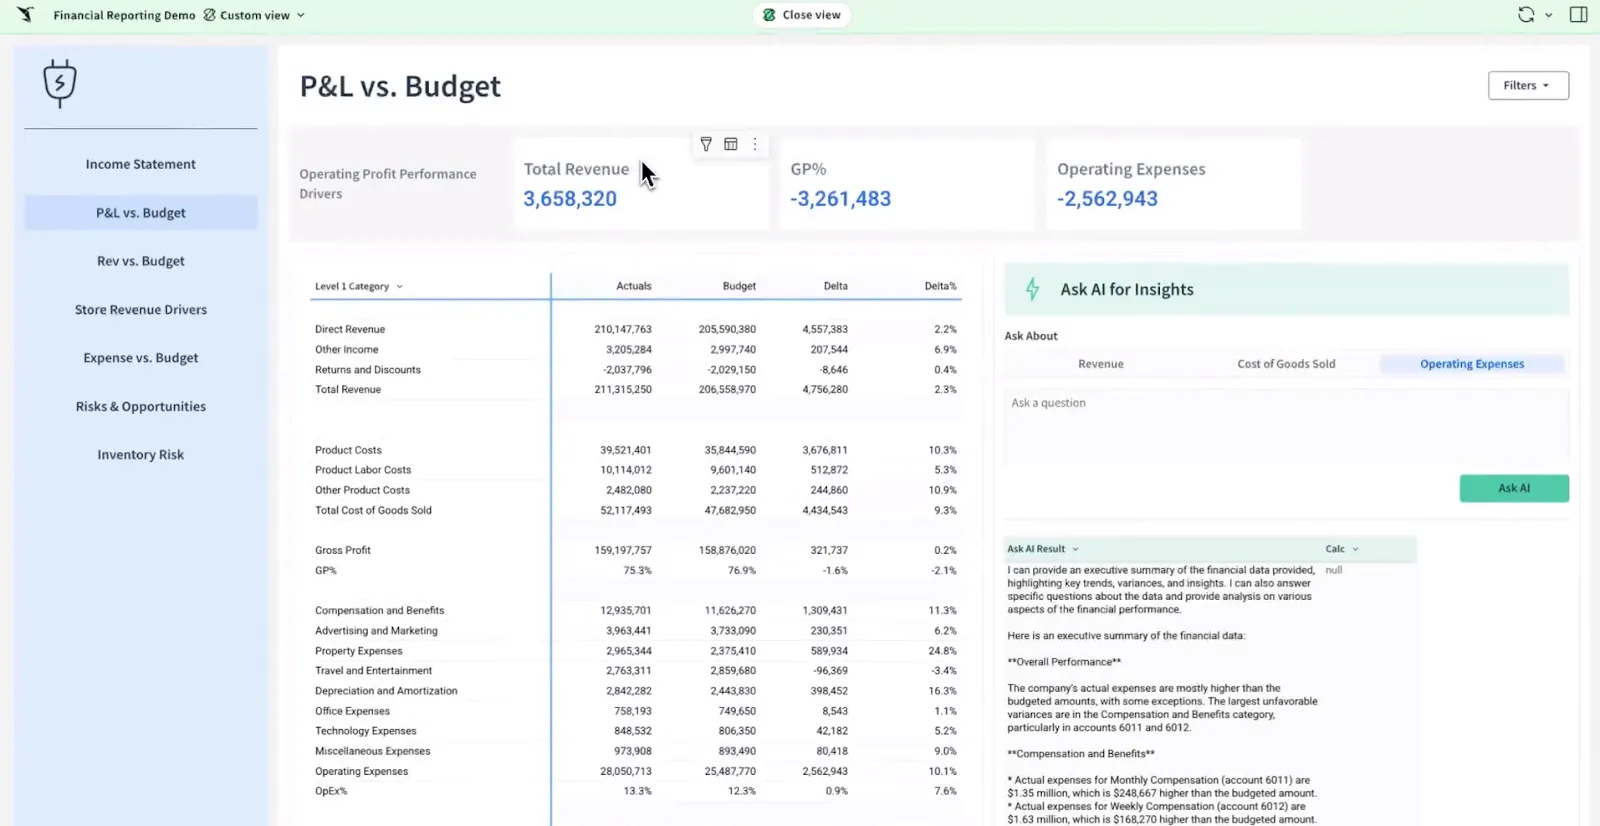
- Excel-like interface: Work with billions of warehouse rows using familiar spreadsheet formulas, tables, and pivot logic.
- AI-assisted dashboarding: Generate dashboards, reports, and data apps from natural-language prompts on top of live warehouse data.
- Shared workbooks: Co-author dashboards alongside teammates with comments, version history, and side-by-side iteration.
Sigma pricing
Sigma keeps its pricing off the public website. You can reach out to their sales team for a custom quote.
Sigma pros and cons
✅ The Excel-style interface gives finance and ops teams direct access to warehouse data.
✅ Queries hit the warehouse live, so the numbers reflect current data, not extracts.
✅ AI capabilities like Ask Sigma cut down the time spent on routine analysis tasks.
#3: Metabase
Best for: Early-stage SaaS and product teams that need fast self-service analytics, plus optional embedded use cases.
Similar to: Apache Superset,Vanna AI, Julius AI.
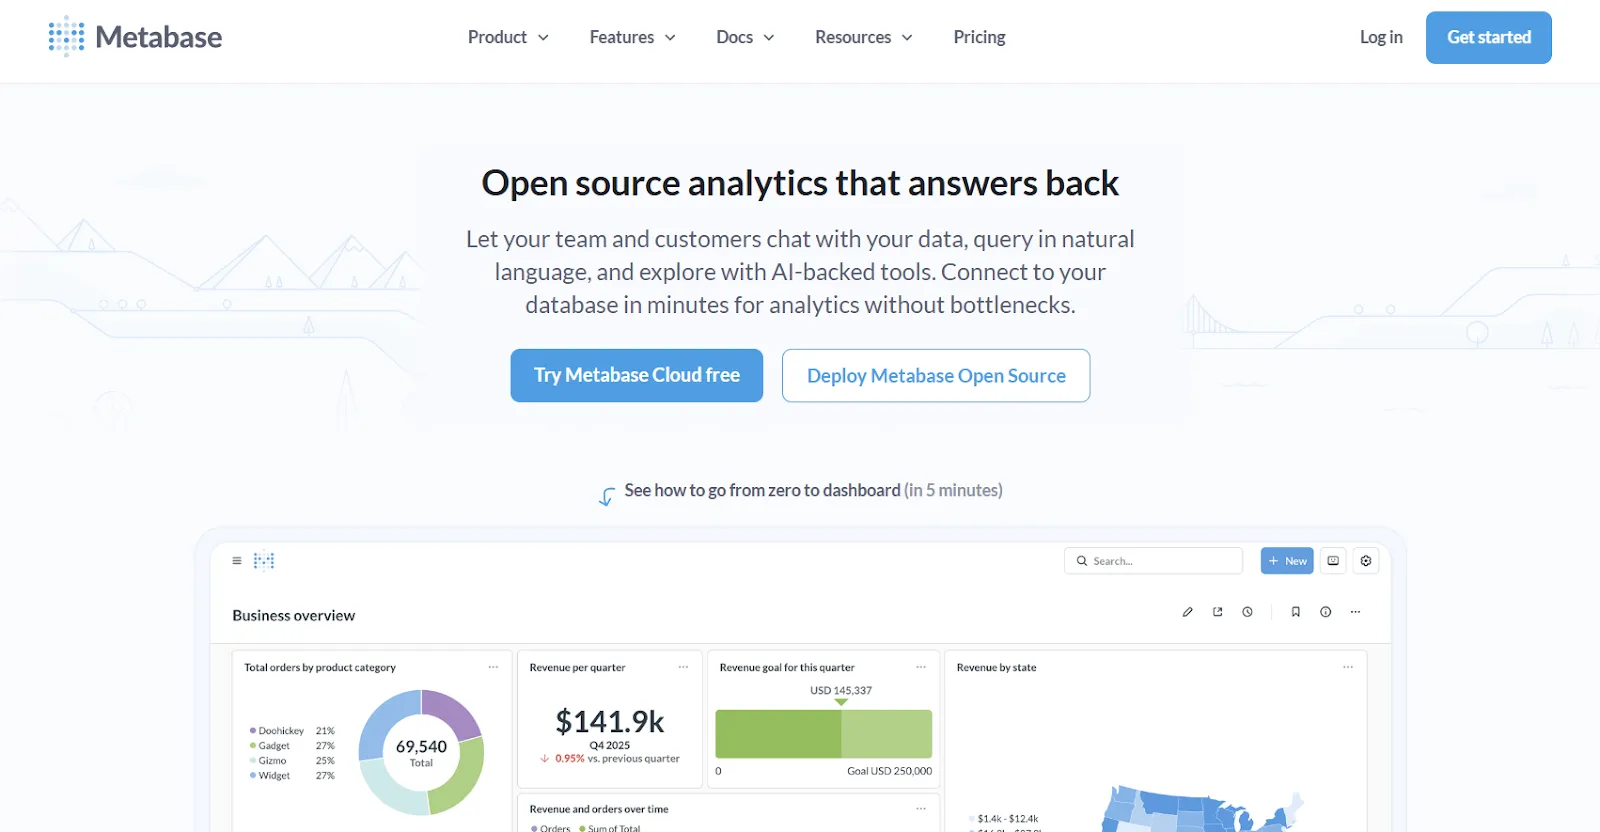
Metabase has been adopted heavily by SaaS and product teams that want self-service analytics without weeks of setup or a dedicated BI engineer.
Teams considering simpler analytics tools often end up here when they need both natural-language querying and proper SQL flexibility.
Metabase's top features
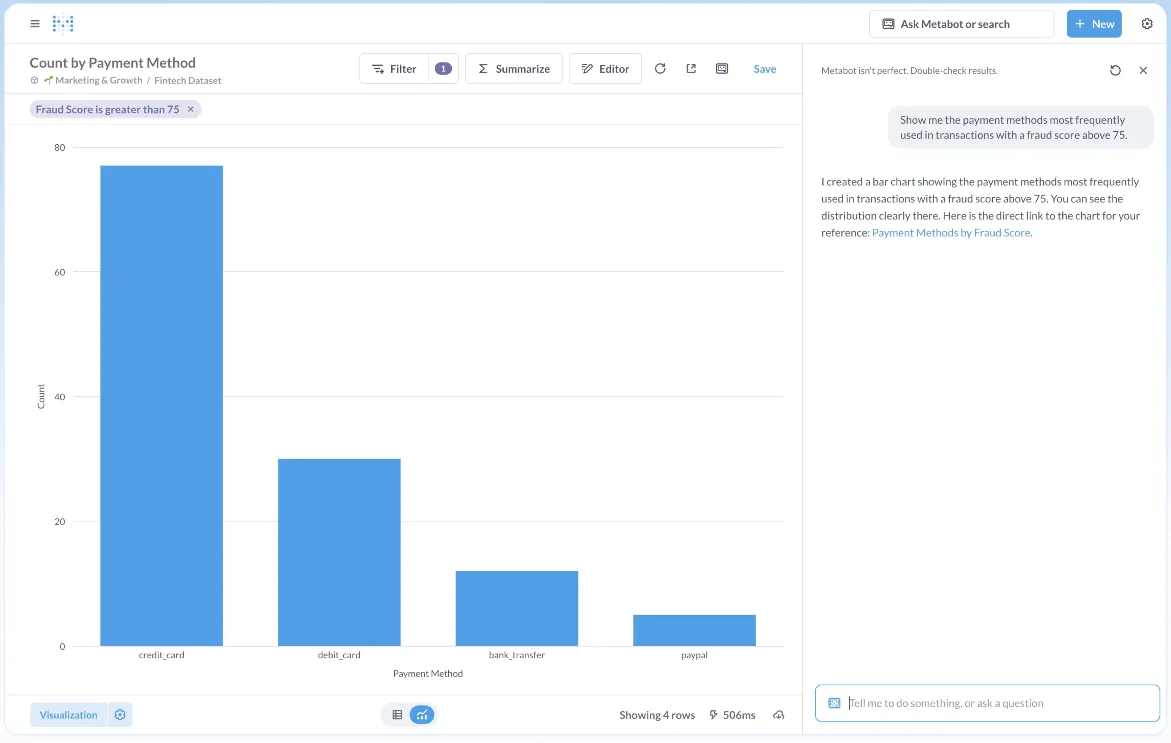
- Metabot AI natural-language layer: Ask questions in plain English and let Metabot translate them into queries and charts against your live data.
- Visual query builder: Non-technical users assemble questions through a guided interface, while SQL users can switch into raw query mode at any point.
- Drill-through exploration: Click any chart to zoom in, segment, filter, or spawn follow-up reports automatically.
Metabase pricing
Metabase offers two pricing options depending on how you use the product: internal business intelligence or customer-facing embedded analytics.
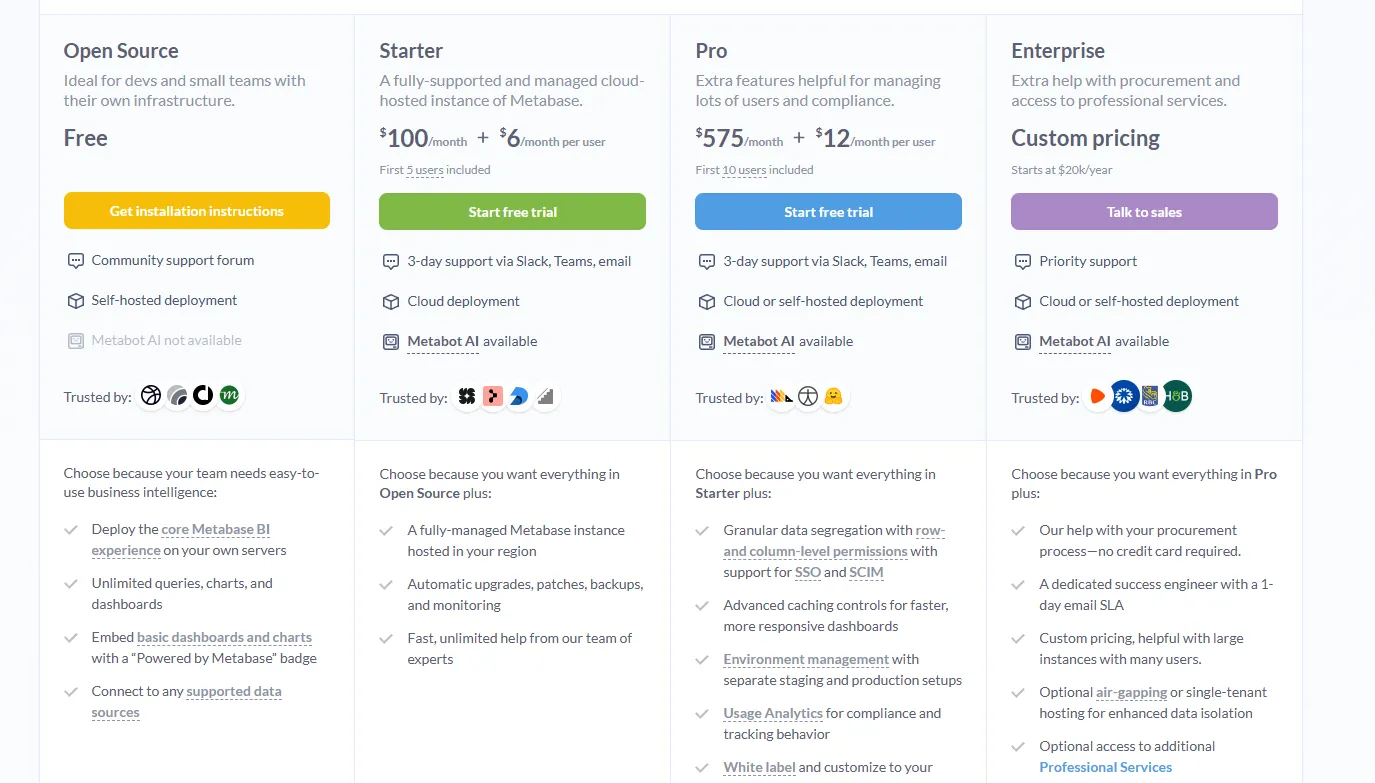
- Business Intelligence:
- Open Source (Self-hosted): Free, self-hosted deployment, includes unlimited queries, charts, and dashboards, connects to all supported data sources, basic embedding with “Powered by Metabase” branding, community support only.
- Starter (Cloud-hosted): $100/month + $6/user/month, first 5 users included, includes everything in Open Source, plus option to include Metabot AI (charged extra), automatic upgrades, backups, and monitoring, support via Slack, Teams, and email (3-day SLA).
- Pro: $575/month + $12/user/month, first 10 users included, cloud or self-hosted deployment, includes everything in Starter, plus row- and column-level permissions, SSO and SCIM support, advanced caching and performance controls, staging + production environments, usage analytics and audit visibility, white-labeling, and embedded analytics capabilities.
- Enterprise: Custom pricing (starts at $20k/year), includes everything in Pro, plus priority support, dedicated success engineer (1-day email SLA), optional single-tenant or air-gapped deployment, and optional professional services.
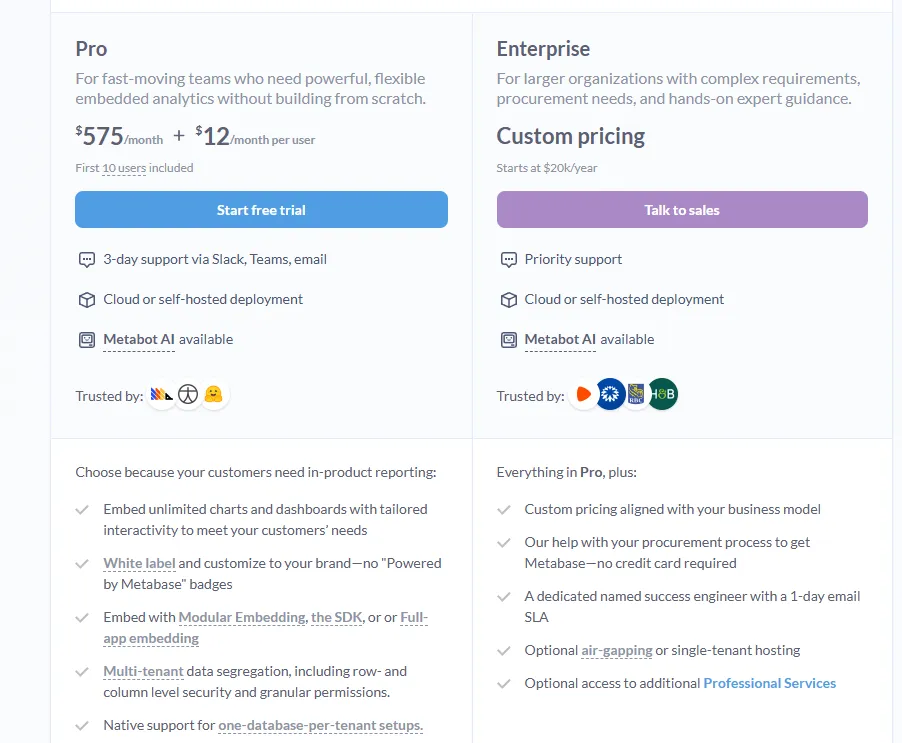
- Embedded Analytics pricing:
- Pro: $575/month + $12/user/month, first 10 users included, includes unlimited embedded dashboards and charts, full white-labeling, modular embedding, SDK, or full-app embedding, multi-tenant security (row- and column-level), one-database-per-tenant support, staging + production environments, usage analytics, internal BI for your team, and option to include Metabot AI (charged extra).
- Enterprise: Custom pricing (starts at $20k/year), includes everything in Pro, plus a dedicated success engineer, priority support, optional single-tenant or air-gapped hosting, and optional professional services.
Metabase pros and cons
✅ Equally usable for SQL-fluent analysts and business stakeholders without a data background.
✅ Minimal setup overhead, which is a good fit for early-stage data teams.
✅ Free open-source tier lets teams get started without budget approval.
❌ A user on G2 believes that Metabase could benefit from having an AI assistant that understands the databases and assists in building queries
Get started with Dot’s free plan
Here's what you'll get by signing up for Dot:
- A free starter plan that ships with 300 one-time credits and the full Pro feature set, so you can run real questions through Dot before paying anything.
- Ad-hoc analysis available wherever your team works, including Slack, Microsoft Teams, email, and the Dot web app.
- Recurring executive review reports built from live warehouse data, written narratives, and recommendations, on whatever cadence makes sense for your leadership team.
- A Context Agent that watches over your shared business definitions and surfaces conflicts before they show up in a board deck.
- Audit trails attached to every answer, with clickable links to the SQL, Python, and source datasets behind the number.
- Native connections to Snowflake, BigQuery, Redshift, Databricks, as well as other sources.
- Reuse of any dbt, Looker, or Power BI semantic models you already have in production, no rebuild required.
- SOC 2 Type II compliance and the security controls enterprise data teams expect.
- Credit-based pricing decoupled from headcount, so the bill doesn't grow every time you add a user.
➡️ Get started for free with Dot's Starter plan, or schedule a demo to see how it works with your data.
⚠️ Disclaimer: This article was last updated on the 8th of May, 2026, and if there's any misinterpretation of the information, please contact us, and we will fact-check it.
Theo Tortorici
Theo writes about AI-powered analytics, data tools, and the future of business intelligence at Dot.