
10 Best Skopx Alternatives & Competitors In 2026
In this guide, I’ll go over the 10 best Skopx alternatives in 2026, with a clear read on who each one suits and what you can expect to pay.
TL;DR
- Dot is the best Skopx alternative in 2026 for teams that are looking for a self-service analytics platform, which writes the analysis and delivers it into Slack or Teams, with scheduled reports, a shared definition layer through a Context Agent, and an auditable trail on every figure.
- ThoughtSpot and Supaboard are the leading conversational analytics options, covering enterprise-scale search and AI-generated dashboards, while Zenlytic focuses on answers backed by a governed semantic layer.
- Sigma and Metabase handle self-service exploration directly on warehouse data, while Holistics adds governed, version-controlled modeling in Git.
- Microsoft Power BI and Tableau remain the standard for large-scale enterprise reporting, while Domo consolidates the entire data pipeline into a single platform.
What are the best Skopx alternatives in 2026?
The best Skopx alternatives in 2026 are Dot with its decision intelligence software that non-technical teams can put to work on day one on Slack and Microsoft Teams, followed by ThoughtSpot and Supaboard.
Here’s the full shortlist:
Tool | Use case | Price |
Dot | An AI data analyst that delivers written analysis and scheduled executive reports, not dashboards. | Free plan; paid from $180/month. |
ThoughtSpot | Search and agent-driven analytics that turns natural-language questions into governed charts and full dashboards. | From $25/user/month (annual). |
Supaboard | AI-native, no-code dashboards and natural-language analytics across SaaS and warehouse sources. | From $85/month. |
Zenlytic | An AI analyst (Zoë) that answers questions with citations on top of a governed semantic layer. | Pricing not public. |
Sigma | Spreadsheet-style analysis on live warehouse data, aimed at finance and ops teams. | Pricing not public. |
Metabase | Open-source self-serve BI for fast dashboards and SQL querying at a low setup cost. | Free (open source); Cloud from $100/month. |
Holistics | Governed self-service BI with analytics-as-code and Git version control. | From $960/month. |
Microsoft Power BI | Standardized reporting and self-service analytics for Microsoft 365 organizations. | Free plan; Pro from $14/user/month. |
Tableau | Deep visual analytics and data storytelling, now with agentic answers through Tableau Next. | From $15/user/month. |
Domo | An all-in-one cloud platform that ties data integration, dashboards, apps, and AI agents together. | Custom pricing (free trial). |
#1: Dot
Dot is the best Skopx alternative in 2026 for data and analytics teams that want an AI analyst working on top of their warehouse, with answers in Slack or Teams, scheduled reviews delivered as PowerPoints, and a full audit trail under every figure.
Our AI data analyst connects to your data warehouse, reads the business context you have already modeled, and returns analysis with the supporting reasoning attached.
It is built to produce the analysis itself and not really to maintain yet another reporting interface.
Disclaimer: Yes, Dot is our platform. However, I’ll still build an argument into why our BI tool is the best Skopx alternative on the market in 2026.
Let’s go over some of the key features that make Dot a strong alternative to Skopx:
Ask in the channel, get the analysis back
Dot lets your team ask complex questions in Slack or Microsoft Teams, and our conversational analytics software replies directly in the thread.
Let’s imagine that your head of support pings the channel on a Tuesday because the ticket backlog is climbing and nobody can say why.
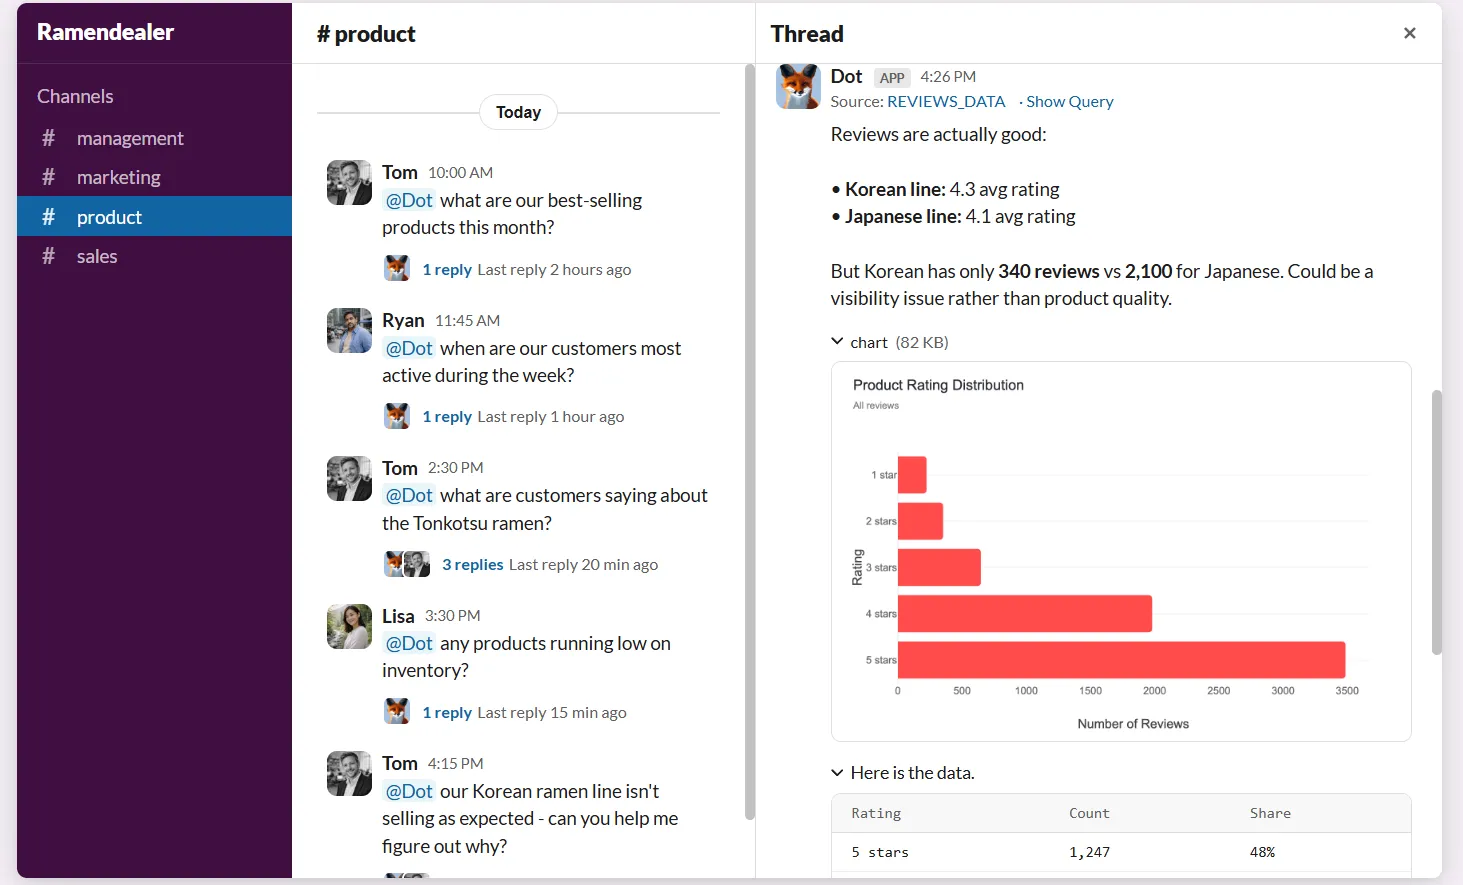
Our analyst reads the relevant data and answers clearly: which queues are growing and which issue types are driving the volume, with the change in response times quantified and each point linked to the figures behind it.
There are no filters to configure and no dashboards to open, and staff who do not write SQL still get a direct answer.
Set the schedule, get the report
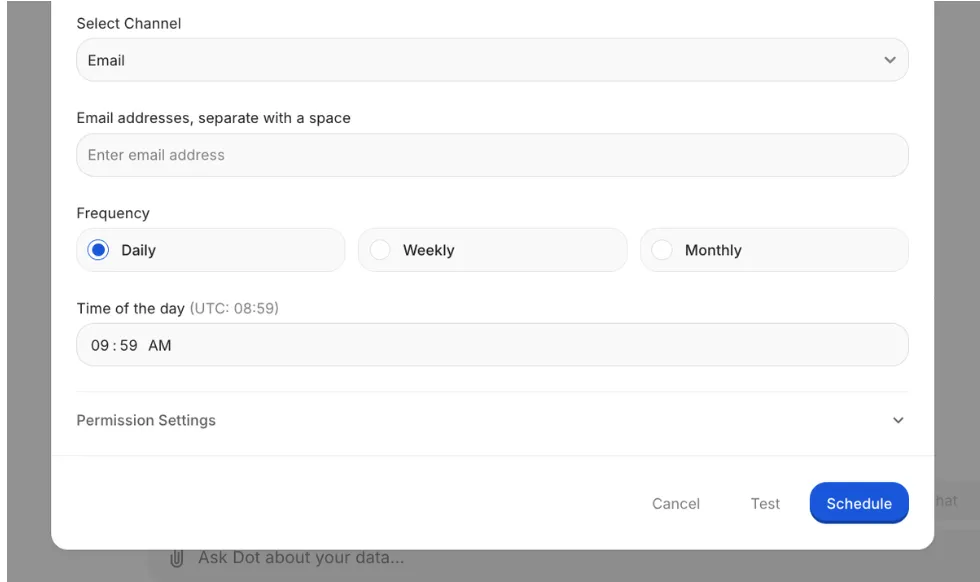
Dot generates recurring business reviews on a schedule you set, querying current data each cycle and delivering a finished PowerPoint to Slack or email.
Let’s take the monthly revenue review that an analytics team rebuilds by hand, pulling the same charts and rewriting last month's commentary each time.
Dot produces that deck automatically, with current figures and a written summary of what changed against the prior period, ready to present.
Define a metric once, use it everywhere
Dot's Context Agent maintains one definition for each metric, reading your dbt models and available documentation so that every answer uses the same logic.
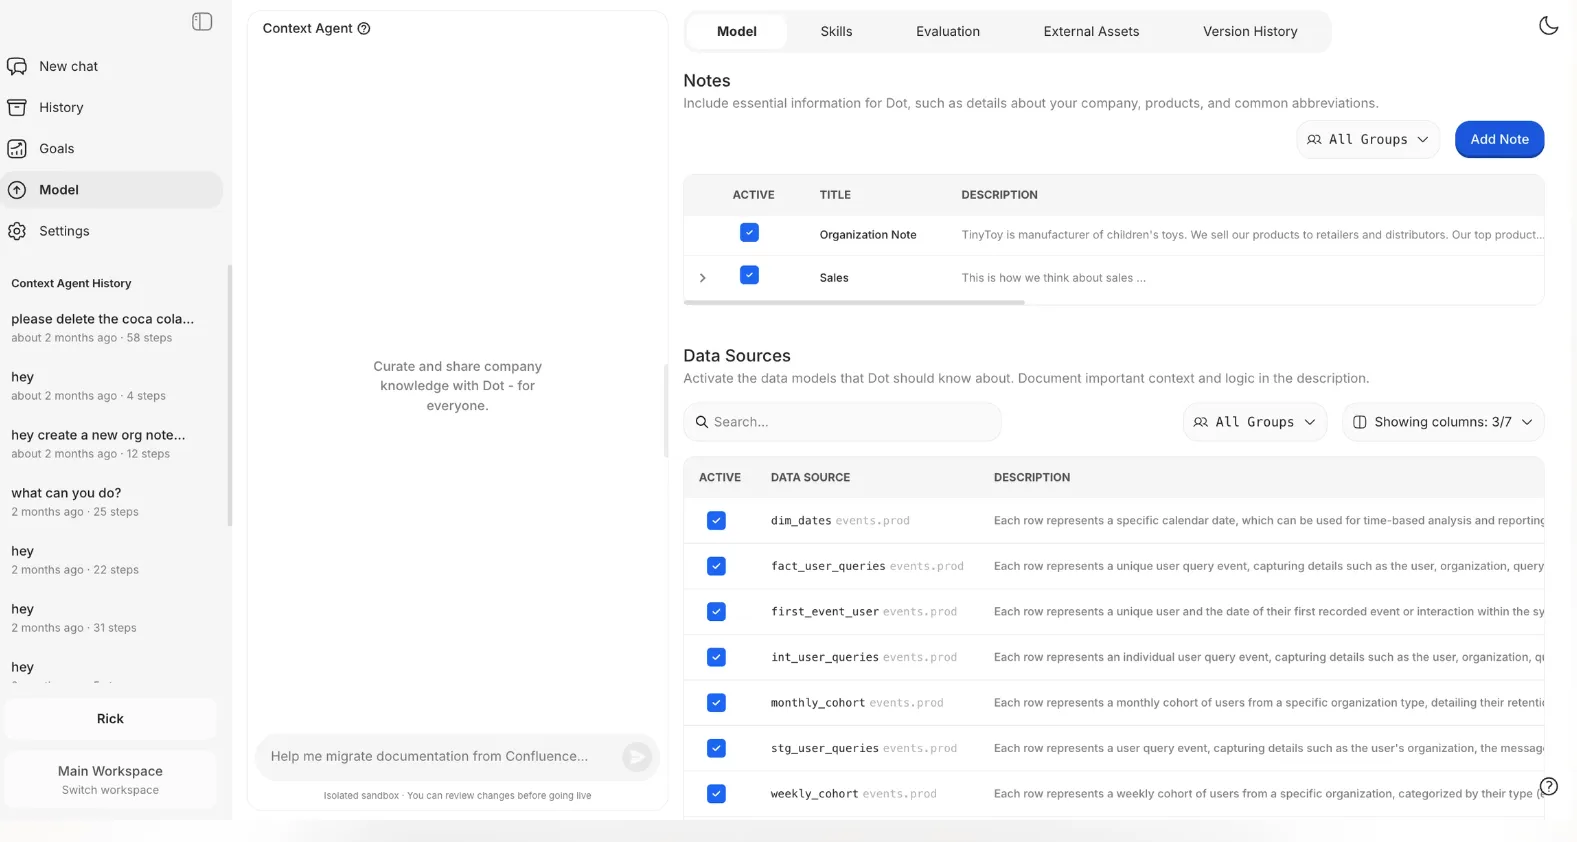
If multiple teams disagree in a review because one counts revenue net of refunds and the other counts it gross, that wouldn’t be a problem with Dot, as our solution applies a single agreed definition to every query, so the same metric returns the same number across the business.
And the best part? If a metric is undocumented, it proposes a definition, and where two systems conflict, it flags the discrepancy for you to settle.
Open any number, trace it to the source
Every figure Dot returns includes a link to the exact query and dataset that produced it, so any result can be verified before it is used.
If a churn figure in a board deck looks higher than expected, and someone needs to confirm it before the meeting, they open the figure to see the query and the underlying rows, and confirm the number in minutes.
No result has to be taken on trust from Dot with this audit trail.
What makes Dot different from Skopx?
Skopx and Dot share a common premise: users should be able to ask a question in everyday language and receive a reliable answer with its source attached.
Skopx connects across a broad range of work tools, from Slack and Gmail to Jira, GitHub, Notion, and HubSpot, and it goes beyond answering questions.
It can act on a user's behalf, drafting an email or creating a task within the same conversation, and its Insights Hub monitors connected sources and sends a cited daily briefing on overnight changes.
The difference between the two products is one of focus, and not really quality (I’m not going to pretend it’s a bad platform).
Skopx is broad, spanning the full work stack and built to answer questions and take action across many tools.
Dot is focused on the analytical layer.
Our solution connects to the warehouses most teams run, including Snowflake, BigQuery, Redshift, and Databricks, along with operational databases such as Postgres, and it reuses the semantic models already defined in dbt, Looker, Power BI, or Cube.
Dot reads the business logic your organization has already built and adds an analyst on top of it, with nothing to recreate.
Your data also remains in place, as Dot queries the warehouse directly and is SOC 2 Type II compliant.
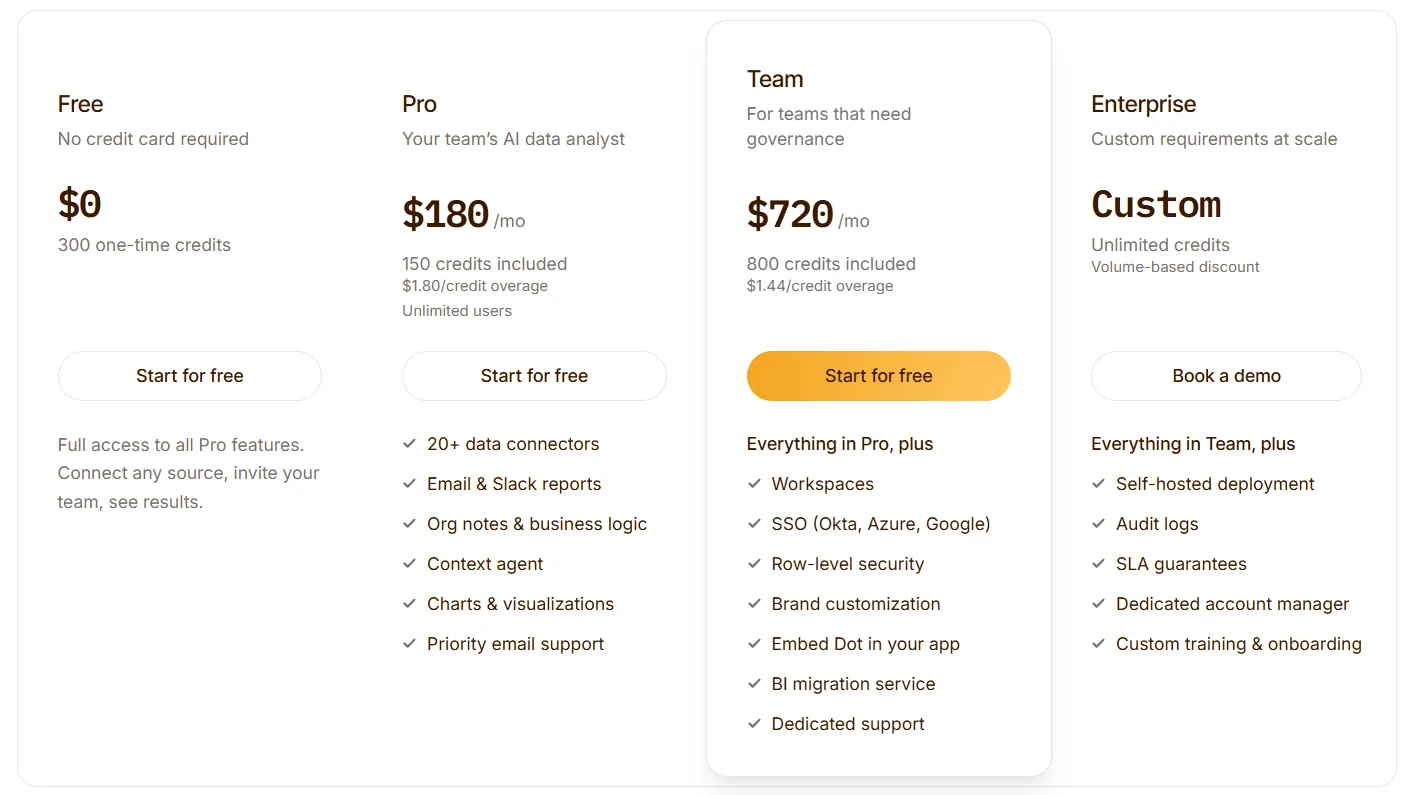
Dot pricing
Dot's free plan includes 300 one-time credits and full access to Pro features, enough to evaluate the product on real work before any purchase.
There are three paid tiers.
- Pro: $180/month, including 150 credits per month, $1.80 per additional credit, and unlimited users.
- Team: $720/month, including 800 credits per month, a $1.44 overage rate, and SSO, row-level security, embedding, BI migration, and dedicated support.
- Enterprise: custom pricing, with unlimited credits, volume discounts, self-hosted deployment, audit logs, an SLA, and a dedicated account manager.
Dot pros and cons
✅ Returns written analysis with a clear recommendation, not a chart to interpret manually.
✅ Generates recurring reviews as presentation-ready decks.
✅ Every figure links to the query and data behind it in one click.
✅ A shared definition layer keeps metrics consistent across teams.
✅ Runs on existing warehouses and semantic models, with no migration required.
✅ Usage-based billing with unlimited seats.
❌ It does not build dashboards.
#2: ThoughtSpot
Best for: Organizations that want non-technical staff to self-serve answers from governed data at scale.
Similar to: Dot, Supaboard.
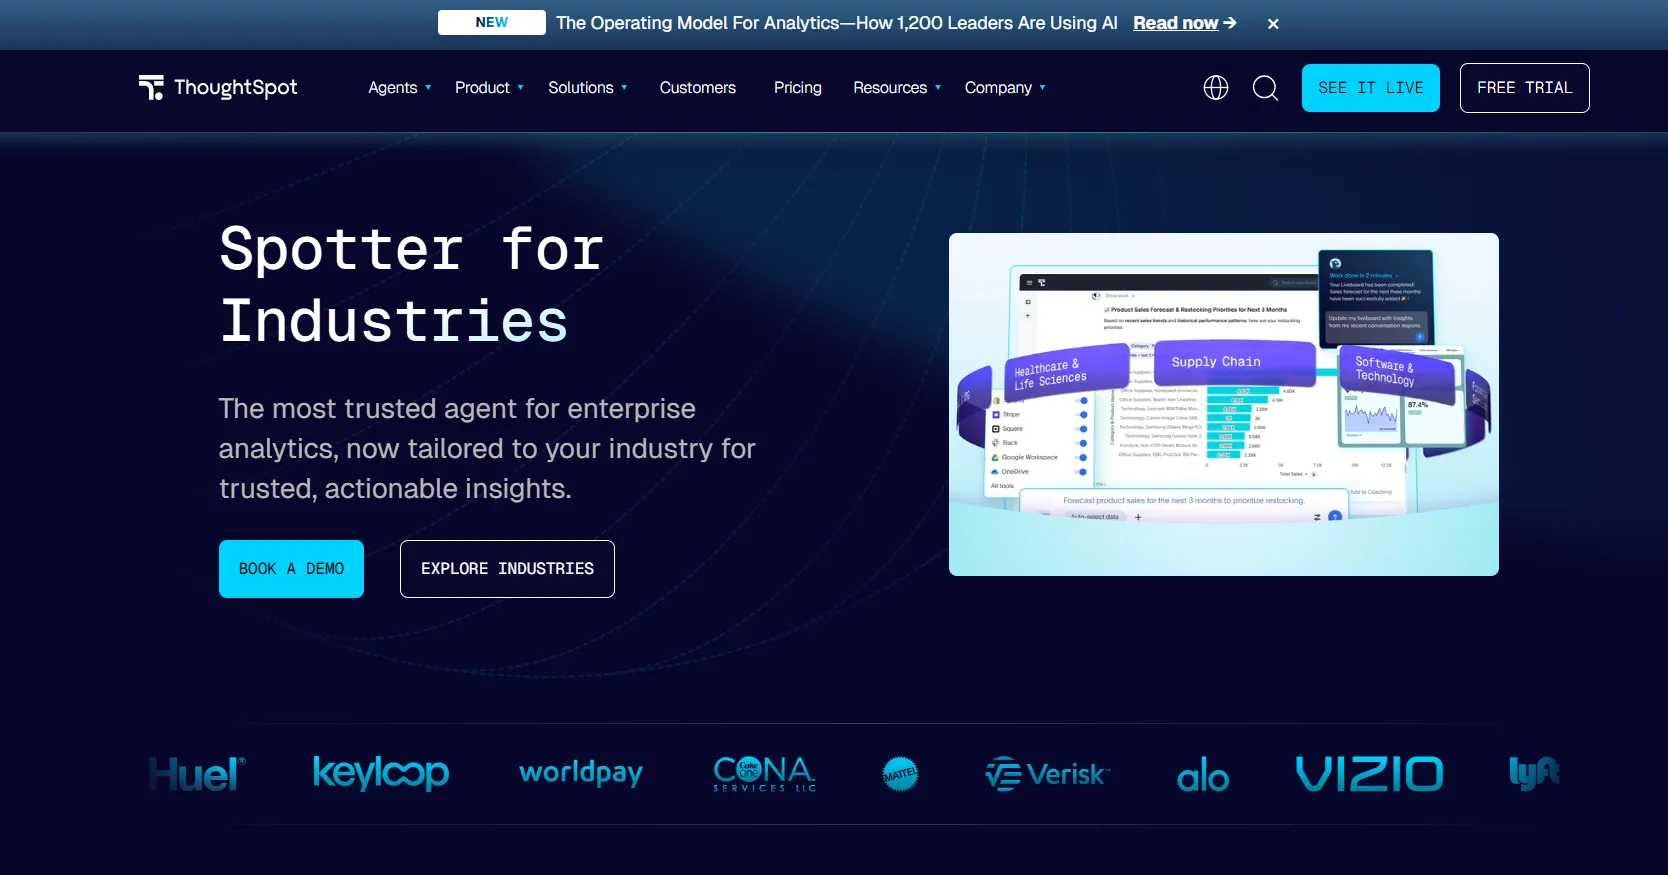
ThoughtSpot is an analytics platform that turns questions typed in everyday language into governed charts and dashboards drawn from live data.
The platform is built for self-service analytics at enterprise scale.
Its Spotter agent takes a single prompt and returns a full analysis with the supporting dashboard, so business users can answer their own questions without involving the data team.
Features
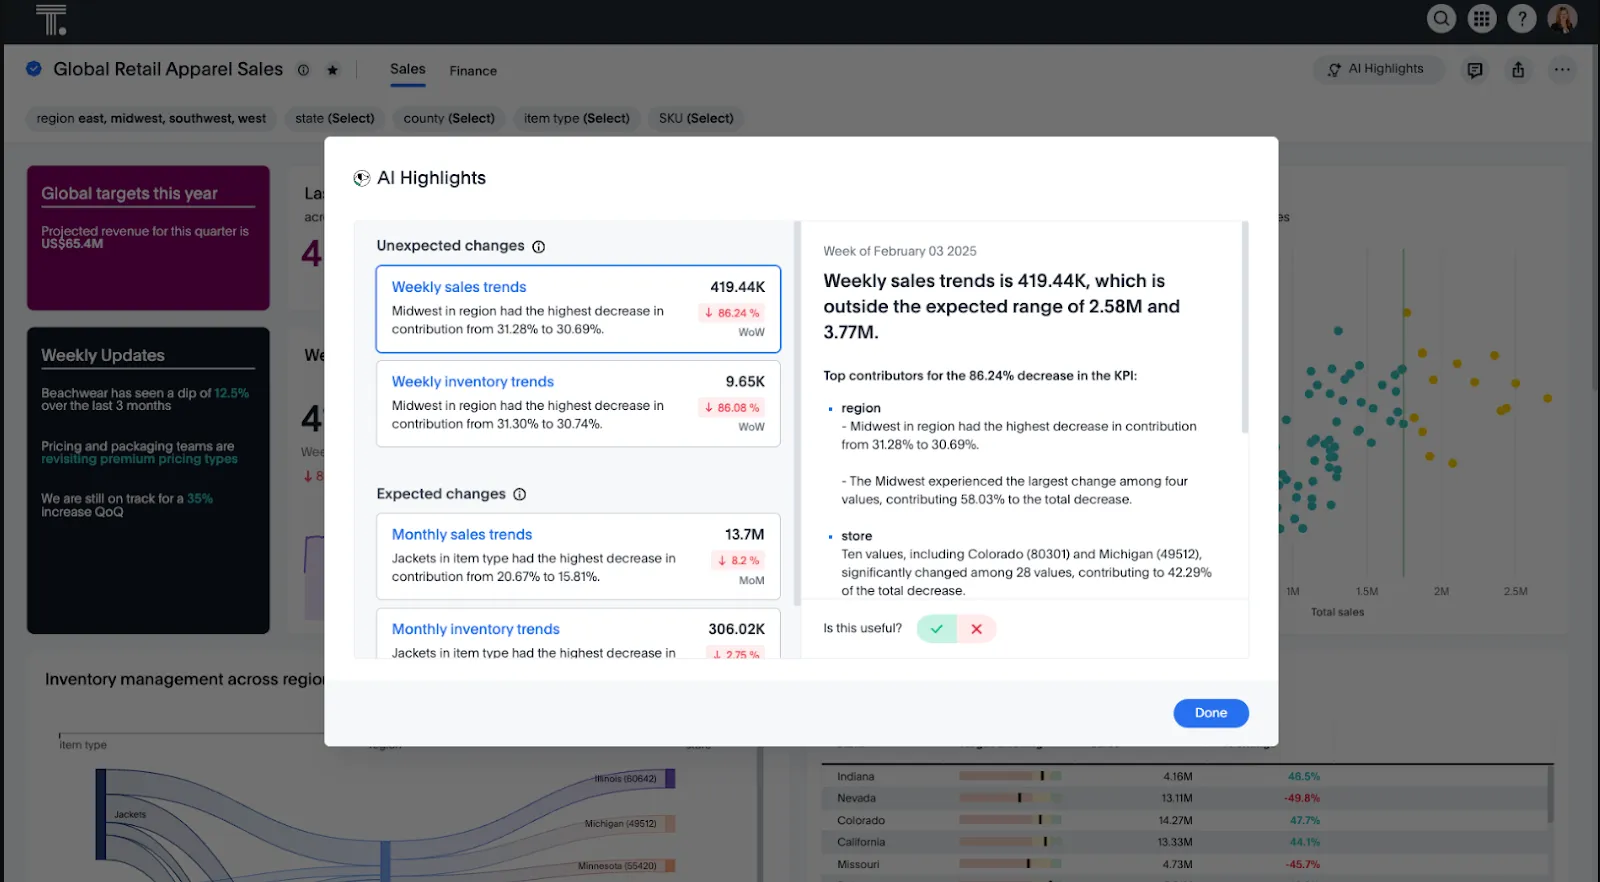
- Spotter agent: returns a governed chart from a single prompt, then builds the surrounding dashboard with likely follow-ups included.
- SpotterViz: generates a formatted, ready-to-read dashboard from a dataset.
- Product embedding: lets teams place ThoughtSpot's search inside their own customer-facing applications.
- Governance at scale: keeps permissions and metric controls manageable as the user count grows.
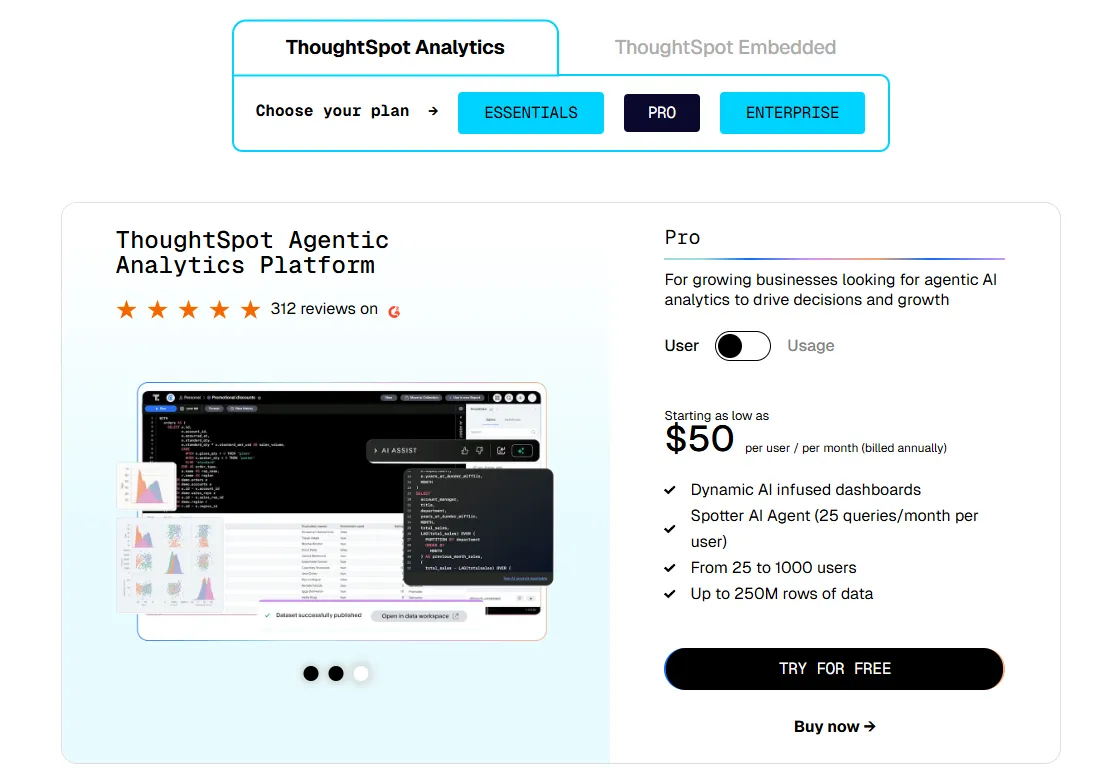
Pricing
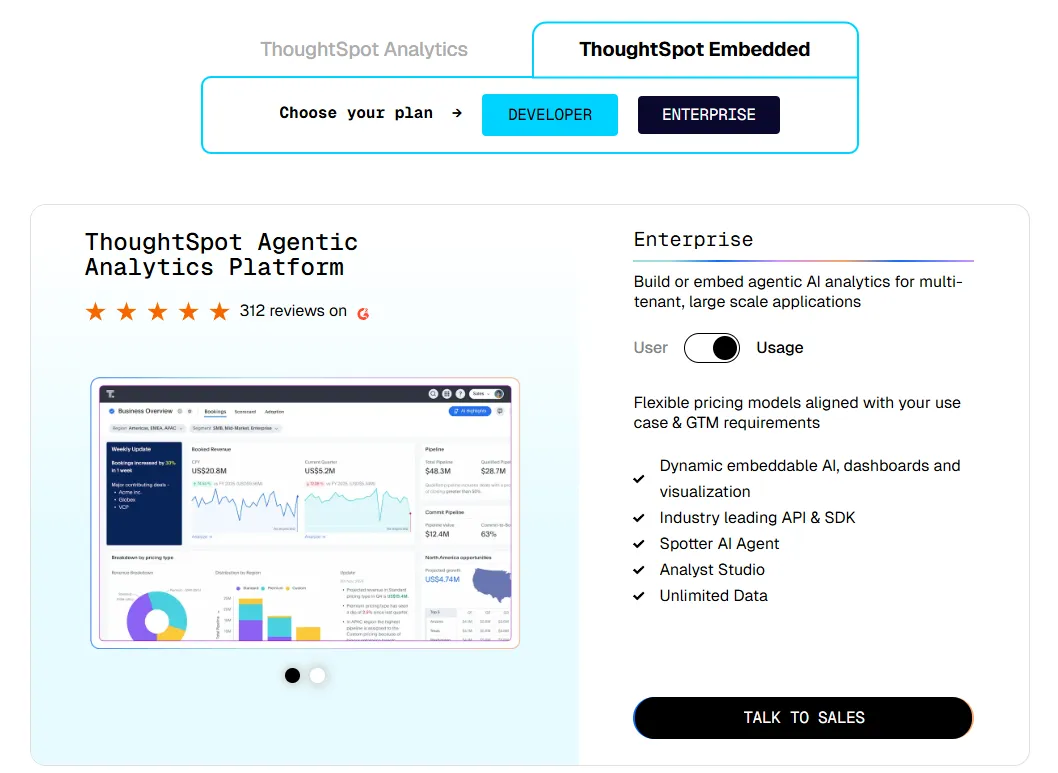
ThoughtSpot offers two separate products: ThoughtSpot Analytics for internal BI and ThoughtSpot Embedded for building analytics into applications - each with flexible pricing depending on scale and usage:
- ThoughtSpot Analytics:
- Essentials: From $25 per user per month (billed annually), for teams of 5-50 users, includes dynamic interactive dashboards and AI-powered insights and supports up to 25M rows of data.
- Pro (per user pricing): From $50 per user per month (billed annually), for 25–1,000 users, includes everything in Essentials, plus AI-infused dashboards and Spotter AI Agent (25 queries per user/month), and supports up to 250M rows of data.
- Pro (usage-based): From $0.10 per query, includes everything in Pro per user, and adds Analyst Studio.
- Enterprise (user or usage-based): Custom pricing, includes everything in Pro, plus unlimited users and data.
- ThoughtSpot Embedded:
- Developer: Free for 1 year, includes embeddable AI analytics, dashboards, and visualizations, APIs and SDKs, up to 10 users and 25M rows of data.
- Enterprise (user-based): Custom pricing, includes everything in Developer, plus unlimited data.
- Enterprise (usage-based): Custom pricing, everything in Enterprise, plus Spotter AI Agent and Analyst Studio.
Pros and cons
✅ Non-technical staff actively use the search interface.
✅ Governance scales well across many teams.
❌ Two pricing structures (per user vs. usage-based) can get confusing at scale.
#3: Supaboard
Best for: Smaller teams that want AI to build the dashboards for them, with no modeling project up front.
Similar to: ThoughtSpot, Zenlytic.
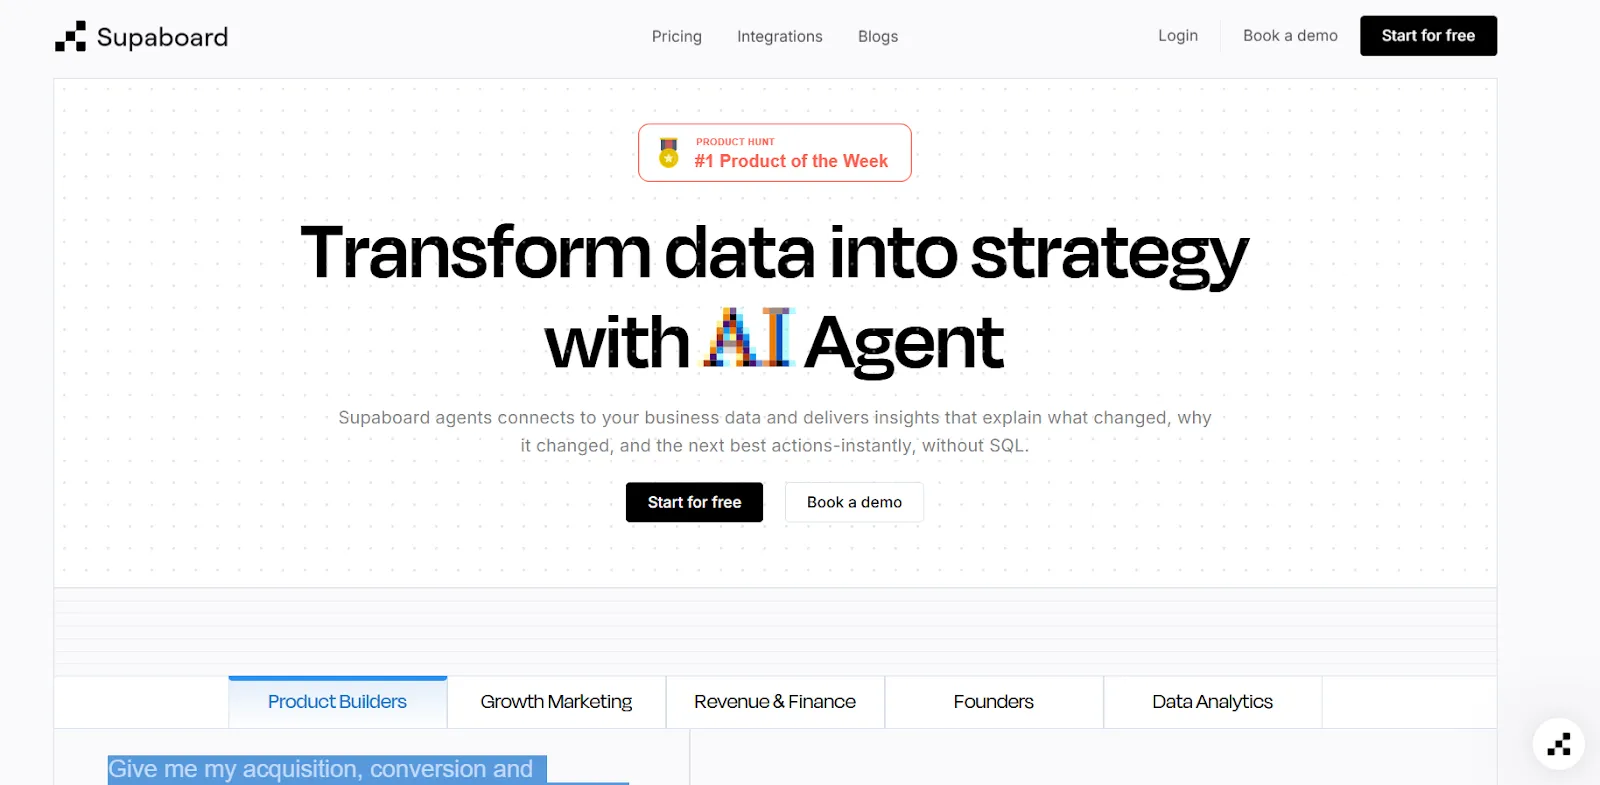
Supaboard’s analytics platform connects to your data sources and generates dashboards, insights, and reports.
All you have to do is connect a source, and an agent named Stella builds the dashboards and answers the questions, with no SQL and no setup phase to get through.
Features
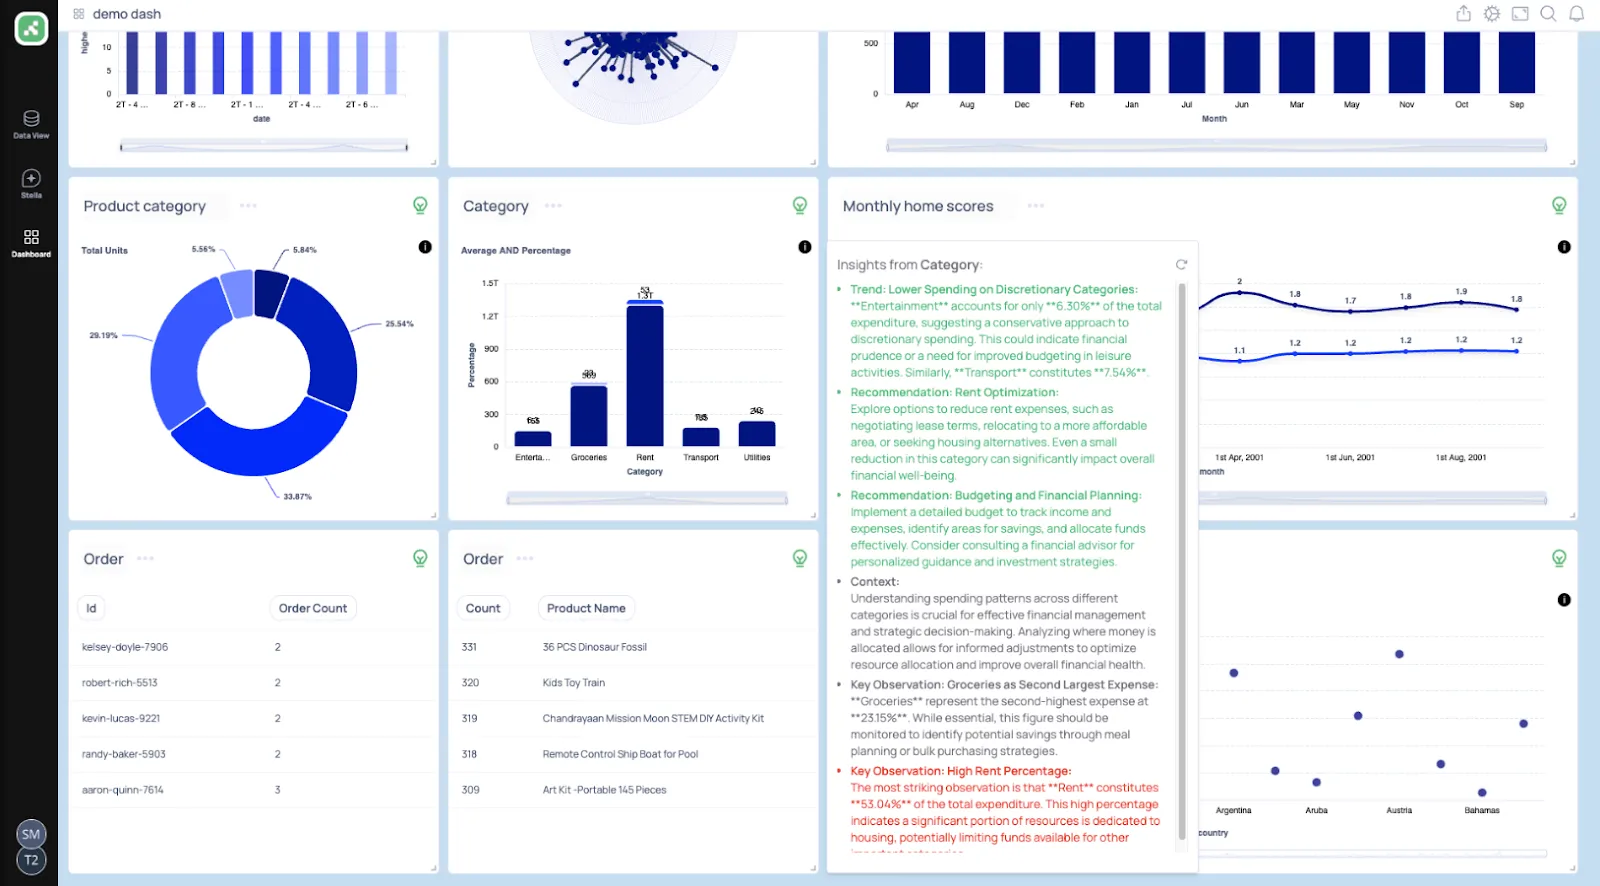
- Trainable AI agents: Learn your business rules and definitions so that insights arrive with context.
- Natural-language data chat: Returns metrics, charts, explanations, and a suggested next step in response to a question.
- Real-time dashboards: Builds interactive dashboards from a description and refreshes them automatically.
Pricing
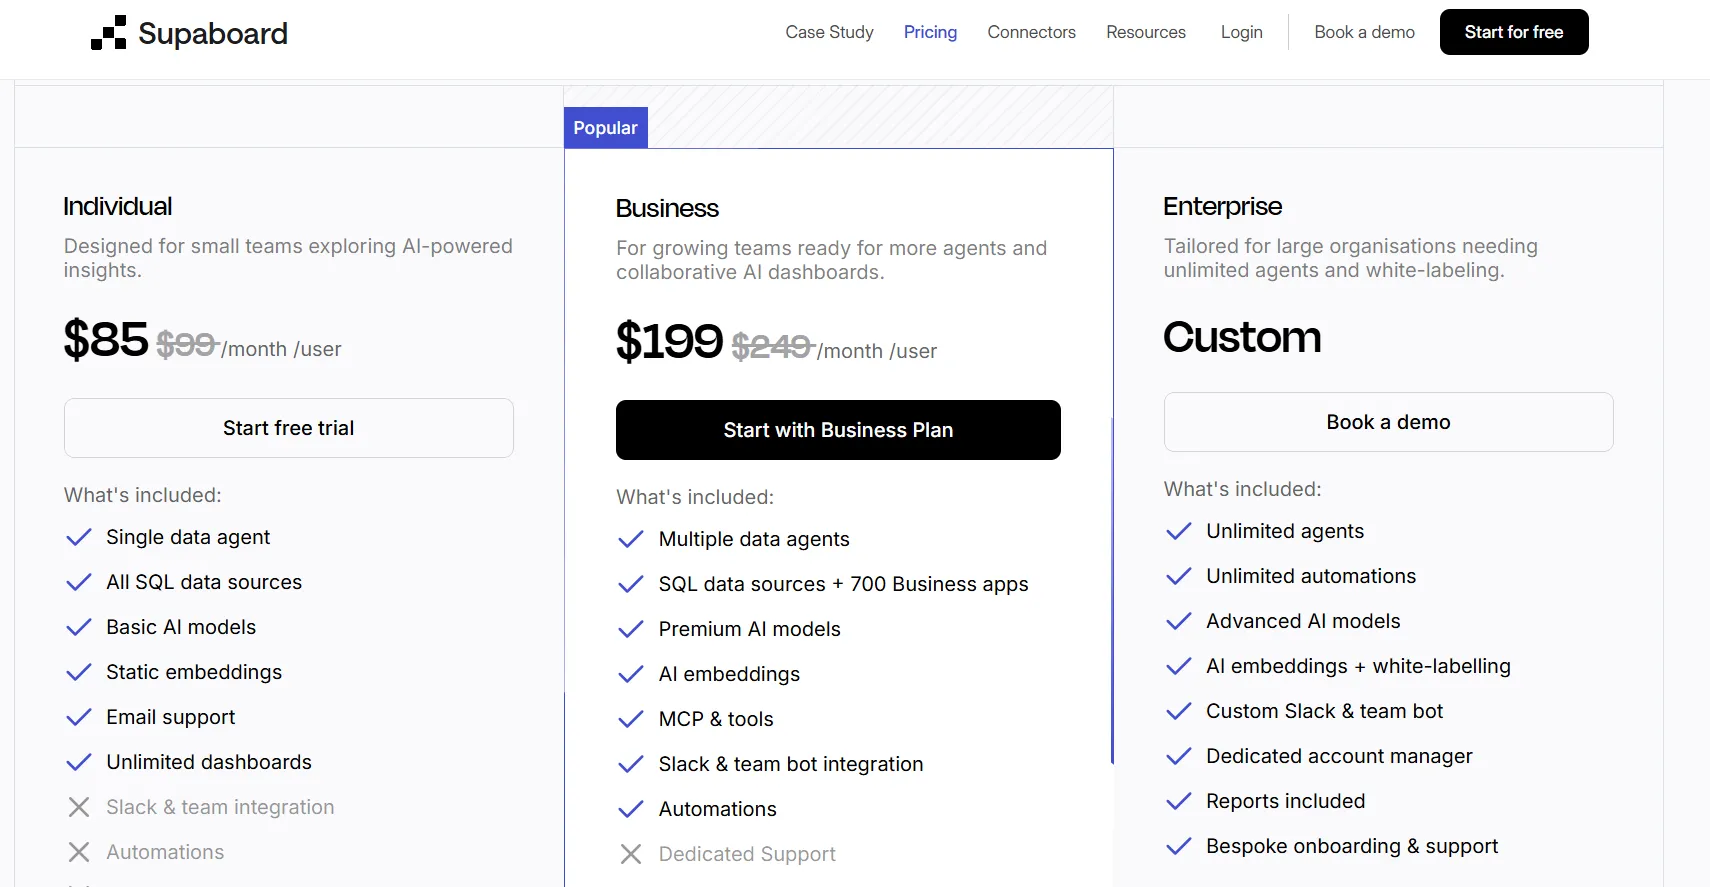
Supaboard runs three tiers:
- Individual: $85/month, for a single user, with advanced AI models, static embeddings, and unlimited dashboards.
- Business: $199/month, adding multiple users, custom agents, AI embeddings, and team bot integrations.
- Enterprise: Custom pricing, with unlimited users and agents, white-labeling, and a dedicated account manager.
Pros and cons
✅ Connecting data sources is fast, even with large CSV and KPI files.
✅ Natural-language querying makes analysis accessible to non-technical users.
❌ Limited dashboard customization options are implied by a G2 review.
#4: Zenlytic
Best for: Analytics teams that need answers they can defend, with the lineage shown on every figure.
Similar to: Dot, ThoughtSpot.
Zenlytic is an AI analytics platform whose agent, Zoë, answers data questions and shows the metrics and logic behind every number.
Its priority is explainability backed by governed metrics.
Metric definitions are fixed in a governed semantic layer, so a given question returns a consistent figure over time, and every result traces back to its source.
Features
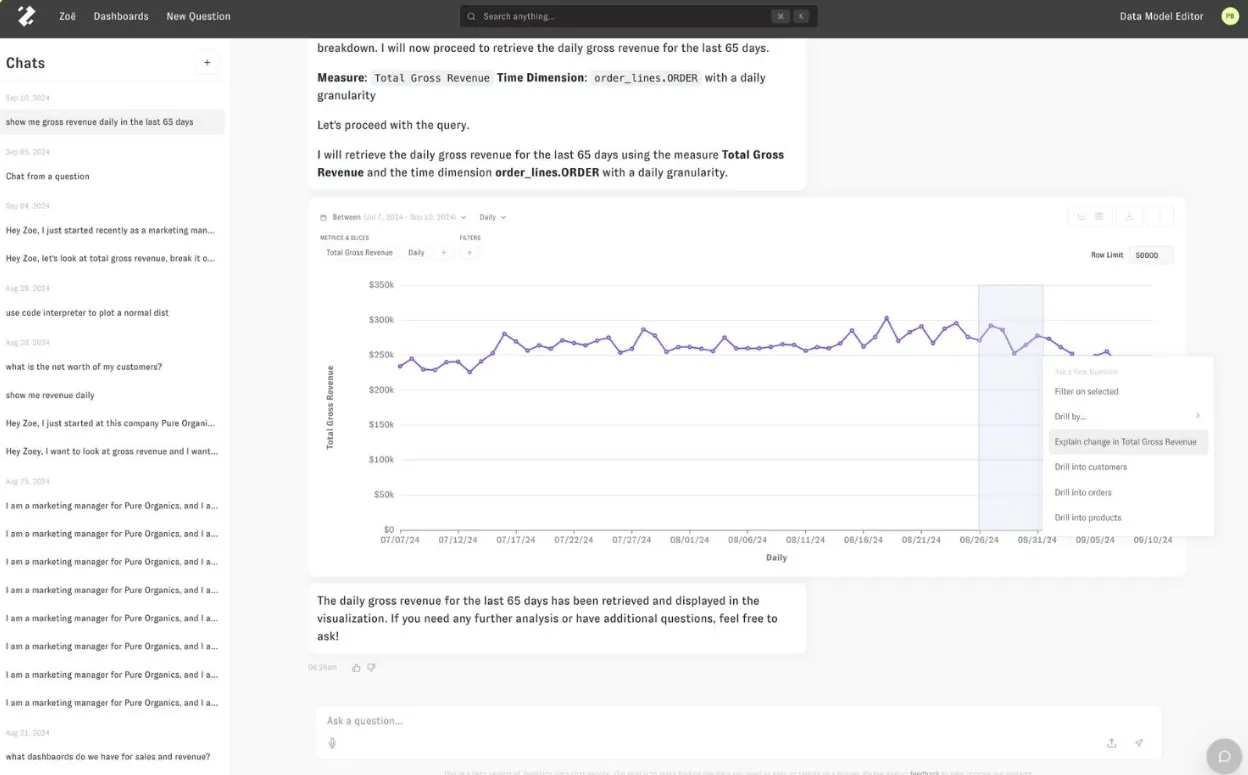
- Zoë, with citations: links each answer to the metrics and logic that produced it, allowing verification before action.
- Memories: lock metric definitions and assumptions so a repeated question returns the same number every time.
- Clarity Engine: an LLM-native semantic layer for defining business logic once and reusing it across queries.
- Living artifacts: decks, financial models, dashboards, and small apps that stay connected to live warehouse data and refresh automatically.
Pricing
Zenlytic does not publish pricing, so evaluating the platform and obtaining a quote requires a demo.
Pros and cons
✅ Explainability is built in, not added as an afterthought.
✅ Onboarding is fast, as the agent learns the data and builds the semantic layer automatically.
❌ Pricing is not public.
#5: Sigma
Best for: Finance and operations people who think in formulas but want warehouse-scale data underneath.
Similar to: Metabase, Holistics.
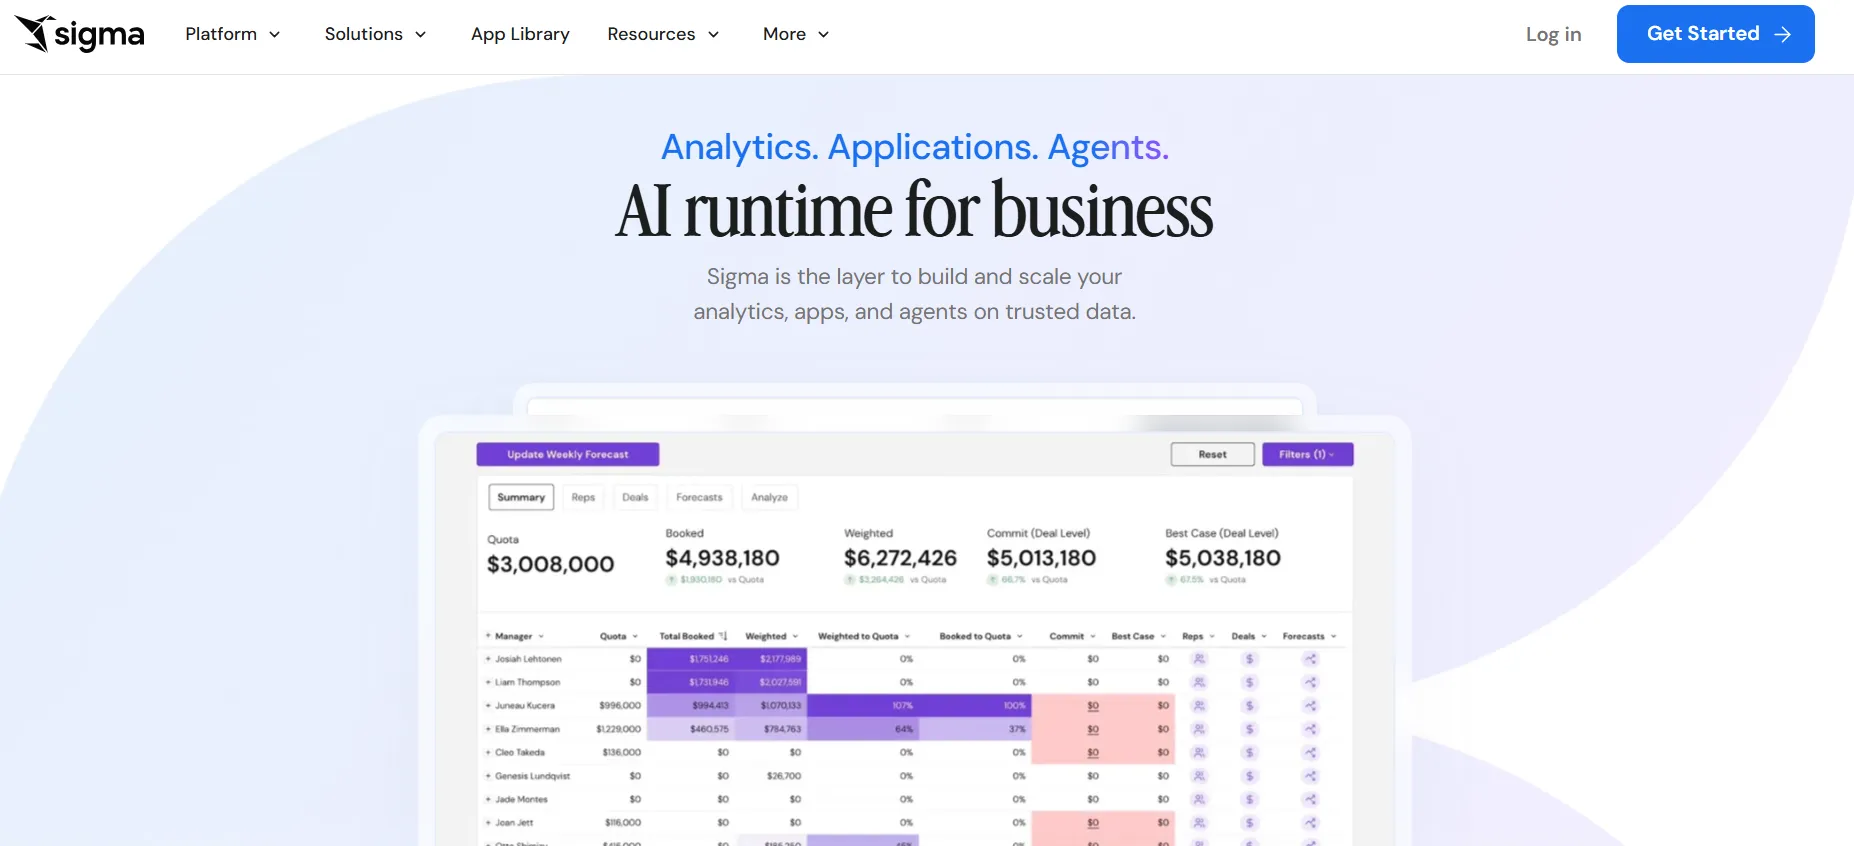
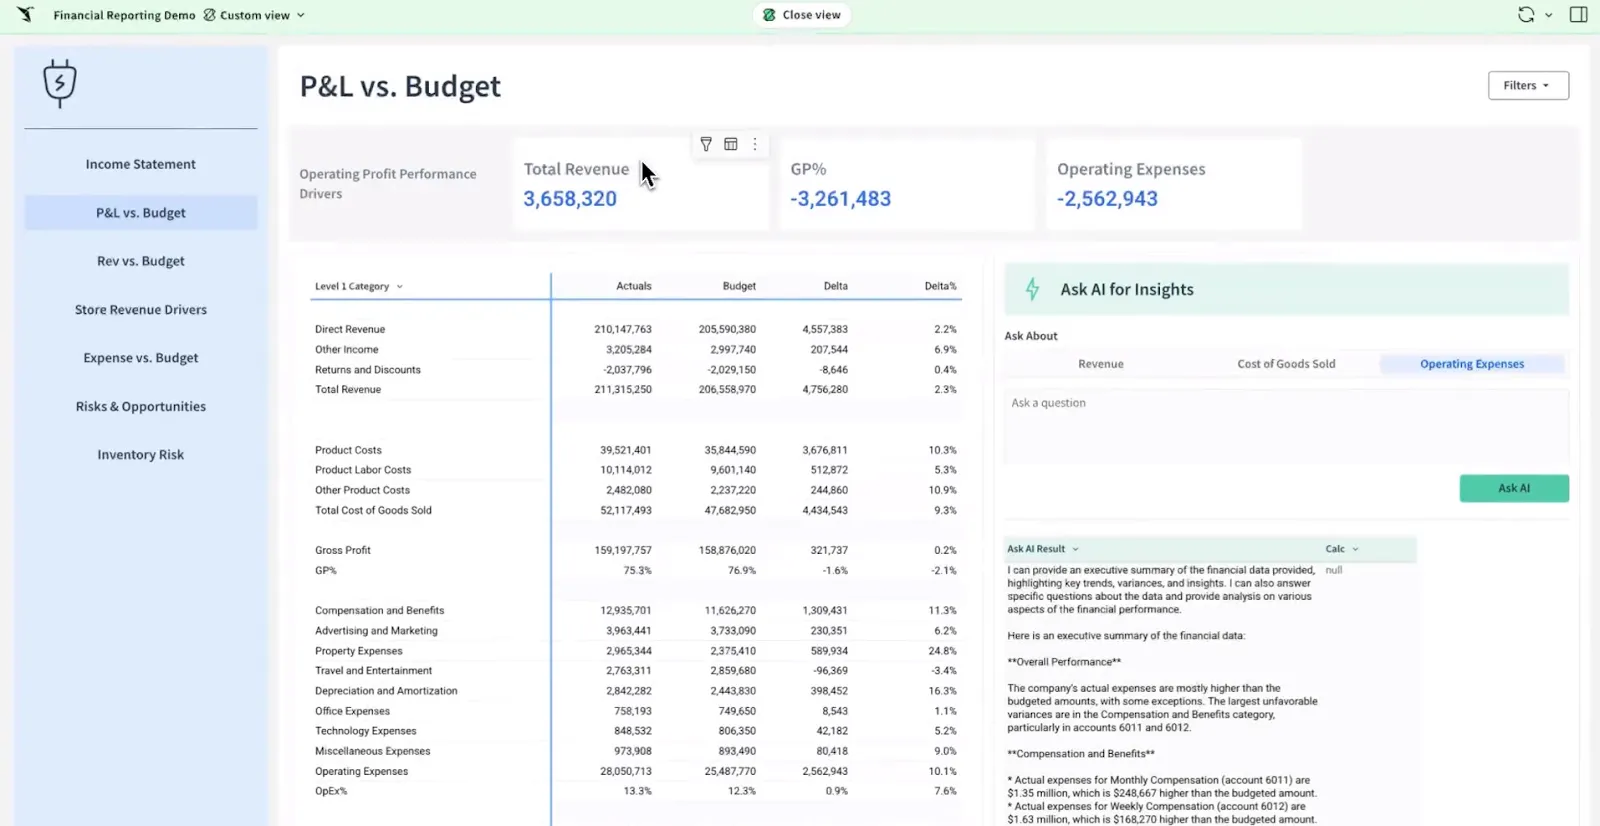
Sigma is a cloud analytics platform that turns your warehouse into a live, Excel-style spreadsheet you can pivot and model in.
It targets finance and operations teams that work in spreadsheets.
Formulas and pivots run on billions of rows directly in Snowflake or BigQuery, with no data extracts and no client software to install.
Features
- Warehouse-backed grid: supports pivots and formulas across billions of rows in an Excel-style interface.
- Ask Sigma: builds a dashboard or summary inside the workbook from a written description.
- Shared workbooks: let a team edit and version the same analysis in one place, with no CSVs to circulate.
- Visual or SQL modeling: builds joins and reusable datasets visually, with SQL available when needed.
Pricing
Sigma does not list prices publicly, so a tailored quote requires contact with sales.
Pros and cons
✅ Direct warehouse querying keeps data current and governed, with no data copied out.
✅ The spreadsheet interface lets finance and operations teams onboard with minimal training.
#6: Metabase
Best for: Startups and lean data teams that want dashboards live this week, with a free self-hosted route.
Similar to: Sigma, Holistics.
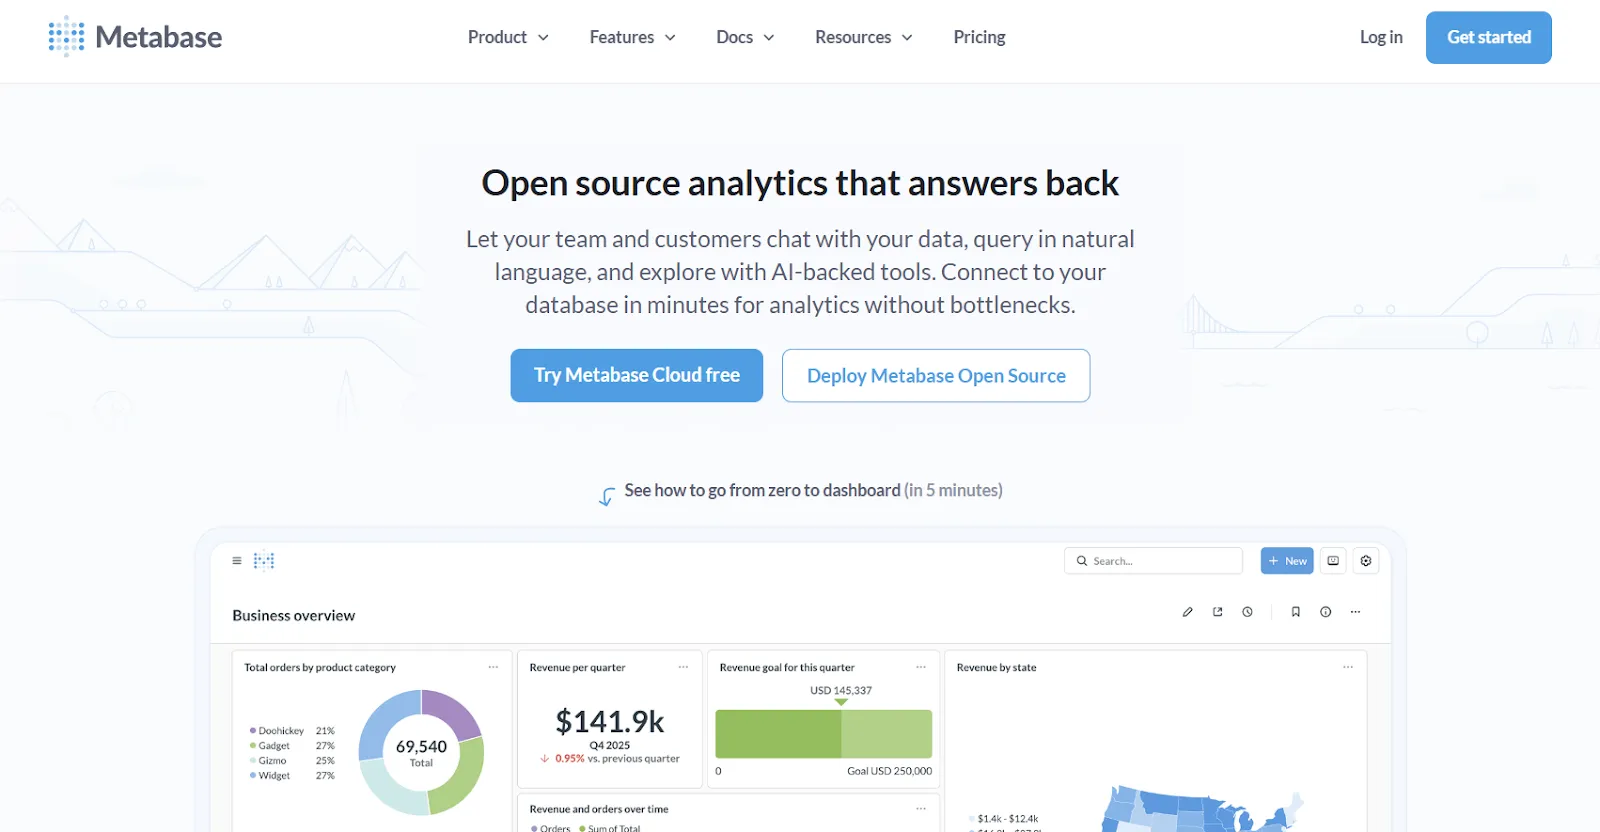
Metabase is an open-source business-intelligence tool for building dashboards and running SQL without much setup or cost.
Deployment is fast and low-cost. Its self-hosted edition is free and connects to a new database within hours, with Metabot AI handling natural-language queries.
Features
- Point-and-click builder: moves through joins and filters visually, with SQL available for complex questions.
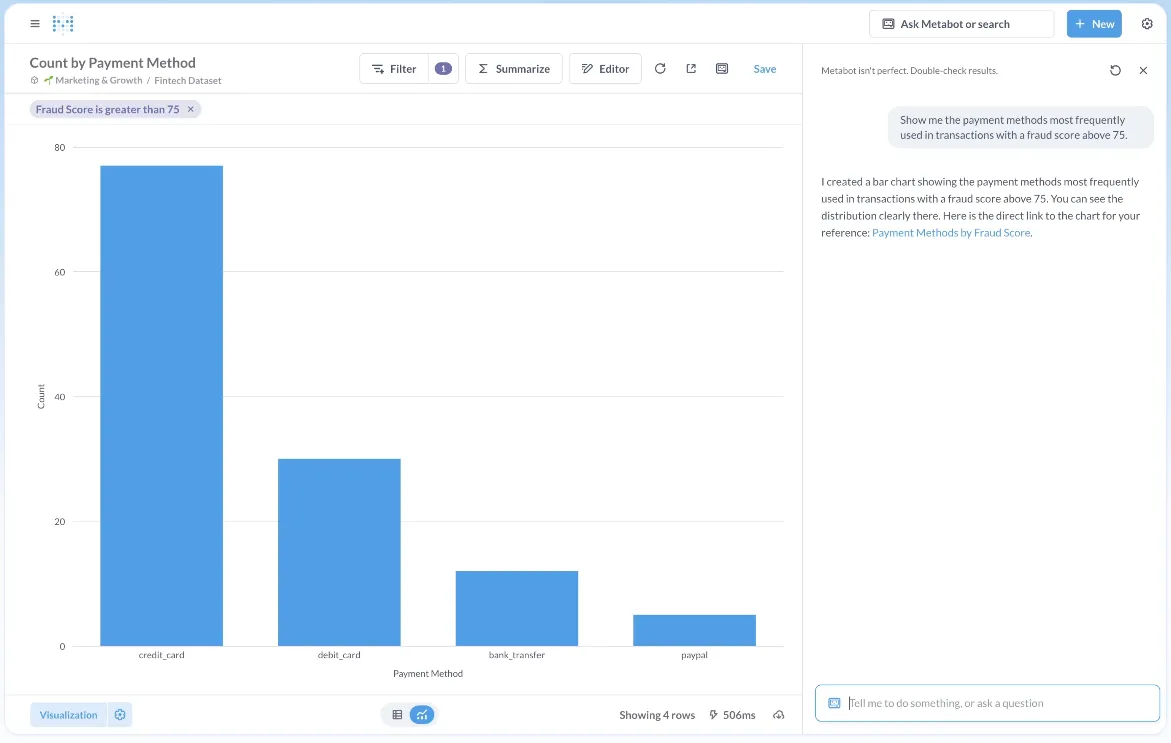
- Metabot and drill-downs: returns a query from a natural-language question and supports click-through into any chart.
- Embedding: places dashboards and charts into internal tools or a customer-facing app, with row-level permissions.
- Built-in sharing: schedules and distributes reports without a separate module.
Pricing
Metabase offers two pricing options depending on how you use the product: internal business intelligence or customer-facing embedded analytics.
- Business Intelligence:
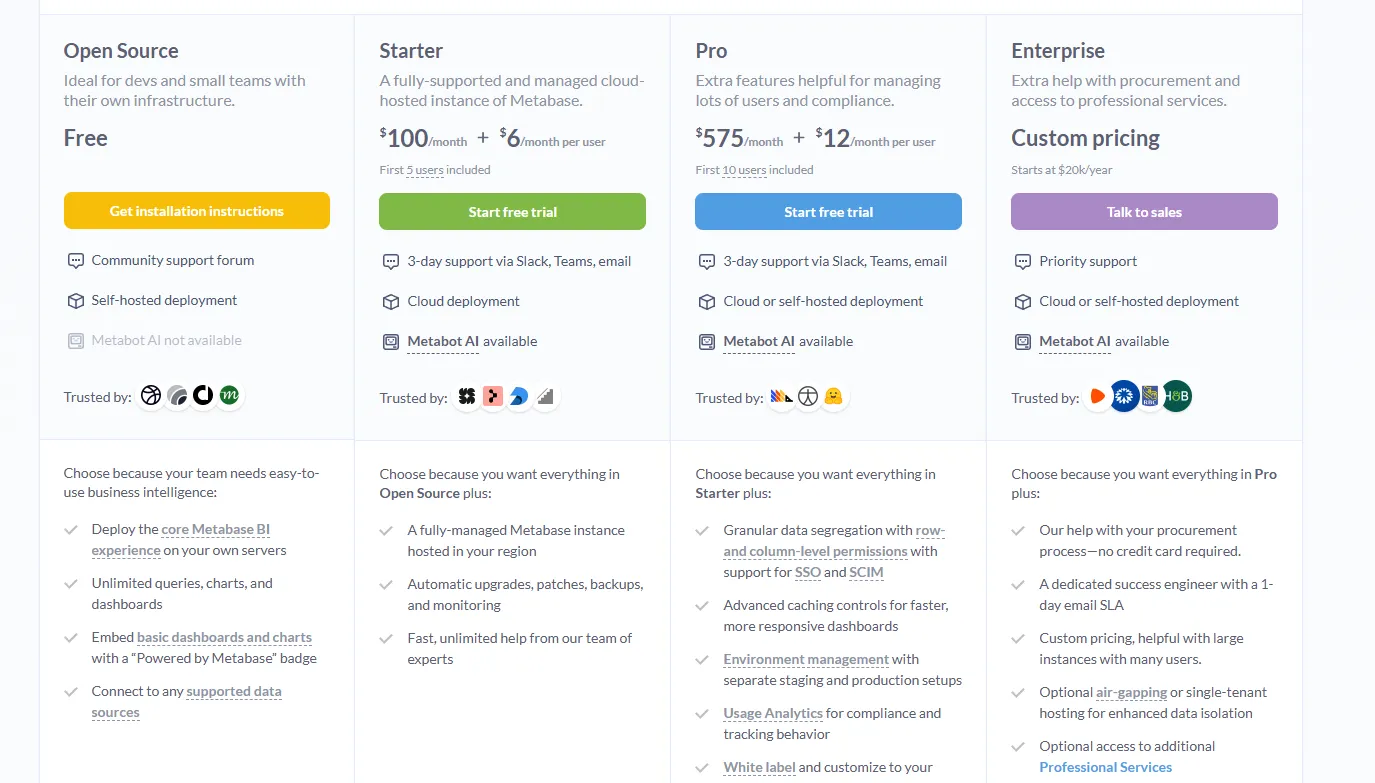
- Open Source (Self-hosted): Free, self-hosted deployment, includes unlimited queries, charts, and dashboards, connects to all supported data sources, basic embedding with “Powered by Metabase” branding, community support only.
- Starter (Cloud-hosted): $100/month + $6/user/month, first 5 users included, includes everything in Open Source, plus option to include Metabot AI (charged extra), automatic upgrades, backups, and monitoring, support via Slack, Teams, and email (3-day SLA).
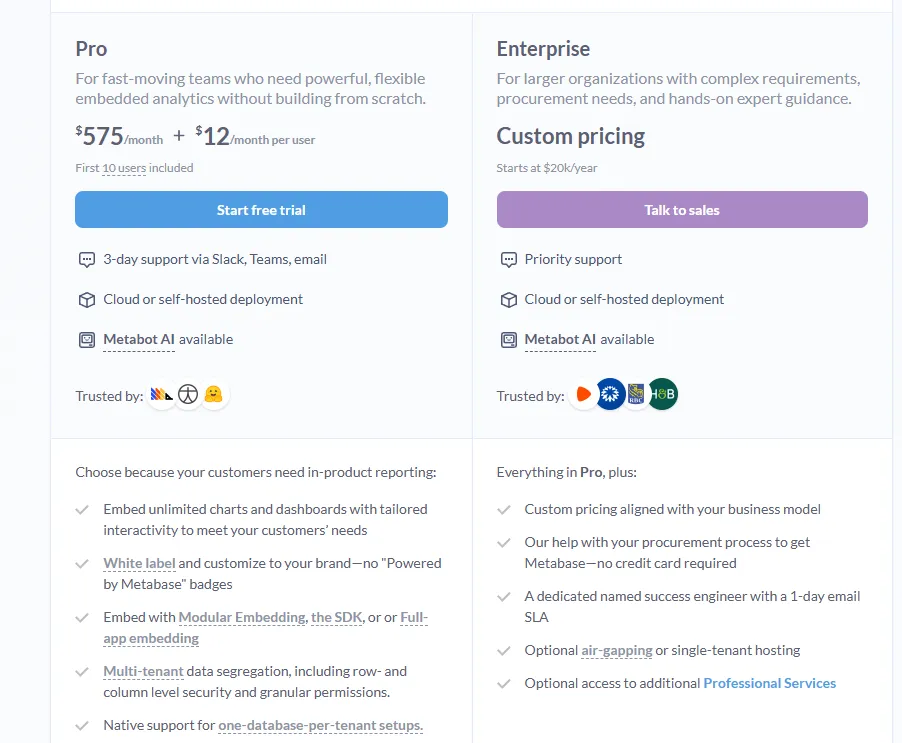
- Pro: $575/month + $12/user/month, first 10 users included, cloud or self-hosted deployment, includes everything in Starter, plus row- and column-level permissions, SSO and SCIM support, advanced caching and performance controls, staging + production environments, usage analytics and audit visibility, white-labeling, and embedded analytics capabilities.
- Enterprise: Custom pricing (starts at $20k/year), includes everything in Pro, plus priority support, dedicated success engineer (1-day email SLA), optional single-tenant or air-gapped deployment, and optional professional services.
- Embedded Analytics pricing:
- Pro: $575/month + $12/user/month, first 10 users included, includes unlimited embedded dashboards and charts, full white-labeling, modular embedding, SDK, or full-app embedding, multi-tenant security (row- and column-level), one-database-per-tenant support, staging + production environments, usage analytics, internal BI for your team, and option to include Metabot AI (charged extra).
- Enterprise: Custom pricing (starts at $20k/year), includes everything in Pro, plus a dedicated success engineer, priority support, optional single-tenant or air-gapped hosting, and optional professional services.
Pros and cons
✅ The self-hosted open-source edition has no licensing cost.
✅ Initial setup is fast.
❌ A user on G2 believes that Metabase could benefit from having an AI assistant that understands the databases and assists in building queries
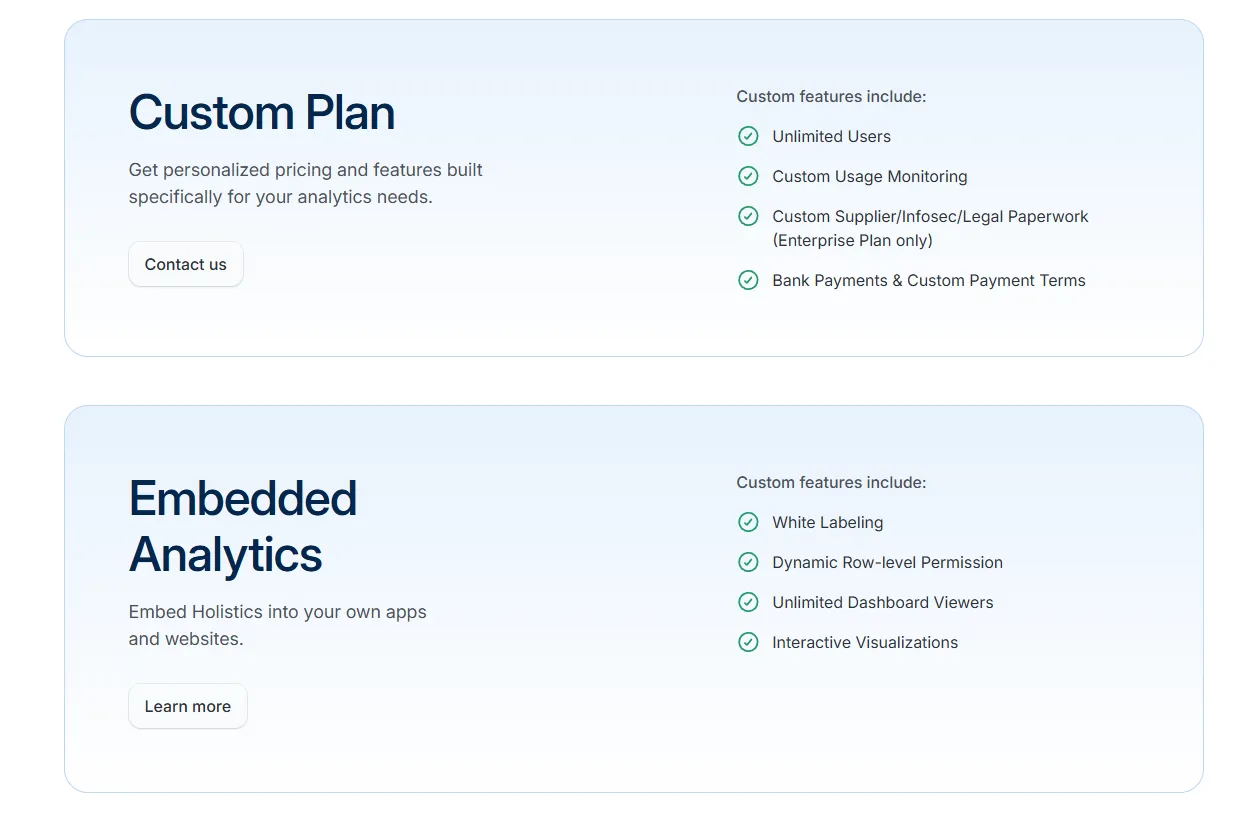
#7: Holistics
Best for: Teams tracking their data models in Git while non-technical users self-serve reports.
Similar to: Sigma, Metabase.
Holistics is a business intelligence platform that keeps your metric definitions in one modeled layer analysts manage like code.
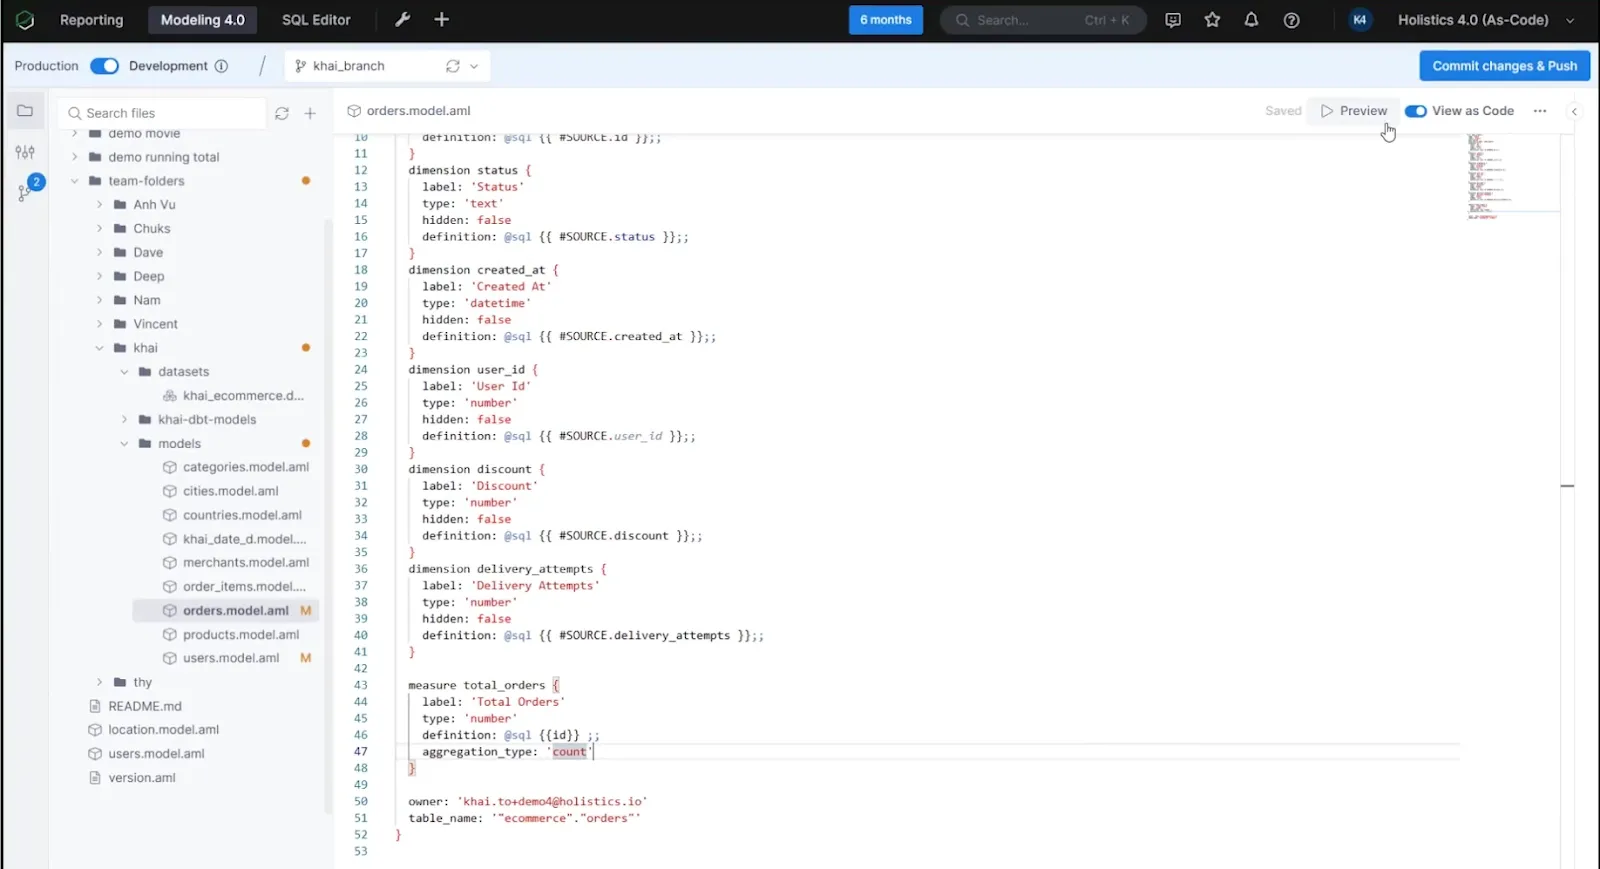
Datasets and logic are written in a declarative language and version-controlled in Git, while business users build reports from the governed model.
Features
- Self-service for business users: builds reports and dashboards from governed, pre-defined metrics.
- Analytics-as-code: defines datasets and logic in a declarative language or SQL, committed to Git for review.
- Central modeling: defines metrics, joins, derived tables, and transformations once for consistency across reports.
- Canvas dashboards: assembles drill-down dashboards on top of the modeled layer.
Pricing
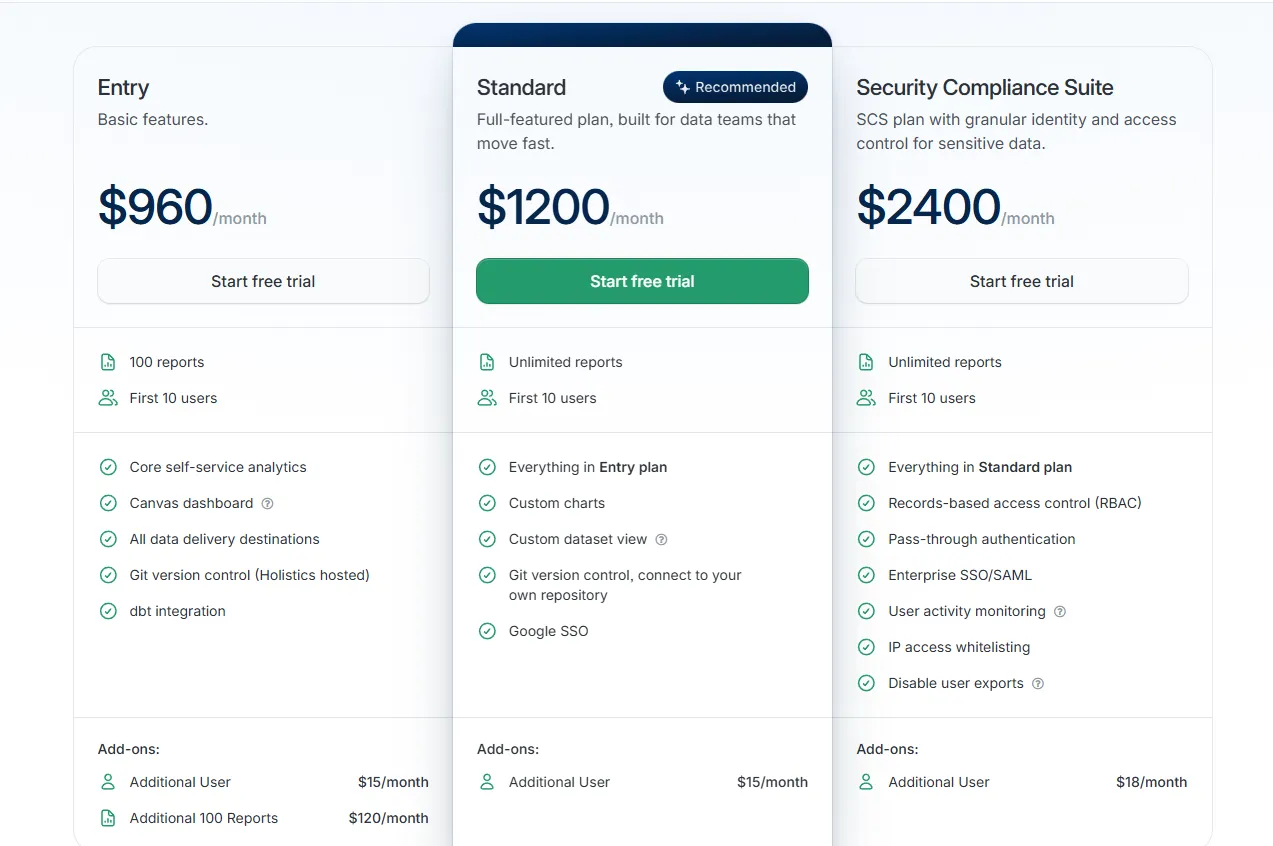
Holistics prices by reports and users, with security add-ons on top.
- Entry: $960/month, with 100 reports, 10 users, and dbt integration.
- Standard: $1,200/month, adding unlimited reports, custom charts, and your own Git repository.
- Security Compliance Suite: $2,400/month, adding RBAC, enterprise SSO, and activity monitoring.
- Custom: tailored pricing for unlimited users and advanced compliance.
Pros and cons
✅ Analytics-as-code with Git version control brings engineering rigor that is uncommon among BI tools.
✅ Dashboards support deep drill-down on top of the governed semantic layer.
❌ Starts from $960/month, which can be expensive for SMEs.
#8: Microsoft Power BI
Best for: Organizations already on Microsoft 365.
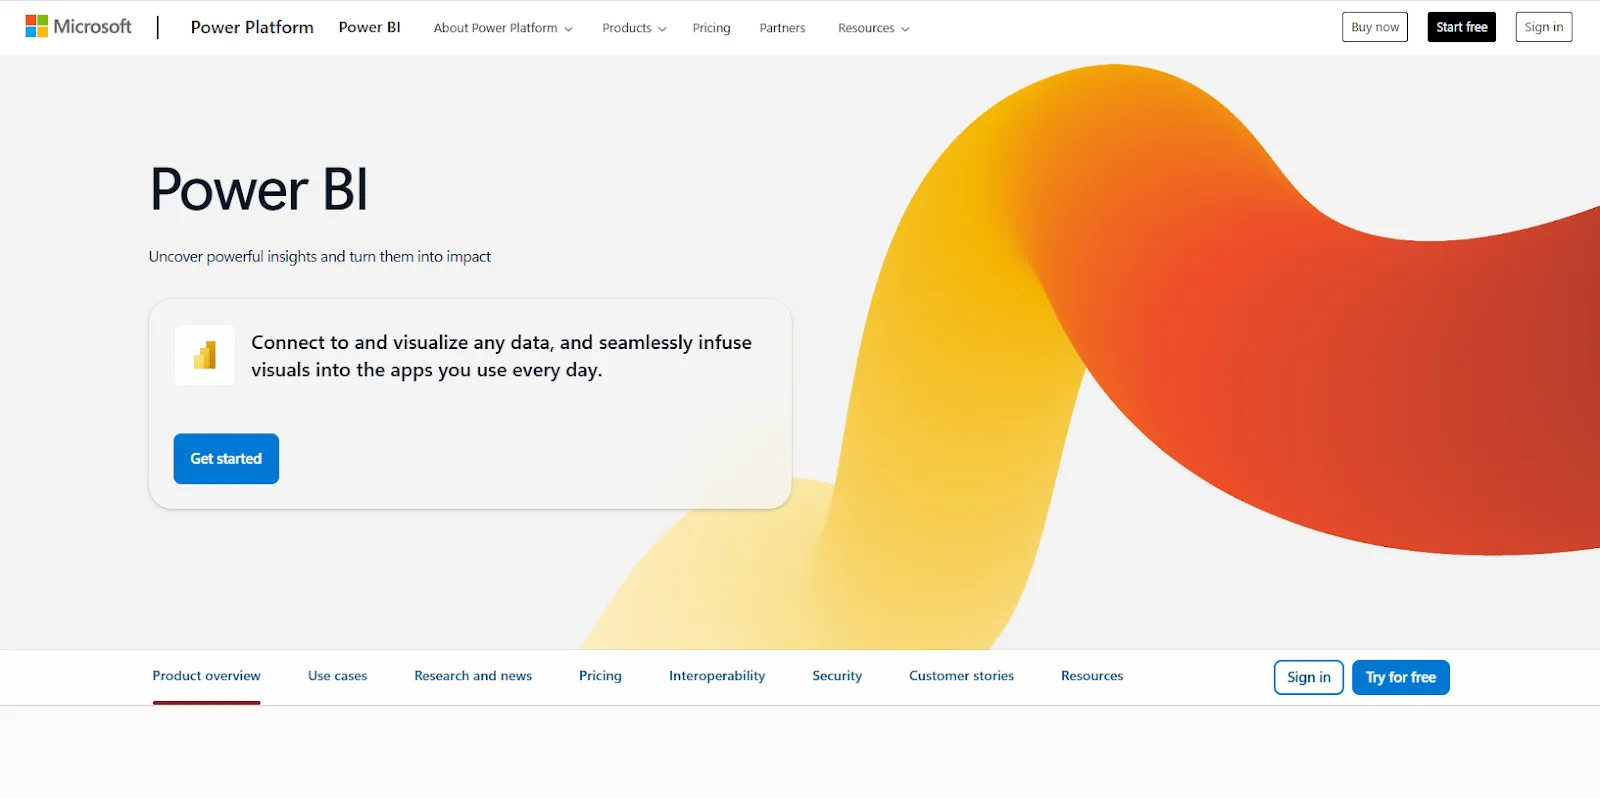
Microsoft Power BI is Microsoft's own business-intelligence platform, built for interactive reporting and self-service analytics across a whole organization.
Its main advantage is native integration with Microsoft 365.
Features
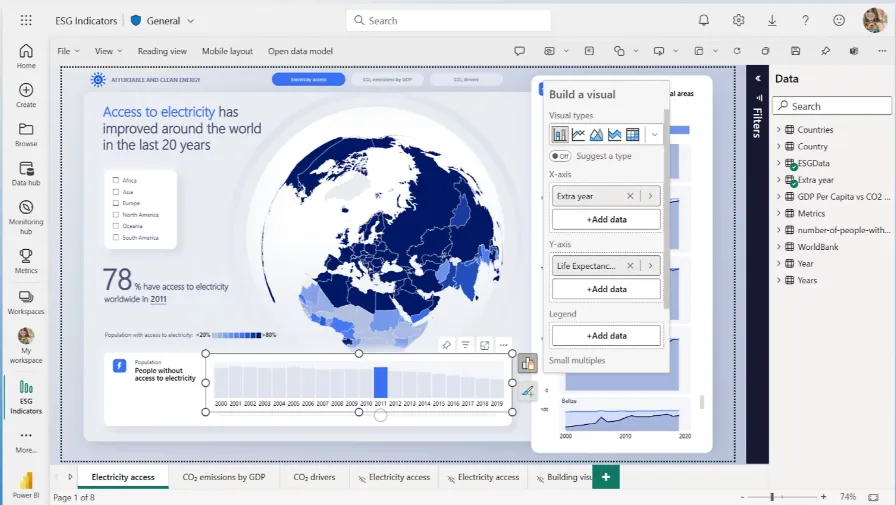
- Org-wide reports: combines visuals, filters, drill-throughs, and bookmarks, then publishes the result organization-wide.
- Copilot: drafts forecast commentary and flags anomalies that warrant review.
- Built into Microsoft: Direct ties into Excel and Teams that competitors have to put in work to rival.
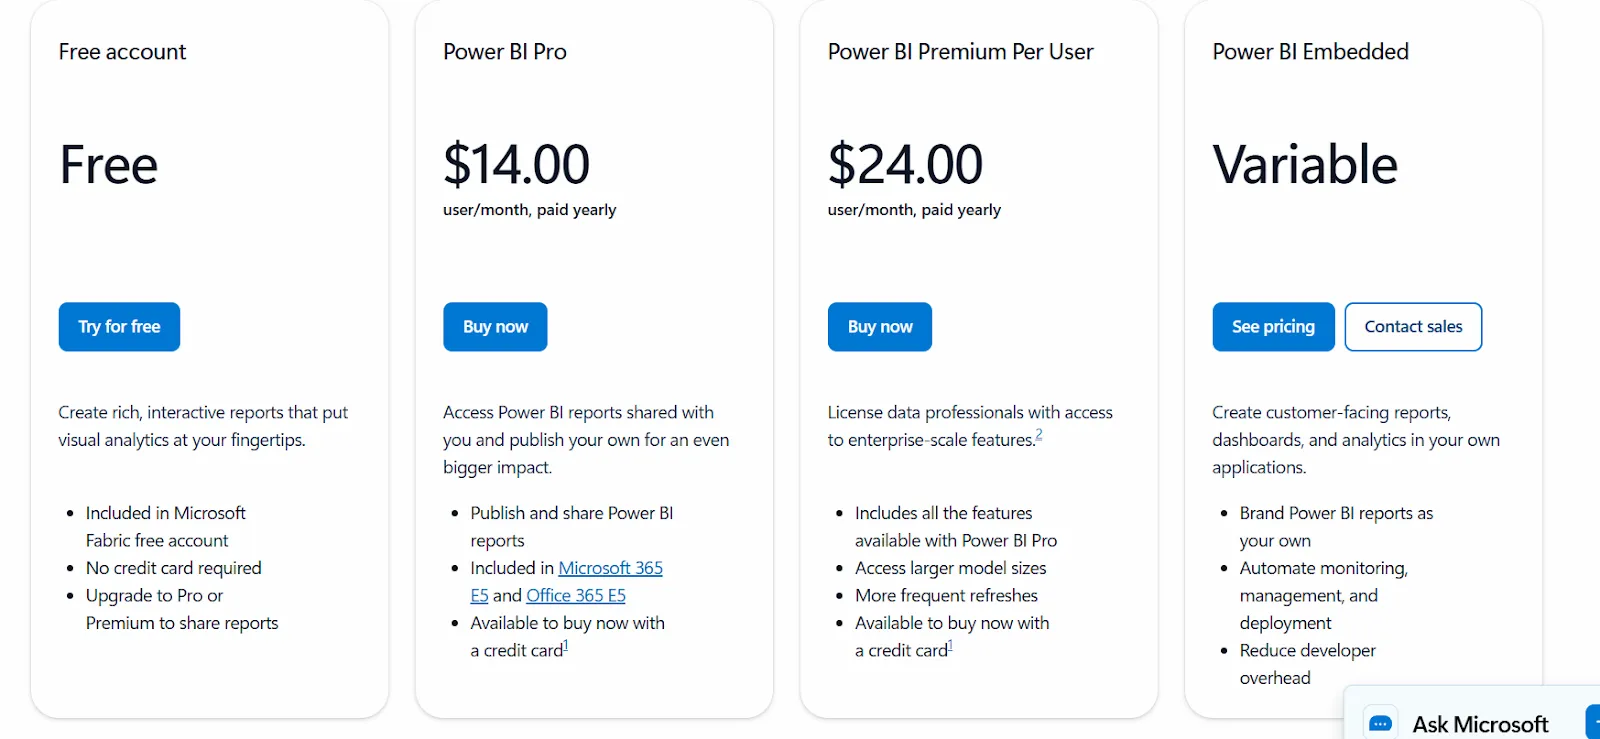
Pricing
Power BI uses a per-user and capacity-based model:
- Free: build personal reports and dashboards, with no sharing.
- Power BI Pro: $14/user/month, with publishing, workspace sharing, and Teams or SharePoint embedding.
- Power BI Premium Per User: $24/user/month, adding larger models, more refreshes, and AI features.
- Power BI Embedded: custom pricing for customer-facing analytics in your own apps.
Pros and cons
✅ Reports publish reliably across an entire organization.
✅ Excel and Teams integration is a clear advantage for Microsoft 365 organizations.
❌ Advanced capabilities are locked behind Premium tiers.
#9: Tableau
Best for: Analysts and large organizations where the visualization itself has to carry the story.
Similar to: Power BI, Domo.
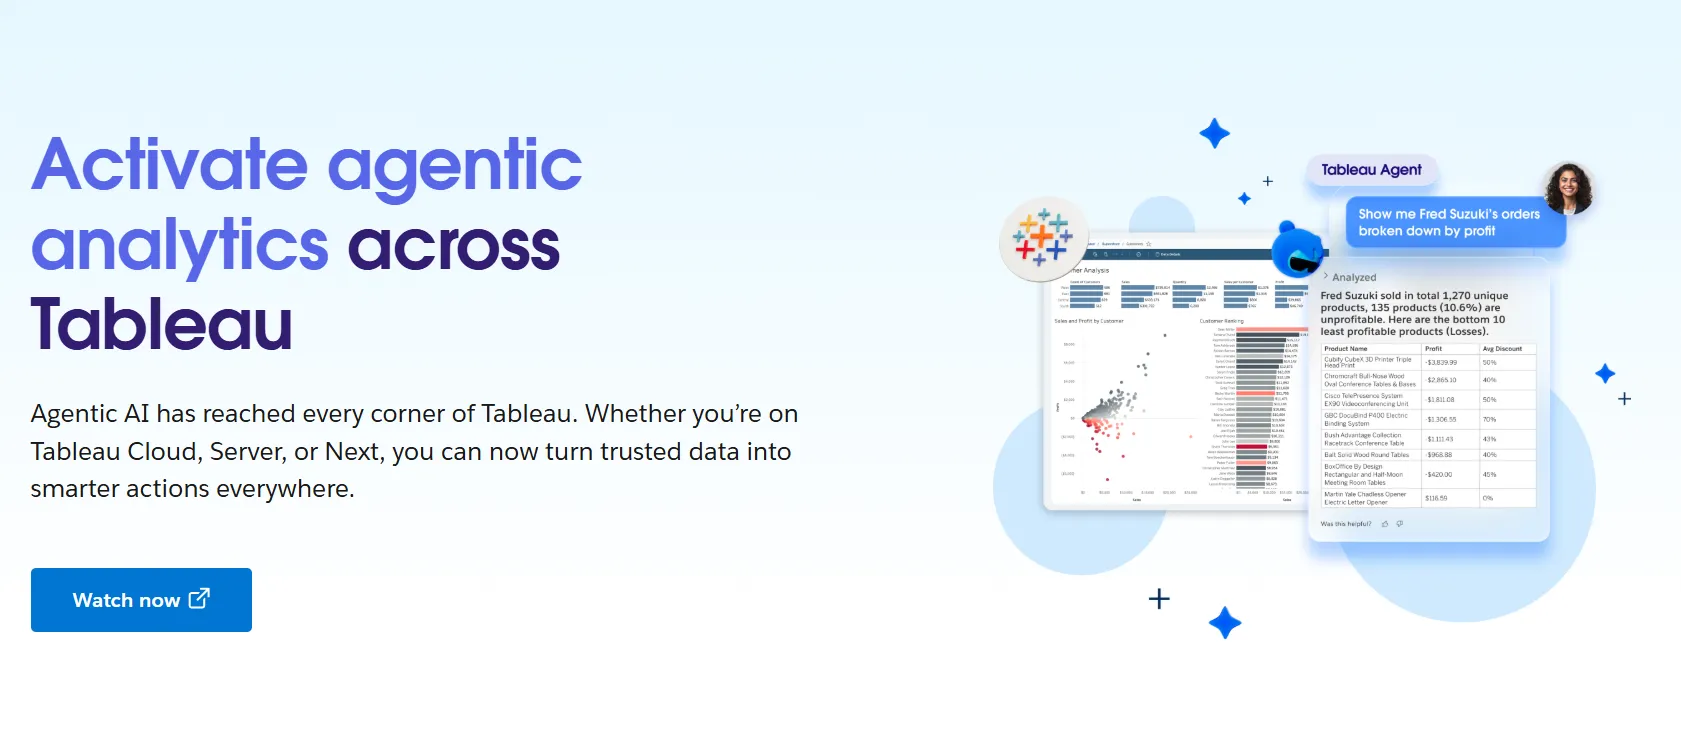
Tableau is a business intelligence platform known for turning data into detailed, interactive visualizations.
Analysts can build views on a drag-and-drop canvas, and Tableau Next adds Agentforce natural-language querying and AI agents, accessible from Slack and Salesforce.
Features
- Visual analytics: builds interactive dashboards on a drag-and-drop canvas, with a wide chart library and detailed filtering.
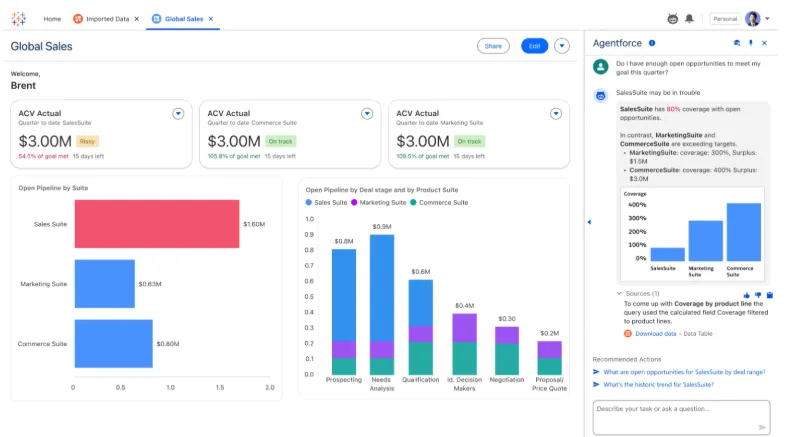
- Tableau Next: answers natural-language questions from Slack or Salesforce through AI agents.
- Tableau Pulse: provides shared metric definitions and role-based access for larger deployments.
- Deployment options: runs on Tableau Cloud or on self-managed servers.
Pricing
Tableau uses per-user, per-month pricing, with separate plans depending on whether you deploy Tableau in the cloud, on your own servers, or as part of its newer AI-driven offering:
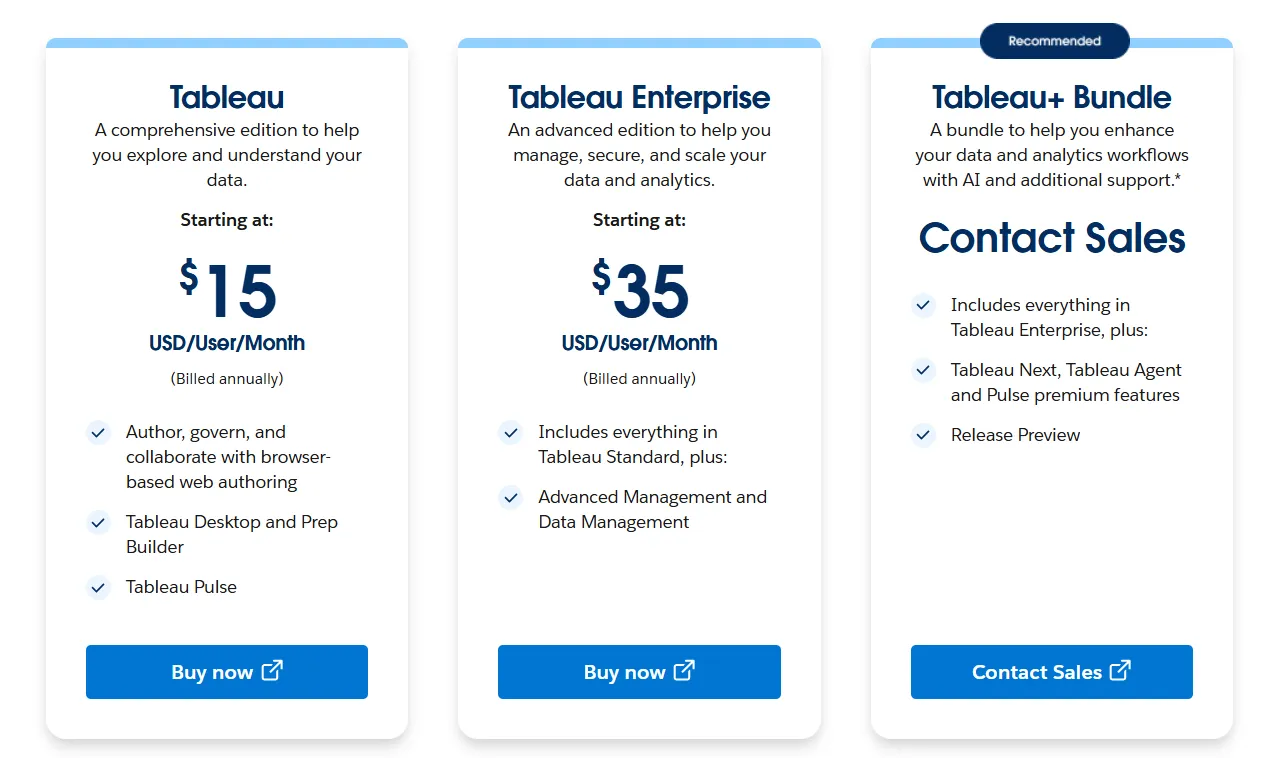
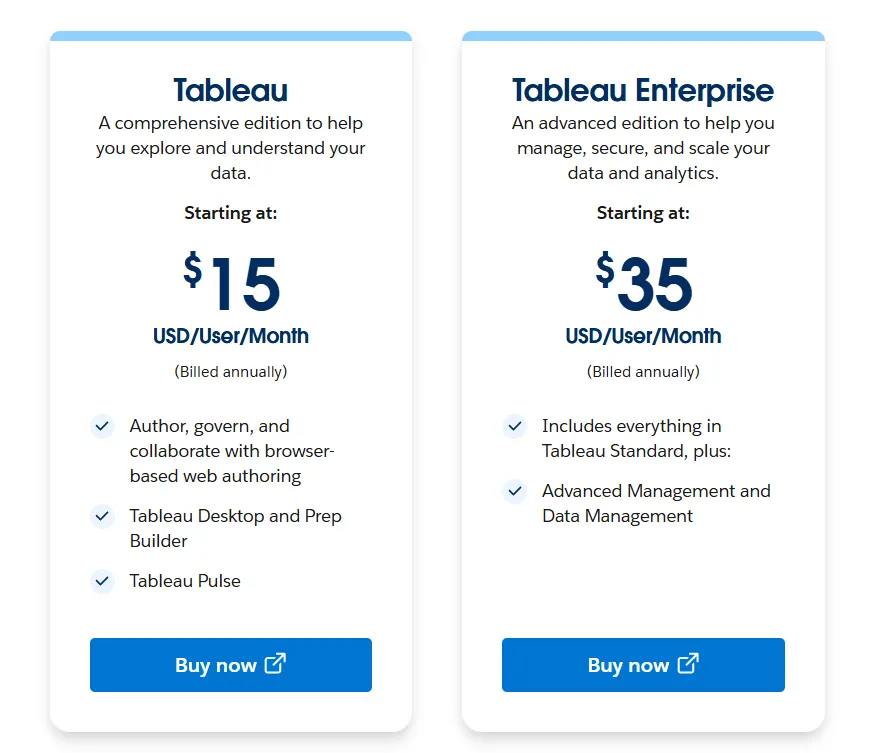
- Tableau Cloud has three pricing plans:
- Tableau Standard: Starts at $15/user/month, which includes browser-based authoring and collaboration, Tableau Desktop and Prep Builder, Tableau Pulse for metrics and insights.
- Tableau Enterprise: Starts at $35/user/month and includes everything in Standard, plus Advanced Management and Data Management for governance and scale.
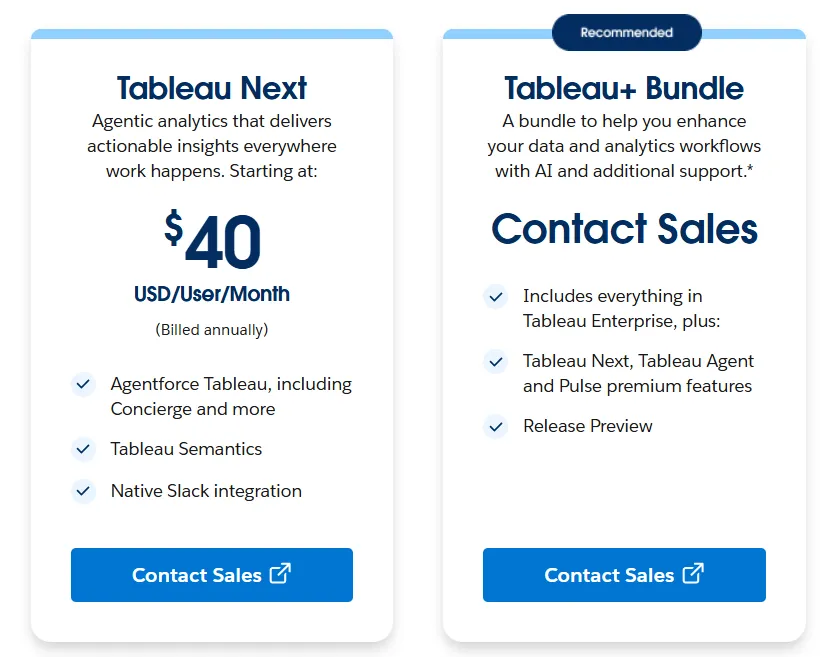
- Tableau+ Bundle (Cloud + AI): Custom pricing, includes everything in Tableau Enterprise, plus Tableau Next, Tableau Agent, and Pulse premium features, with access to release previews and early AI capabilities.
- Tableau Server has two pricing plans:
- Tableau Standard: Starts from $15 per user/month, which includes authoring, governance, and collaboration and Tableau Desktop and Prep Builder.
- Tableau Enterprise: Starts from $35 per user/month, which includes everything in Standard, plus Advanced Management, Data Management, and eLearning.
- Tableau Next (agentic analytics) has 2 plans:
- Tableau Next: Starts from $40/month/seat, and includes Agentforce Tableau, Tableau Semantics, and its Native Slack integration.
- Tableau + Bundle: Custom pricing, which includes everything in Tableau Enterprise, plus Tableau Next, Tableau Agent and Pulse premium features.
Pros and cons
✅ Visualization depth is among the best available in BI.
✅ A large user community provides extensive tutorials and certification paths.
❌ Per-user pricing can scale fast for organizations rolling out broadly.
#10: Domo
Best for: Mid-market and enterprise teams that want the whole analytics pipeline in one place, from integration through to automation.
Similar to: Power BI, Tableau.
Domo is a cloud analytics platform that runs the whole chain, from pulling raw data in to building the dashboards and AI-driven actions on top of it.
Features
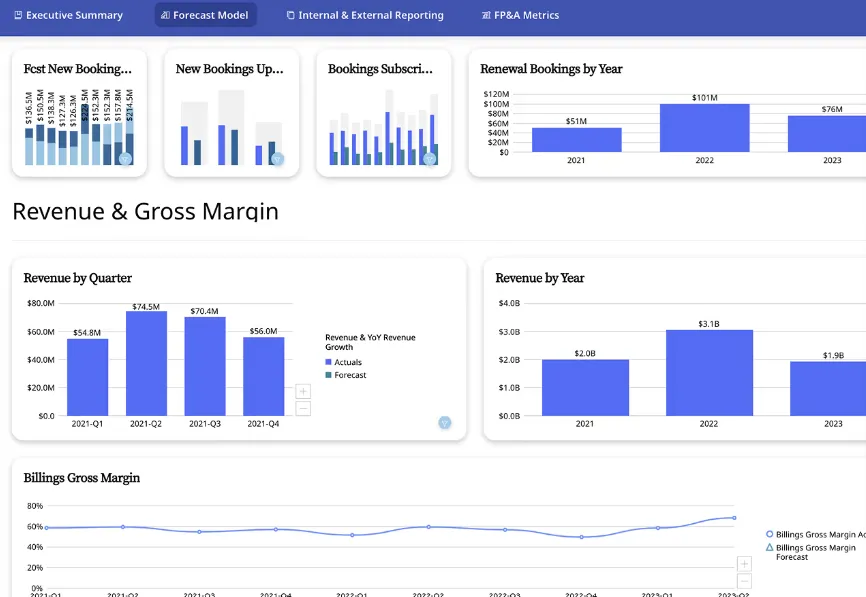
- Cards and data apps: assembles reports as cards, with no-code apps for planning or monitoring on top.
- Conversational AI and agents: answers natural-language questions and can monitor a metric to push alerts when it moves.
- App studio: builds planning or forecasting apps with minimal engineering.
- Broad connectors: provides an extensive connector catalog to keep ingestion from blocking the work.
Pricing
Domo runs one paid plan plus a free trial.
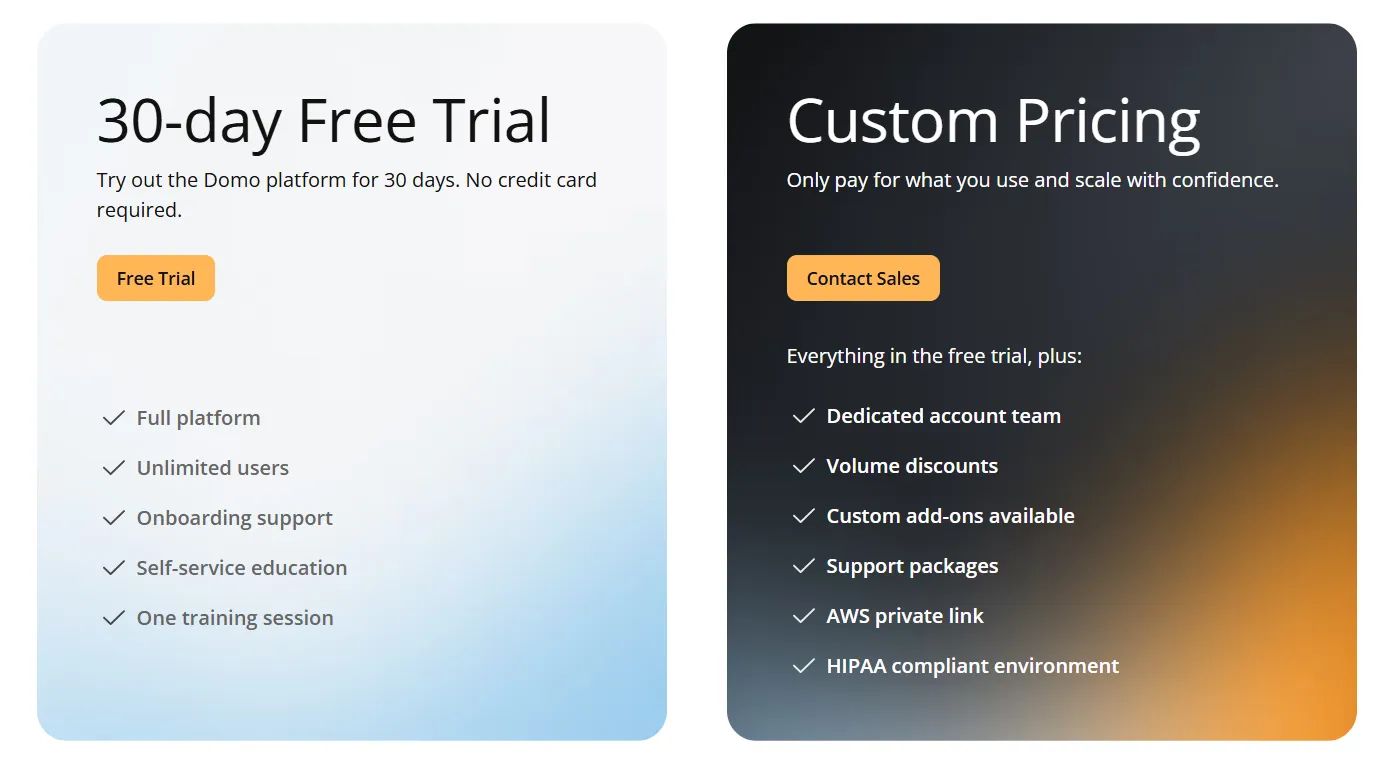
- Free trial: 30 days, no credit card needed, with full platform access for unlimited users and a guided training session.
- Paid plan: usage-based pricing that scales with analytics needs, adding a dedicated account team, volume discounts, and support packages.
Pros and cons
✅ It covers ingestion through automation in one platform, removing the need for separate tools.
✅ An extensive connector catalog simplifies data ingestion.
Get started with Dot for free
If your team spends more time writing notebooks and assembling decks than acting on the findings, well, you can stop doing that with Dot, as the analysis happens before someone has to write it up.
Here’s what you get with Dot:
- Slack and Teams for asking questions, with answers and scheduled reports delivered there, in email, or in the web app.
- Recurring business reviews automated end-to-end and delivered as scheduled PowerPoints.
- A persistent Context Agent that keeps metric definitions consistent across teams.
- Inspectable audit trails on every output, with one click back to the query and the data.
- Native connections to Snowflake, BigQuery, Redshift, Databricks, and a range of other warehouses, databases, and SaaS sources.
- Compatibility with existing dbt, Looker, and Power BI modeling work, no migration required.
- SOC 2 Type II compliance and enterprise-grade access controls.
- Usage-based pricing that scales with usage, not seats.
➡️ Get started for free with Dot's free plan, or schedule a demo to see how it works with your data.
⚠️ Disclaimer: This article was last updated on June 23, 2026. If you spot any inaccuracies, contact us, and we'll fact-check it.
Theo Tortorici
Theo writes about AI-powered analytics, data tools, and the future of business intelligence at Dot.