
10 Best Hex Alternatives & Competitors In 2026
This guide reviews the 10 best Hex alternatives in 2026 for data and analytics teams, grouped by how they work, with a clear read on what each tool does and what it costs.
TL;DR
- Dot is the best Hex alternative in 2026 for data and analytics teams that want written analysis delivered into Slack, Microsoft Teams, email, or the web app, scheduled executive reports built as PowerPoints, a Context Agent that keeps metric definitions aligned, and a clickable audit trail under every number.
- For conversational analytics, ThoughtSpot and Supaboard come at the same problem from opposite ends of the market, while Zenlytic puts the lineage behind each answer front and center.
- Teams that prefer hands-on work with their own data have Sigma and Metabase for self-service exploration, and Holistics for governed modeling that is version-controlled in Git.
- Among the platforms most large organizations already run, Microsoft Power BI and Tableau still anchor a lot of reporting, and Domo folds the whole pipeline into one workspace.
What are the best Hex alternatives in 2026?
The best alternatives to Hex in 2026 are Dot, with its AI data analyst that can be accessed through Slack & Microsoft Teams, ThoughtSpot, and Supaboard.
Here is the full shortlist, with a one-line read on who each tool suits and what it costs.
Tool | Use case | Price |
Dot | An AI data analyst that hands back written analysis and scheduled executive reports across Slack, Teams, email, and the web. | Free plan; paid from $180/month. |
ThoughtSpot | An agentic analytics platform with natural-language search and agents that build analyses and dashboards from a question. | From $25/user/month (annual). |
Supaboard | An AI agent (Stella) that connects to your sources and builds dashboards and answers with no setup phase. | From $85/month. |
Zenlytic | An AI analyst (Zoë) with a governed semantic layer that shows the lineage behind every number. | Pricing not public. |
Sigma | Spreadsheet-style analysis on live warehouse data, built for finance and operations teams. | Pricing not public. |
Metabase | Open-source BI for fast, lightweight dashboards and self-serve querying. | Free (open source); Cloud from $100/month. |
Holistics | A code-based semantic layer with Git-versioned modeling and governed self-serve. | From $960/month. |
Microsoft Power BI | Standardized reporting and self-service analytics for organizations already on Microsoft 365. | Free plan; Pro from $14/user/month. |
Tableau | Deep visual analytics and storytelling, now with agentic answers through Tableau Next. | From $15/user/month. |
Domo | An all-in-one cloud platform tying data integration, dashboards, apps, and AI into one place. | Custom pricing (free trial). |
What are the best AI data analyst alternatives to Hex that deliver the answer?
The tools here come closest to what Hex's agent promises: you ask a question, and the platform runs the analysis:
#1: Dot
Dot is the best Hex alternative in 2026 for data and analytics teams that want the finished analysis handed to them in Slack or Microsoft Teams, with scheduled executive reports, a shared definition layer, an audit trail under every number, and a recommendation attached to each answer.
Disclaimer: Even though Dot is our platform, I’ll still build an argument into why our BI tool is the best Hex alternative on the market in 2026.
You connect a warehouse once, then your team asks questions and gets a written answer back, the way you would put a question to a colleague who knows the data.
Here is what that looks like in practice:
Ask a question in Slack or Teams and get the analysis back
Dot lets your team ask detailed business questions in Slack or Microsoft Teams, and it replies in the same thread with a written analysis and a short recommendation, the figures included.
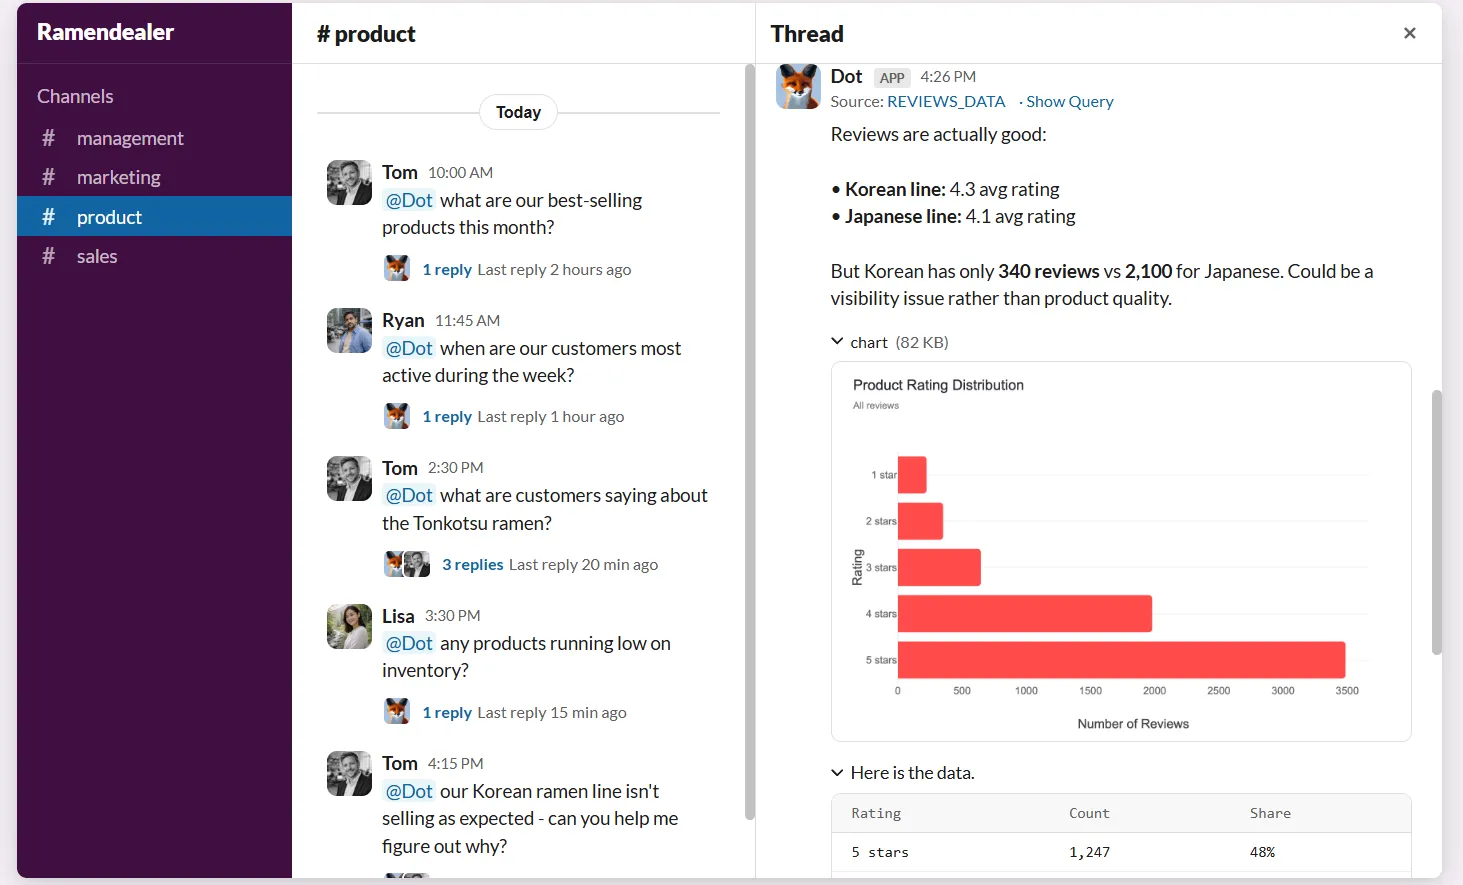
Picture your head of support flagging the channel on a Tuesday because the ticket backlog keeps climbing and nobody can say why.
They type the question the way they would message a teammate, and within a few minutes Dot replies with which queues grew and which accounts dragged the number.
There is no dashboard to open and no SQL to write.
Business users get an answer without learning a query language, and the data team stops fielding the same manual pulls.
Scheduled business reviews that write themselves
Dot generates recurring business reviews on a schedule you set, querying live warehouse data and turning it into an executive-ready PowerPoint with the period-over-period numbers and a written read on what moved.
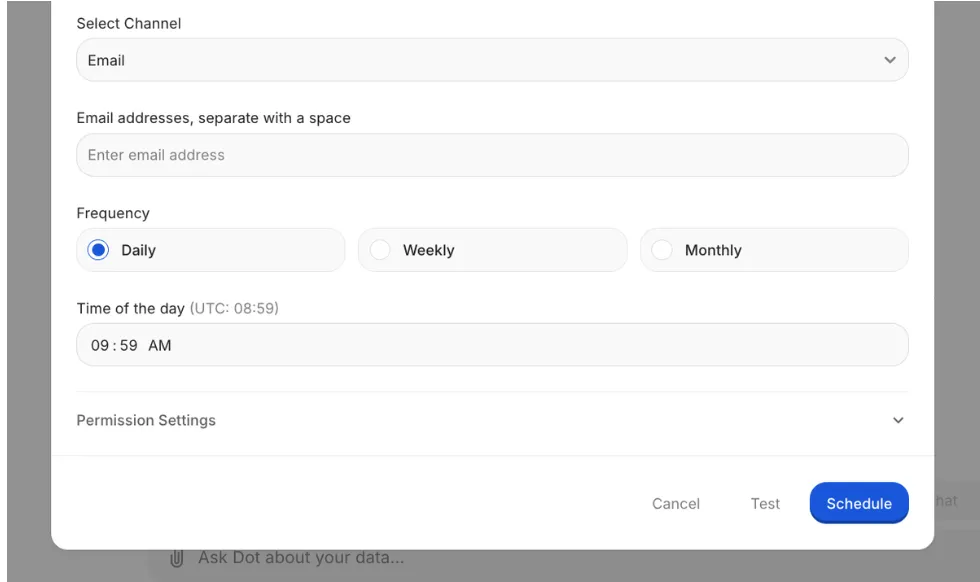
The monthly review usually means an afternoon of rebuilding the same charts and rewriting the previous period's notes by hand.
With Dot, you set the cadence and the source once, and every cycle the finished deck arrives in Slack or email, ready to present.
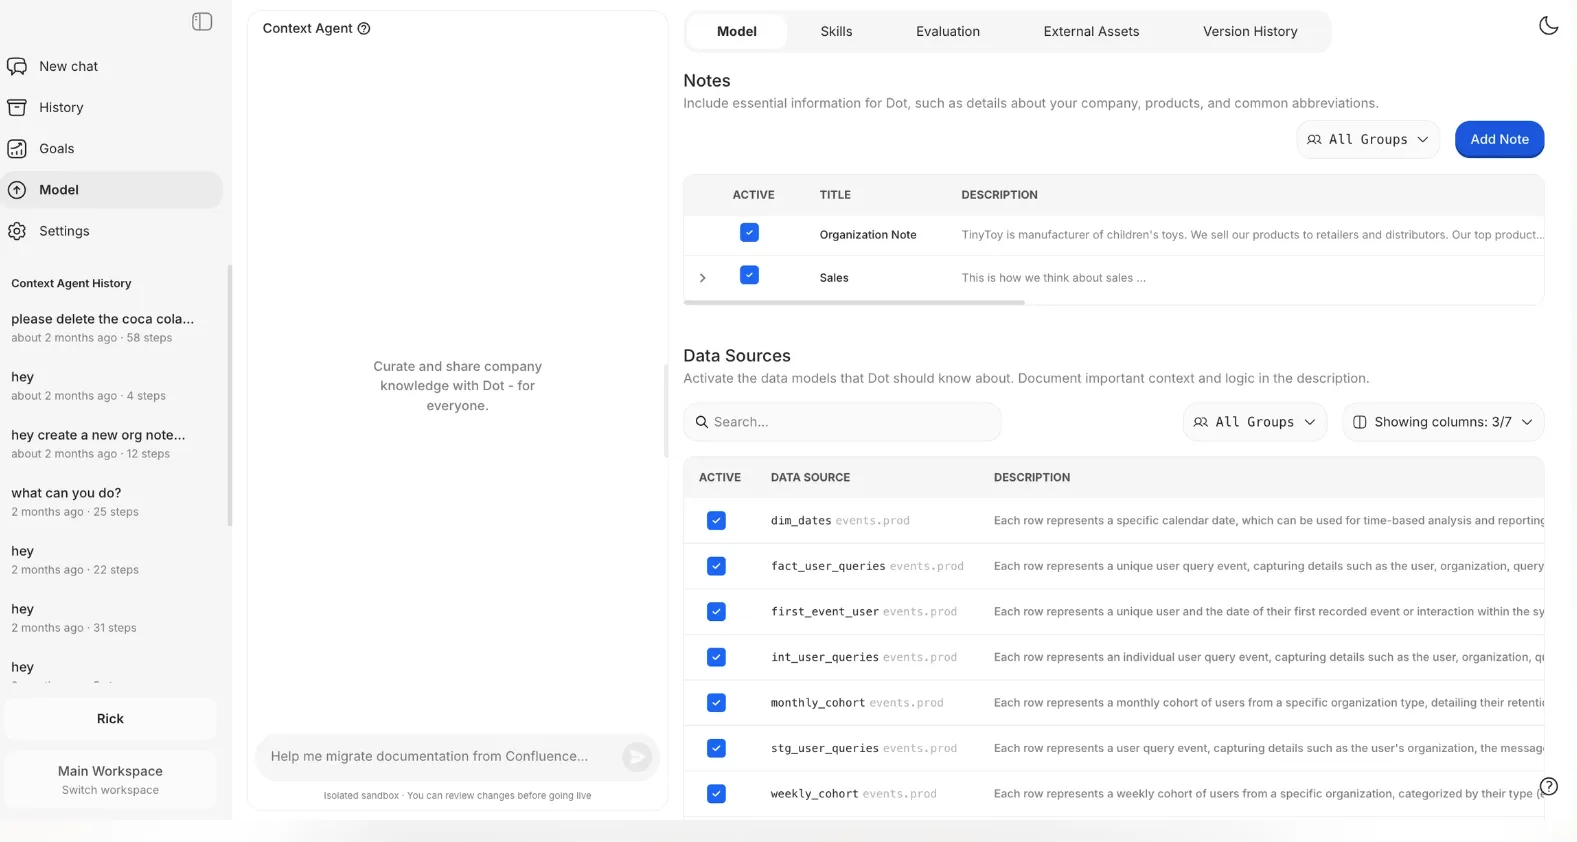
A Context Agent that keeps every definition aligned
Dot's Context Agent reads your dbt models, plus whatever catalog and documentation it can reach, to maintain one shared definition layer, so every answer draws on the same metric logic.
When two teams define churn differently, both numbers look reasonable and the meeting stalls on which one to trust.
The Context Agent learns how your business defines its metrics and fills in documentation where a metric has none.
When two systems disagree, it surfaces the conflict and lets you decide.
A clickable audit trail under every number
Every figure Dot returns links to the exact SQL query and the dataset behind it, so anyone can check a result in a single click.
A metric that looks off normally means digging through models and refresh logs, or tracking down whoever built the report.
With Dot, you open the footnote on the number and read the query that generated it, which is what keeps non-technical stakeholders trusting the output.
What makes Dot different from Hex?
Both tools were designed so that an answer is grounded in your business context and open to inspection: Hex through Context Studio and agent observability, Dot through its Context Agent and a query-level audit trail.
However, the clearest way to see the difference is to ask where the work happens:
- With Hex, it happens inside Hex.
Its agentic notebooks combine SQL and Python on one canvas, Threads let business users ask questions in the app or in Slack, Context Studio governs the semantic models and gives data teams observability into how the agent reached an answer, and any of it can become a shareable data app.
A data team curates that environment, and people come in to work with it.
That depth is a real strength for technical teams who also want to serve business users.
- With Dot, the work comes to you.
The analysis arrives in Slack, Microsoft Teams, email, or the web app as a written answer, and the recurring executive review arrives as a finished PowerPoint, so no one adopts a new canvas to get either one.
You should pick Dot when you want an AI analyst that returns written analysis and scheduled reports on the dbt and warehouse models you have already built.
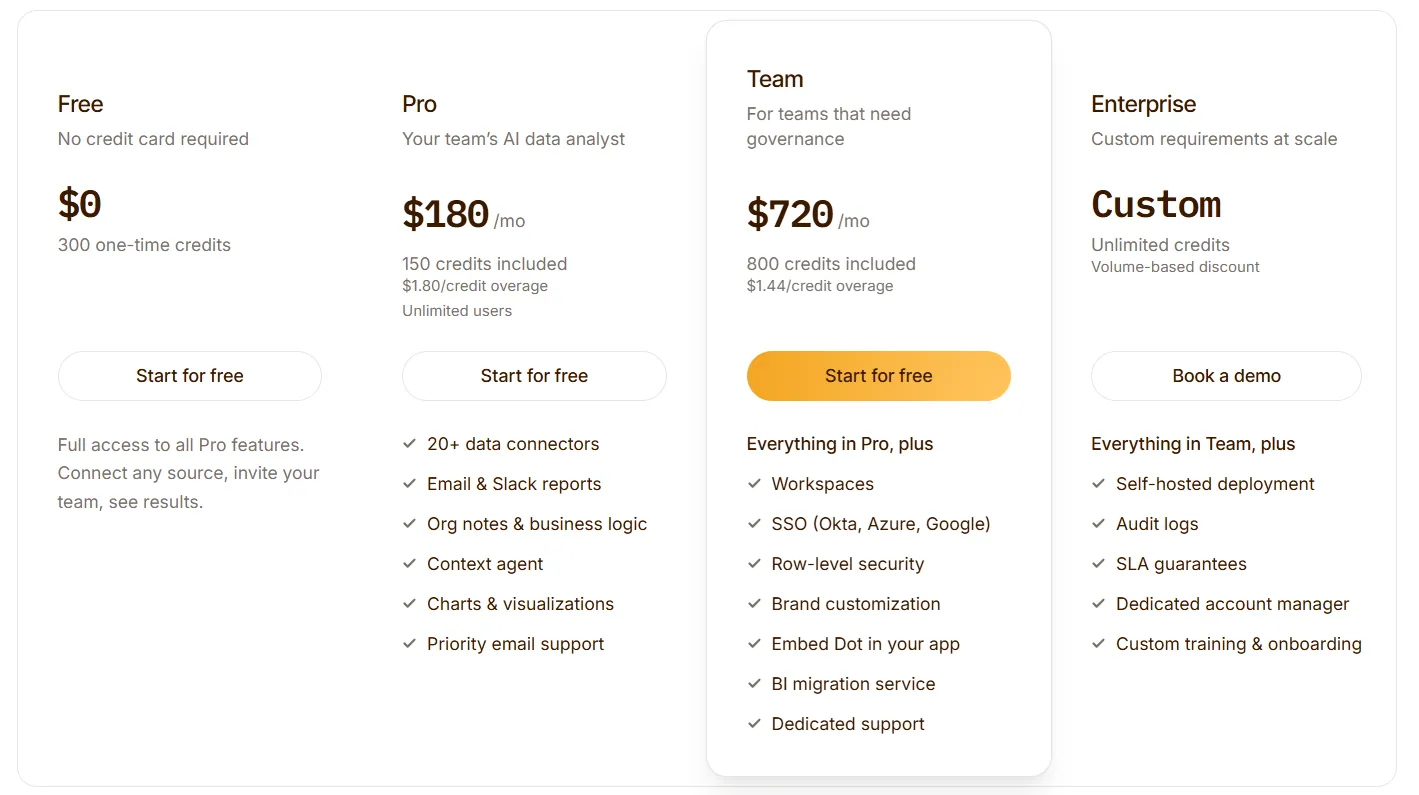
Dot pricing
Dot's free plan includes 300 one-time credits and full access to Pro features, enough to evaluate the product on real work before any purchase.
There are three paid tiers.
- Pro: $180/month, including 150 credits per month, $1.80 per additional credit, and unlimited users.
- Team: $720/month, including 800 credits per month, a $1.44 overage rate, and SSO, row-level security, embedding, BI migration, and dedicated support.
- Enterprise: custom pricing, with unlimited credits, volume discounts, self-hosted deployment, audit logs, an SLA, and a dedicated account manager.
Dot pros and cons
✅ Answers come as written analysis with a recommendation, not a chart left for you to interpret.
✅ Recurring reviews build into ready-to-send PowerPoint decks on the cadence you set.
✅ Every figure opens to the query and dataset that produced it.
✅ Works on the warehouse and dbt models you have today, with no migration and unlimited seats on paid plans.
❌ It does not build dashboards.
#2: ThoughtSpot
Best for: Teams that want natural-language search and agent-built analyses without a long dashboard-building cycle.
Similar to: Dot, Zenlytic.
Type a question into ThoughtSpot, and you get a governed answer from live data, no dashboard to open first.
The platform now calls itself agentic, with Spotter and a group of coordinated agents that turn a prompt into a worked analysis and the dashboard to match, alongside Analyst Studio for hands-on SQL.
ThoughtSpot's top features
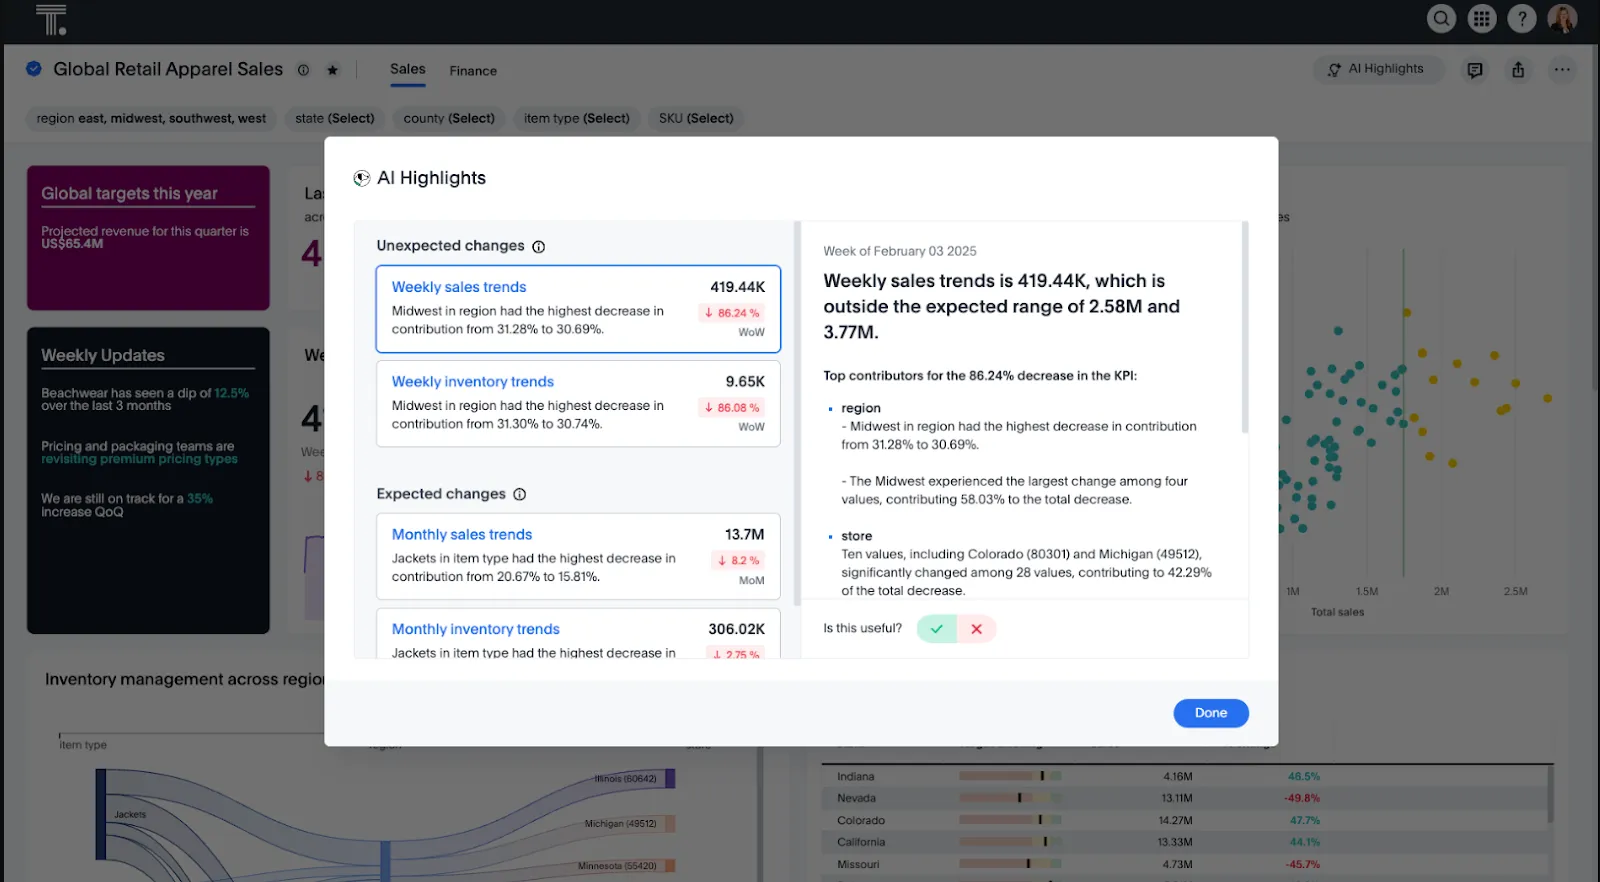
- Spotter agent: Give it a prompt, and it produces the analysis with a matching dashboard, then points you to the next questions worth asking.
- Natural-language search: Anyone can type a question and get a governed answer, with the access rules applied out of sight.
- SpotterViz: Hand it a dataset and it returns a finished, formatted dashboard, the layout and chart choices made for you.
- Analyst Studio: Analysts get a dedicated space for SQL and deeper digging next to the search experience.
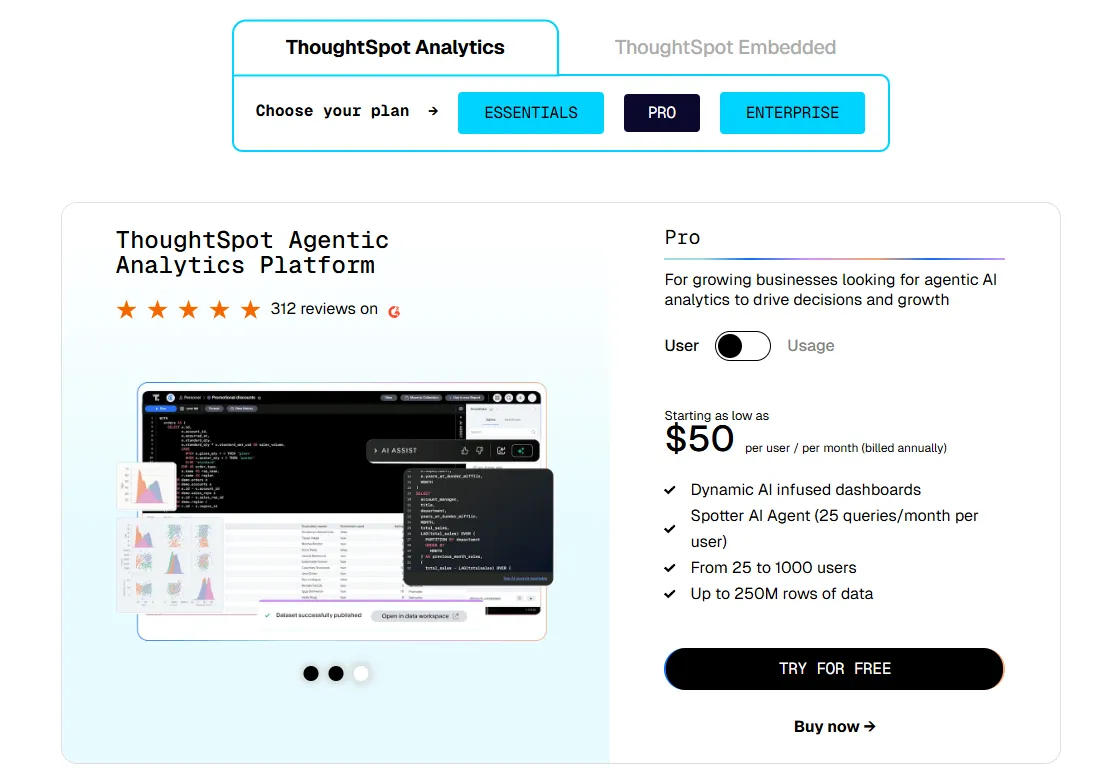
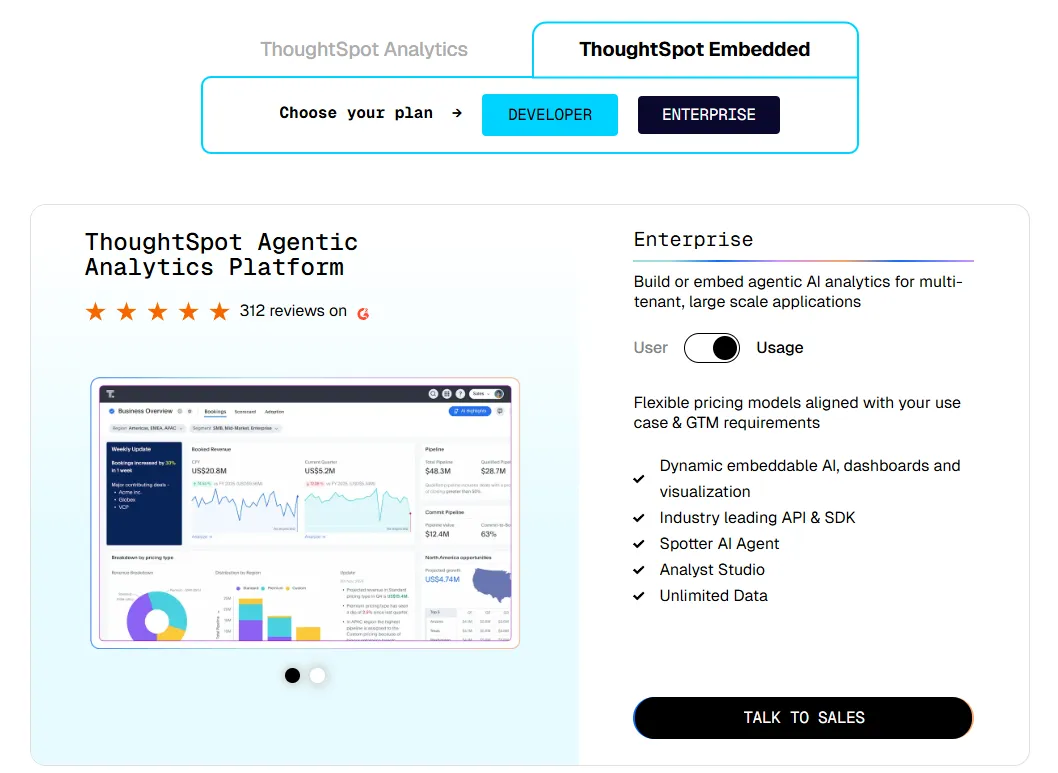
ThoughtSpot pricing
ThoughtSpot offers two separate products: ThoughtSpot Analytics for internal BI and ThoughtSpot Embedded for building analytics into applications - each with flexible pricing depending on scale and usage:
- ThoughtSpot Analytics:
- Essentials: From $25 per user per month (billed annually), for teams of 5-50 users, includes dynamic interactive dashboards and AI-powered insights and supports up to 25M rows of data.
- Pro (per user pricing): From $50 per user per month (billed annually), for 25–1,000 users, includes everything in Essentials, plus AI-infused dashboards and Spotter AI Agent (25 queries per user/month), and supports up to 250M rows of data.
- Pro (usage-based): From $0.10 per query, includes everything in Pro per user, and adds Analyst Studio.
- Enterprise (user or usage-based): Custom pricing, includes everything in Pro, plus unlimited users and data.
- ThoughtSpot Embedded:
- Developer: Free for 1 year, includes embeddable AI analytics, dashboards, and visualizations, APIs and SDKs, up to 10 users and 25M rows of data.
- Enterprise (user-based): Custom pricing, includes everything in Developer, plus unlimited data.
- Enterprise (usage-based): Custom pricing, everything in Enterprise, plus Spotter AI Agent and Analyst Studio.
ThoughtSpot pros and cons
✅ Non-technical users take to the search experience without training.
✅ Governance scales without much friction as more teams come on.
❌ Two pricing structures (per user vs. usage-based) can get confusing at scale.
#3: Supaboard
Best for: Teams that want AI-built dashboards and natural-language answers with no modeling work upfront.
Similar to: ThoughtSpot,Metabase.
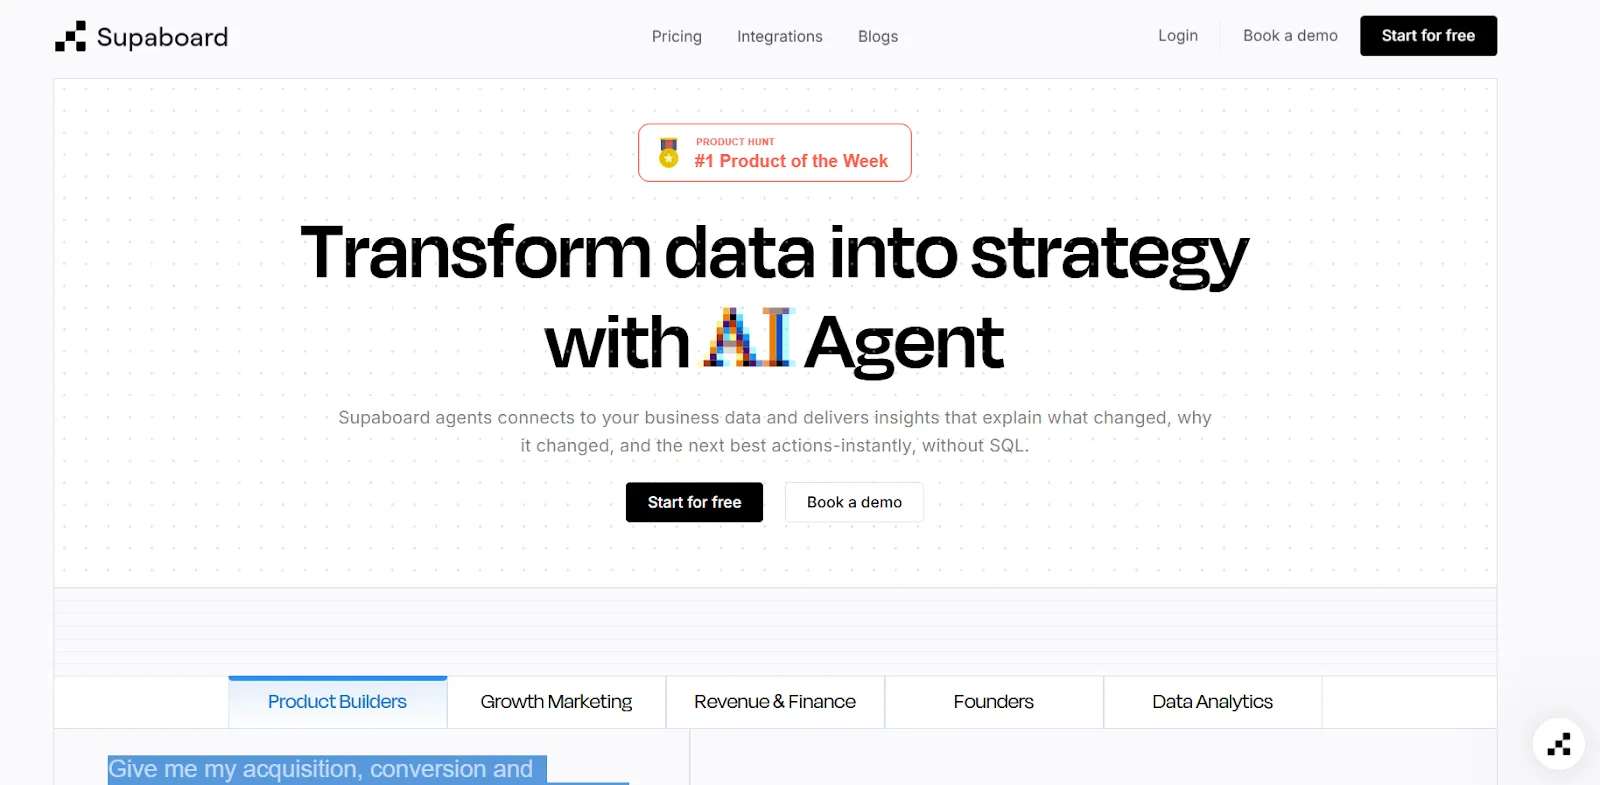
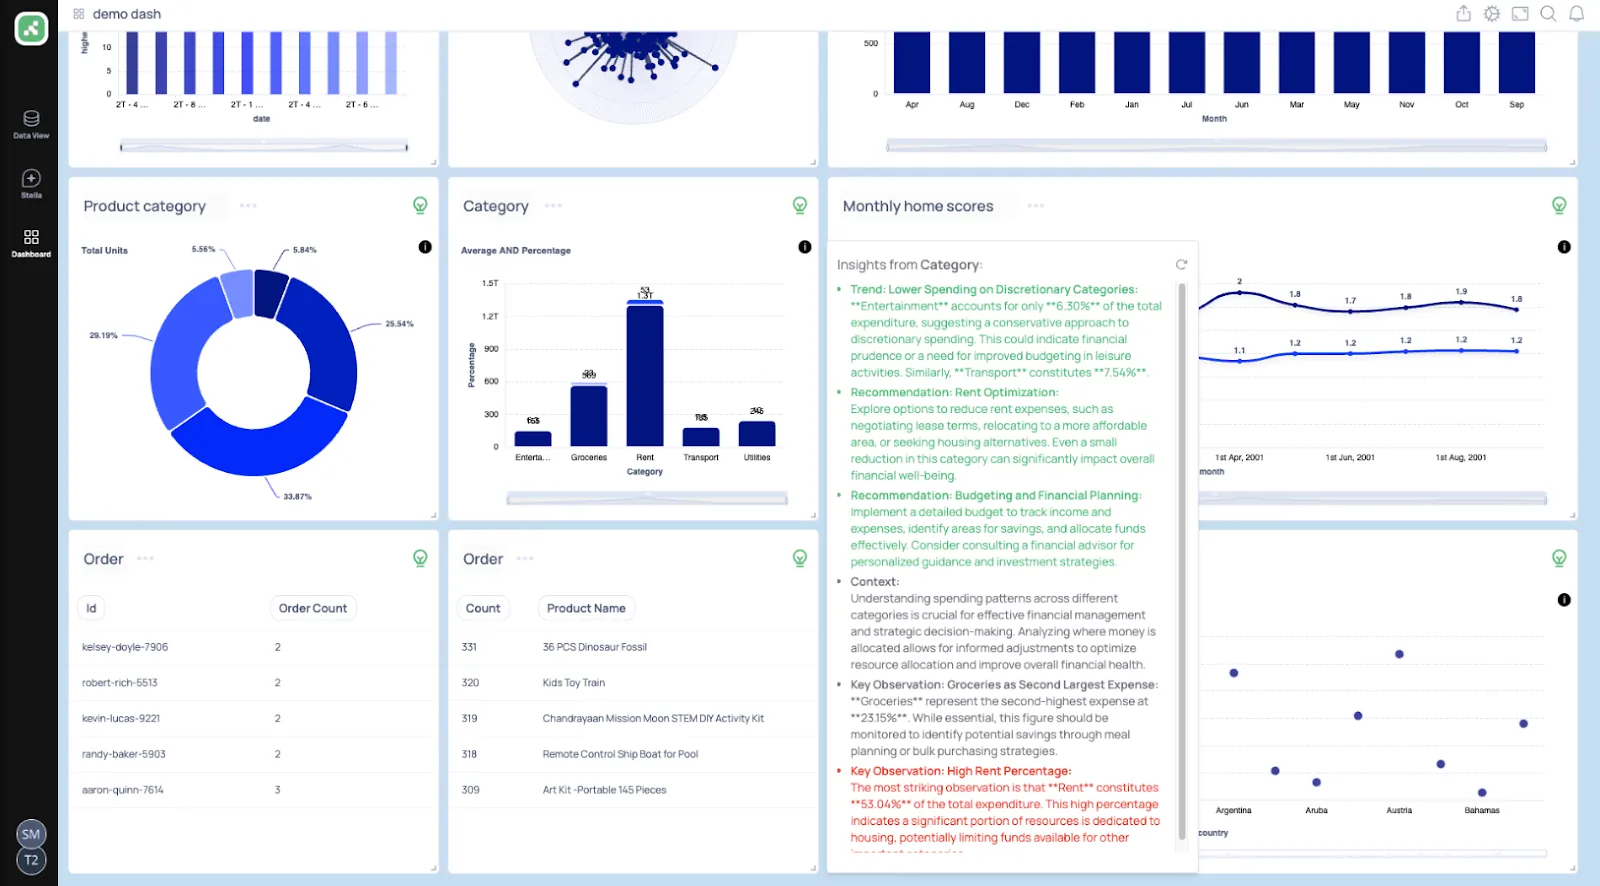
Supaboard is an AI-powered analytics platform that connects to your data sources and automatically generates dashboards, insights, and reports.
The pitch is speed: connect a source, and an agent named Stella builds the dashboards and answers the questions, with no SQL and no setup phase to get through.
Supaboard's top features
- Trainable agents: Shape Stella around your business rules and metric definitions so its answers track how your company actually operates.
- Natural-language chat: Ask in everyday words and get a charted answer plus a recommended next move.
- AI-built dashboards: Say what you want to track and Supaboard puts together the dashboards and KPIs, kept current automatically.
- Alerts and scheduled reports: Set the agent to catch drops or anomalies and push recurring reports on a set schedule.
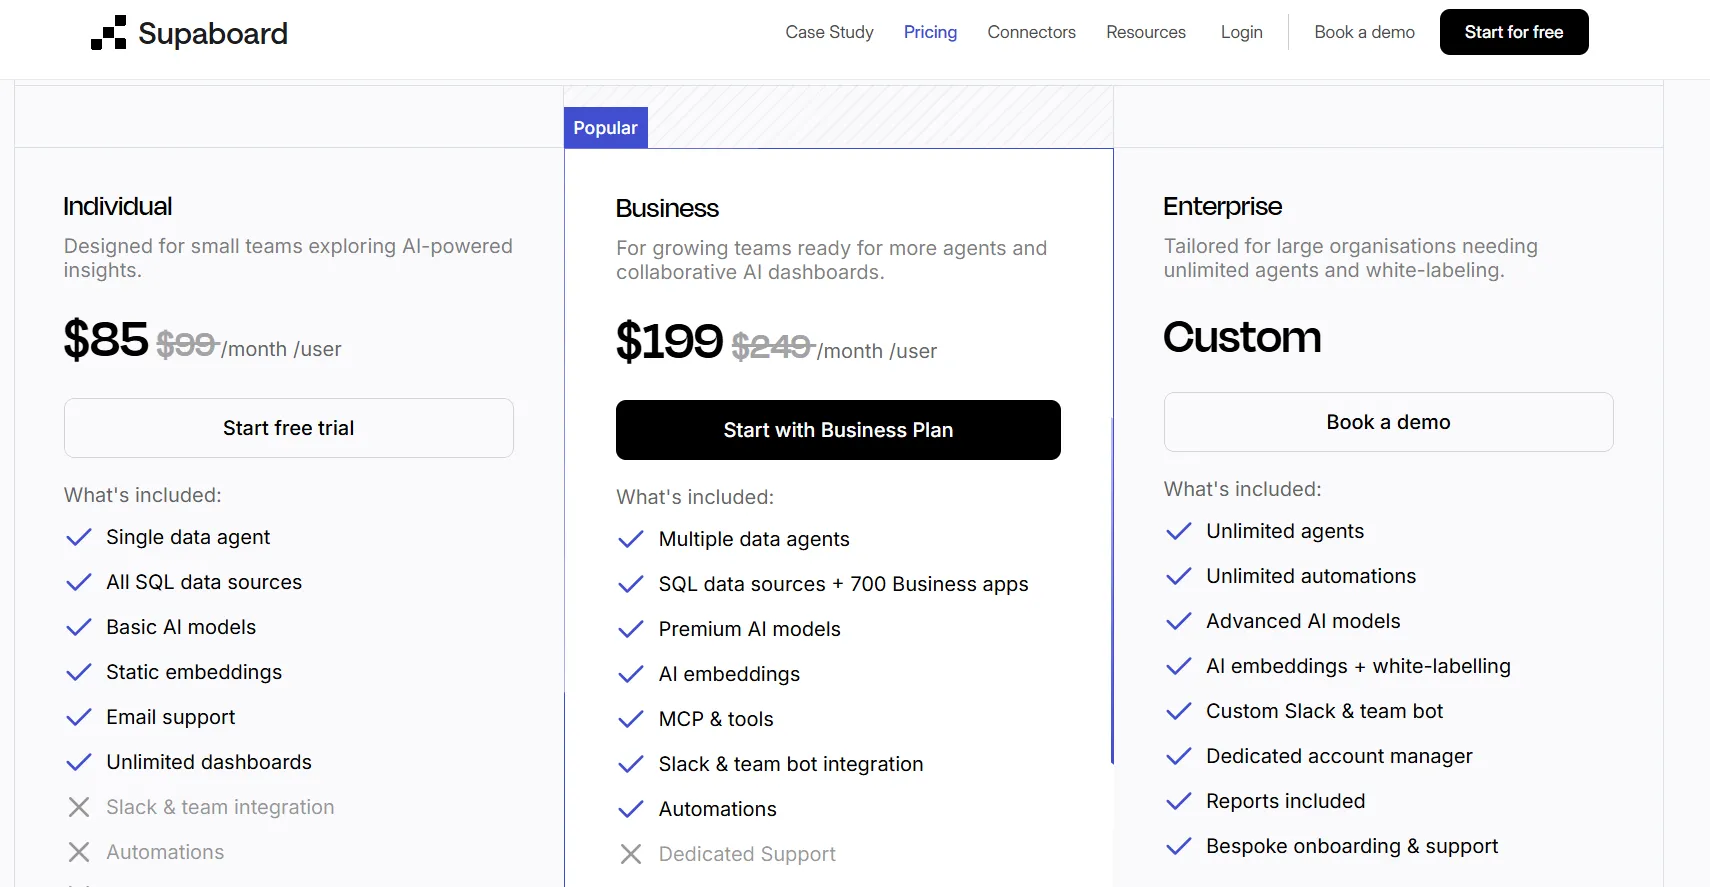
Supaboard pricing
Supaboard runs three tiers:
- Individual: $85/month, for a single user, with advanced AI models, static embeddings, and unlimited dashboards.
- Business: $199/month, adding multiple users, custom agents, AI embeddings, and team bot integrations.
- Enterprise: Custom pricing, with unlimited users and agents, white-labeling, and a dedicated account manager.
Supaboard pros and cons
✅ Hooking up data sources is quick, even bulky CSV and KPI files.
✅ The natural-language layer opens analysis up to people who do not write queries.
❌ Limited dashboard customization options are implied by a G2 review.
#4: Zenlytic
Best for: Data teams that want self-serve answers they can trace and defend.
Similar to: Dot, ThoughtSpot.
At the center of Zenlytic is Zoë, an AI agent that answers data questions and traces every figure back to how it was calculated.
A governed semantic layer underneath keeps that self-serve accurate as more people lean on it.
Zenlytic's top features
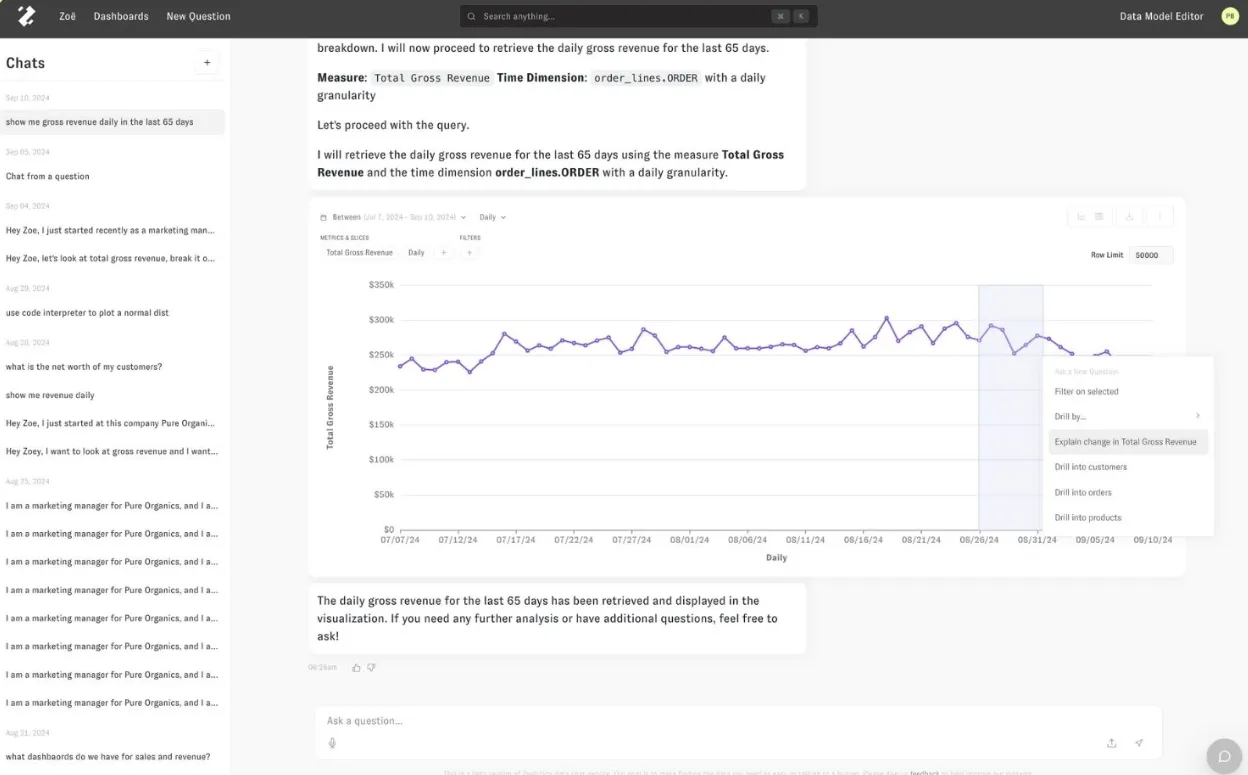
- AI analyst (Zoë): Fields natural-language questions and the follow-ups after them, making sense of messy, multi-source data for technical and business users alike.
- Clarity Engine: An LLM-native semantic layer that lets teams define metrics and business logic once and reuse them across all queries, keeping answers consistent.
- Memories: Pin a metric's definition and assumptions once, and Zoë returns the same number for that question from then on.
- Citations: Open any answer to see the exact metrics and query that produced it.
Zenlytic pricing
Zenlytic keeps prices off the site. You book a demo to see it and request a custom quote.
Zenlytic pros and cons
✅ Explainability is the point of the tool, not a bolt-on.
✅ Setup is quick, since the agent maps your data and builds the semantic layer for you.
❌ Pricing is not public.
What are the best self-service exploration and governed modeling alternatives to Hex?
This group suits teams that would sooner do the analysis themselves.
The common thread is direct work on live warehouse data, with governance rising as you move from a spreadsheet grid to a code-defined semantic layer:
#1: Sigma
Best for: Finance and operations teams that think in spreadsheets but want warehouse-scale data underneath.
Similar to: Metabase, Holistics.
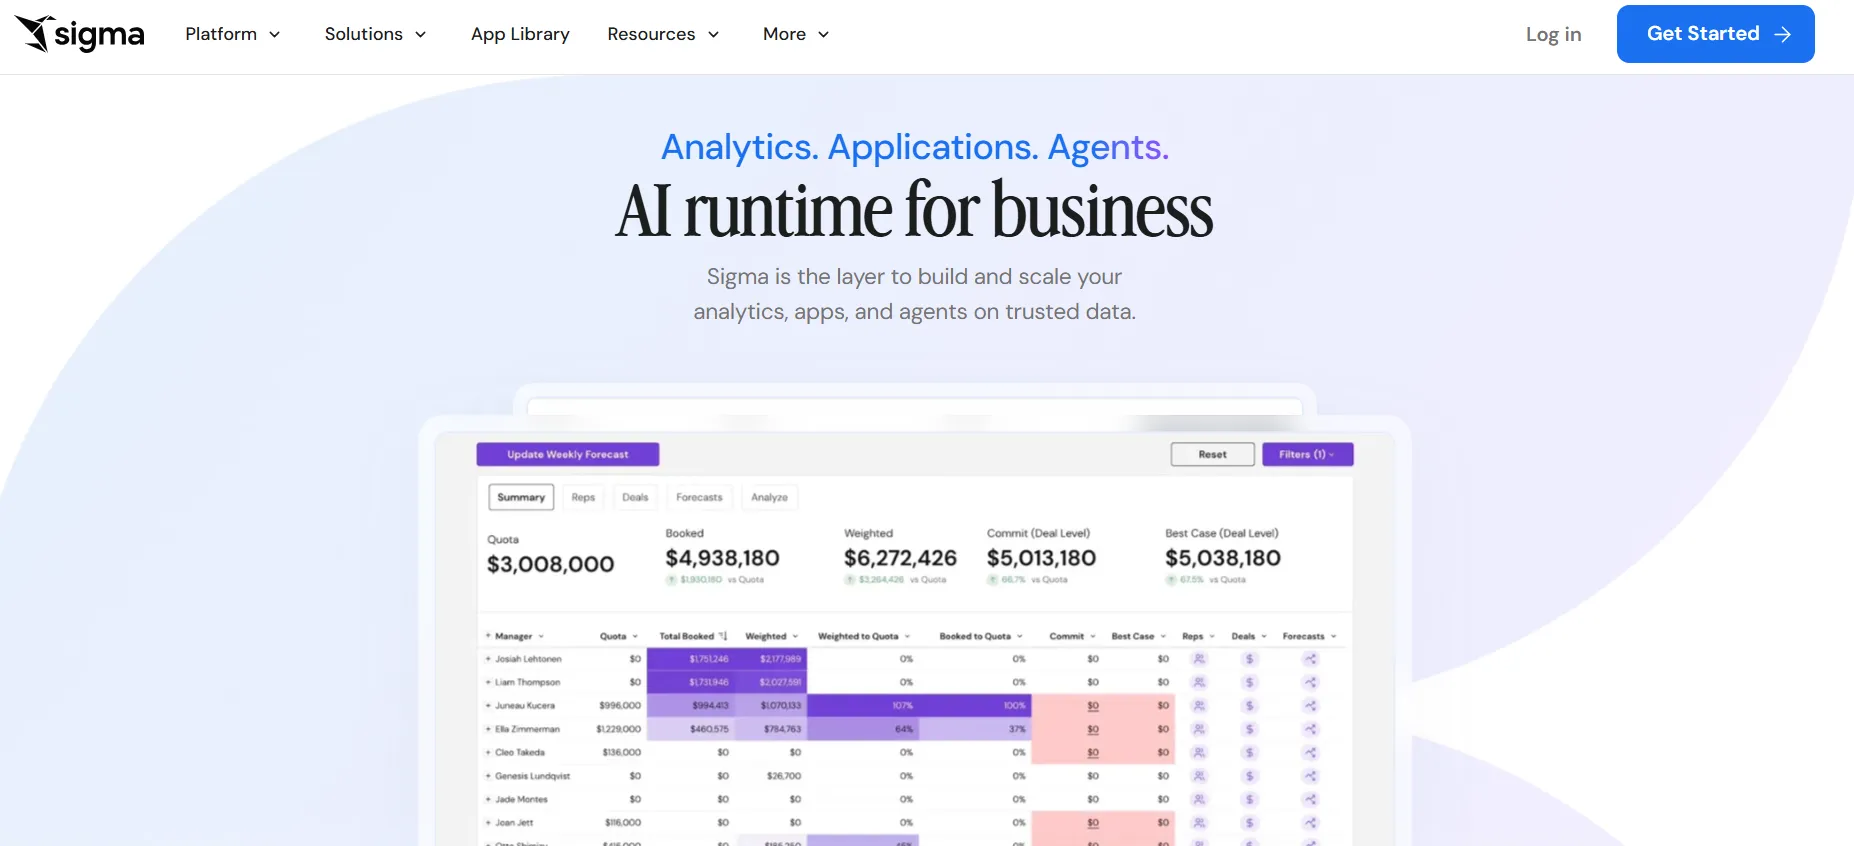
Sigma puts a familiar spreadsheet grid on top of your cloud warehouse, so finance and operations teams can analyze live data without exporting anything.
Pivots and formulas run straight against Snowflake, BigQuery, Databricks, and Redshift, and a layer of AI features now runs over the grid.
Sigma's top features
- Spreadsheet on live data: Pivot and calculate over billions of warehouse rows in a grid that behaves like the spreadsheet your team already knows.
- Ask Sigma: Tell it the dashboard or summary you want and it builds it inside the workbook from your prompt.
- No-code modeling: Build joins and reusable datasets in a visual modeler, with SQL on hand for anything more involved.
- Collaborative workbooks: Several people can edit and version one shared workbook, with comments inline and no CSV email chains.
Sigma pricing
Sigma does not publish pricing. A tailored quote means a conversation with its sales team.
Sigma pros and cons
✅ Because it queries the warehouse live, data stays current and governed with no extracts.
✅ The spreadsheet feel lets finance and operations teams ramp up on their own.
#2: Metabase
Best for: Startups and small data teams that want dashboards live this week, with a free option to self-host.
Similar to: Sigma, Holistics.
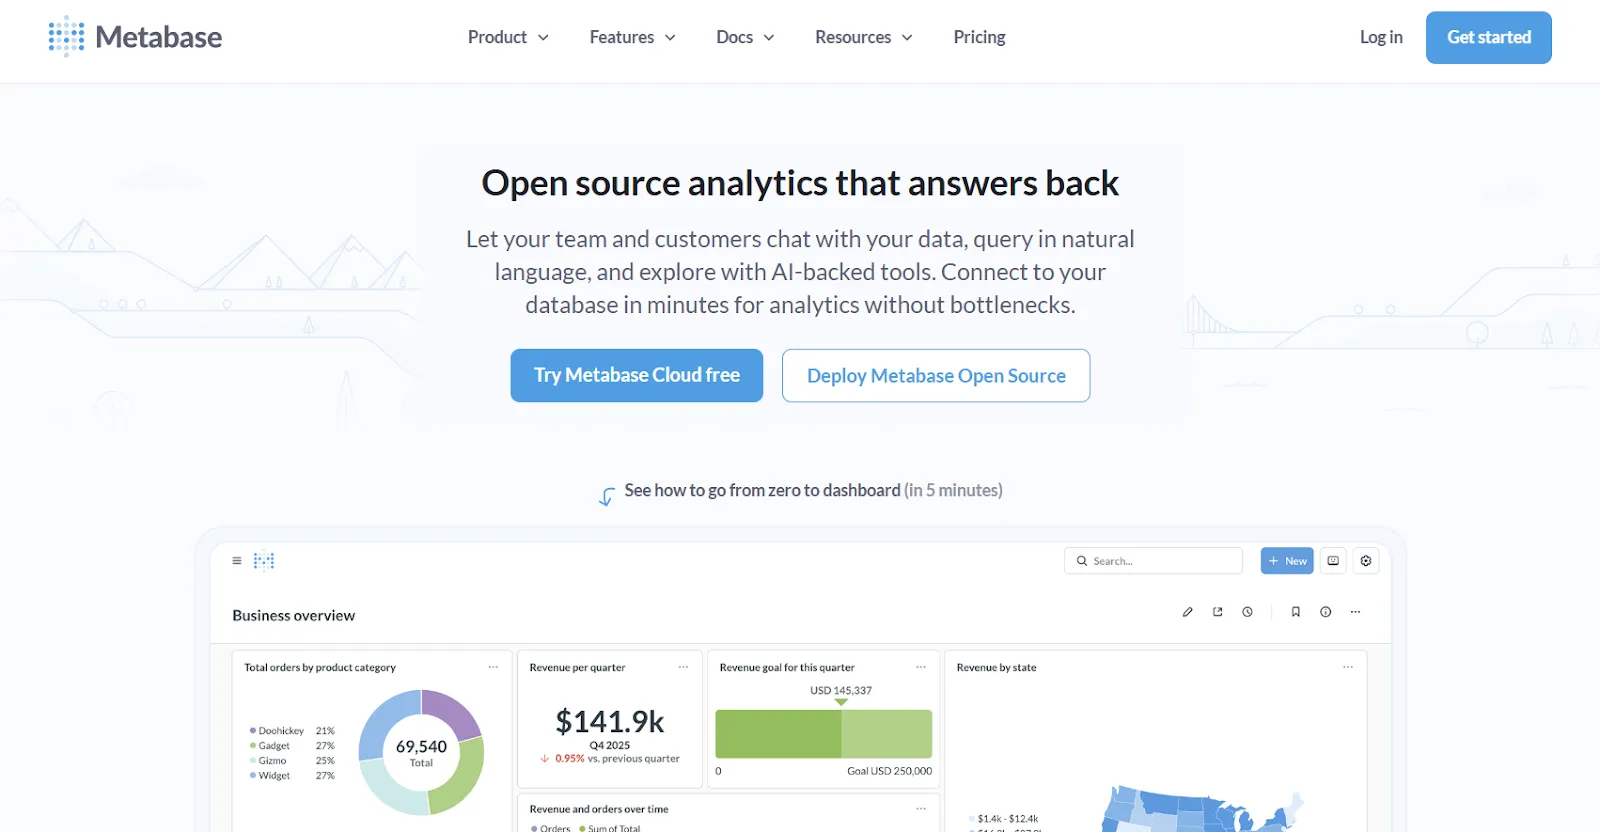
Metabase is the open-source BI tool many teams stand up first, free to self-host and quick to get running.
Point and click to build a question or drop into SQL when one gets complex, with Metabot handling the natural-language asks.
Metabase's top features
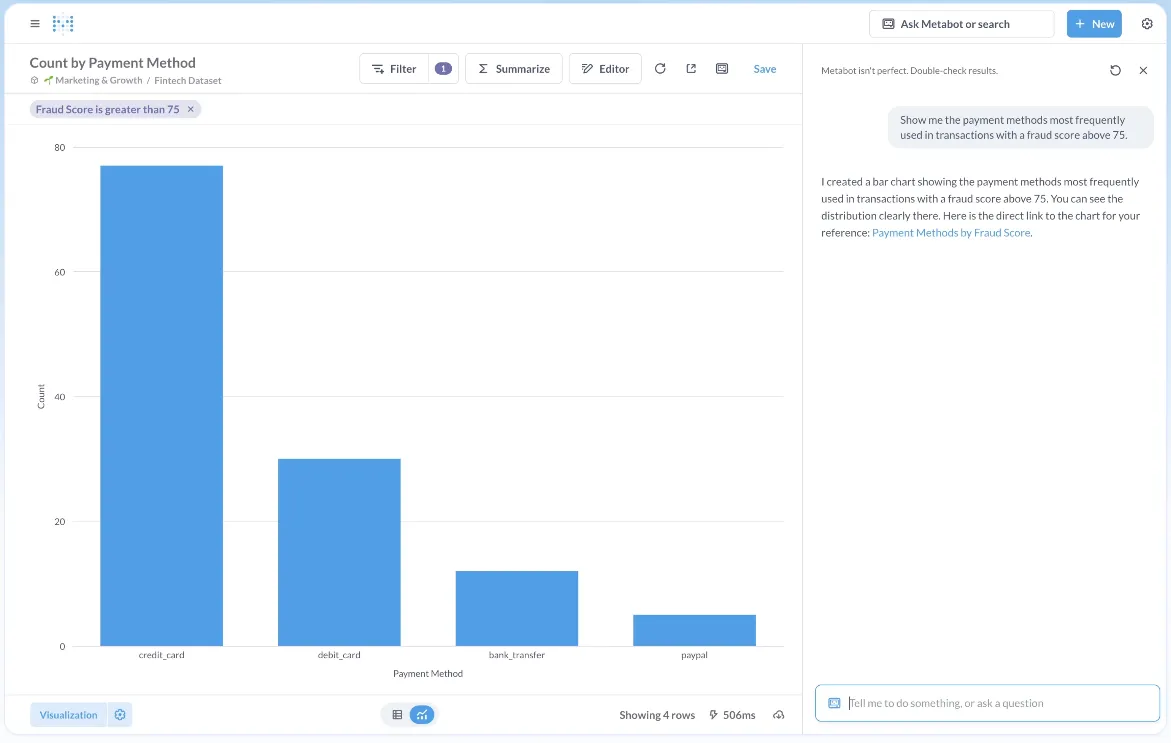
- Visual query builder: Filter, join, summarize, and visualize through a step-by-step interface, with raw SQL one click away.
- Metabot AI: Ask in natural language and it returns the query and a chart to get you moving.
- Interactive dashboards: Add global filters and click-to-drill so people can dig in from any chart.
- Embedded analytics: Place dashboards inside internal tools or customer-facing apps with row-level permissions.
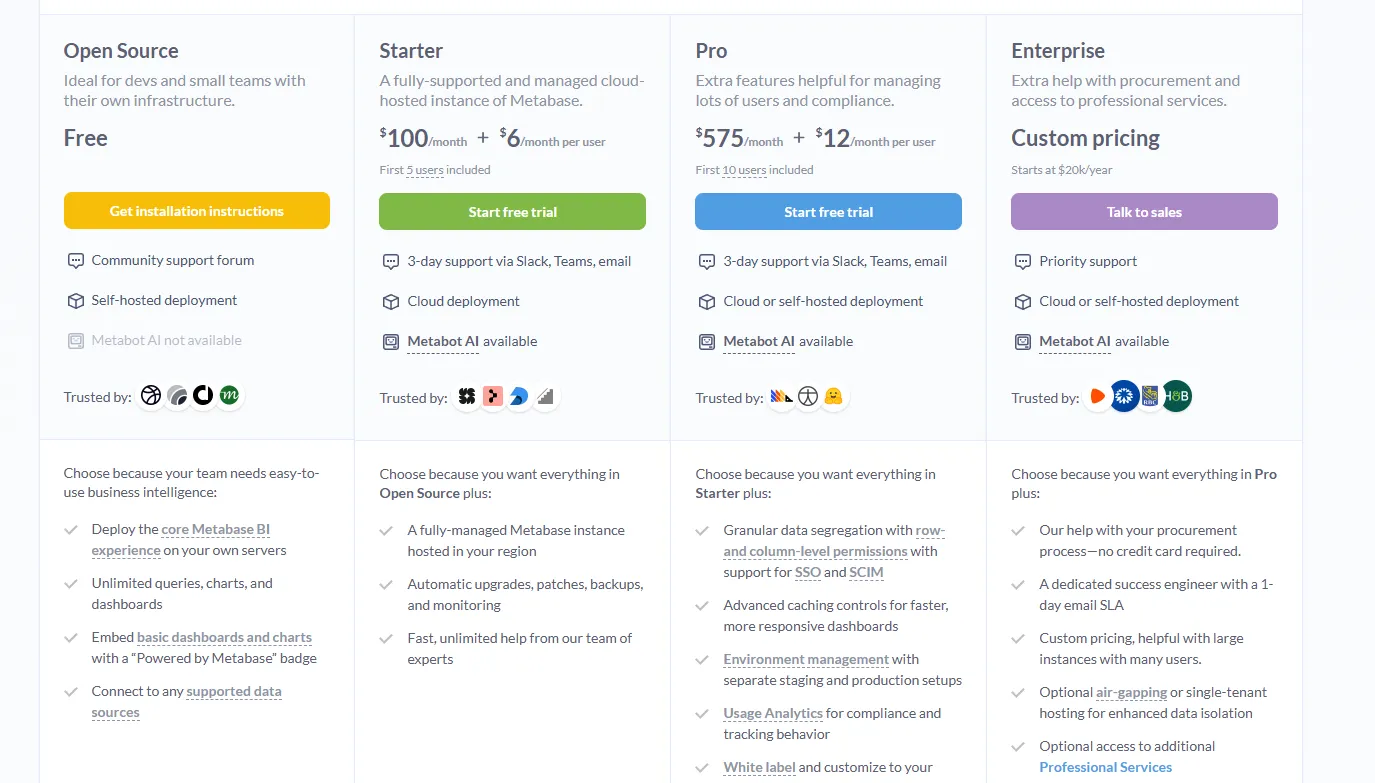
Metabase pricing
Metabase offers two pricing options depending on how you use the product: internal business intelligence or customer-facing embedded analytics.
- Business Intelligence:
- Open Source (Self-hosted): Free, self-hosted deployment, includes unlimited queries, charts, and dashboards, connects to all supported data sources, basic embedding with “Powered by Metabase” branding, community support only.
- Starter (Cloud-hosted): $100/month + $6/user/month, first 5 users included, includes everything in Open Source, plus option to include Metabot AI (charged extra), automatic upgrades, backups, and monitoring, support via Slack, Teams, and email (3-day SLA).
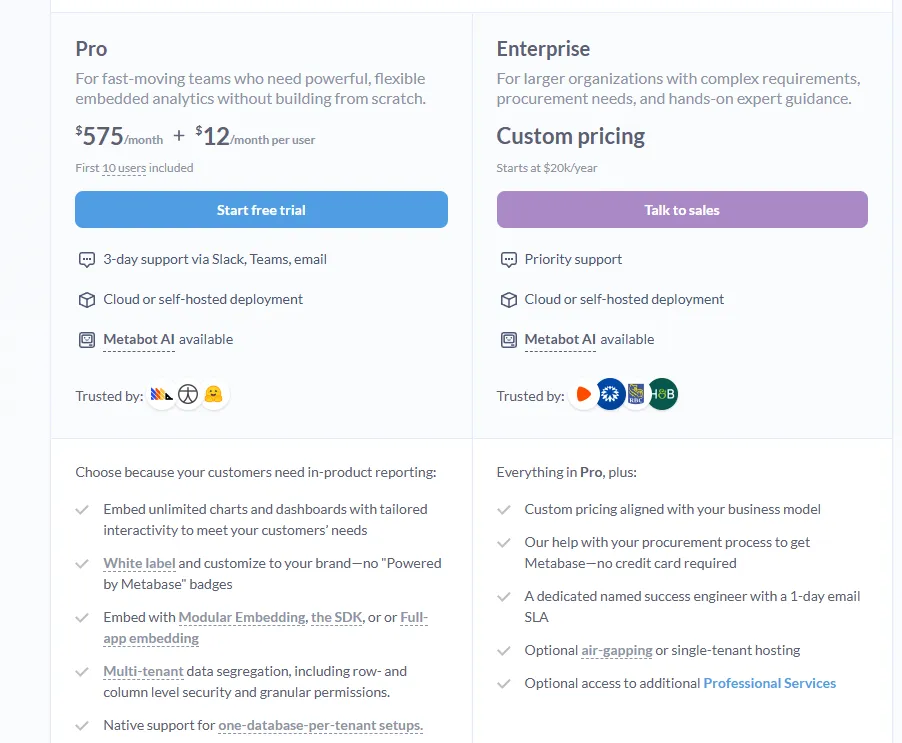
- Pro: $575/month + $12/user/month, first 10 users included, cloud or self-hosted deployment, includes everything in Starter, plus row- and column-level permissions, SSO and SCIM support, advanced caching and performance controls, staging + production environments, usage analytics and audit visibility, white-labeling, and embedded analytics capabilities.
- Enterprise: Custom pricing (starts at $20k/year), includes everything in Pro, plus priority support, dedicated success engineer (1-day email SLA), optional single-tenant or air-gapped deployment, and optional professional services.
- Embedded Analytics pricing:
- Pro: $575/month + $12/user/month, first 10 users included, includes unlimited embedded dashboards and charts, full white-labeling, modular embedding, SDK, or full-app embedding, multi-tenant security (row- and column-level), one-database-per-tenant support, staging + production environments, usage analytics, internal BI for your team, and option to include Metabot AI (charged extra).
- Enterprise: Custom pricing (starts at $20k/year), includes everything in Pro, plus a dedicated success engineer, priority support, optional single-tenant or air-gapped hosting, and optional professional services.
Metabase pros and cons
✅ The open-source build is free to run; you only pay for the server it runs on.
✅ Standing it up on a fresh database takes an afternoon, not a project.
❌ A user on G2 mentions that Metabase could benefit from having an AI assistant that understands the databases and assists in building queries
#3: Holistics
Best for: Data teams that want governed self-serve analytics with modeling defined as code.
Similar to: Looker, Sigma.
Holistics treats analytics like software.
A code-based semantic layer holds the metric definitions in one place, and business users build their own reports and dashboards on top of it, with everything written in a declarative language and committed to Git.
Holistics' top features
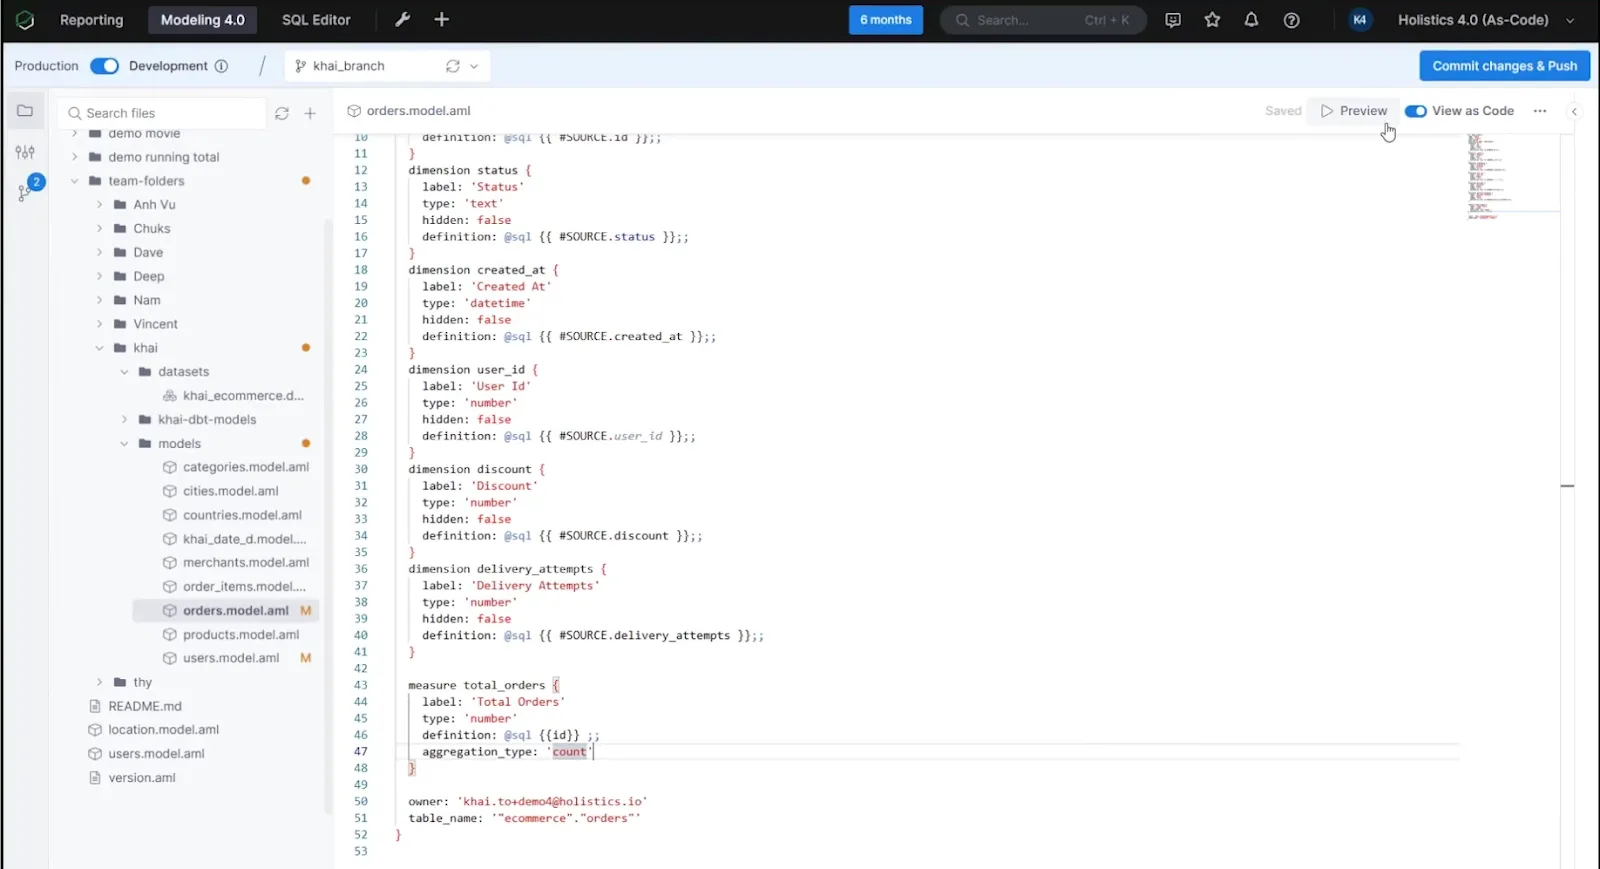
- Analytics as code: Write your models and metrics in Holistics' declarative language or SQL, then push them to Git with branches and code review like any other codebase.
- Centralized modeling: Define your joins and metrics a single time, and every downstream dashboard inherits the same logic.
- Self-serve for business users: Give non-technical teams a drag-and-drop canvas where they answer their own questions against governed models.
- AI on the semantic layer: The AI reasons over your governed definitions, so answers trace back to the metrics your team already trusts.
Holistics pricing
Holistics prices by reports and users, with security add-ons on top.
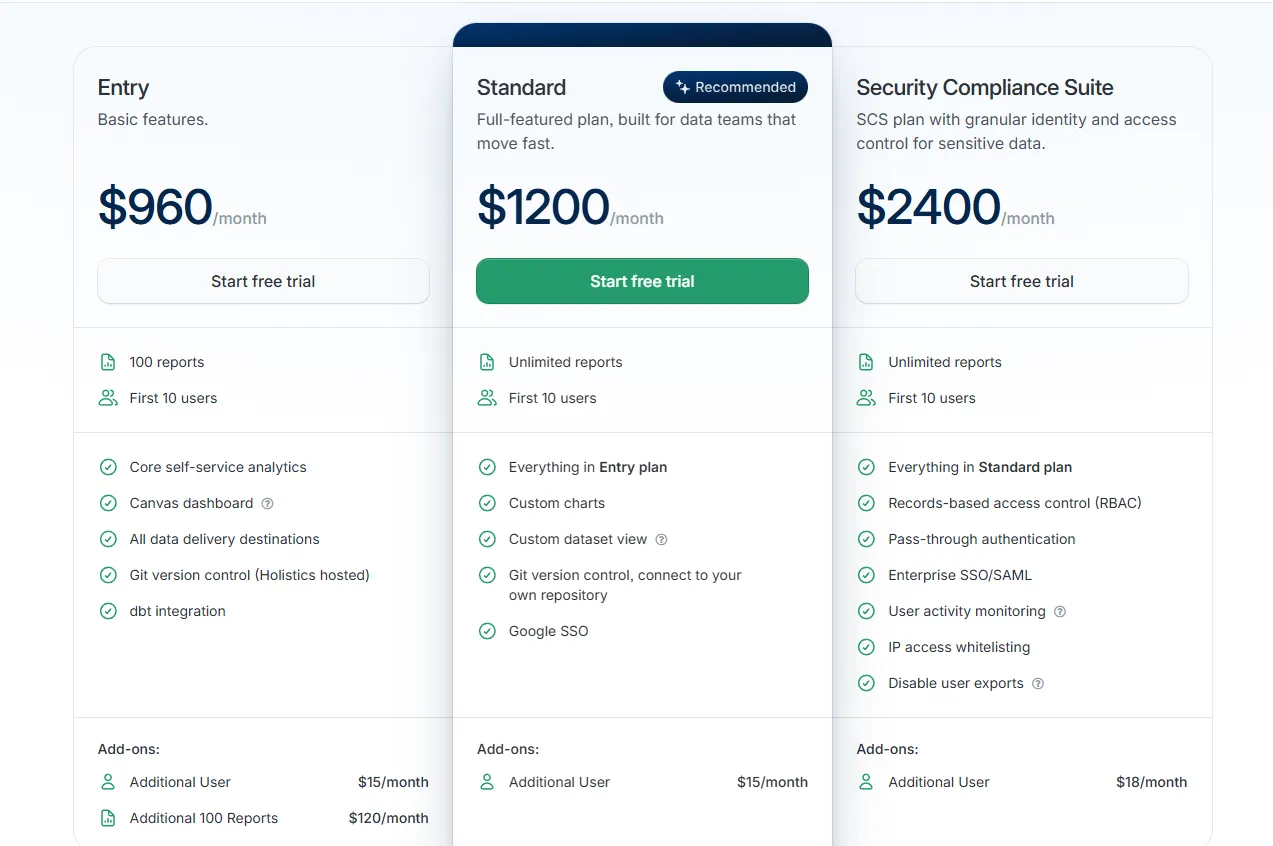
- Entry: $960/month, with 100 reports, 10 users, and dbt integration.
- Standard: $1,200/month, adding unlimited reports, custom charts, and your own Git repository.
- Security Compliance Suite: $2,400/month, adding RBAC, enterprise SSO, and activity monitoring.
- Custom: tailored pricing for unlimited users and advanced compliance.
Holistics pros and cons
✅ The code-based semantic layer with Git version control brings software engineering practices to BI.
✅ Drill-down and self-serve hold up well on a governed model.
❌ Starts from $960/month, which can be expensive for SMEs.
What are the best alternatives to Hex for reporting at scale?
These are the platforms many large organizations already run, where the strength is breadth and a deep base of trained users.
AI is arriving across all of them, layered onto reporting workflows teams already know:
#1: Microsoft Power BI
Best for: Organizations already inside Microsoft 365 that want standardized reporting and self-service analytics.
Similar to: Tableau, Domo.
For teams already on Microsoft 365, Power BI is the path of least resistance into dashboards and reporting.
Modeling, paginated reports, Copilot AI, and enterprise governance all come in the box, and the link to Excel and Teams often settles the choice before a comparison gets going.
Power BI's top features
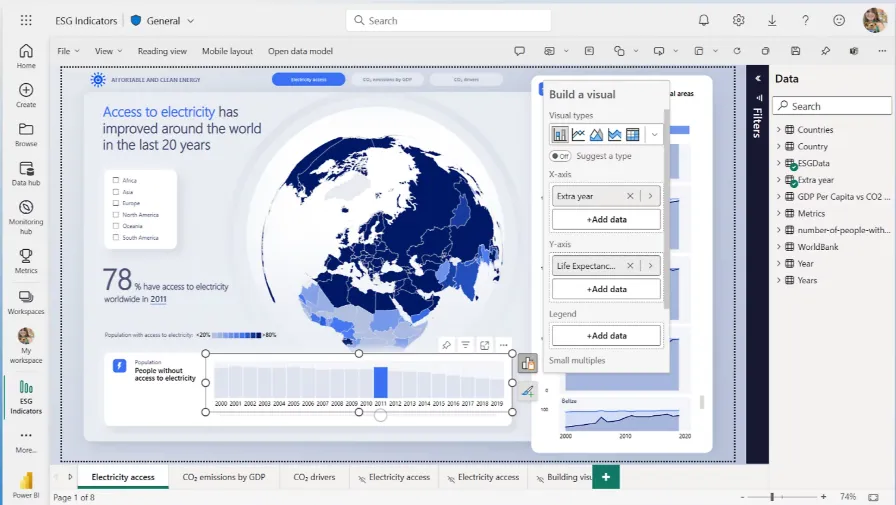
- Interactive reports: Layer visuals and filters with drill-through, then publish across the organization.
- Enterprise governance: Apply row-level security and sensitivity labels through Microsoft Entra ID.
- Copilot AI: Draft forecasts, flag anomalies, write summaries, and surface quick insights inside reports.
- Microsoft 365 integration: Reports flow straight into Teams and SharePoint where people already collaborate.
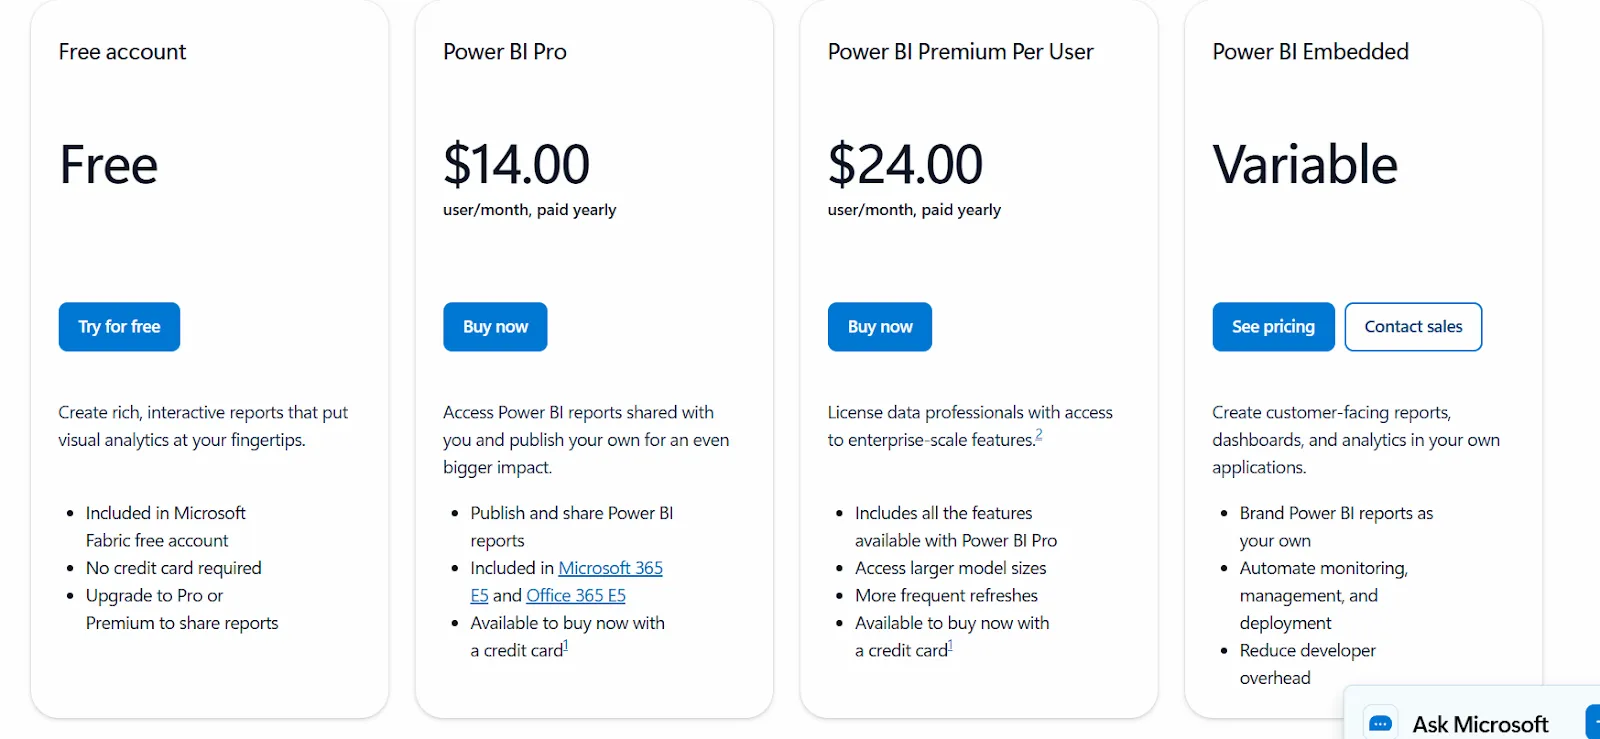
Power BI pricing
Power BI uses a per-user and capacity-based model:
- Free: build personal reports and dashboards, with no sharing.
- Power BI Pro: $14/user/month, with publishing, workspace sharing, and Teams or SharePoint embedding.
- Power BI Premium Per User: $24/user/month, adding larger models, more refreshes, and AI features.
- Power BI Embedded: custom pricing for customer-facing analytics in your own apps.
Power BI pros and cons
✅ Reports publish cleanly to everyone across the company.
✅ For a Microsoft-based team, the Excel and Teams hooks are tough to beat.
❌ Advanced capabilities are locked behind Premium tiers.
#2: Tableau
Best for: Analysts and large organizations that care about visualization depth and want a choice of cloud or self-hosted.
Similar to: Power BI, Domo.
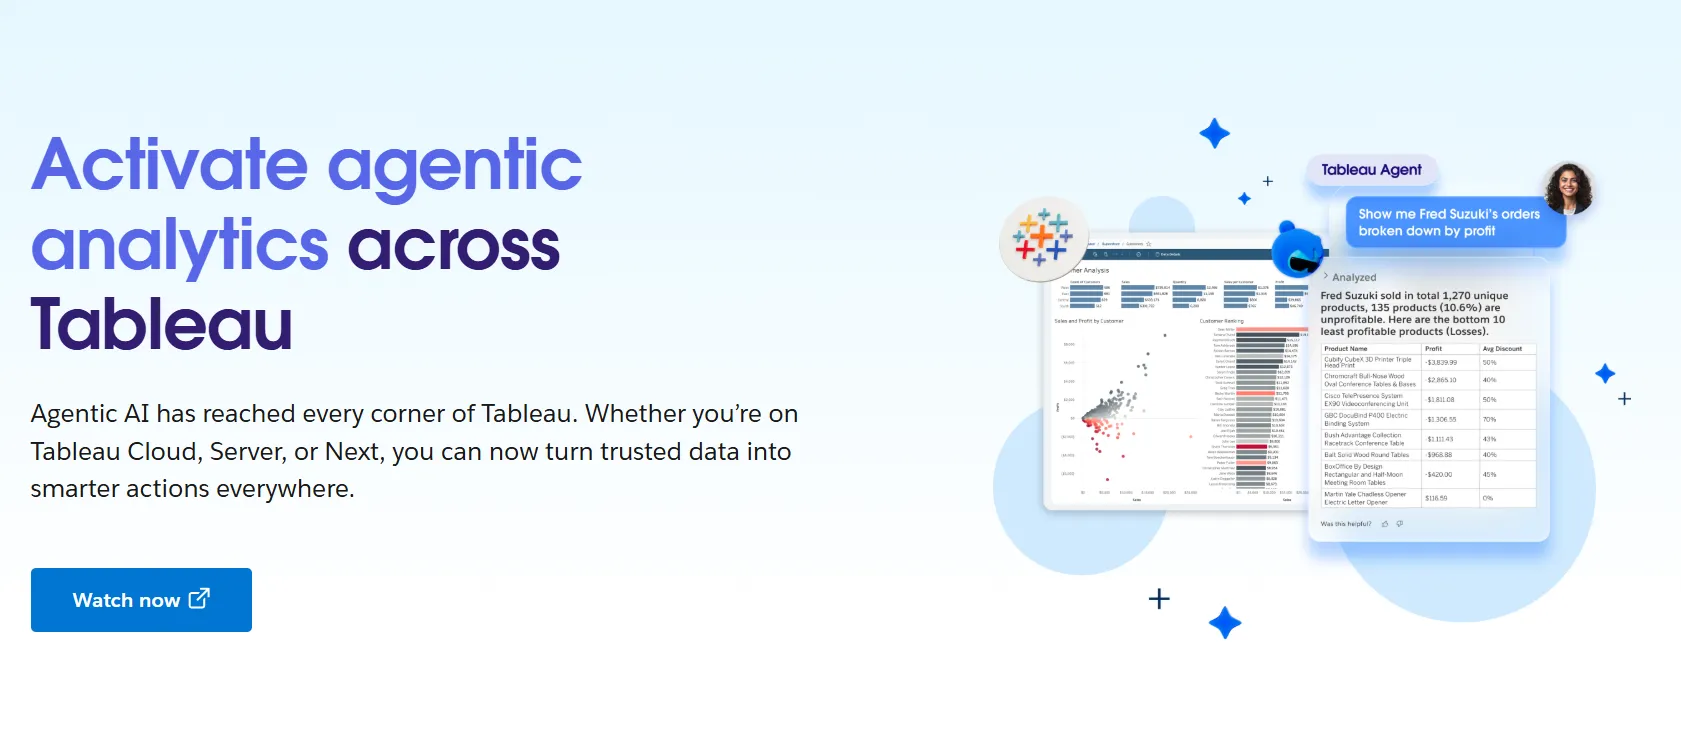
Few tools match Tableau for visualization depth; it has shaped what people expect a dashboard to look like for years.
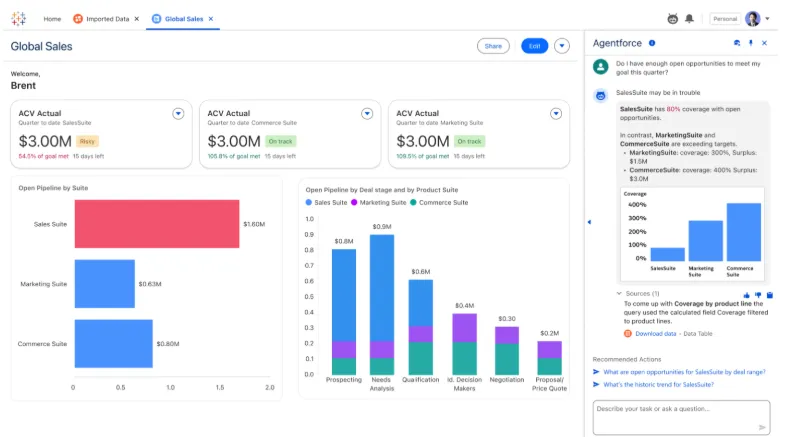
Its agentic chapter is Tableau Next, which layers Agentforce-driven natural-language questions and AI agents over the exploration workflow analysts already know.
Tableau's top features
- Visual analytics: Build interactive dashboards by dragging fields onto the canvas, backed by VizQL and a deep library of charts and filters.
- Tableau Next: Put questions in natural language and get answers in Slack or Salesforce, with Agentforce powering the agents.
- Tableau Pulse: Shared metric definitions and role-based permissions across larger rollouts.
- Governance and Data Management: Centralized controls and reusable metrics to scale analytics across teams.
Tableau pricing
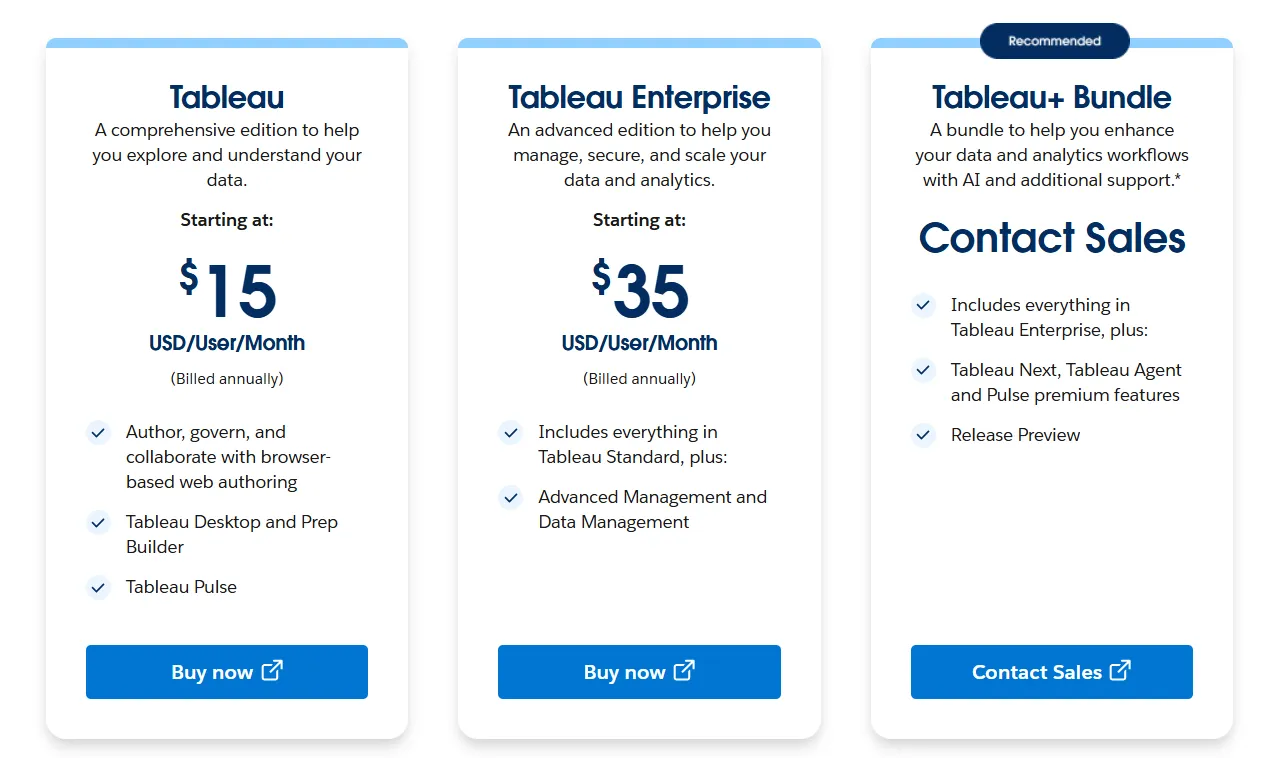
Tableau uses per-user, per-month pricing, with separate plans depending on whether you deploy Tableau in the cloud, on your own servers, or as part of its newer AI-driven offering:
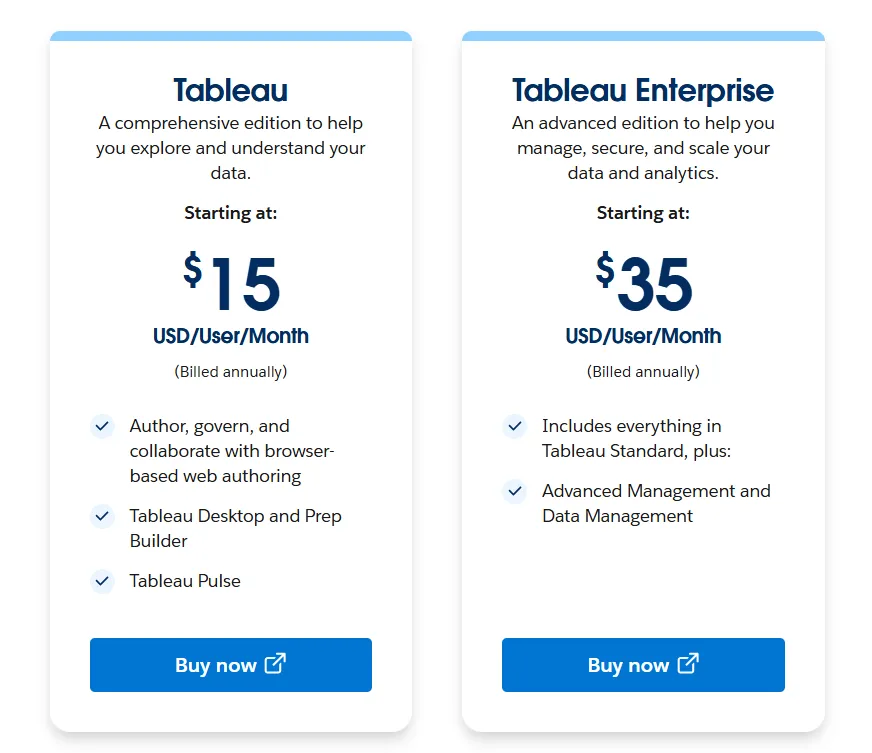
- Tableau Cloud has three pricing plans:
- Tableau Standard: Starts at $15/user/month, which includes browser-based authoring and collaboration, Tableau Desktop and Prep Builder, Tableau Pulse for metrics and insights.
- Tableau Enterprise: Starts at $35/user/month and includes everything in Standard, plus Advanced Management and Data Management for governance and scale.
- Tableau+ Bundle (Cloud + AI): Custom pricing, includes everything in Tableau Enterprise, plus Tableau Next, Tableau Agent, and Pulse premium features, with access to release previews and early AI capabilities.
- Tableau Server has two pricing plans:
- Tableau Standard: Starts from $15 per user/month, which includes authoring, governance, and collaboration and Tableau Desktop and Prep Builder.
- Tableau Enterprise: Starts from $35 per user/month, which includes everything in Standard, plus Advanced Management, Data Management, and eLearning.
- Tableau Next (agentic analytics) has 2 plans:
- Tableau Next: Starts from $40/month/seat, and includes Agentforce Tableau, Tableau Semantics, and its Native Slack integration.
- Tableau + Bundle: Custom pricing, which includes everything in Tableau Enterprise, plus Tableau Next, Tableau Agent and Pulse premium features.
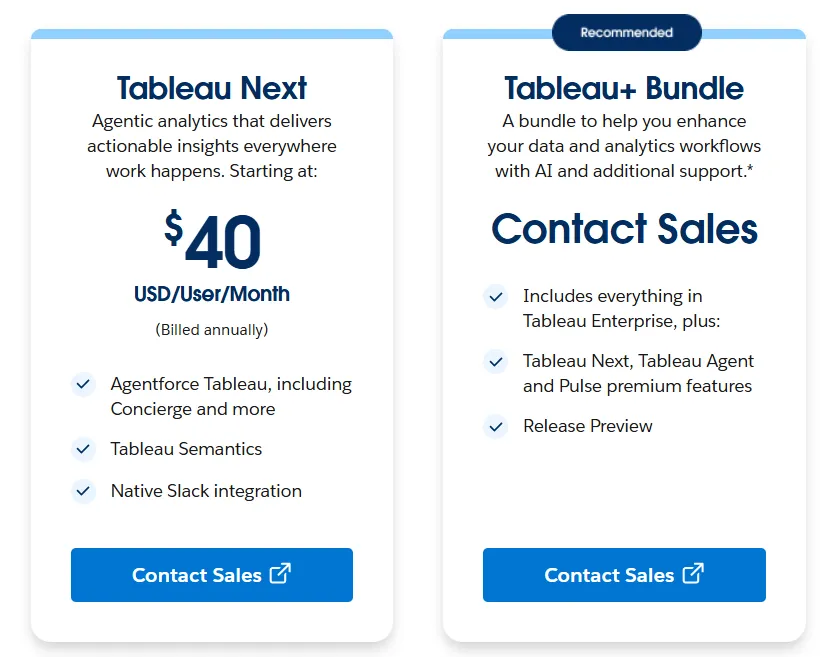
Tableau pros and cons
✅ For visual analysis, little else in BI goes deeper.
✅ The user base is huge, so there is a guide or a certification route for nearly any task.
❌ Per-user pricing can scale fast for organizations rolling out broadly.
#3: Domo
Best for: Mid-market and enterprise teams that want one platform covering integration, dashboards, apps, and AI.
Similar to: Power BI, Tableau.
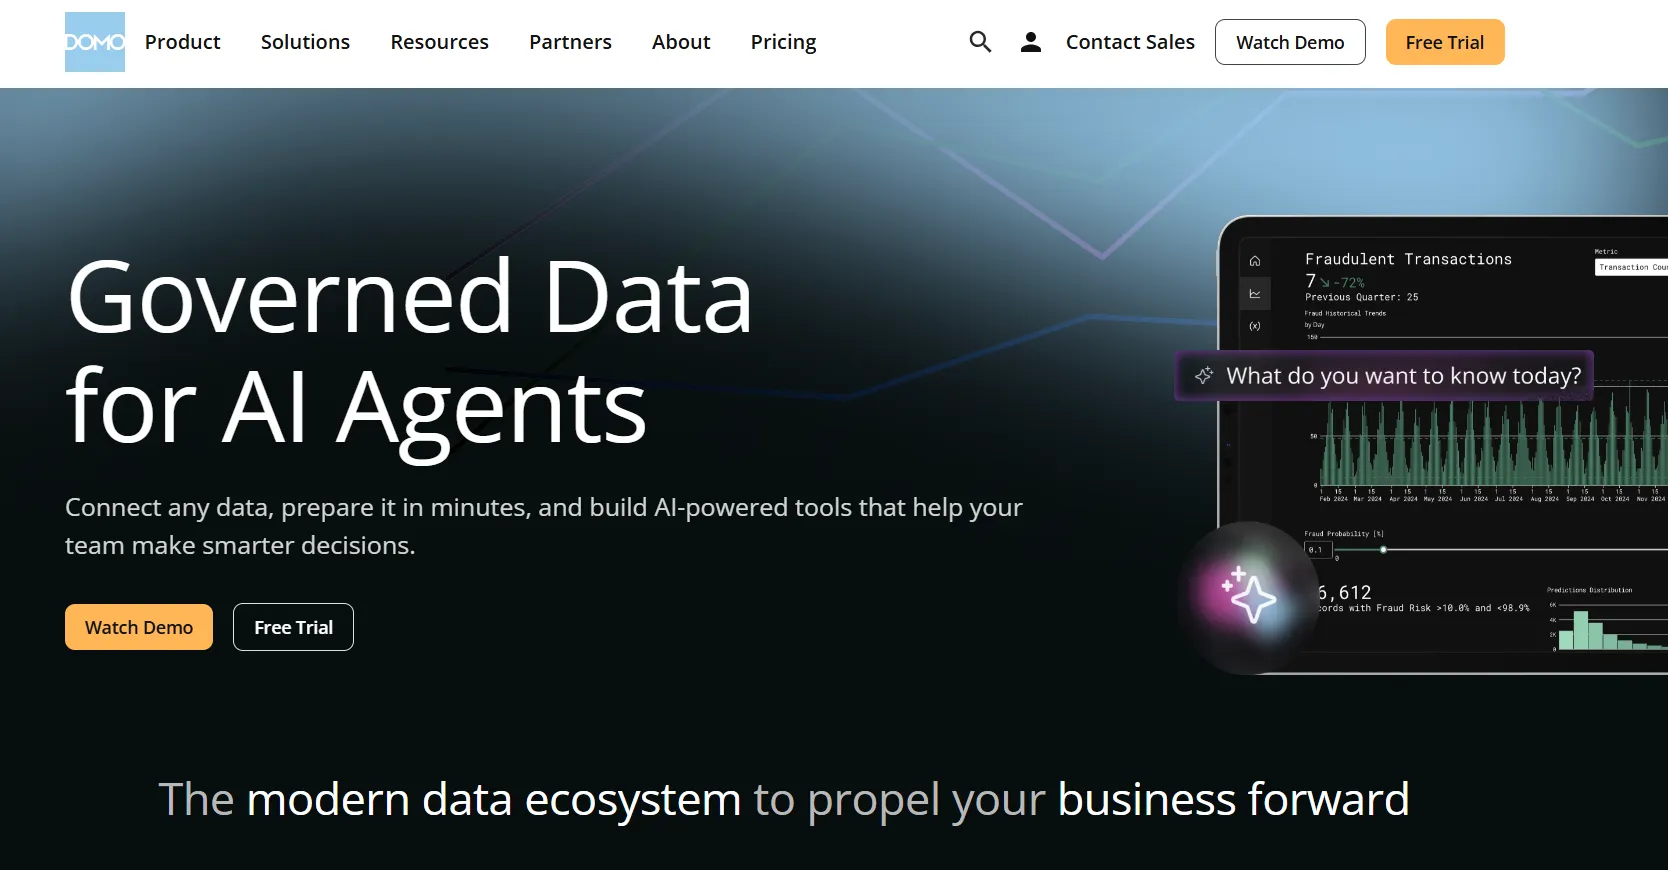
Range is Domo's selling point.
A single platform carries the work from connecting sources through to live dashboards and the low-code apps built on them, with AI layered in.
Domo's top features
- Cards and data apps: Build reports from modular Cards, then layer no-code apps for planning or monitoring on top.
- Conversational AI with agents: Query in natural language, or assign an agent to a metric so it raises alerts the moment a threshold breaks.
- Low-code app studio: Ship forecasting and monitoring apps with minimal engineering involvement.
- Deep connector library: Pull data in from a broad catalog of sources with little setup.
Domo pricing
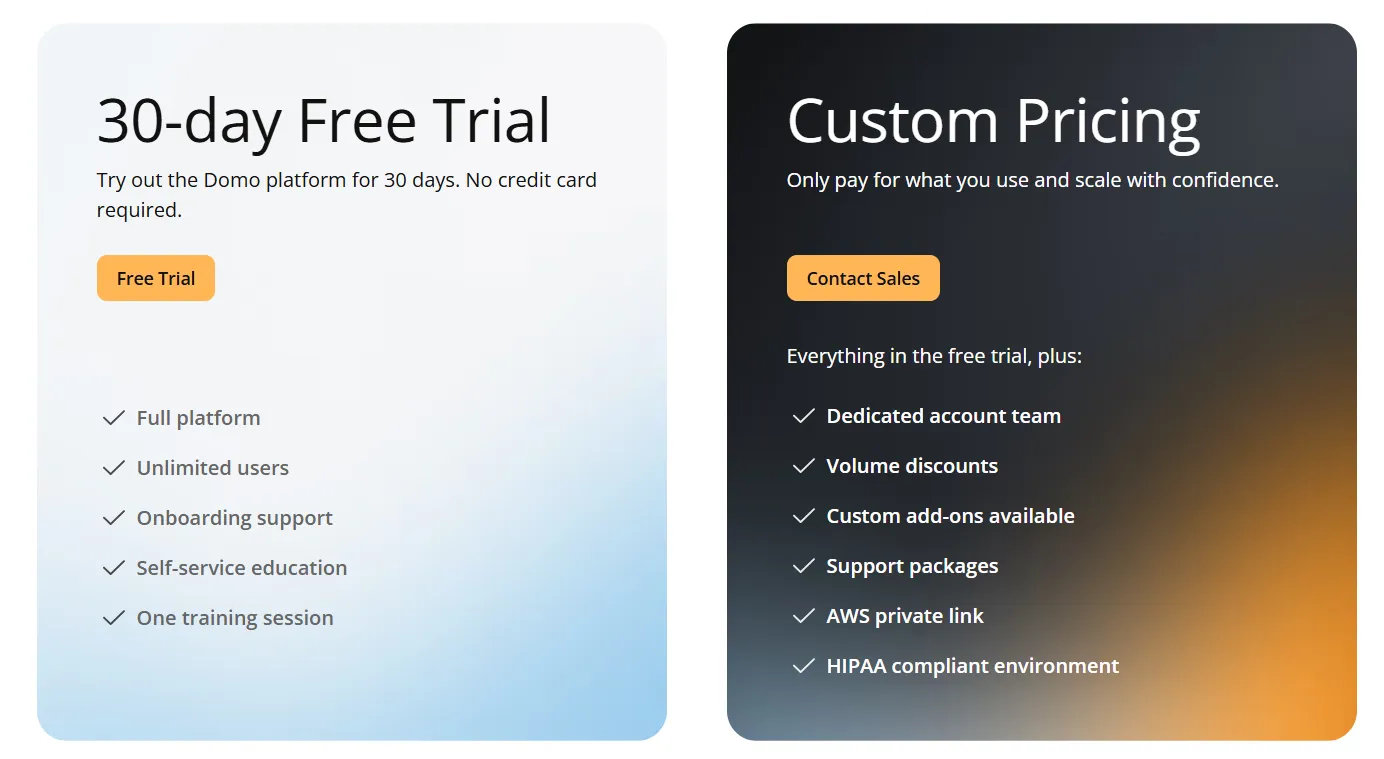
Domo runs one paid plan plus a free trial.
- Free trial: 30 days, no credit card needed, with full platform access for unlimited users and a guided training session.
- Paid plan: usage-based pricing that scales with analytics needs, adding a dedicated account team, volume discounts, and support packages.
Domo pros and cons
✅ Coverage runs the full path, from raw data to automated action, in one platform.
✅ The connector library is broad, so ingesting data is seldom the holdup.
Get started with Dot for free
Hex brings notebooks, data apps, an AI agent, and governed semantic models into a single workspace, which makes it a strong fit for technical data teams that also want to serve business users.
Dot takes a different approach: it hands back the written analysis and the scheduled report, delivered where your team already works, on the models you already have.
Here is what your team gets with Dot.
- Questions asked in Slack, Microsoft Teams, email, or the web app, answered in the same place, scheduled reports included.
- Reports that arrive as ready-to-present PowerPoints.
- A Context Agent that keeps definitions aligned, so teams stop reconciling numbers before meetings.
- Any figure traced back to its query and source data in one click, on the Snowflake, BigQuery, Redshift, and Databricks stack you already run, with SOC 2 Type II compliance and unlimited seats on paid plans.
➡️ Get started for free with Dot's free plan, or schedule a demo to see how it works with your data.
⚠️ Disclaimer: This article was last updated on July 1, 2026. If you spot any inaccuracies, contact us, and we'll fact-check it.
Theo Tortorici
Theo writes about AI-powered analytics, data tools, and the future of business intelligence at Dot.