
10 Best DataGPT Alternatives & Competitors In 2026
In this guide, I'll cover the 10 best DataGPT competitors in 2026 after its shutdown, breaking down what each tool does well and which one fits depending on how your team works with data.
TL;DR
- The best alternative to DataGPT on the market is Dot, because it delivers analyst-grade conversational analytics with narrative insights, automated executive reports, and shared business context, all starting with a free plan.
- Tools like Tellius, ThoughtSpot, and Supaboard are strong options if you want AI-driven analytics with natural language querying, automated root cause analysis, and self-service exploration without relying on traditional dashboards.
- On the other hand, tools like Tableau, Looker, Sigma, and Metabase are better suited for teams that prefer structured BI with dashboards, semantic layers, and governed reporting alongside more flexibility in visualizations and deployment.
Factors To Consider When Evaluating DataGPT Alternatives
Before we get into the list, here are the factors I'd weigh when looking for a DataGPT replacement:
1. Depth of conversational analytics
DataGPT's core strength was answering complex "why" questions, not just showing what happened.
If that's the workflow your team relied on, look for platforms that go beyond basic text-to-SQL and actually plan multi-step investigations, surface root causes, and explain metric changes in plain language.
Not every tool marketed as "AI analytics" does this, so testing with real business questions before committing is worth the time.
2. Automated reporting and insight delivery
One area where DataGPT was more limited was automated, recurring reporting.
If your team needs executive-ready business reviews delivered on a schedule, or proactive alerts when metrics shift, prioritize tools that can generate narrative reports, not just dashboard snapshots.
The difference between a tool that answers questions and one that proactively tells you what changed is significant for leadership adoption.
3. Pricing flexibility and time-to-value
DataGPT required annual contracts starting at $2,750 per month with no free plan.
As you evaluate alternatives, consider whether the platform offers a free tier or trial, so your team can validate the workflow with your own data before committing budget.
➡️ Some of the platforms we'll review, including Dot (that's us), offer a free plan that lets you test conversational analytics without a financial commitment.
4. Visualization and integration breadth
DataGPT prioritized depth of analysis over breadth of visualization.
If your team also needs polished charts, branded dashboards, or the ability to embed analytics into other tools, evaluate whether each platform covers both analysis and presentation needs.
Also check whether it integrates with the tools your team already uses daily, like Slack, Teams, or your cloud data warehouse.
What Are the 10 Best DataGPT Alternatives & Competitors in 2026?
The best DataGPT alternatives in 2026 are Dot, Tellius, and ThoughtSpot.
Here's the full list:
Tool | What It's Best At | Pricing |
Dot | AI data analyst that delivers narrative insights, automated executive reports, and ad-hoc analysis via Slack or Teams | Free plan, paid plans start at $699 per month |
Tellius | AI-powered conversational analytics with automated root cause and key driver analysis | Custom pricing |
ThoughtSpot | Natural language search-driven analytics with AI agents and automated dashboards | From $25 per user per month |
Supaboard | AI-native analytics with trainable agents and no-code dashboards | From $85 per month |
Tableau | Advanced data visualization and exploratory analysis for complex datasets | From $75 per user per month |
Looker | Governed, warehouse-native BI with a centralized semantic layer | Custom pricing |
Sigma | Spreadsheet-style analytics on live warehouse data | Custom pricing |
Metabase | Open-source BI with self-service dashboards and a lightweight setup | Free (open source), cloud from $100 per month |
Mode | SQL-first analytics combining queries, Python and R notebooks, and reporting | Free plan, paid plans at custom pricing |
Zoho Analytics | Budget-friendly BI with dashboards, AI features, and strong Zoho ecosystem integration | From $60 per month |
#1: Dot
Dot is the best alternative to DataGPT in 2026 for analytics teams and business leaders who want conversational, analyst-grade insights delivered directly where they work, with the flexibility to start on a free plan.
Like DataGPT, Dot answers business questions in natural language.
But it takes a broader approach by acting as a full AI data analyst that connects to your warehouse, runs deep analysis, and returns narrative answers with recommendations, not just numbers and charts.
It also automates executive-ready business review reports, handles ad-hoc questions in Slack or Teams, and maintains shared business definitions so every team sees the same numbers.
Here are the features that make Dot a strong DataGPT alternative. 👇
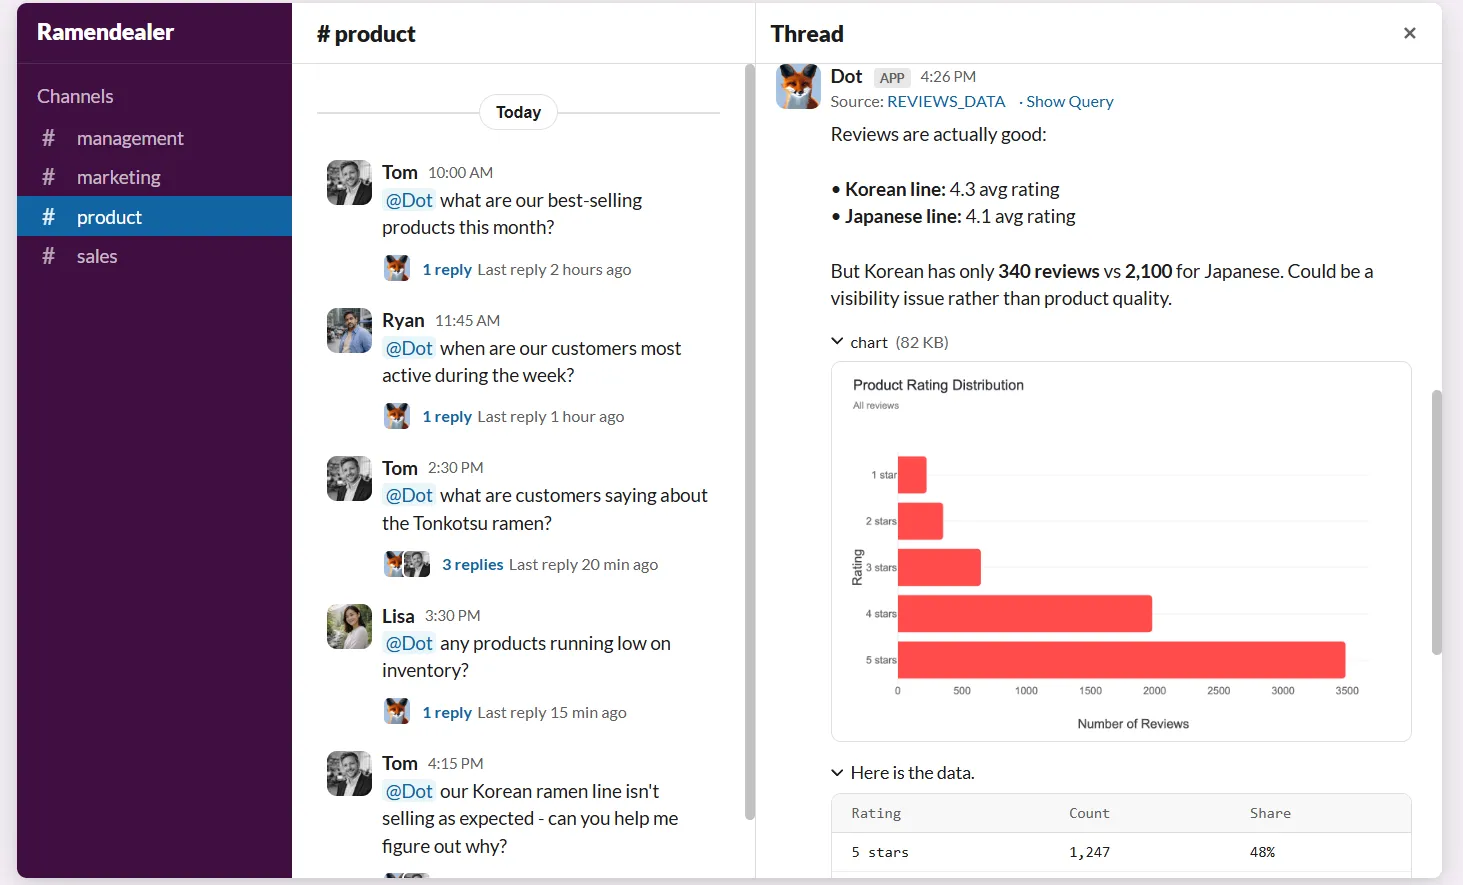
Ad-Hoc Deep Data Analysis via Slack or Teams
DataGPT worked through its own web interface. Dot takes a different approach by meeting teams where they already work.
Anyone can ask a plain-English question in Slack or Microsoft Teams and get a complete analysis back in minutes.
The response doesn't just return a number.
It explains what's happening, why it's likely happening, and which segments or regions are driving the change.
This is especially useful for data teams because it absorbs the constant stream of ad-hoc requests that normally eat into planned work.
Business users get answers without learning SQL or navigating dashboards, while analysts reclaim time for higher-impact projects.
Persistent Business Context and Shared Definitions
One of the biggest challenges with any analytics setup is context drift. Metrics get defined differently across reports. Teams start debating numbers instead of acting on them.
Dot solves this with a Context Agent that learns and maintains business definitions, metric logic, and documentation across your data environment.
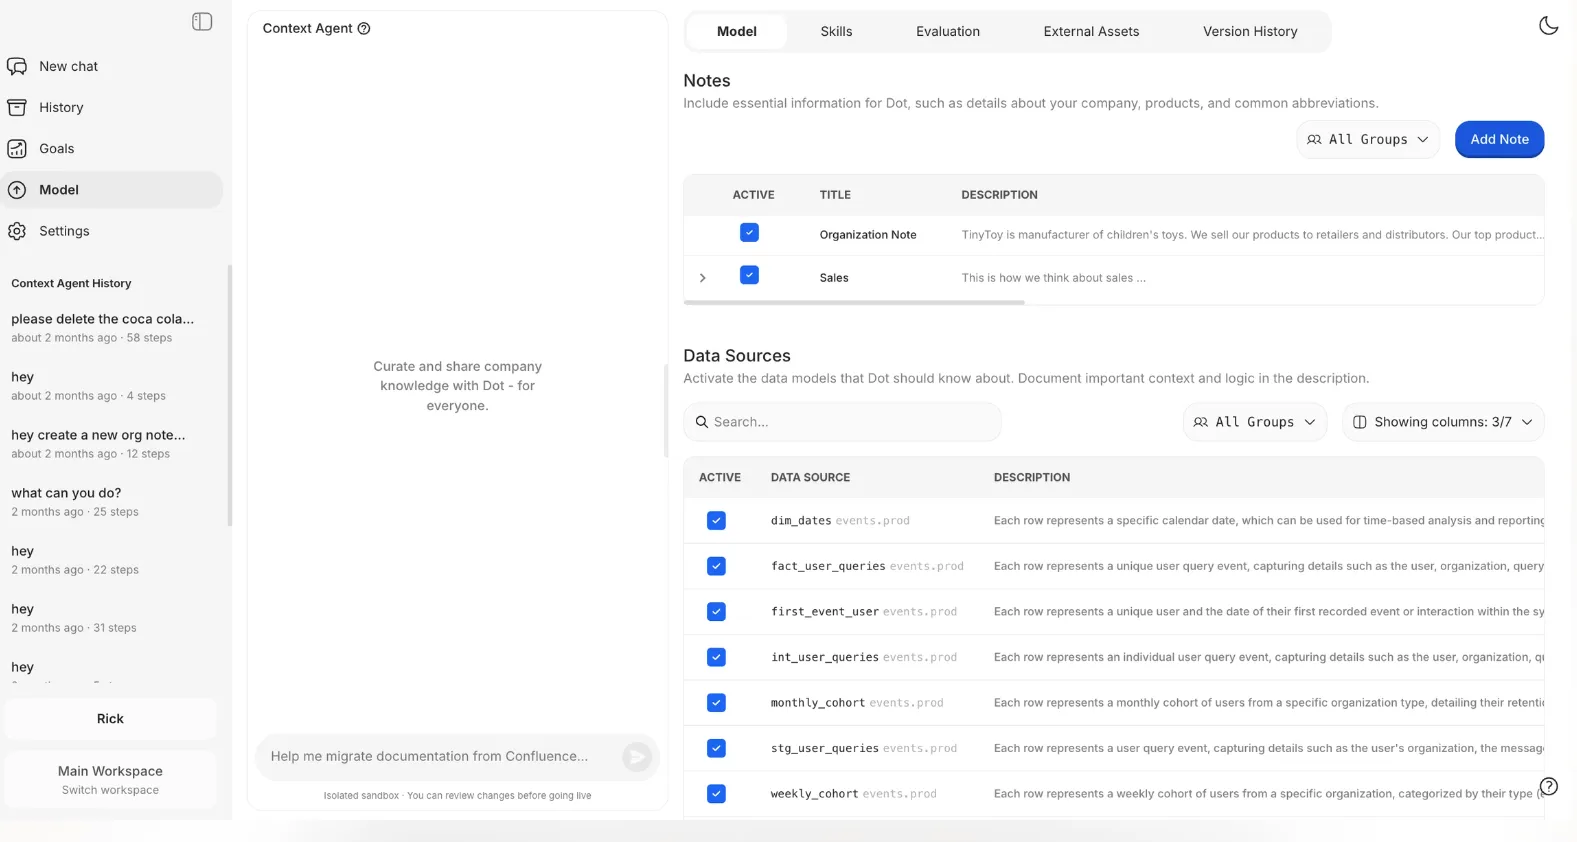
It tracks how key metrics are calculated, which tables should be used, and how different teams refer to the same concepts.
Then it applies that context every time it produces an insight or report.
In practice, you can finally stop asking "which report has the right number?"
This is because every answer is grounded in the same shared understanding of the business.
Automated Business Review Reports
Preparing weekly or monthly business reviews usually means analysts spend hours pulling dashboards, double-checking figures, exporting slides, and explaining what changed.
The dashboard shows the data, but the actual analysis still lives in someone's head.
Dot automates the entire business review, not just the visuals.
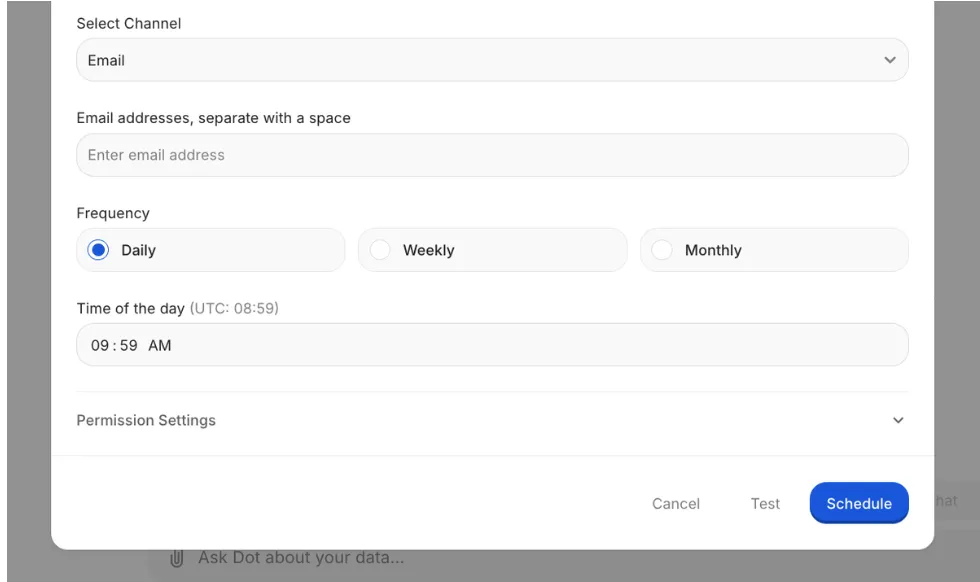
It generates executive-ready reports on a set schedule directly from your data warehouse.
Raw metrics become a written narrative that explains what happened, what shifted compared to prior periods, and where leadership should focus.
Leadership gets a consistent, easy-to-read update without interpreting dashboards.
And data teams stop spending a huge portion of their time producing the same reports week after week.
Full Audit Trail for Every Insight
A common concern with AI-driven analytics is the "black box" problem. You get an answer, but you can't see exactly how it was produced.
Dot attaches a full audit trail to every insight it generates. Each answer links directly back to the underlying SQL queries, Python logic, and datasets used.
Everything is transparent and inspectable.
This matters for data leaders and analysts who need to stand behind the numbers, especially when presenting to executives or making decisions that affect budgets and strategy.
How Does Dot Compare to DataGPT?
Both Dot and DataGPT were built around the same core idea: let anyone ask a business question in natural language and get an analyst-grade answer.
DataGPT excelled at deep statistical analysis to explain "why" metrics changed.
Its core analytics engine could process thousands of queries in milliseconds, and its Data Navigator let users drill into segments with precision.
Dot carries that conversational analytics approach forward while adding capabilities that DataGPT didn't offer.
Our platform:
- Produces full narrative analysis with actionable recommendations.
- Automates recurring business reviews on a schedule.
- Maintains shared business context across teams.
- Works directly inside Slack and Teams.
And where DataGPT required annual contracts starting at $2,750 per month, Dot offers a free Starter plan so teams can start immediately.
Dot’s integrations
We designed Dot to work on top of the tools teams already use, rather than forcing data into a new BI-specific model.
The platform connects directly to modern data warehouses like Snowflake, BigQuery, Redshift, Databricks, and even operational databases such as Postgres, MySQL, and SQL Server, so analysis happens where the data already lives.
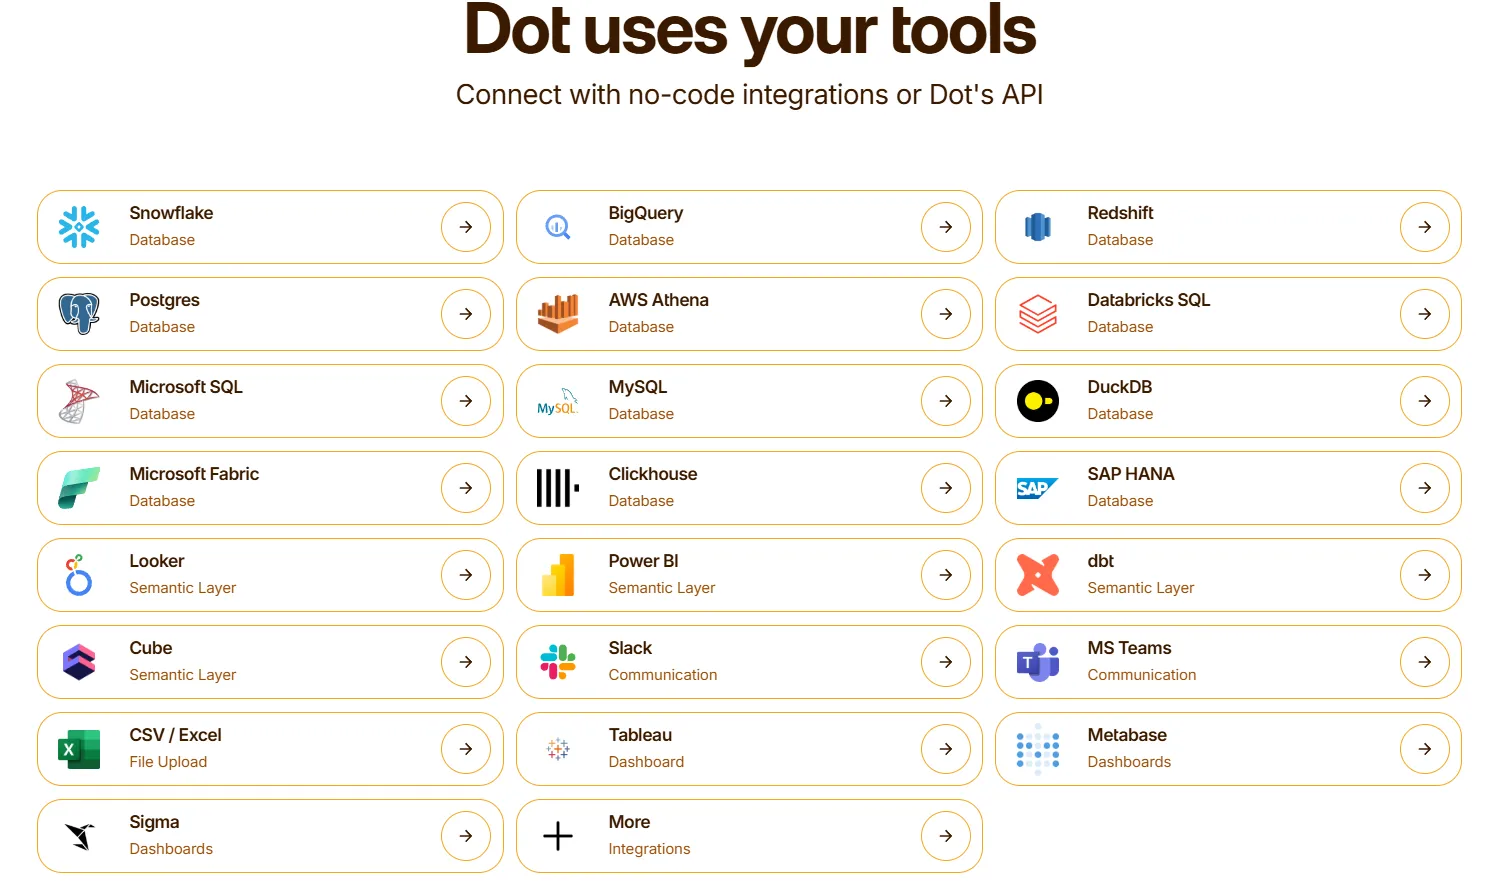
Beyond raw data access, Dot also integrates with semantic layers and transformation tools like dbt, Looker, Power BI models, and Cube.
That means it can reuse existing business logic and metric definitions instead of recreating them inside yet another analytics tool, which is a common pain point with traditional BI setups.
Pricing
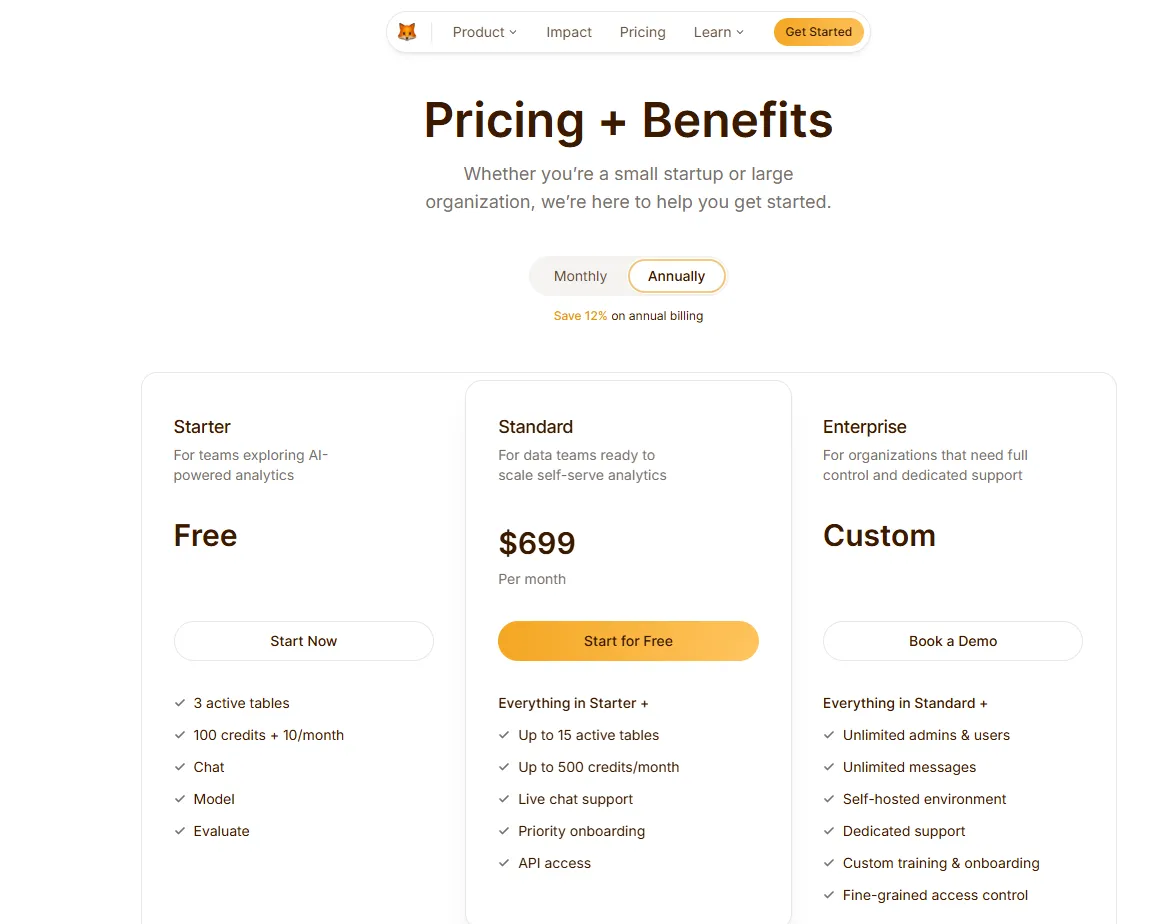
Dot uses a credit-based pricing model, with plans designed to scale from early experimentation to enterprise-wide usage:
- Starter: Free plan that lets you get started without committing, includes 3 active tables, 100 credits and 10 credits per month, chat-based analysis, and model and evaluation access.
- Standard: $699 per month when billed annually, includes everything in Starter, up to 15 active tables, up to 500 credits per month, additional credits at $1.40 per credit, live chat support, priority onboarding, and API access.
- Enterprise: Custom pricing, includes everything in Standard, unlimited users and admins, unlimited messages, self-hosted environment, dedicated support, custom onboarding and training, and fine-grained access controls.
For teams migrating from DataGPT, Dot's free Starter plan makes it easy to validate the workflow with your own data before committing any budget.
Pros & Cons
✅ Delivers clear explanations and recommendations in minutes via Slack or Teams.
✅ Shared business context and definitions reduce metric drift and “which number is right?” debates across your organization.
✅ Full audit trail on every insight, with transparent links to underlying SQL, logic, and datasets.
✅ Architecture that works directly on modern data stacks without copying or reshaping data.
✅ Flexible pricing structure based on usage rather than per-seat licensing.
❌ Not a traditional BI or dashboarding tool.
#2: Tellius
Best for: Business and analytics teams that need explainable AI-driven answers to complex questions without relying on dashboards or SQL.
Similar to: ThoughtSpot.
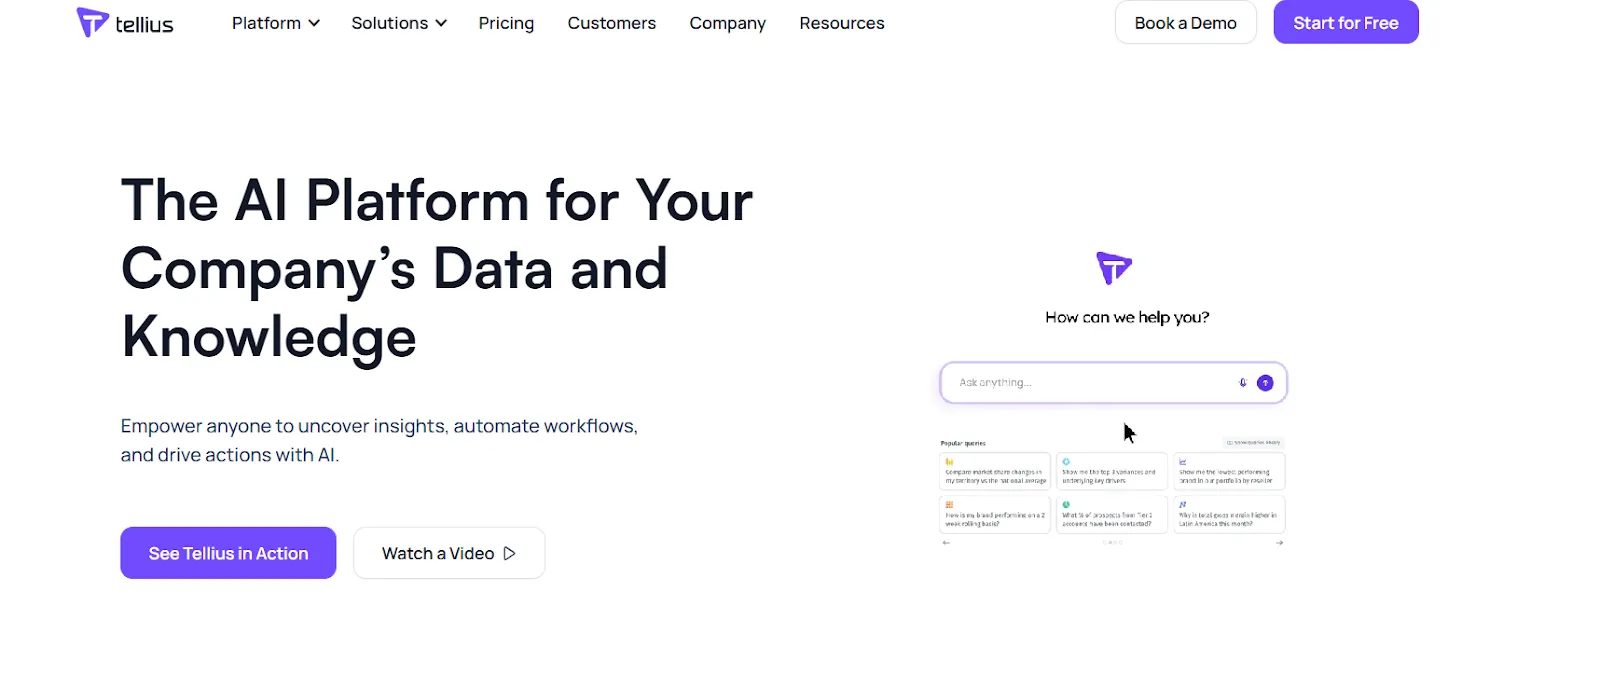
Tellius is an AI-powered analytics platform that lets users ask natural-language questions across enterprise data and receive instant, explainable answers.
The platform pairs conversational analytics with automated root cause analysis and AI-generated narratives.
Tellius's Top Features
- Conversational interface: Ask complex business questions in natural language on top of governed enterprise data and receive context-aware answers backed by explainable AI.
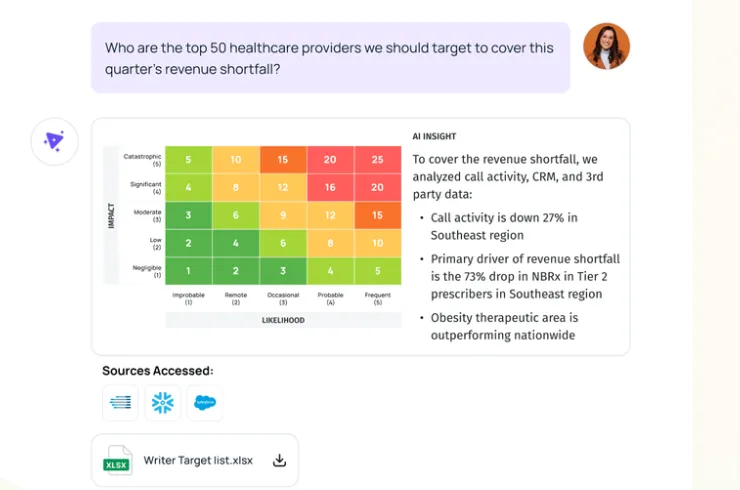
- Automated root cause and key driver analysis: The platform uncovers trends, cohorts, anomalies, and the factors driving metric changes across billions of data points without manual configuration.
- AI-generated visualizations and narratives: Turns complex analyses into interactive charts and written narratives that teams can explore, drill into, and share without building traditional dashboards.
Tellius Pricing
Tellius offers two plans, both with custom pricing:
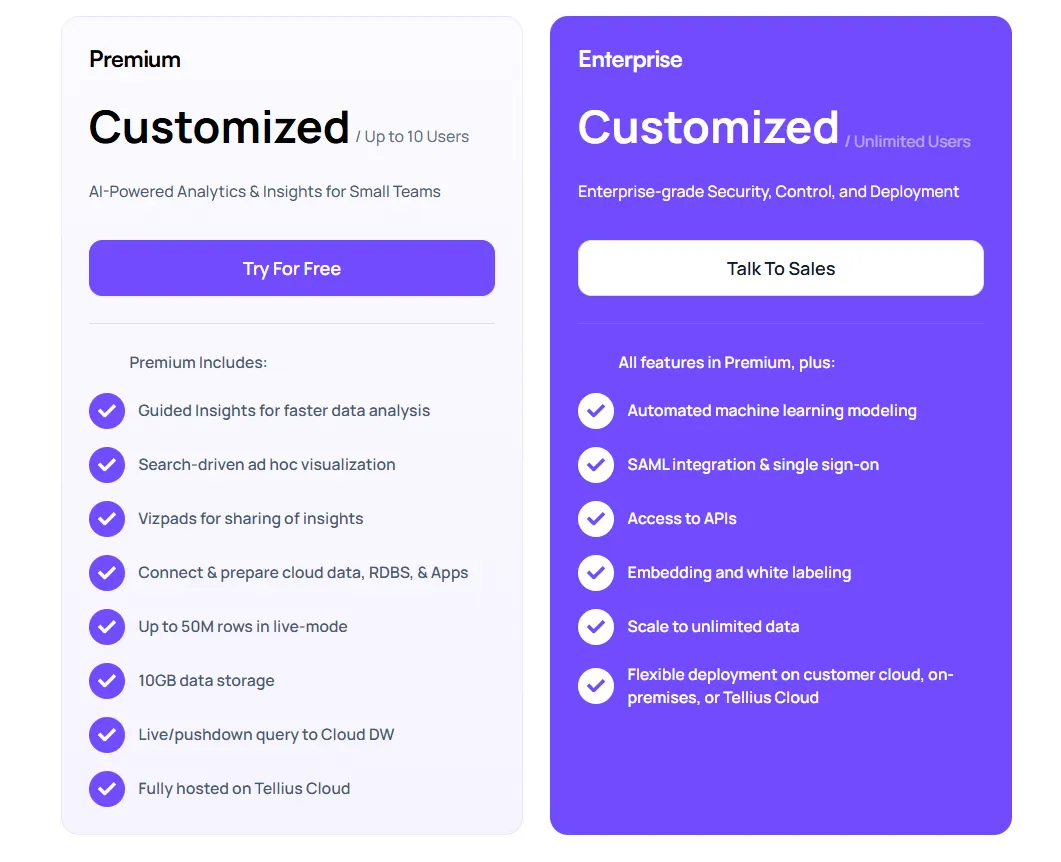
- Premium: Custom pricing for up to 10 users, includes conversational analytics, guided insights, ad-hoc visualizations, live queries to cloud warehouses, data prep, up to 50M rows in live mode, 10GB storage, and hosted deployment.
- Enterprise: Custom pricing with unlimited users, includes everything in Premium, plus automated ML modeling, SSO, API access, embedding, white-labeling, unlimited data scale, and flexible deployment options.
You'll need to contact Tellius sales for actual numbers.
Tellius Pros and Cons
✅ Intuitive, visual-first interface that makes AI-driven insights accessible to non-technical users.
✅ Strong automated analytics that surface root causes and key drivers without manual queries.
❌ Pricing can be prohibitive for smaller teams.
❌ Narrower self-service customization compared to full BI platforms.
#3: ThoughtSpot
Best for: Organizations that want self-service analytics with natural language search and AI-generated dashboards, without traditional BI complexity.
Similar to: Tellius.
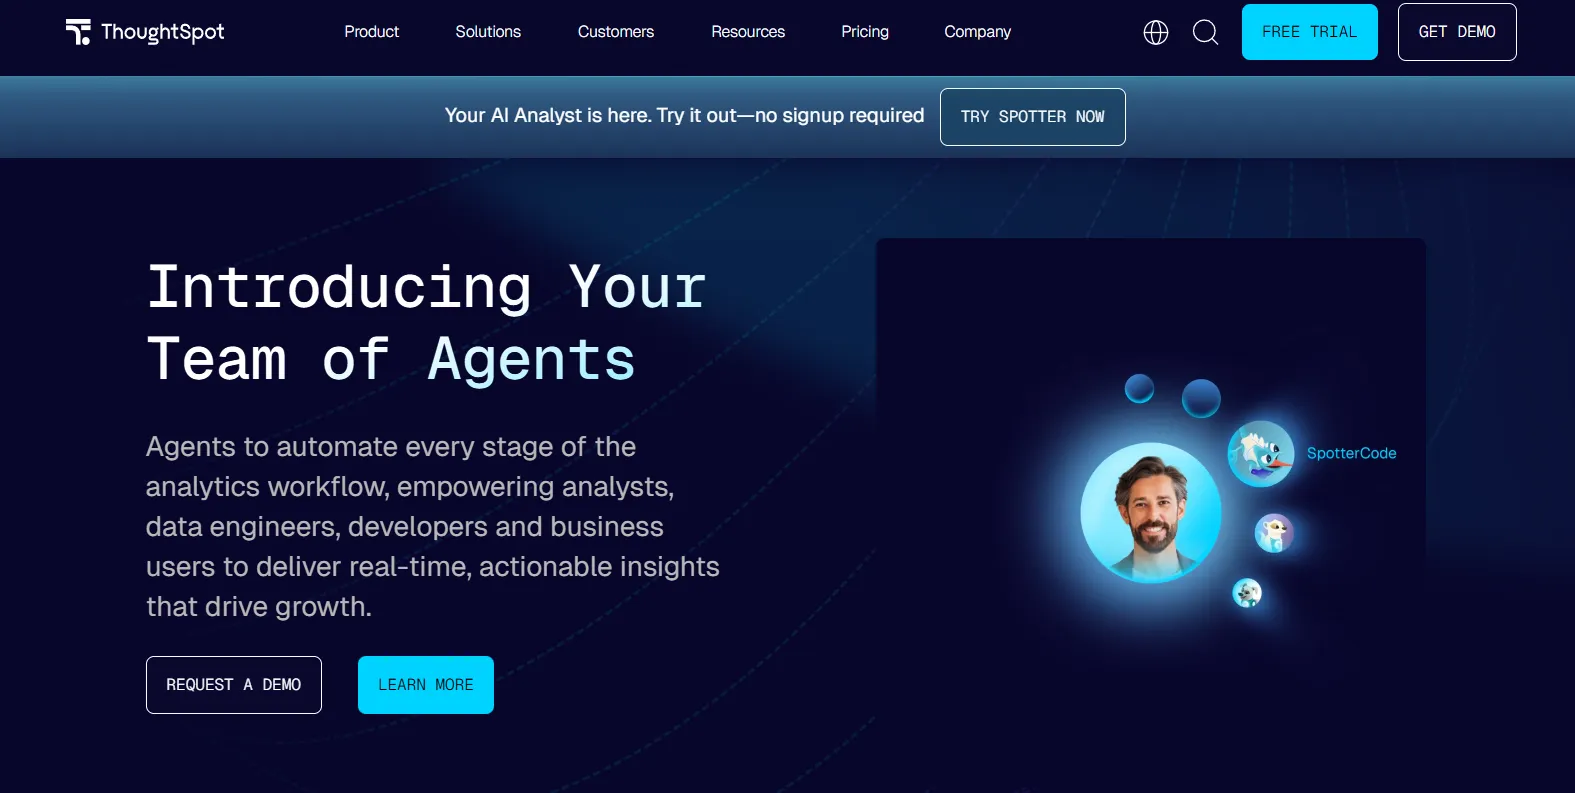
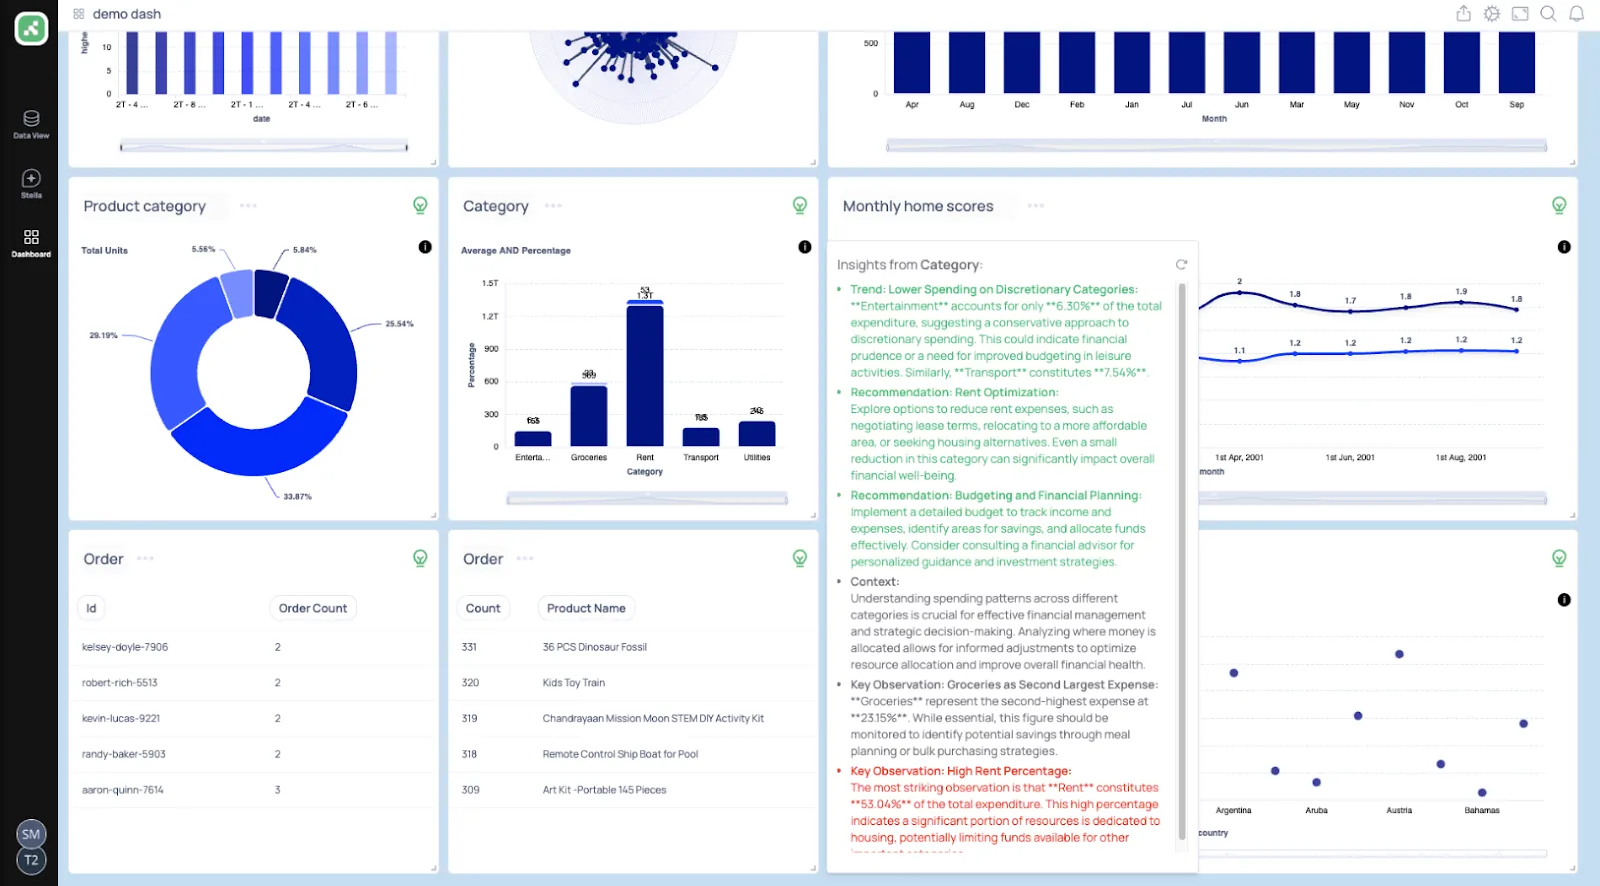
ThoughtSpot is built around letting users ask questions in plain English and get governed answers from live data.
Its Spotter AI agent can automatically generate analyses, dashboards, and insights, reducing the manual reporting workload.
ThoughtSpot's Top Features
- Natural language search: Ask questions in plain English and get instant, governed answers from live data without building or navigating dashboards.
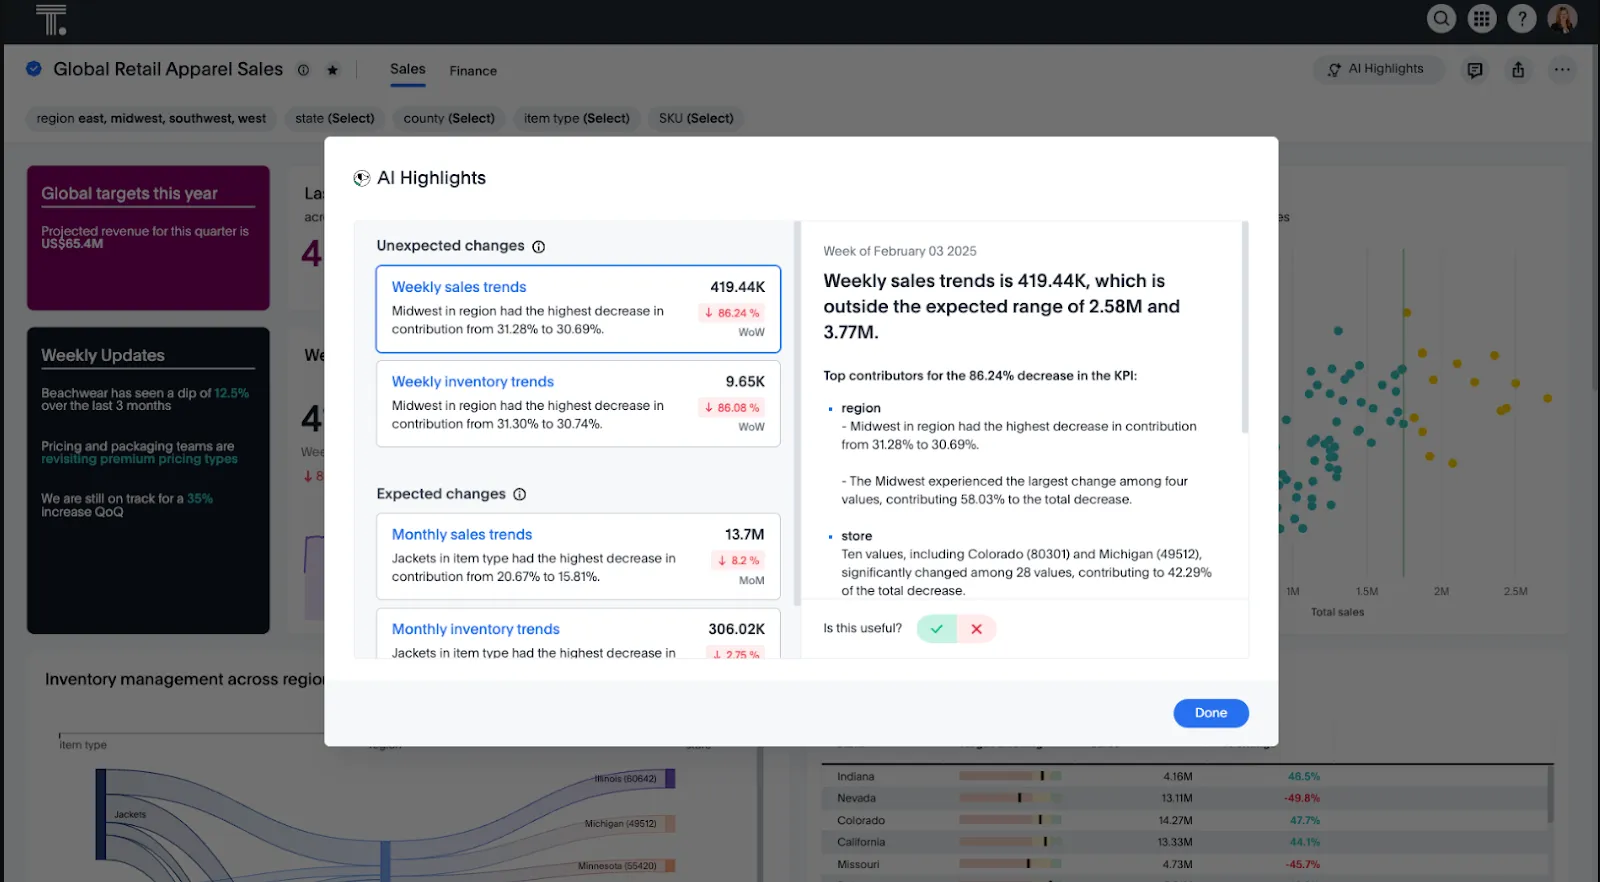
- Spotter AI agents: Agentic tools that automatically generate analyses, dashboards, and insights from unstructured data, cutting manual exploration time.
- Automated dashboards with SpotterViz: Turn data into complete, styled dashboards that tell a story, without manual layout or chart configuration.
ThoughtSpot Pricing
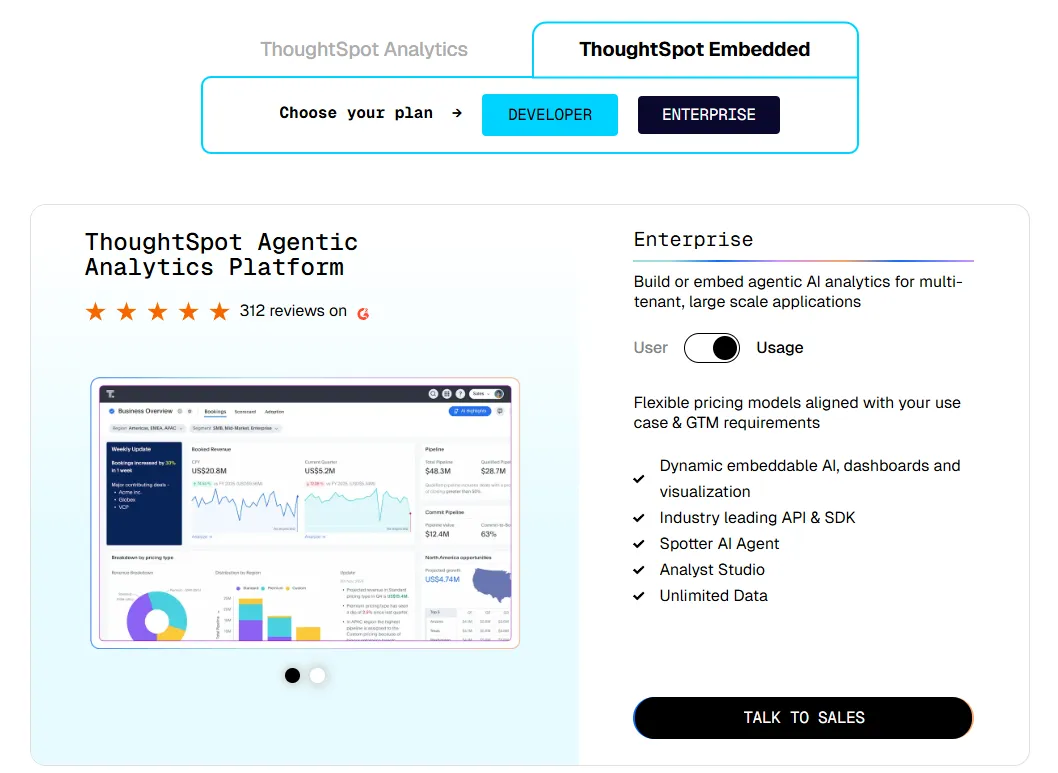
ThoughtSpot offers two separate products - ThoughtSpot Analytics for internal BI and ThoughtSpot Embedded for building analytics into applications - each with flexible pricing depending on scale and usage:
- ThoughtSpot Analytics:
- Essentials: From $25 per user per month (billed annually), for teams of 5-50 users, includes dynamic interactive dashboards and AI-powered insights and supports up to 25M rows of data.
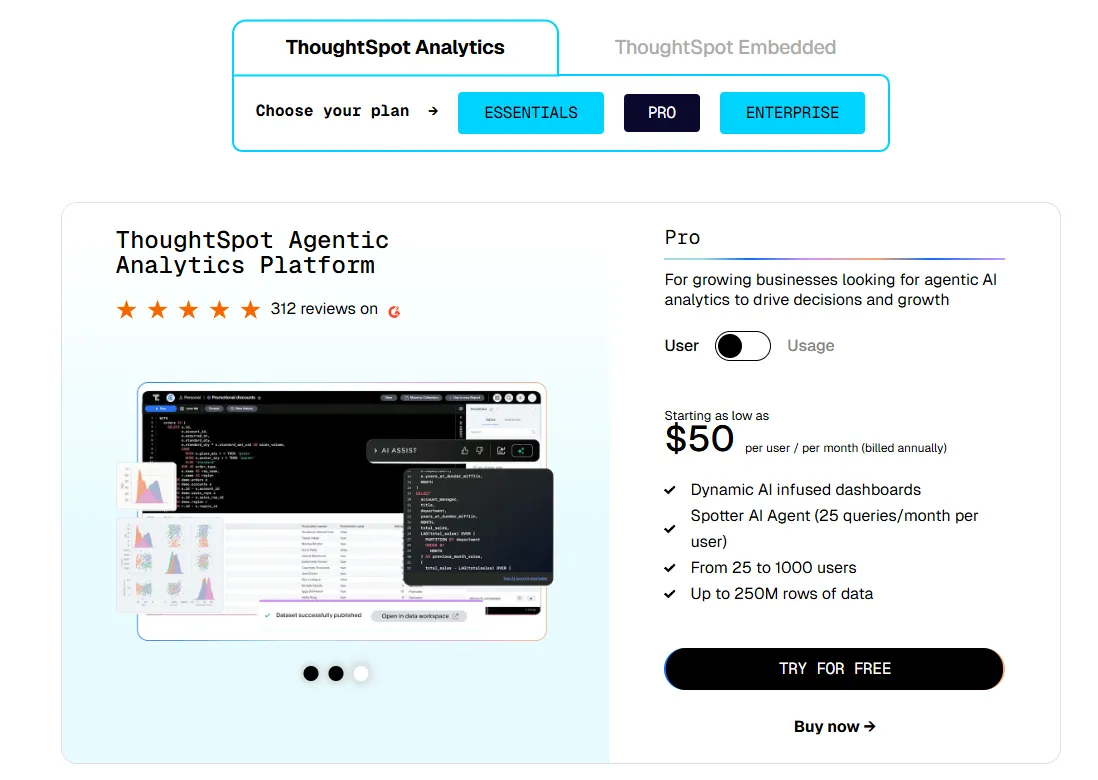
- Pro (per user pricing): From $50 per user per month (billed annually), for 25–1,000 users, includes everything in Essentials, plus AI-infused dashboards and Spotter AI Agent (25 queries per user/month), and supports up to 250M rows of data.
- Pro (usage-based): From $0.10 per query, includes everything in Pro per user, and adds Analyst Studio.
- Enterprise (user or usage-based): Custom pricing, includes everything in Pro, plus unlimited users and data.
- ThoughtSpot Embedded:
- Developer: Free for 1 year, includes embeddable AI analytics, dashboards, and visualizations, APIs and SDKs, up to 10 users and 25M rows of data.
- Enterprise (user-based): Custom pricing, includes everything in Developer, plus unlimited data.
- Enterprise (usage-based): Custom pricing, everything in Enterprise, plus Spotter AI Agent and Analyst Studio.
ThoughtSpot Pros and Cons
✅ Easy to use for non-technical users thanks to natural language search and guided analytics, unlike tools likeDomo that can feel complex to set up.
✅ Built-in AI surfaces patterns and explanations faster than traditional dashboards.
❌ Custom and usage-based pricing makes costs harder to predict, especially at scale.
❌ Requires careful governance setup to ensure AI-generated answers remain accurate.
#4: Supaboard
Best for: Teams that want AI-powered BI with no-code dashboards and natural-language analytics instead of traditional modeling workflows.
Similar to: Tellius.

Supaboard connects to your data sources and automatically generates dashboards, insights, and reports without requiring SQL or complex setup.
It focuses on letting business users ask questions in plain English and get instant visual answers.
Supaboard's Top Features
- Trainable AI agents: You can create agents trained on your business logic, SLAs, and definitions to deliver context-aware insights without building or maintaining data models.
- Data chat: It’s possible to ask questions in natural language and instantly receive metrics, charts, explanations, and recommended actions.
- Real-time dashboards: All you have to do is describe what you need, and Supaboard builds interactive dashboards, KPIs, and tables that update live.
Supaboard Pricing
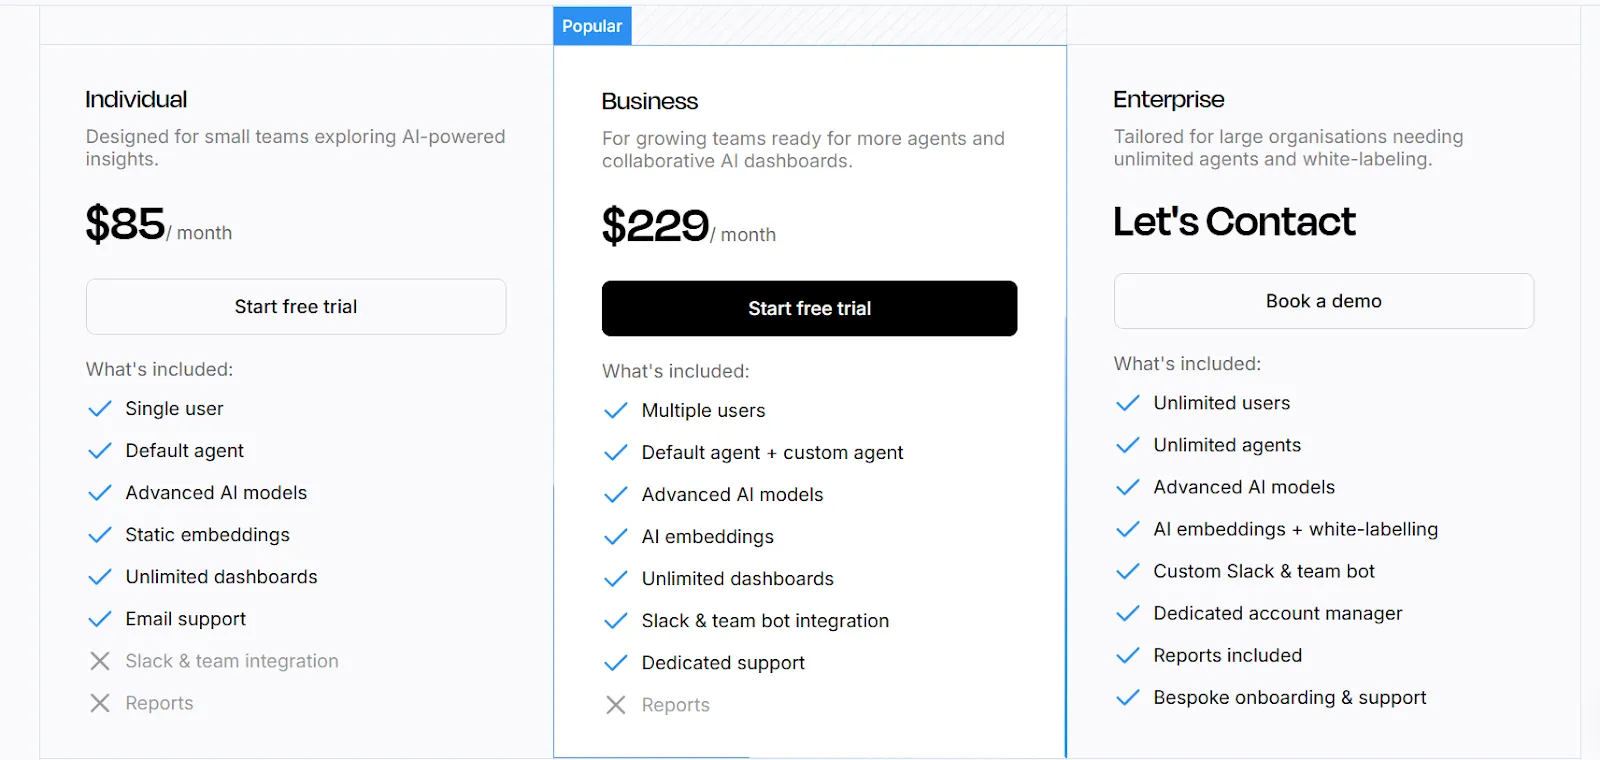
Supaboard has three pricing tiers:
- Individual: $85 per month, includes a single user, default AI agent, advanced AI models, static embeddings, unlimited dashboards, and email support.
- Business: $229 per month, includes everything in Individual, plus multiple users, custom agents, AI embeddings, Slack and team bot integration, and dedicated support.
- Enterprise: Custom pricing, includes everything in Business, plus unlimited users and agents, AI embeddings with white-labeling, custom Slack integrations, dedicated account manager, reports, and bespoke onboarding.
Supaboard Pros and Cons
✅ Very easy to connect data sources, including large CSV and KPI files.
✅ Natural-language querying makes data analysis fast and accessible for non-technical users.
❌ Limited dashboard customization compared to traditional BI tools.
❌ Smaller product with less brand recognition in the enterprise BI space.
#5: Tableau
Best for: Data teams and enterprises that need advanced data visualization, exploratory analysis, and flexible deployment options.
Similar to: Looker, Sigma.
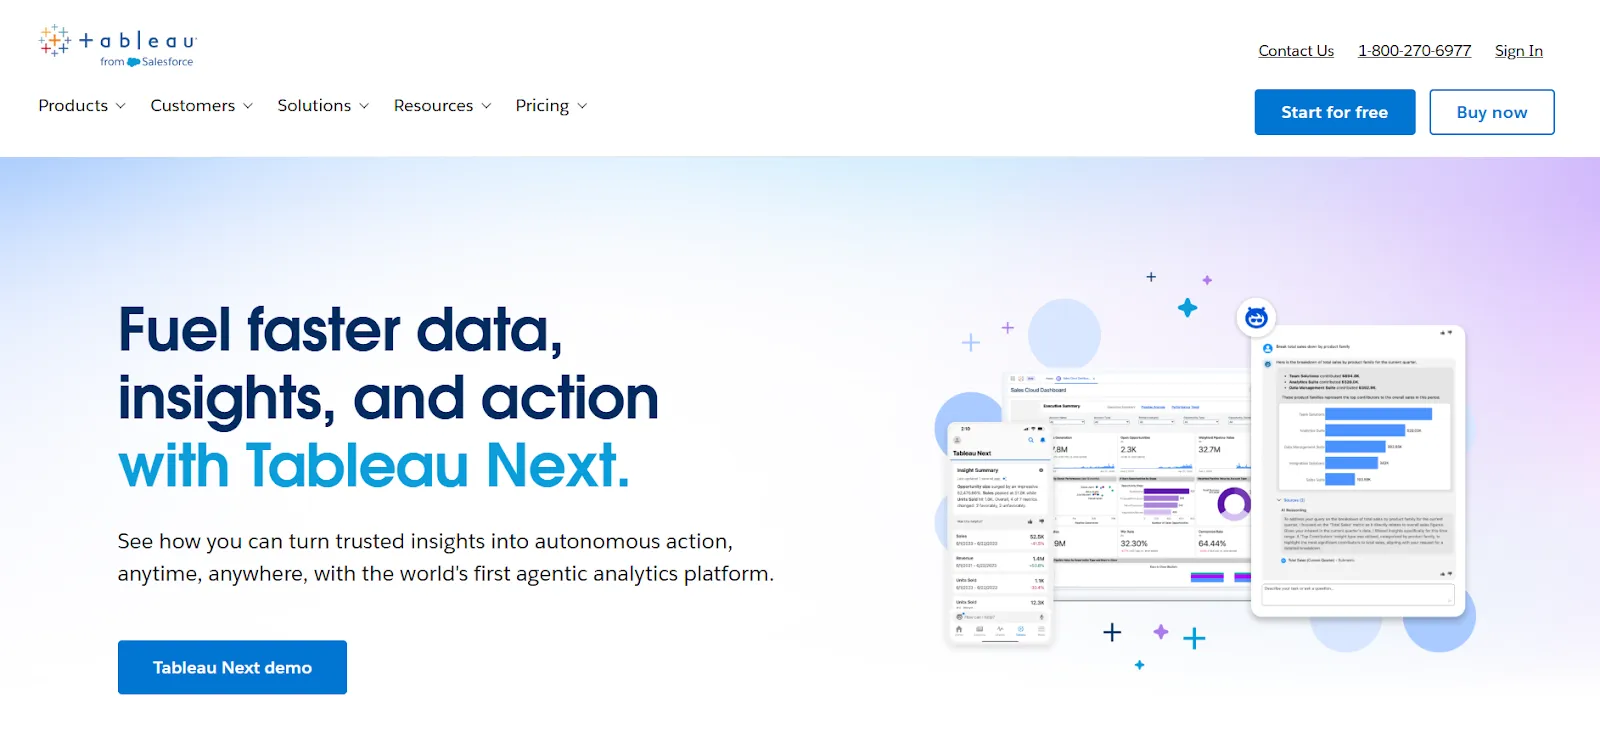
Tableau is one of the most established BI platforms on the market, known for its powerful visual analytics and drag-and-drop exploration.
It's built for teams that need rich charting, data storytelling, and the ability to work with complex datasets at scale.
Tableau's Top Features
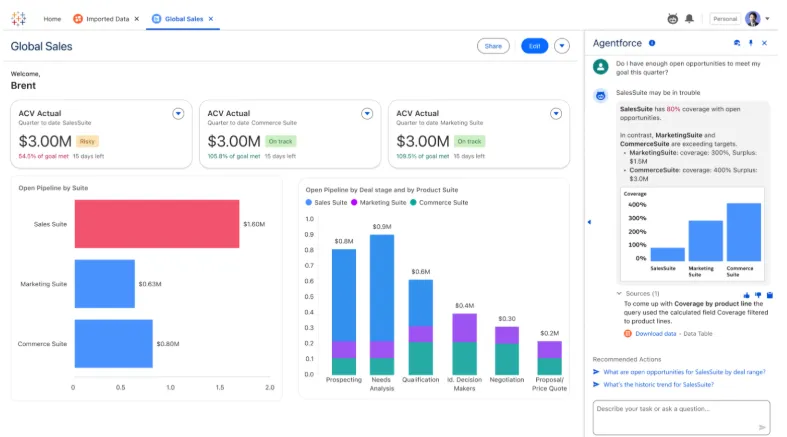
- Advanced visualizations and data storytelling: Create interactive charts, maps, and dashboards using a wide range of visualization types for polished, presentation-ready reporting.
- Drag-and-drop exploratory analysis: Explore data visually without writing code, build dashboards quickly, and iterate on insights in real time.
- AI-powered Tableau Pulse: Get automated metric summaries and natural language insights delivered into your workflow so teams can track changes as they happen.
Tableau Pricing
Tableau uses per-user, per-month pricing, with separate plans depending on whether you deploy Tableau in the cloud, on your own servers, or as part of its newer AI-driven offering:
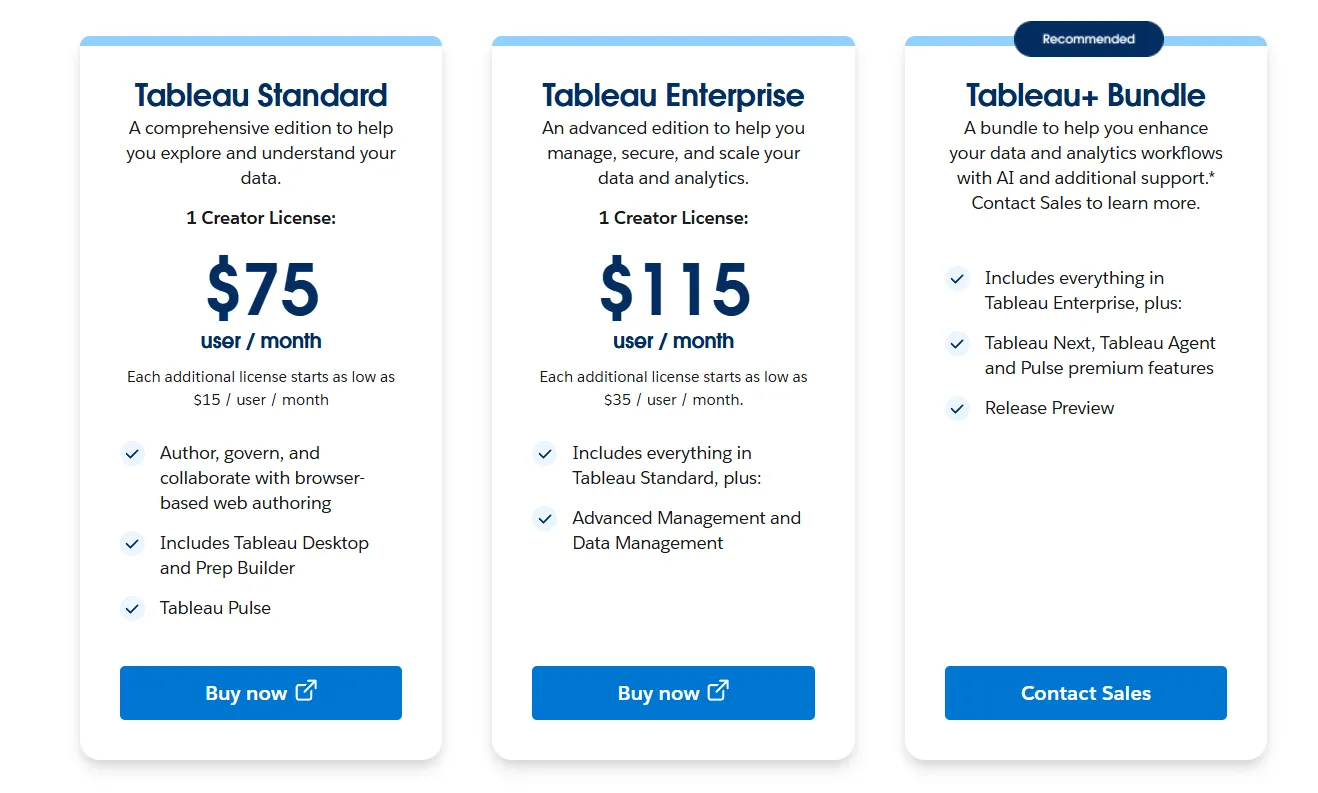
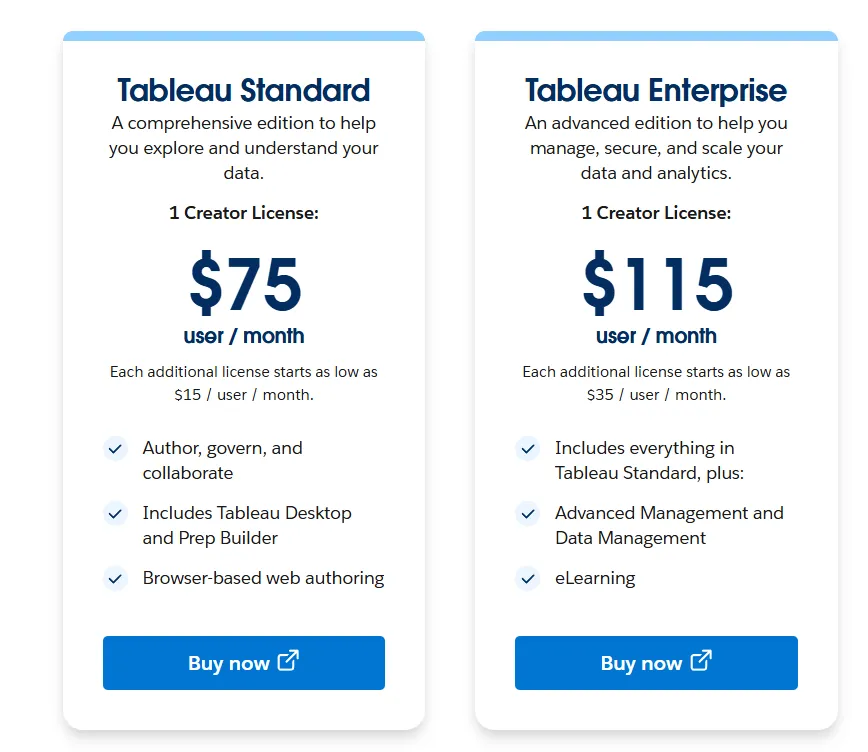
- Tableau Cloud has three pricing plans:
- Tableau Standard: $75 per 1 creator per month, with each additional license from $15 per user/month, includes browser-based authoring and collaboration, Tableau Desktop and Prep Builder, Tableau Pulse for metrics and insights.
- Tableau Enterprise: $115 per 1 creator per month, with each additional license from $35 per user/month, includes everything in Standard, plus Advanced Management and Data Management for governance and scale.
- Tableau+ Bundle (Cloud + AI): Custom pricing, includes everything in Tableau Enterprise, plus Tableau Next, Tableau Agent, and Pulse premium features, with access to release previews and early AI capabilities.
- Tableau Server has two pricing plans:
- Tableau Standard: $75 per 1 creator per month, with each additional license from $15 per user/month, includes authoring, governance, and collaboration and Tableau Desktop and Prep Builder.
- Tableau Enterprise: $115 per 1 creator per month, with each additional license from $35 per user/month, includes everything in Standard, plus Advanced Management, Data Management, and eLearning.
- Tableau Next (agentic analytics): Requires an annual contract, includes agentic analytics via Agentforce, Tableau Semantics, Tableau Pulse (including premium), and Data 360.
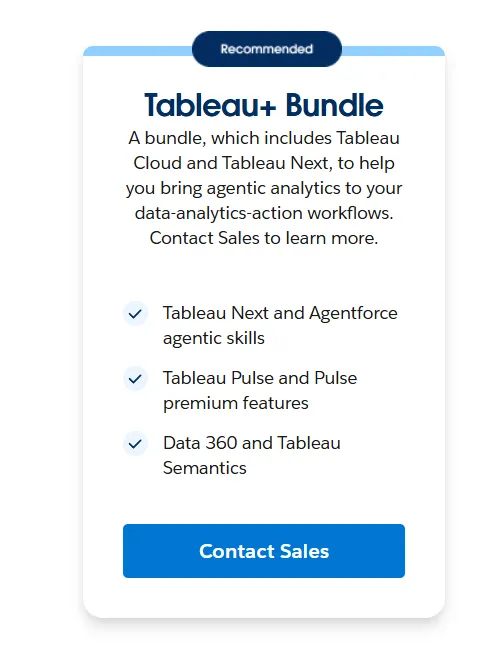
Tableau Pros and Cons
✅ Excellent data visualization and storytelling capabilities, unlike tools likePower BI that can feel more rigid in their charting options.
✅ Intuitive drag-and-drop analysis that lets users explore data and iterate quickly.
❌ Steep learning curve for advanced features like calculated fields, LOD expressions, and data modeling.
❌ Per-user pricing adds up fast for larger teams.
#6: Looker
Best for: Data teams that want governed, warehouse-native BI with consistent metrics and tight Google Cloud integration.
Similar to: Tableau, Sigma.
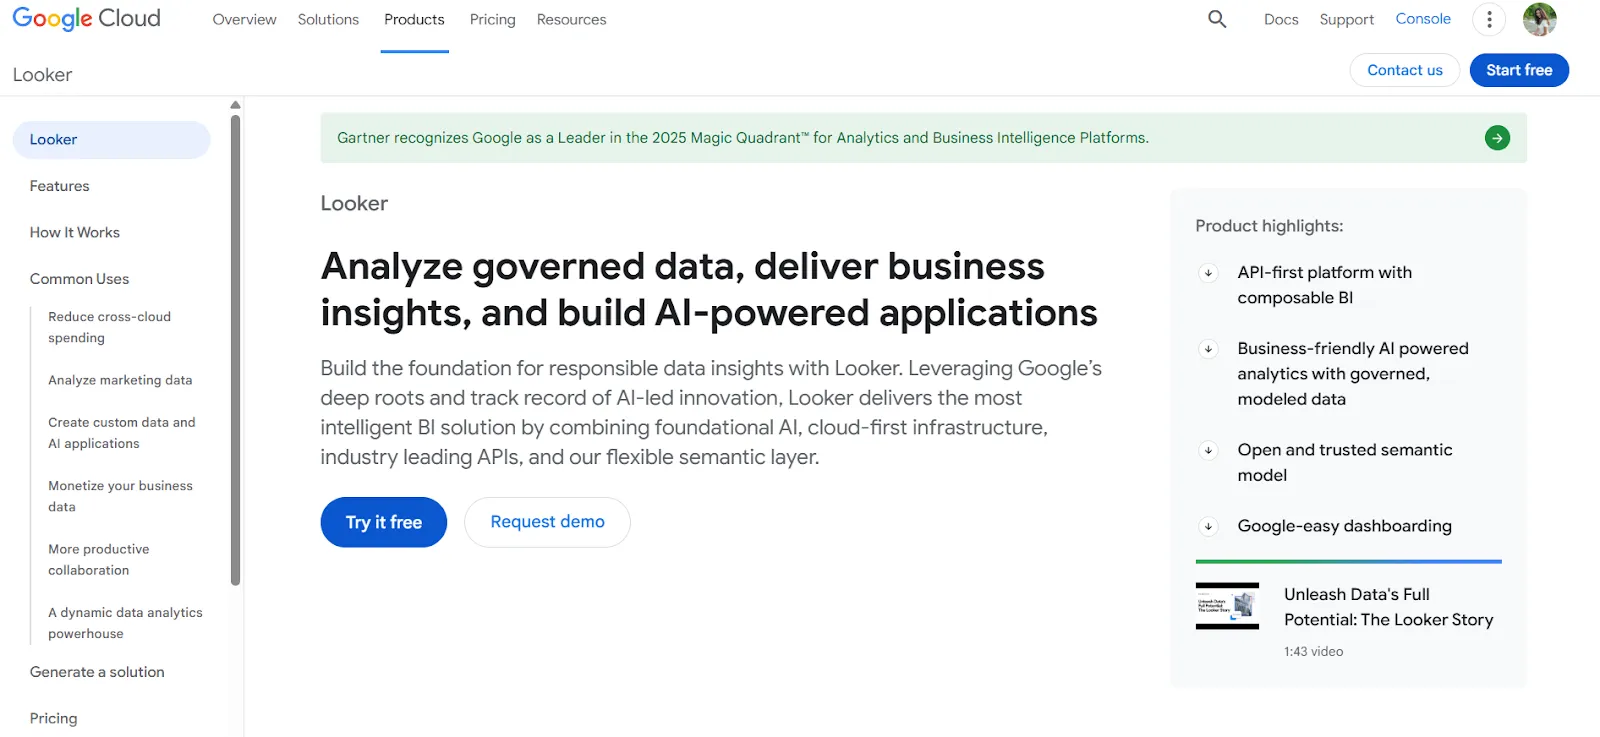
Looker is a BI platform organized around a centralized modeling layer called LookML.
Instead of standalone dashboards, it defines metrics and business rules in one place so every report pulls from the same logic.
Looker's Top Features
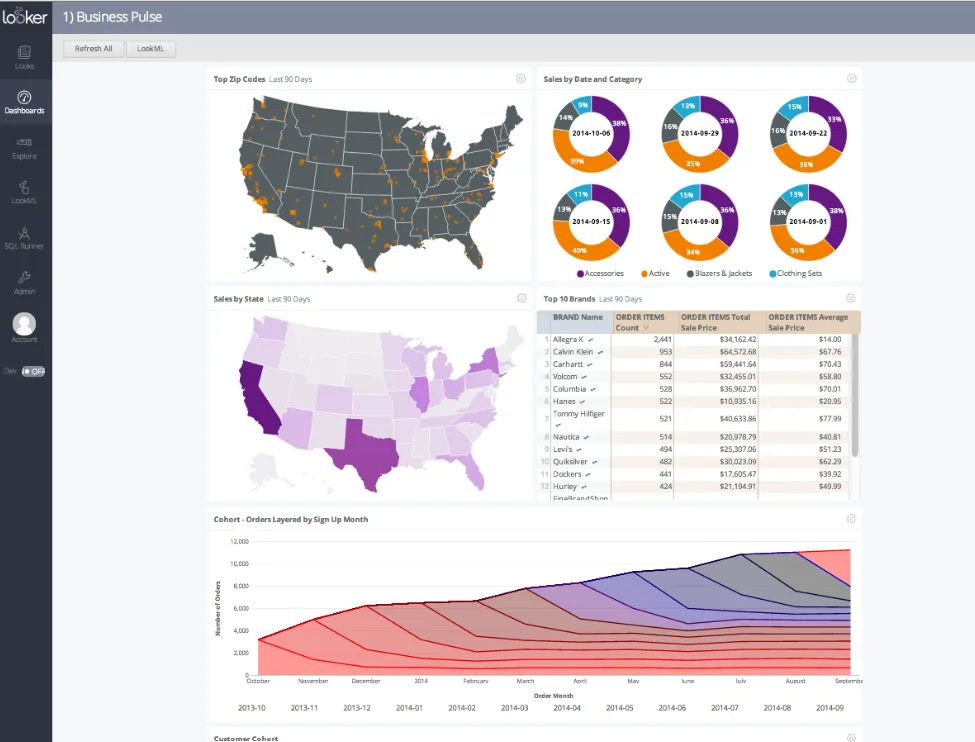
- Centralized semantic modeling with LookML: Define metrics and business rules once so everyone sees the same numbers across every dashboard and report.
- Conversational analytics powered by Gemini: Users can ask natural-language questions about their data without navigating dashboards.
- Real-time, governed dashboards: Dashboards pull data live from the warehouse so users explore, filter, and drill into trusted metrics.
Looker Pricing
Looker uses a custom, contract-based pricing model made up of two parts: platform pricing (the cost of running a Looker instance) and user licensing (the cost per user type).
Pricing is annual for all plans.
- Platform editions:
- Standard: Designed for small teams or organizations with fewer than 50 users, includes 1 production instance, 10 standard users + 2 developer users, up to 1,000 query-based API calls/month, and up to 1,000 admin API calls/month.
- Enterprise: Built for larger internal BI and analytics use cases, includes everything in Standard, plus enhanced security features, up to 100,000 query-based API calls/month, and up to 10,000 admin API calls/month.
- Embed: Designed for embedding analytics into external products or applications, includes everything in Standard, plus up to 500,000 query-based API calls/month and up to 100,000 admin API calls/month.
- User licensing:
- Developer users: Full access to Looker, including LookML development, administration, APIs, and advanced tooling.
- Standard users: Can explore data, build dashboards and reports, run SQL, and schedule content.
- Viewer users: Read-only access to dashboards and reports, with filtering and drill-down.
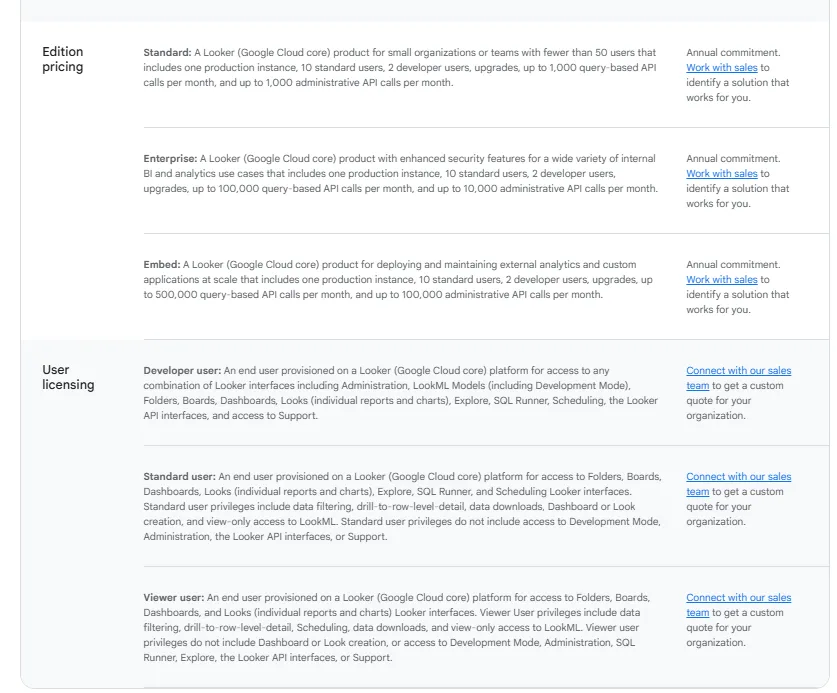
Pricing is custom on all plans and varies based on scale, permissions, and usage.
Looker Pros and Cons
✅ Keeps metrics consistent, so you define them once, and everyone sees the same numbers.
✅ Strong embedding capabilities for internal tools and customer-facing products.
❌ Steep learning curve, especially for teams without LookML experience, which is why some organizations have been looking forLooker alternatives.
❌ Custom-only pricing makes it hard to evaluate cost without a sales conversation.
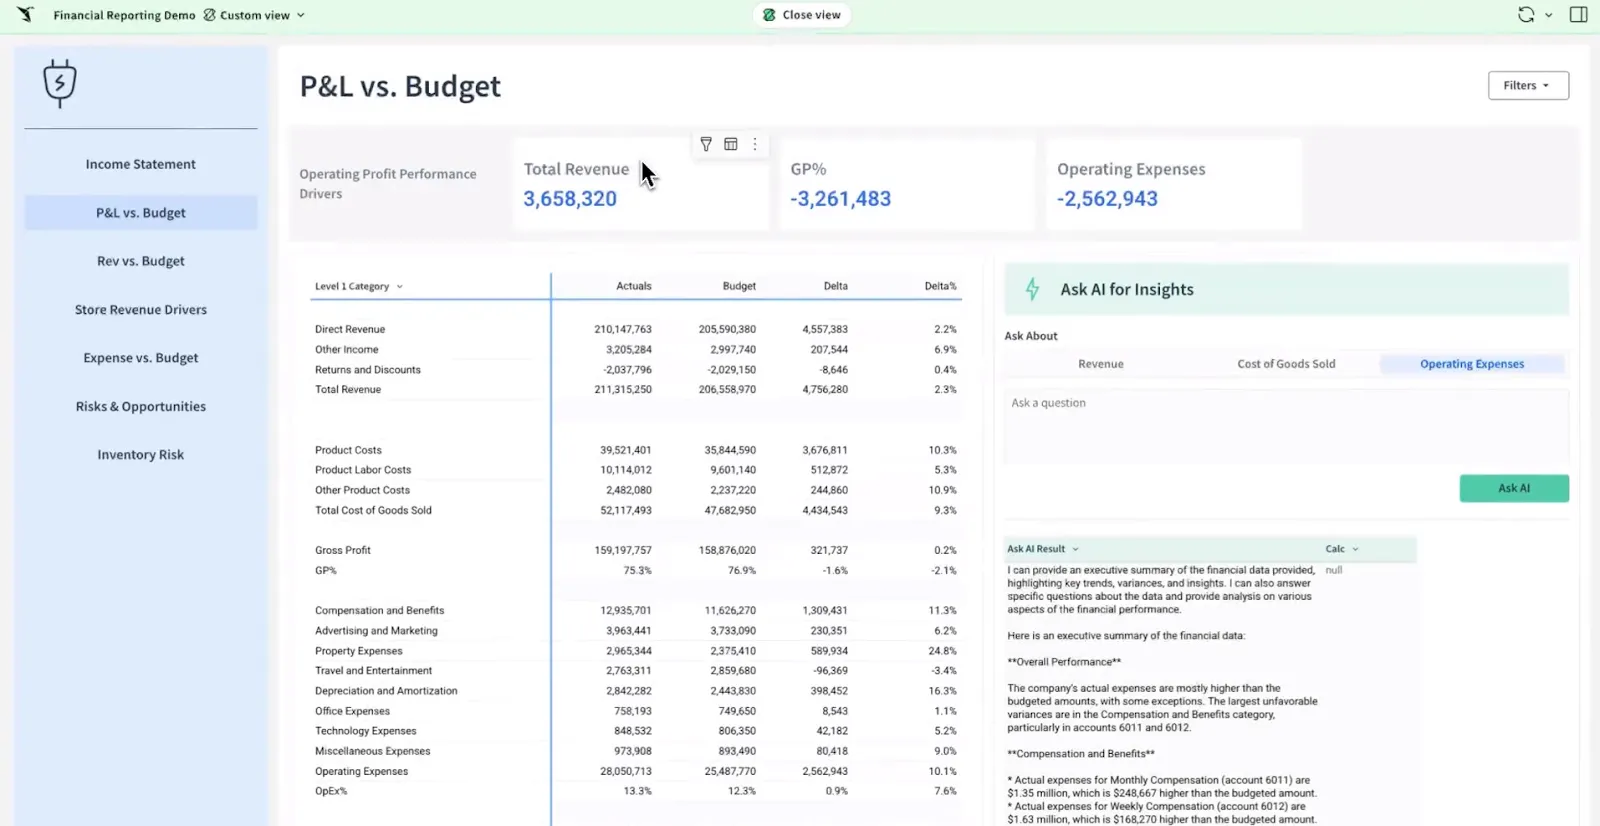
#7: Sigma
Best for: Teams that want spreadsheet-style analytics directly on top of their cloud data warehouse without exporting to Excel.
Similar to: Looker, Metabase.
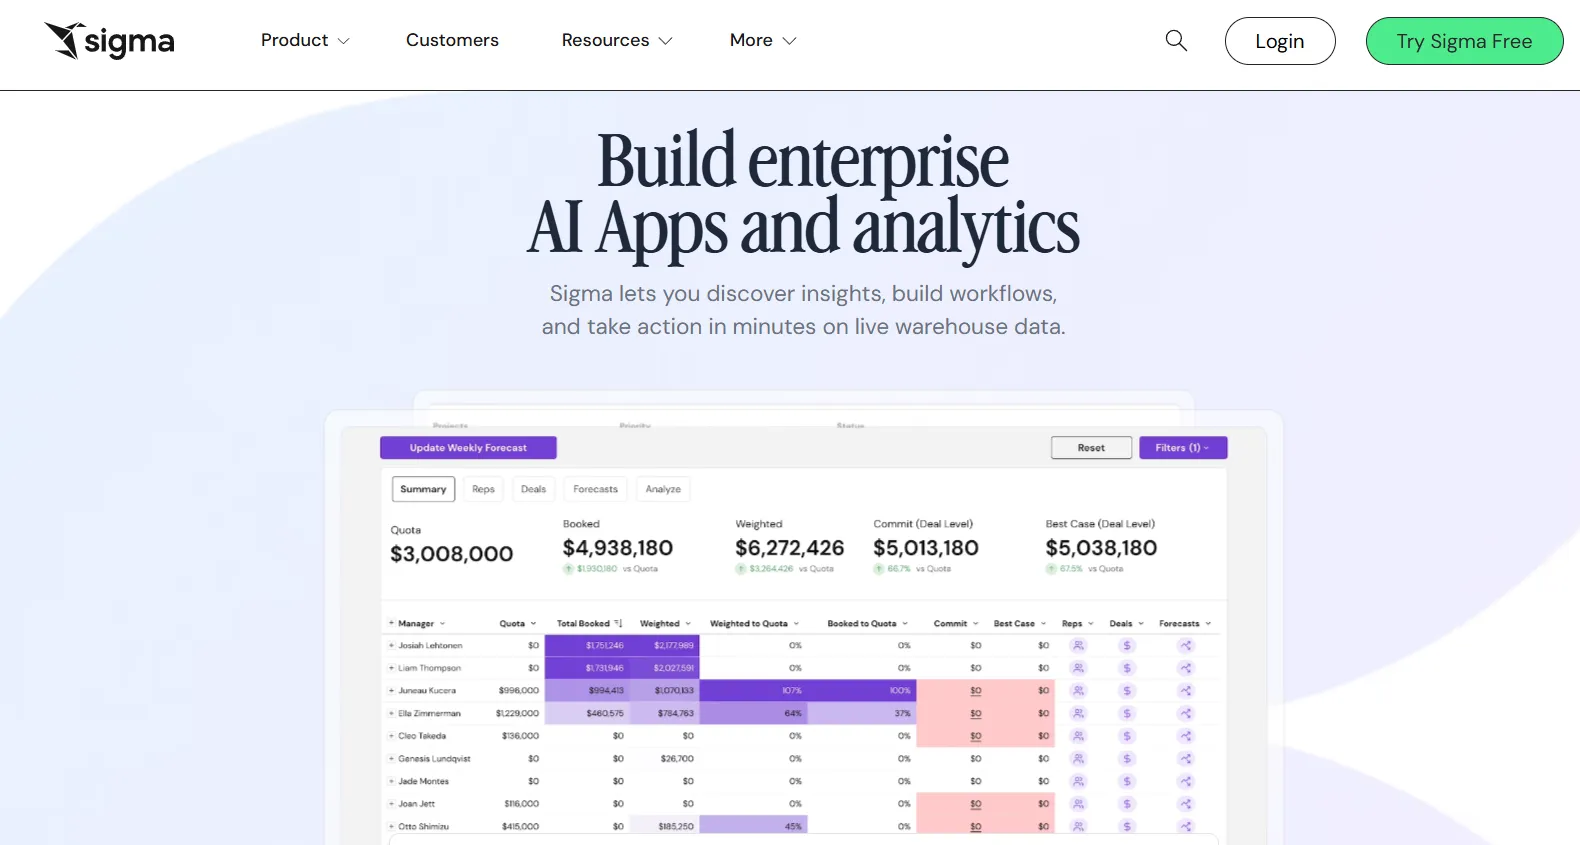
Sigma is a cloud-native platform that lets business users explore live warehouse data through a familiar spreadsheet interface.
Teams can analyze, pivot, model, and collaborate on data in real time without writing SQL.
Sigma's Top Features
- Spreadsheet interface on live warehouse data: Analyze billions of rows using a familiar Excel-like interface with no extracts or data duplication.
- AI-powered dashboards and apps: Use natural language and AI to build dashboards, reports, and operational analytics apps on live data.
- AI Apps for operations and planning: Build interactive apps for forecasting, capacity planning, and budgeting without custom development.
Sigma Pricing
Sigma doesn't publish its pricing. You'll need to contact its sales team for a custom quote.
Sigma Pros and Cons
✅ Spreadsheet-like interface makes warehouse data accessible to anyone comfortable with Excel, unlike tools likeMindsDB that require more technical knowledge.
✅ You can build interactive apps for forecasting.
❌ Limited visual customization compared to other solutions on the market.
❌ Data modeling and complex workflows need careful backend optimization.
#8: Metabase
Best for: Startups, product teams, and data-lean organizations that want fast, self-serve analytics without enterprise BI complexity.
Similar to: Mode, Supaboard.
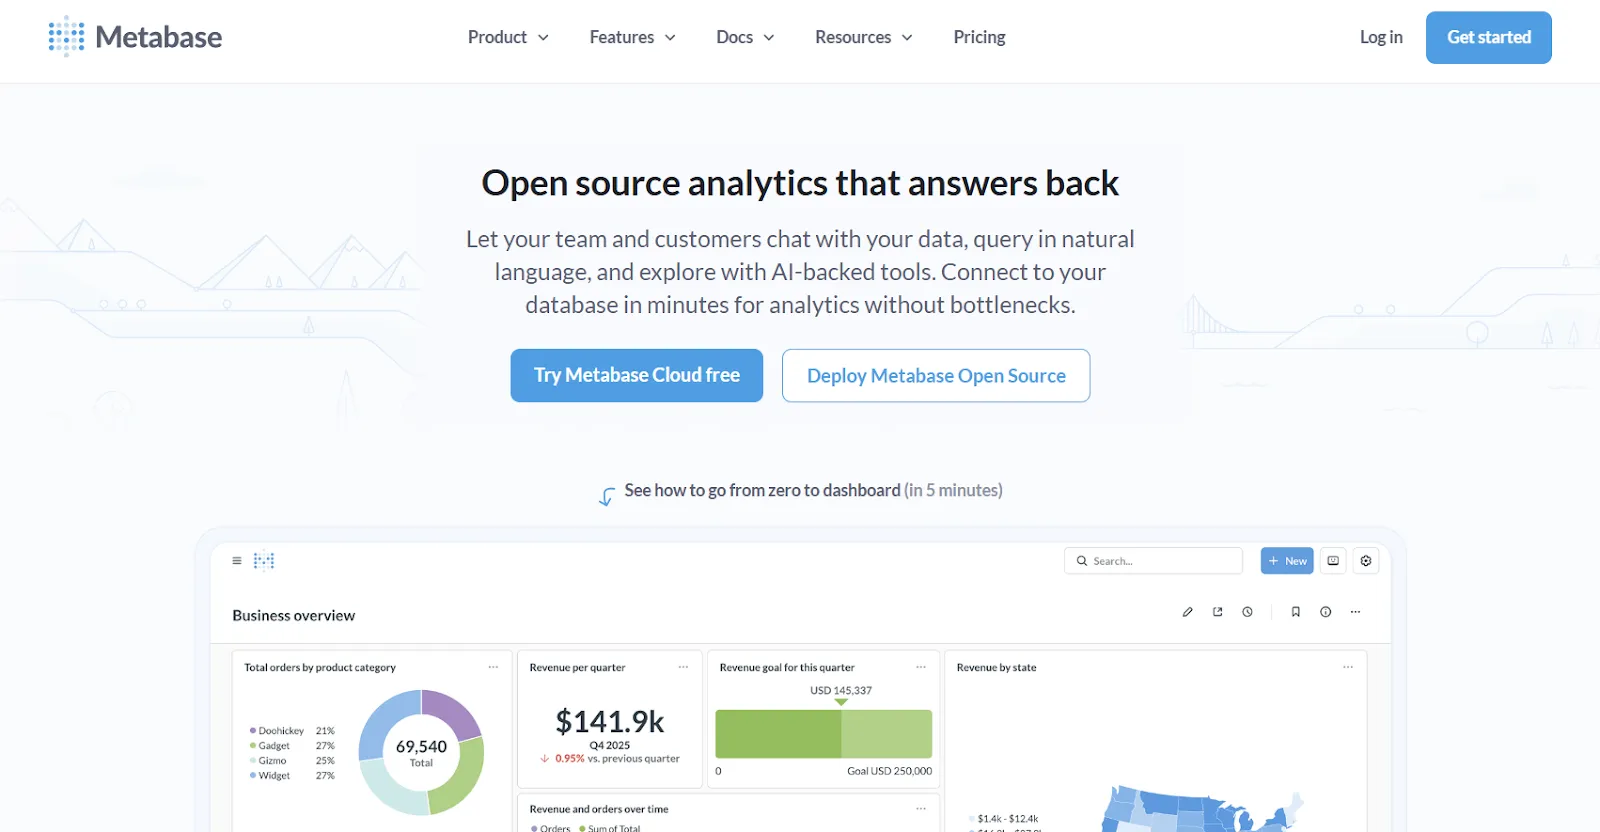
Metabase is an open-source analytics platform built for teams that want simple, production-ready dashboards and natural language querying without heavy setup.
The platform supports both no-code visual querying and SQL for advanced users.
Metabase's Top Features
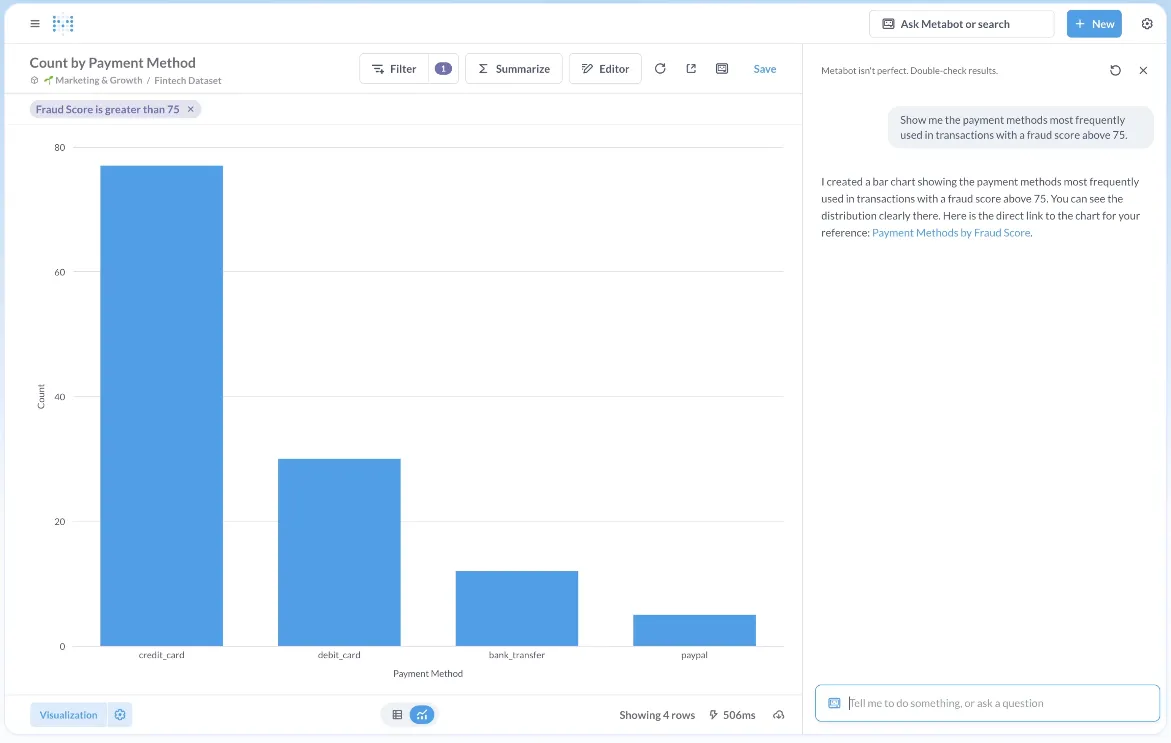
- Natural language analytics with Metabot AI: Ask questions in plain English and let AI generate queries and visualizations on live database data.
- No-code and SQL querying: Non-technical users explore data visually, while analysts can drop into SQL and turn queries into reusable reports.
- Drill-through exploration: Click on charts to zoom in, filter, break out data, and auto-generate follow-up reports without writing new queries.
Metabase Pricing
Metabase offers two pricing options depending on how you use the product: internal business intelligence or customer-facing embedded analytics.
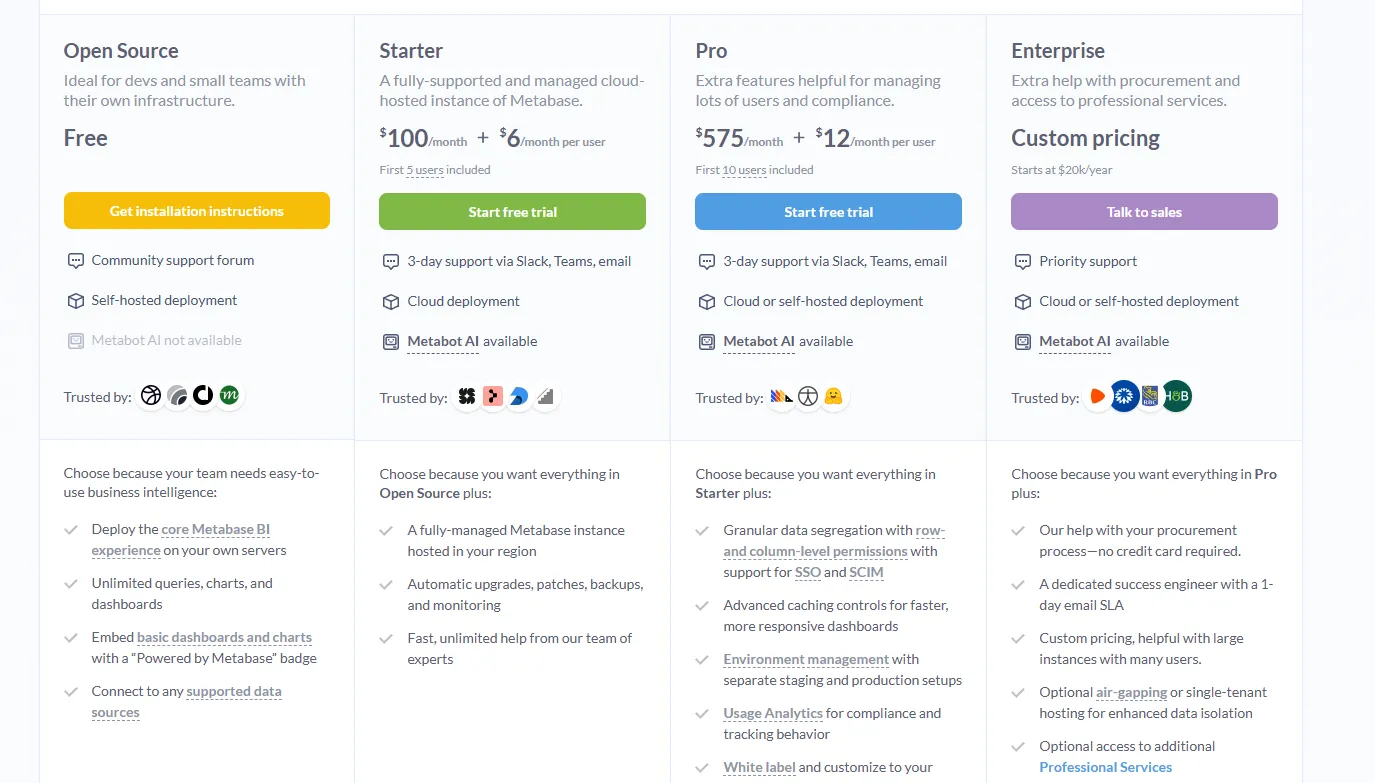
- Business Intelligence:
- Open Source (Self-hosted): Free, self-hosted deployment, includes unlimited queries, charts, and dashboards, connects to all supported data sources, basic embedding with “Powered by Metabase” branding, community support only.
- Starter (Cloud-hosted): $100/month + $6/user/month, first 5 users included, includes everything in Open Source, plus option to include Metabot AI (charged extra), automatic upgrades, backups, and monitoring, support via Slack, Teams, and email (3-day SLA).
- Pro: $575/month + $12/user/month, first 10 users included, cloud or self-hosted deployment, includes everything in Starter, plus row- and column-level permissions, SSO and SCIM support, advanced caching and performance controls, staging + production environments, usage analytics and audit visibility, white-labeling, and embedded analytics capabilities.
- Enterprise: Custom pricing (starts at $20k/year), includes everything in Pro, plus priority support, dedicated success engineer (1-day email SLA), optional single-tenant or air-gapped deployment, and optional professional services.
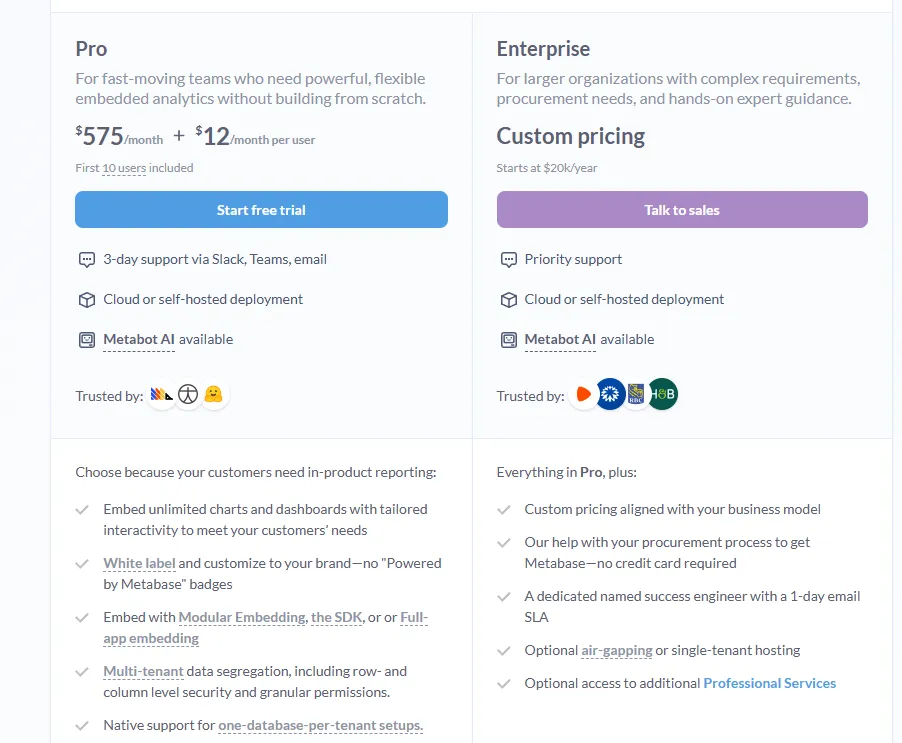
- Embedded Analytics pricing:
- Pro: $575/month + $12/user/month, first 10 users included, includes unlimited embedded dashboards and charts, full white-labeling, modular embedding, SDK, or full-app embedding, multi-tenant security (row- and column-level), one-database-per-tenant support, staging + production environments, usage analytics, internal BI for your team, and option to include Metabot AI (charged extra).
- Enterprise: Custom pricing (starts at $20k/year), includes everything in Pro, plus a dedicated success engineer, priority support, optional single-tenant or air-gapped hosting, and optional professional services.
Metabase Pros and Cons
✅ Easy to use for both technical and non-technical users with a clean, intuitive interface.
✅ Fast setup and lightweight deployment, especially with common databases like PostgreSQL, MySQL, and Snowflake.
❌ AI assistance is still developing compared to dedicated AI-first analytics platforms.
❌ Less suited for advanced analytics and large-scale governance needs.
#9: Mode
Best for: Data teams and business teams that want SQL analysis, advanced analytics, and self-serve reporting in one place without juggling multiple tools.
Similar to: Metabase, Sigma.
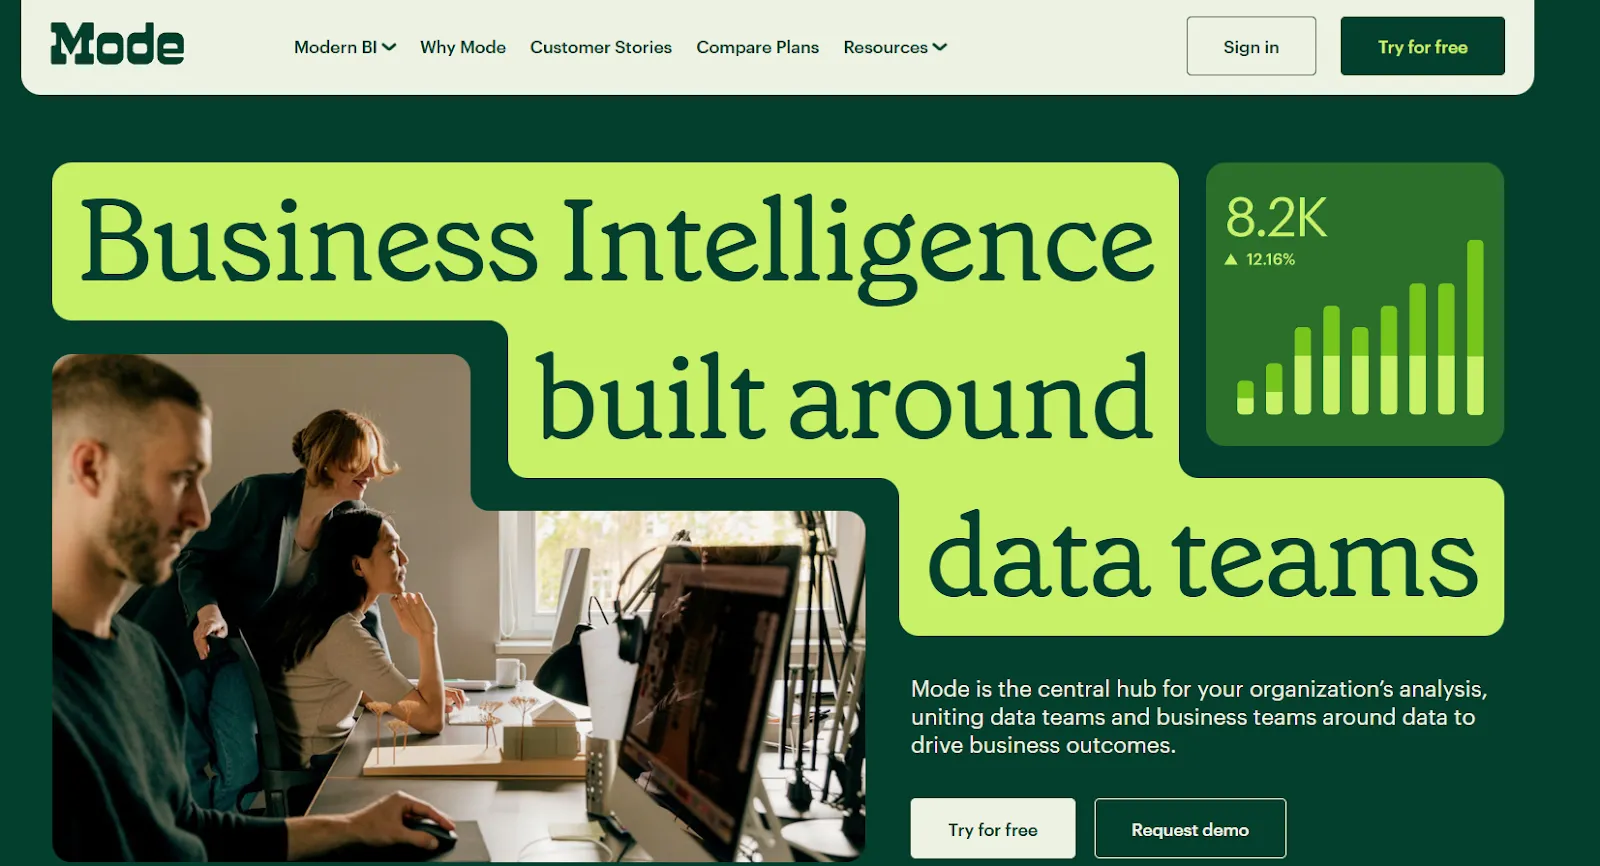
Mode combines SQL querying, Python and R notebooks, and interactive dashboards in a single workflow.
It's designed to help teams move from raw data to decisions faster.
Mode's Top Features
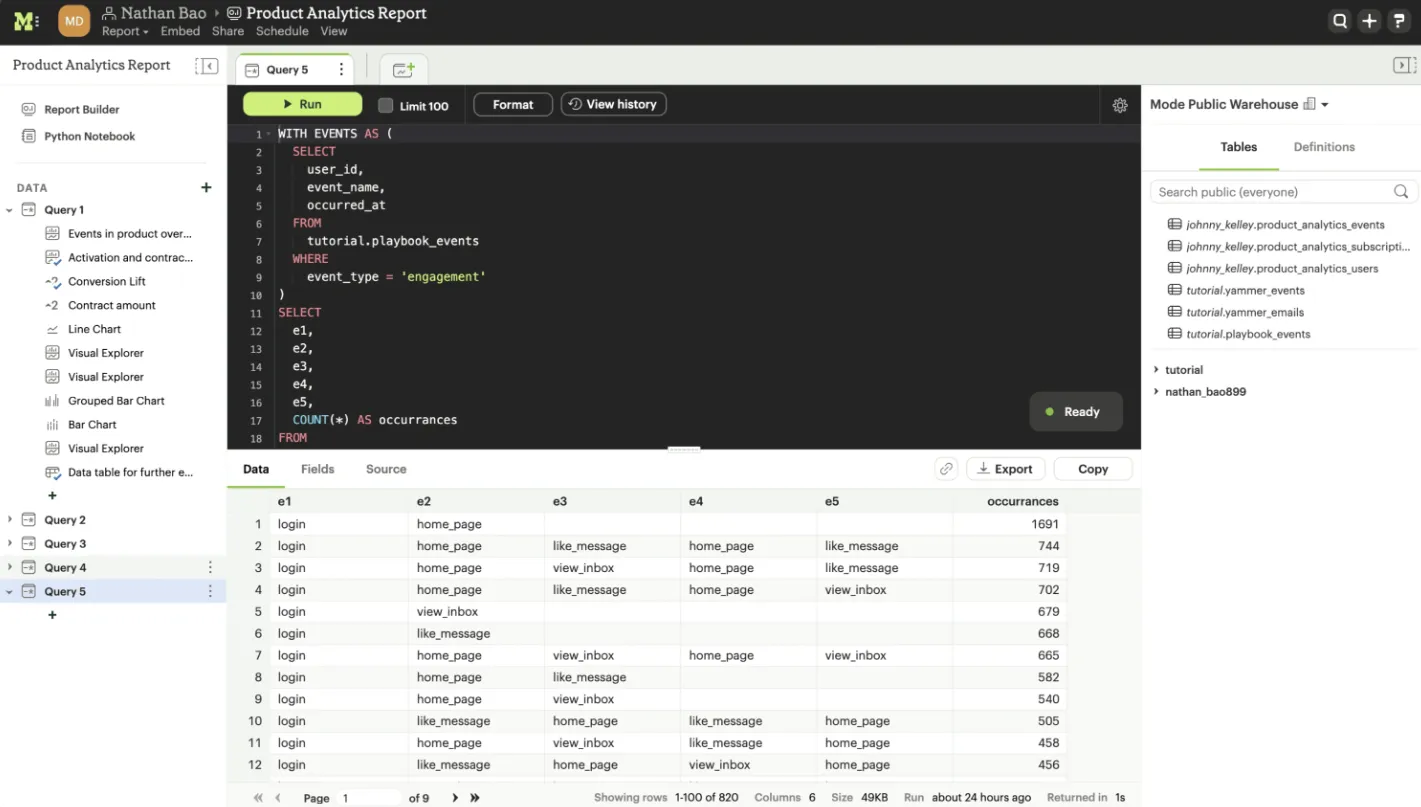
- SQL-first ad hoc analysis: Analysts can dive straight into data with SQL.
- Python and R notebooks: You can send SQL results directly into Python or R notebooks for deeper analysis, forecasting, or statistical models, all in the same workspace.
- Interactive dashboards and visual exploration: Build dashboards and share them across teams to help spot trends and patterns directly in the browser.
Mode Pricing
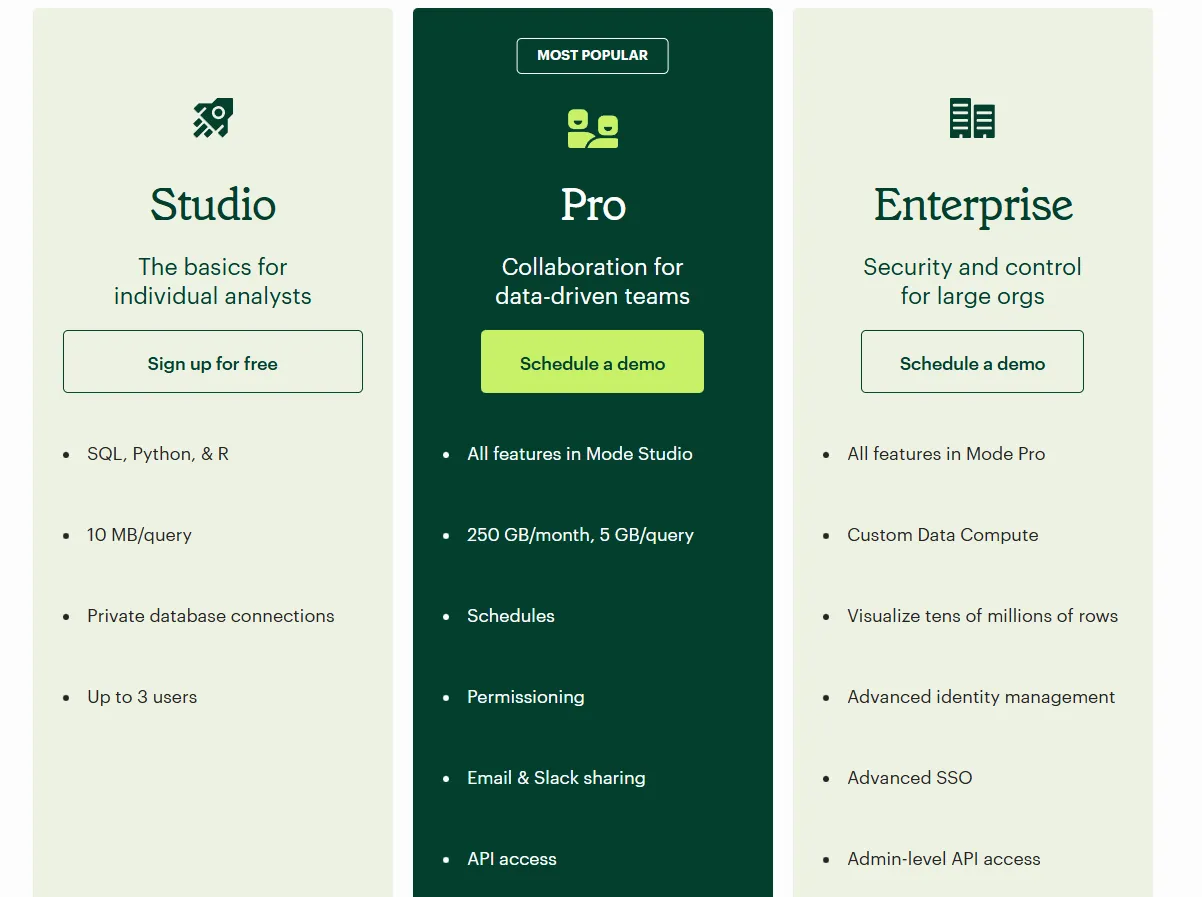
Mode has three pricing tiers:
- Studio: Free plan, includes SQL, Python, and R, private database connections, up to 3 users, and 10 MB per query limit.
- Pro: Custom pricing, adds team collaboration, scheduled reports, permissions, email and Slack sharing, API access, and 250 GB per month data limits.
- Enterprise: Custom pricing, extends Pro with custom data compute, advanced identity management, SSO, admin API access, and premium support.
Mode Pros and Cons
✅ Clean, role-based interface that makes it easy to track metrics and feature performance.
✅ Powerful combination of SQL, Python, R, and visualizations in one workflow.
❌ Performance can slow down noticeably with large datasets or complex queries.
❌ Steeper learning curve for non-technical users who aren't familiar with SQL.
#10: Zoho Analytics
Best for: Teams that want an affordable BI platform with dashboards, AI features, and strong Zoho ecosystem integration.
Similar to: Metabase, Supaboard.
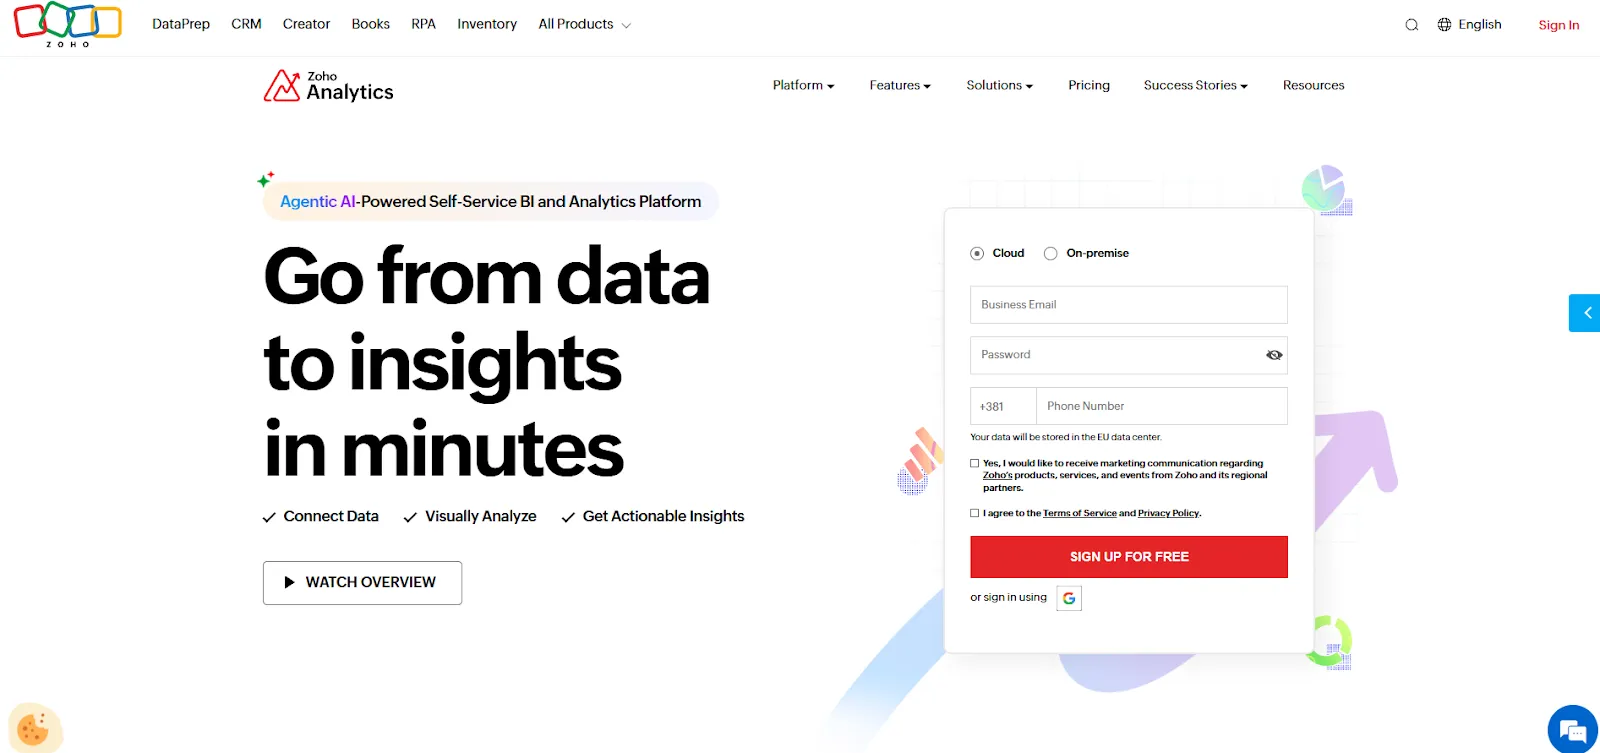
Zoho Analytics is a BI solution built on the Zoho platform that helps teams integrate data, prepare it, and create interactive dashboards and insights.
The platform balances self-service reporting with predictive AI and embedded BI.
Zoho Analytics' Top Features
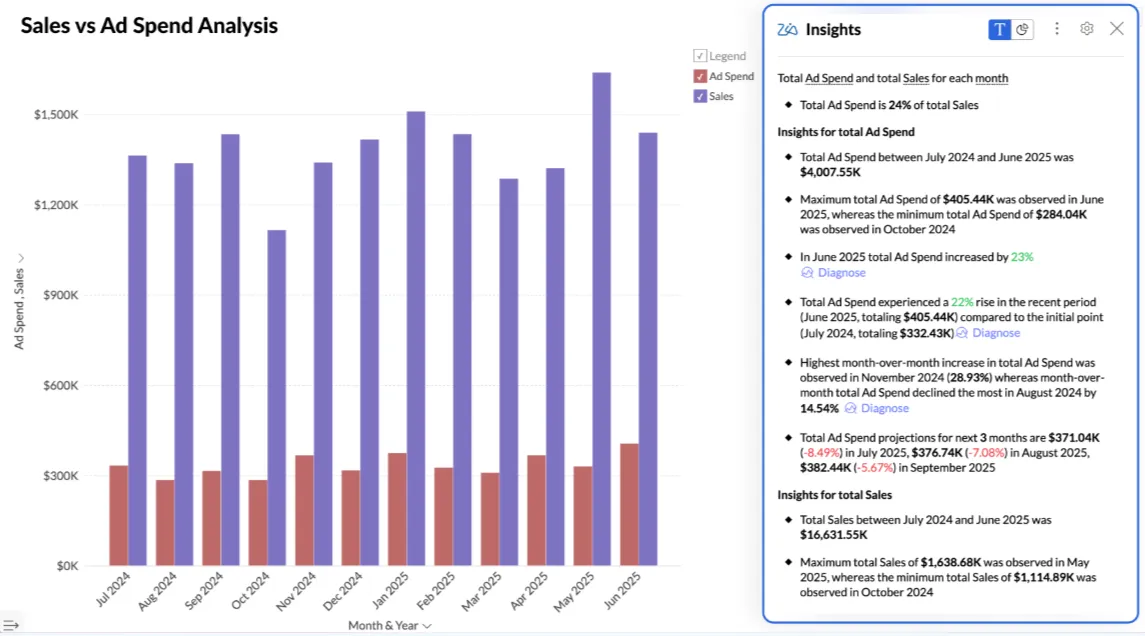
- Ask Zia: Use natural language to analyze data, build reports, and get insights, predictions, and recommendations through Zoho's conversational AI agent.
- Data preparation and metrics layer: Clean, transform, and model data with no-code transformations while managing business metrics centrally.
- Flexible dashboards and embedded BI: Create interactive dashboards with 50 or more visualization types and embed analytics into apps, portals, or customer-facing products.
Zoho Analytics Pricing
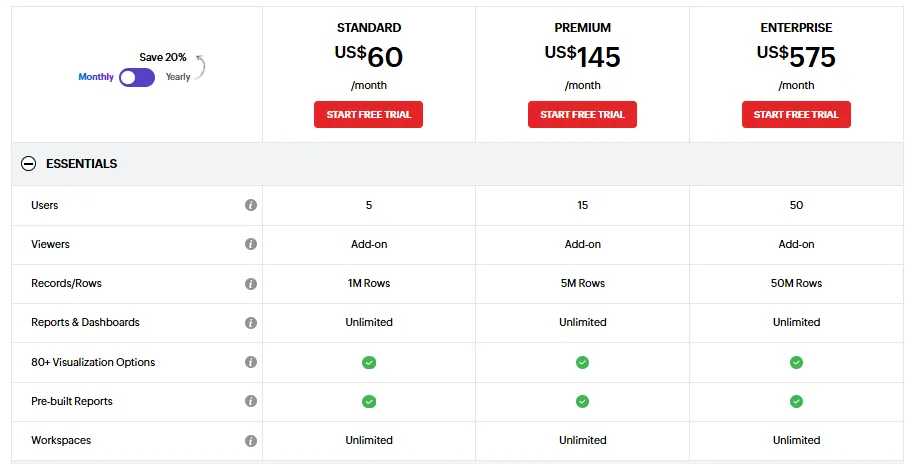
Zoho Analytics has three plans:
- Standard: $60 per month, includes up to 5 users, 1M rows, unlimited workspaces, reports and dashboards, and basic AI features.
- Premium: $145 per month, includes up to 15 users, everything in Standard, plus 5M rows, advanced data integration, and all AI features except AI studio.
- Enterprise: $575 per month, includes up to 50 users, everything in Premium, plus 50M rows, advanced governance and security, and AI studio.
Zoho Analytics Pros and Cons
✅ Intuitive dashboards, strong visualizations, and good value for money.
✅ Fast setup and easy integration with Zoho apps and popular third-party tools.
❌ Exports can feel clunky for presentation-ready reporting.
❌ Works best within the Zoho ecosystem.
Get Started with Dot for Free Today
DataGPT proved that conversational analytics could genuinely change how teams interact with data.
Now that it's no longer available, the question is which platform picks up where it left off.
Dot carries that conversational analytics approach forward while adding automated business reviews, ad-hoc analysis inside Slack and Teams, shared business context, and full audit trails on every insight.
Here's what you'll get when you try Dot:
- Access to a free Starter plan with chat-based analysis, 3 active tables, 100 credits, and model and evaluation access.
- Automated executive business review reports delivered on your schedule, directly from your warehouse.
- Ad-hoc analysis through Slack, Microsoft Teams, email, or the web app so insights show up where decisions happen.
- A Context Agent that maintains shared business definitions and prevents metric drift across teams.
- Full audit trail on every insight, with transparent links to underlying SQL, Python logic, and datasets.
Sign up for the free Starter plan to test the waters, or schedule a demo if you'd like to talk to the team.
Theo Tortorici
Theo writes about AI-powered analytics, data tools, and the future of business intelligence at Dot.