
10 Best Self-Service BI Tools & Software In 2026
I'll walk through the 10 best self-service BI tools for 2026, grouped into three buckets so you can pick the one that fits how your team actually wants to work with data. 👇
TL;DR
- Dot is the best self-service BI tool for 2026 because anyone in the company can ask a question in plain English and get a written, explained answer back in Slack, Microsoft Teams, or email, without building a dashboard first.
- ThoughtSpot and Supaboard are worth a look if you want AI-native self-service analytics where natural-language search is the primary interface.
- Tableau, Microsoft Power BI, Qlik Sense, and Domo are the established BI platforms with mature self-service workflows and AI layered on top, which fit when your company already runs on one of those ecosystems.
- Sigma, Omni, and Metabase suit teams that want lightweight, warehouse-native self-service with a modern UI and semantic foundation underneath.
What are the best self-service BI tools in 2026?
The best self-service BI tools in 2026 are Dot, with its analysis that happens where your team works, Tableau, and Sigma.
Here's the breakdown:
Tool | Use case | Price |
Dot | Warehouse-native AI analyst that returns written answers and automated business reviews to anyone in the company. | Free plan; Pro from $180/month. |
ThoughtSpot | AI search and Spotter agent for self-service analytics on live data. | Essentials from $25/user/month (annual). |
Supaboard | No-code AI dashboards with trainable agents and natural-language data chat. | Individual from $85/month. |
Tableau | Visual-first BI with Tableau Next and Agentforce for agentic analytics. | From $15/creator/month. |
Microsoft Power BI | Microsoft-native BI with Copilot for AI-assisted reporting. | From $14/user/month (Pro). |
Qlik Sense | Associative engine with augmented AI analytics for governed exploration. | Starter from $300/month (annual). |
Domo | All-in-one cloud BI with data ingestion, automation, and AI chat. | Custom pricing (30-day free trial). |
Sigma | Spreadsheet-style BI on live warehouse data with Ask Sigma. | Custom pricing. |
Omni | Flexible semantic layer with AI-powered dashboards and workbooks. | Custom pricing. |
Metabase | Open-source BI with Metabot AI and click-to-explore analytics. | Free (self-hosted); Cloud from $100/month. |
What are the best AI-native self-service BI tools?
These three are built around natural language from the ground up, not added on later through a chat feature.
That makes them the easiest pickup for non-analysts:
#1: Dot
Dot is the best self-service BI tool on the market thanks to our AI data analyst, which plugs straight into your warehouse and does the analytical work on behalf of every business user in your company.
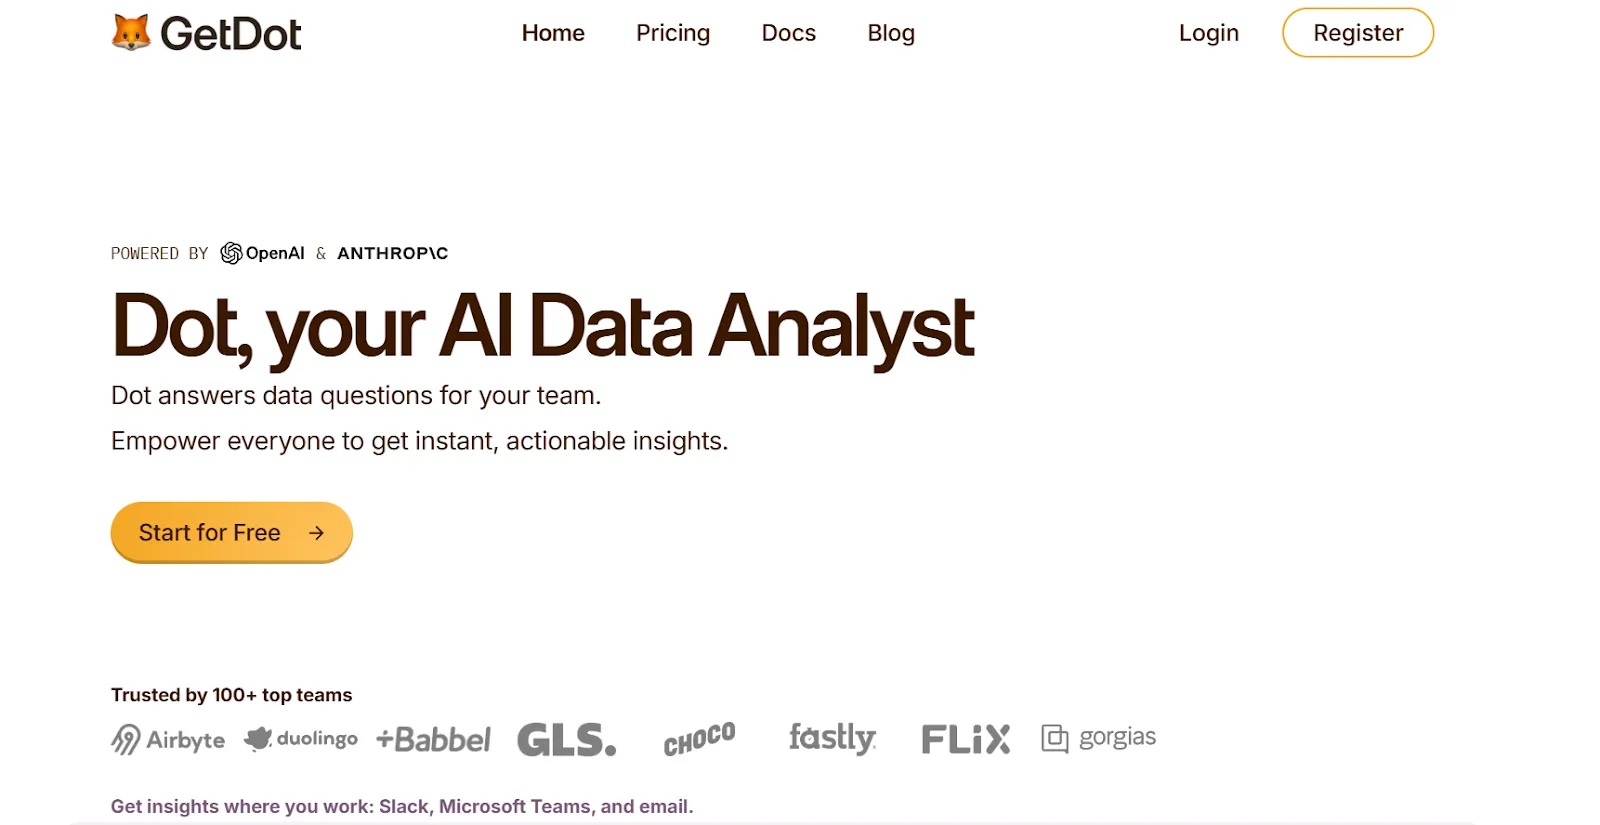
Ask Dot a question, and what comes back isn't just a chart with a row of numbers underneath.
What comes back is a full investigation:
- A written walkthrough of what changed.
- Which segments moved the metric?
- The most likely reasons behind the shift.
And all of this with the SQL attached for anyone who wants to verify the math.
Here are the features that make Dot the right pick for data teams rolling self-service BI out company-wide: 👇
The conversation happens where your team already talks
We know that decisions get made in Slack threads and Teams chats, not inside dashboard apps.
Someone @-mentions Dot in a Slack channel, and the answer lands in the thread, governed by the same data permissions and metric definitions every other user has access to.
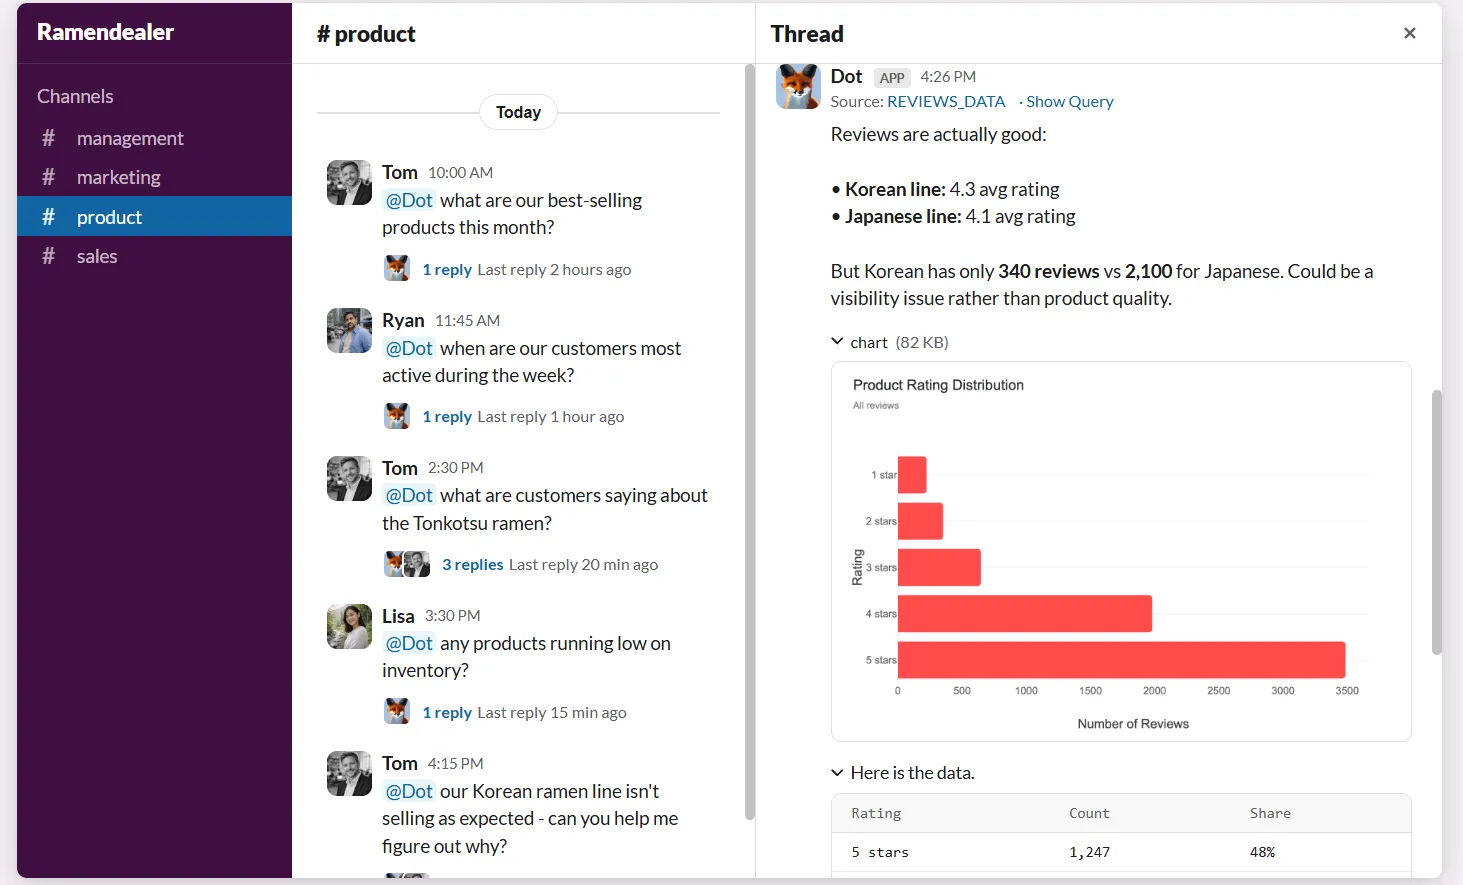
The same goes for Microsoft Teams, email, and the Dot web app if you want a dedicated workspace for longer analysis sessions.
And the response doesn't just show numbers.
It explains what's happening, why it's likely happening, and which segments, regions, or metrics are driving the change.
Your team gets faster answers without having to learn Power BI, SQL, or data models, and your analysts get their time back to focus on the deeper, higher-impact analysis they're paid for, not on pulling "one more chart."
Multi-step investigation
Most self-service BI tools with an AI layer convert your question into a single SQL query, hand back the result, and call it done.
Dot keeps going.
You ask "why did our trial-to-paid conversion drop 8% last week?" and Dot plans the investigation, fires off multiple queries against the warehouse, checks how segments and cohorts moved, looks for correlated factors, and writes back a narrative response with the most likely reasons.
The output reads the way an analyst memo would read.
💡 This is the part of the product that teams pick up on first.
Ad-hoc requests that used to pile up in the analytics queue start getting answered directly in the chat.
Persistent business context and shared definitions with Dot's Context Agent
Ask finance, product, and marketing at any company with more than 50 people what "active user" means.
You'll likely hear three or four different answers.
That's the gap Dot's Context Agent was built to close.
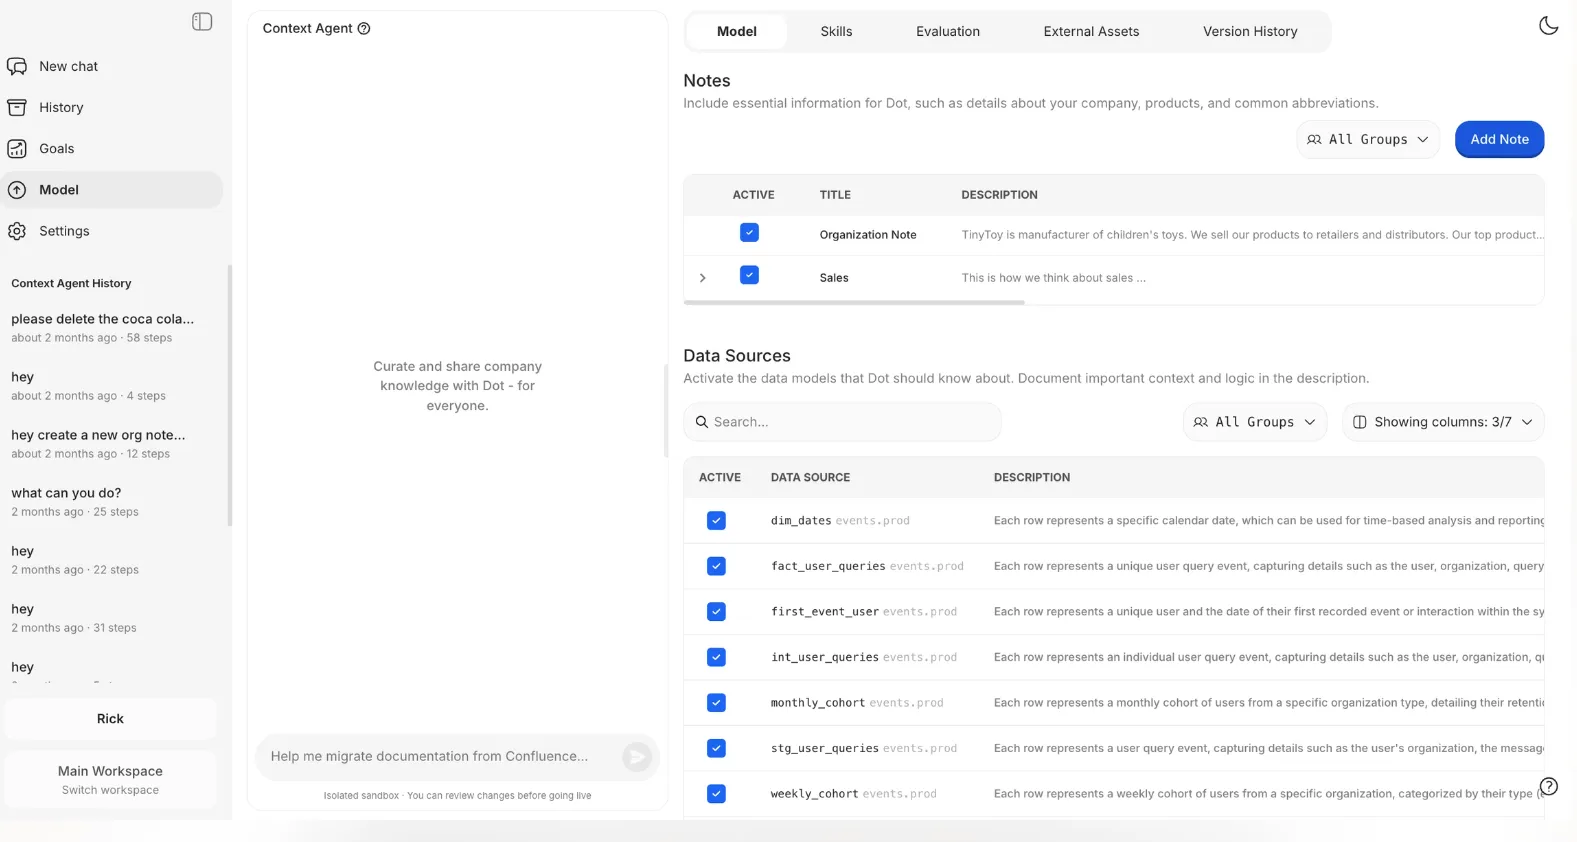
It learns your business definitions once: what counts as an active user, how MRR is calculated, and which tables are the source of truth.
Those definitions then apply to every question Dot answers.
The payoff is consistency:
- Two execs asking the same query an hour apart get the same number back.
- New hires inherit the real company definitions, not whatever someone improvised in a spreadsheet three quarters ago.
- And the CFO and the head of product stop arguing about which dashboard holds the "real" revenue figure.
Reports that show up before anyone asks
Recurring reports are where data teams burn entire mornings.
Someone in Slack asks for last week's numbers.
An analyst pulls them, drops them into a deck, writes a short analysis paragraph, and sends it up the chain.
Dot handles all of that on a schedule you set yourself.
You pick the cadence, point Dot at the metrics that matter to your business, and the platform writes a full narrative report on its own: what shifted, what stayed flat, which cohorts moved the needle, and the most probable reasons behind each move.
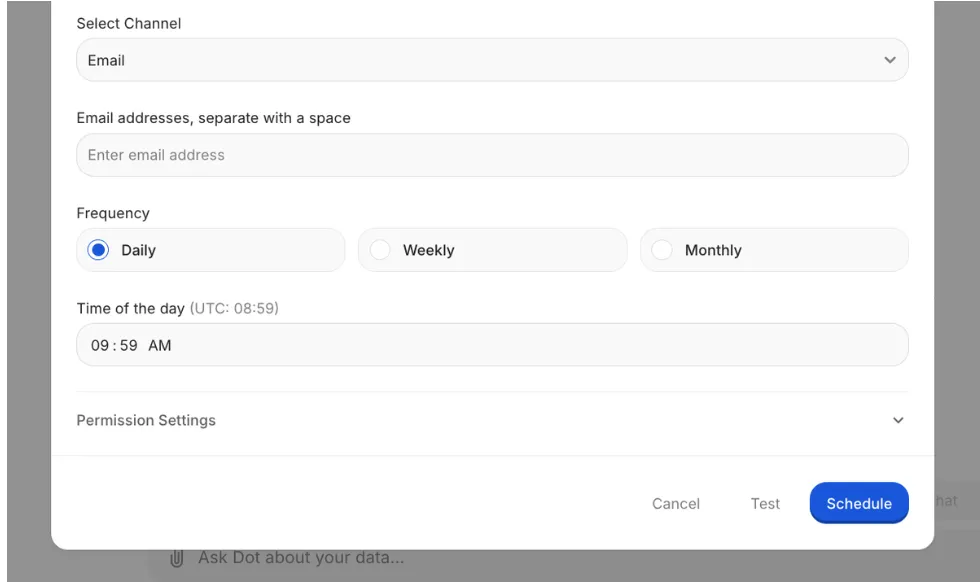
It reads like a senior analyst's memo, just without anyone's morning being lost to it.
Dot's integrations
Dot connects directly to Snowflake, BigQuery, Redshift, and Databricks, alongside operational databases like Postgres, MySQL, and SQL Server.
It also reads from semantic and transformation layers like dbt, Cube, Looker, and Power BI models, so the metric definitions your team already has don't need to be rebuilt.
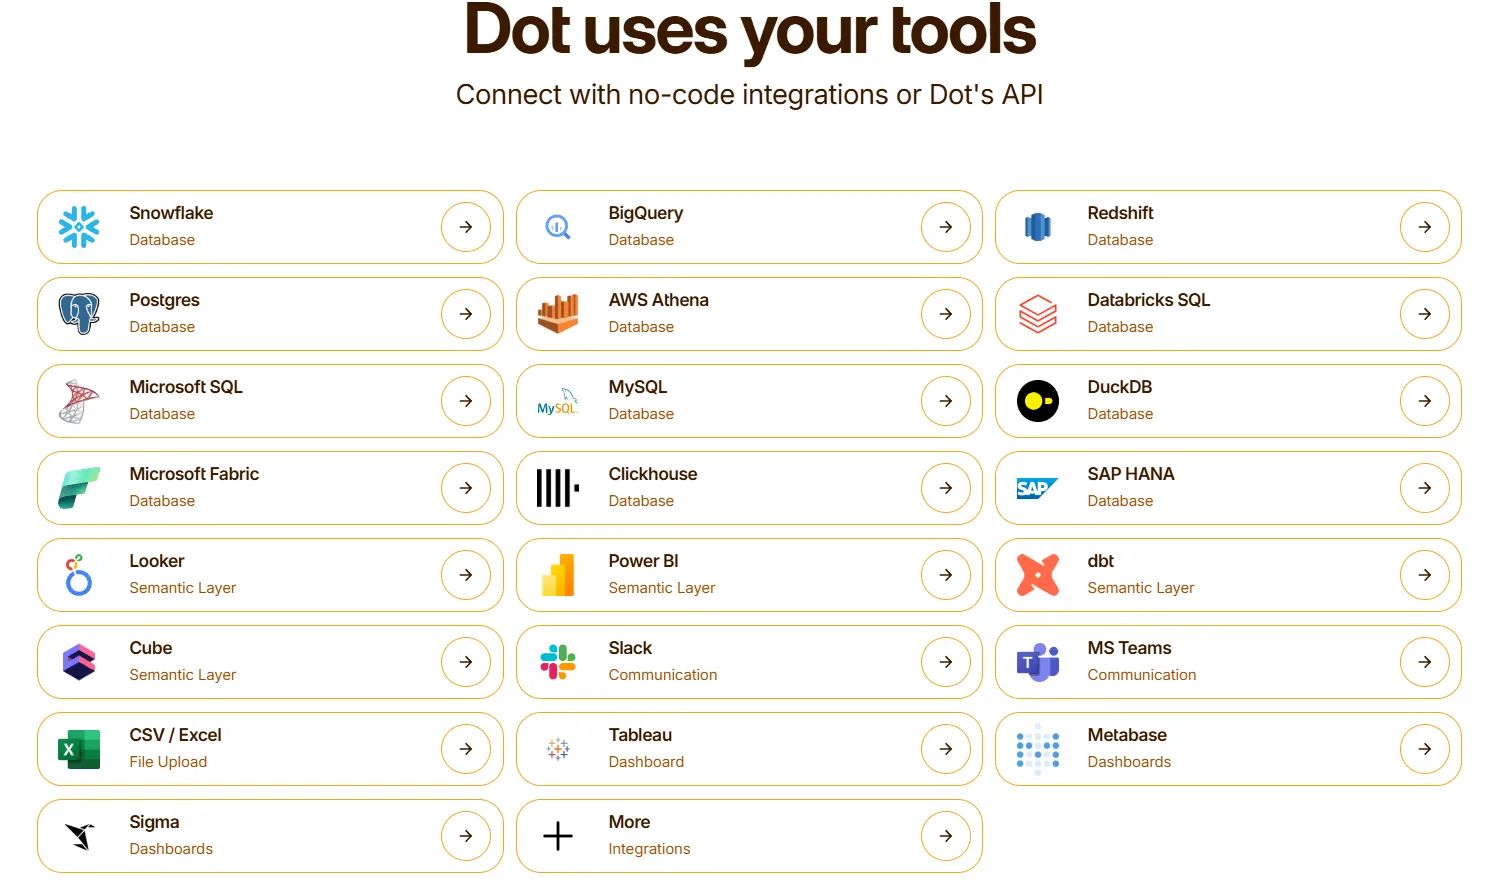
Delivery runs through Slack, Microsoft Teams, email, and the Dot web app, and Dot can sit alongside an existing BI tool like Tableau, Metabase, or Sigma during a gradual rollout.
What makes Dot different from traditional self-service BI tools?
Traditional self-service BI tools with an AI feature are wrappers.
A chat box gets added onto an existing BI product, where the user types a question, and the LLM translates it to SQL for a chart to come back.
The conversation ends right where the interpretation work starts.
That model has real limits. It assumes the user already knows what to ask, knows whether the chart actually answers their question, and knows what to do with the result.
Dot was built to skip the handoff.
Ask a question, and what arrives back is a written analysis: what changed, which segments drove it, what the most likely causes are, and a recommended next step.
The SQL sits underneath for anyone who needs to audit it, but no one has to read it to act on the answer.
The Context Agent does the (unglamorous) work in the background, picking up metric definitions from dbt models, semantic layers, and analyst corrections, so the answer to "what's our revenue" stays the same whether finance, product, or the CEO asks.
Dot pricing
Dot's free plan comes with 300 one-time credits and full Pro feature access, which is plenty to run real questions against your warehouse before paying anything.
Three paid tiers from there, with a 10% discount on annual billing:
- Pro: $180/month, 150 credits included, unlimited users, $1.80 per credit overage. Covers the full self-service BI feature set.
- Team: $720/month, 800 credits included, $1.44 per credit overage. Adds SSO, row-level security, embedded analytics, BI migration support, and dedicated customer success.
- Enterprise: Custom pricing. Unlimited credits with volume discounts, self-hosted deployment, audit logs, SLAs, and a dedicated account manager.
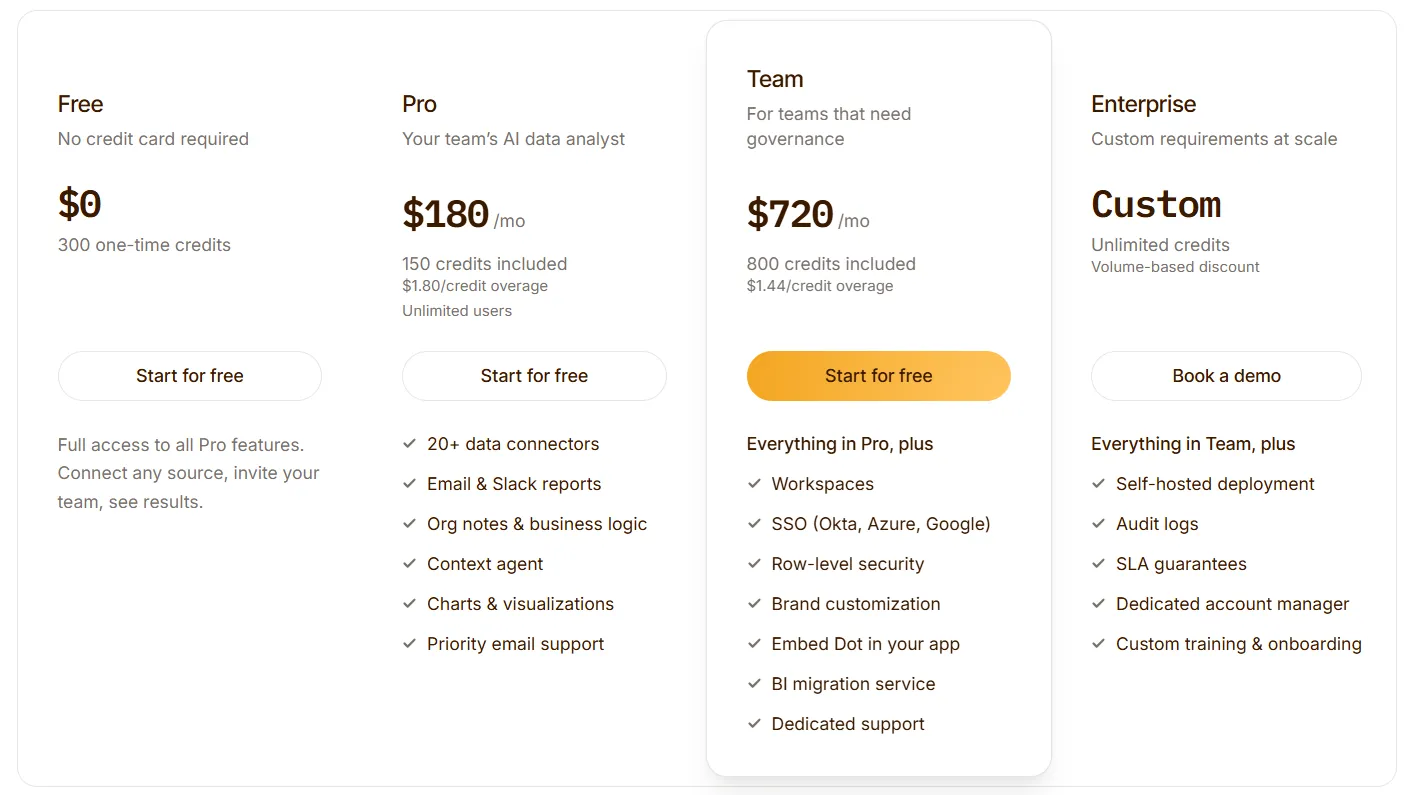
Credits are tied to the work Dot does (query complexity and analysis depth), and not to the number of seats logged in.
That structure means you can roll Dot out across the whole company without per-user licensing fees stacking up against you.
Dot pros and cons
✅ Returns narrative answers, not just charts.
✅ Runs in Slack, Teams, email, and the web app.
✅ Context Agent keeps definitions consistent.
✅ Multi-step root cause investigation.
✅ Full SQL audit trail.
✅ Usage-based pricing.
❌ Needs a data warehouse.
❌ Not a traditional dashboard tool.
#2: ThoughtSpot
Best for: Teams that want AI-powered search and self-service analytics without putting non-technical users through a learning curve.
Similar to: Supaboard, Sigma.
ThoughtSpot's original pitch hasn't changed much since launch: type a question and get a governed chart back.
Spotter is the newer AI agent that handles multi-step investigations and builds full dashboards from a single prompt.
ThoughtSpot's top features
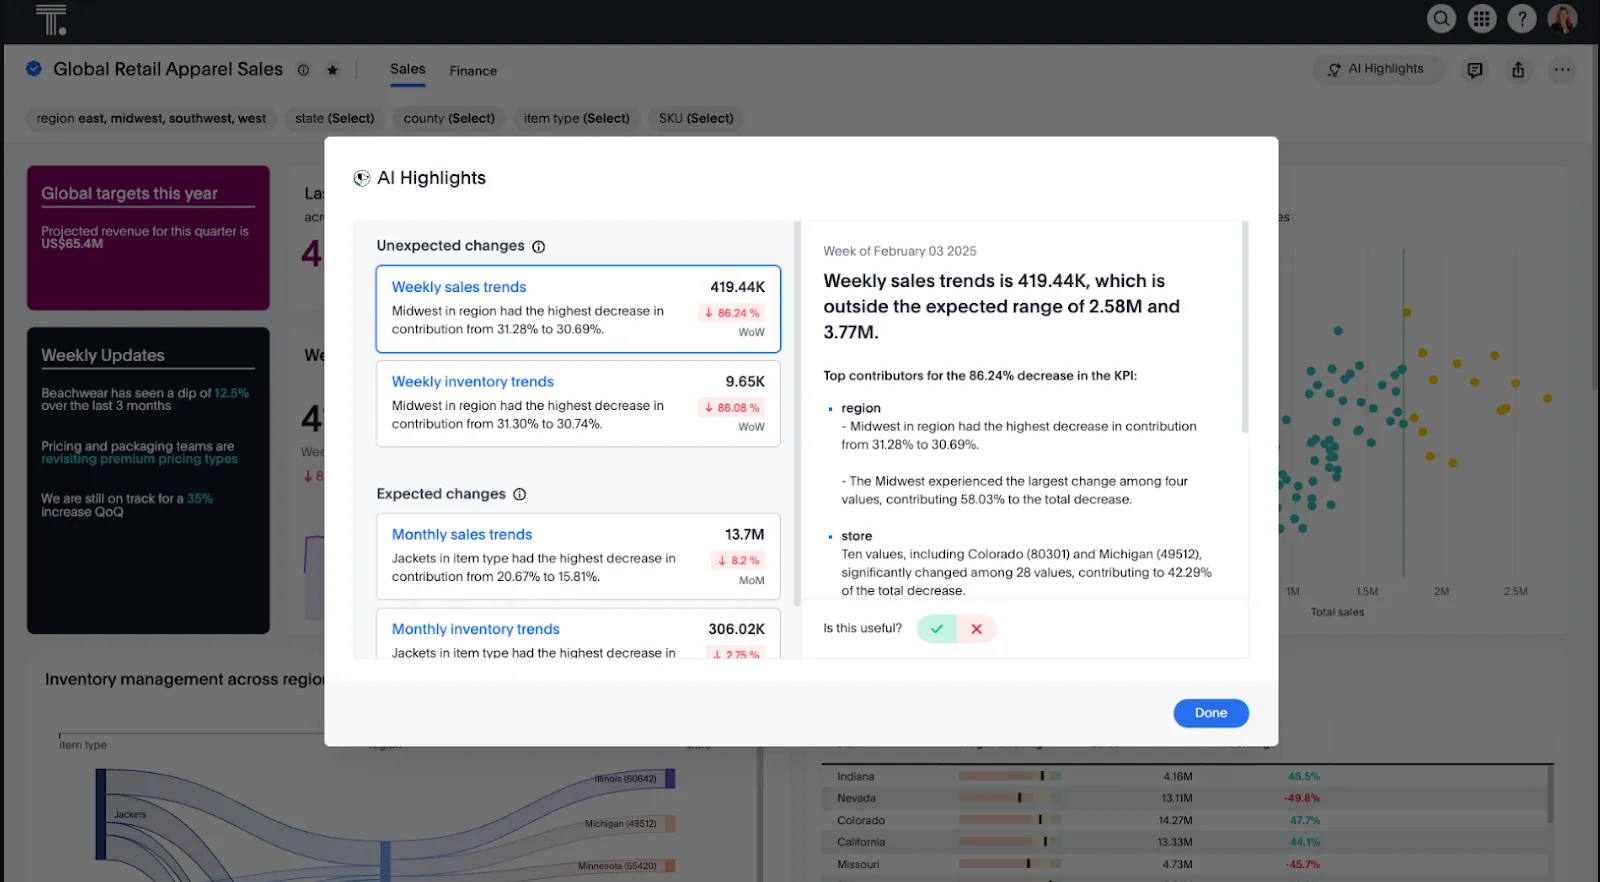
- Natural-language search: The original ThoughtSpot feature. Type a question, get a governed answer from live data.
- Spotter AI agent: Runs multi-step analyses, surfaces patterns, and explains what changed without needing a separate prompt for each step.
- SpotterViz: Takes a single prompt and builds a complete dashboard ready to share.
- ThoughtSpot Embedded: Separate product line for embedding the search experience in customer-facing apps.
ThoughtSpot pricing
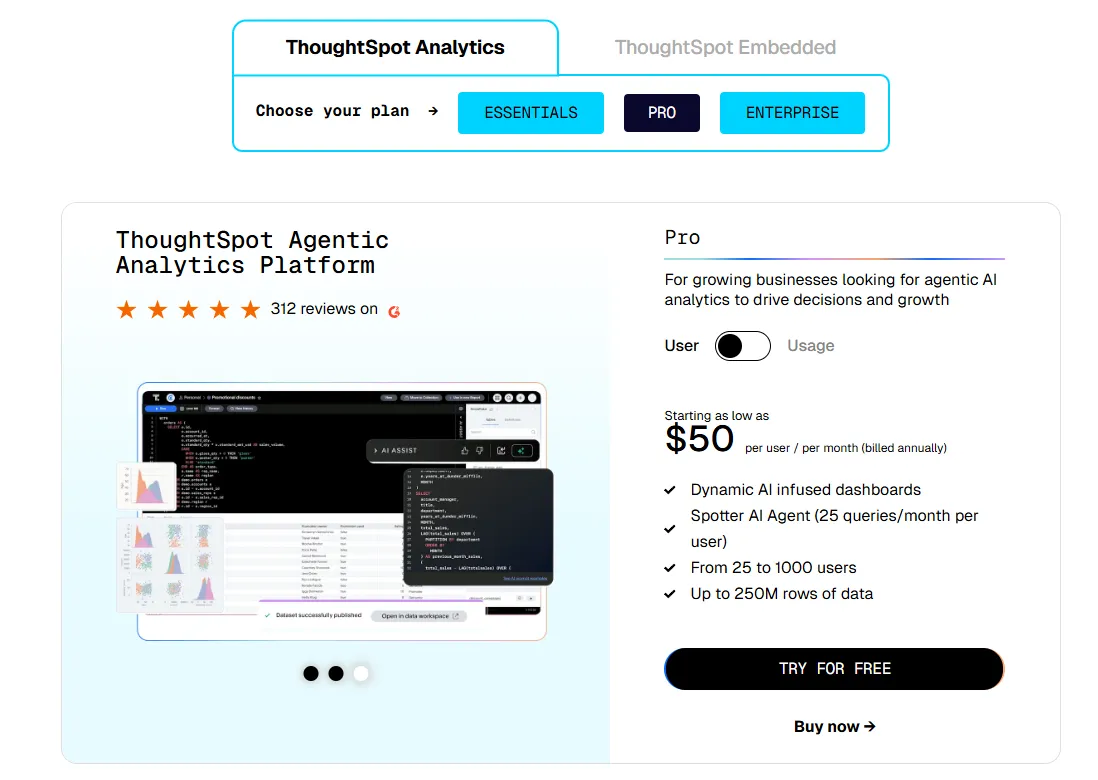
ThoughtSpot offers two separate products: ThoughtSpot Analytics for internal BI and ThoughtSpot Embedded for building analytics into applications - each with flexible pricing depending on scale and usage:
- ThoughtSpot Analytics:
- Essentials: From $25 per user per month (billed annually), for teams of 5-50 users, includes dynamic interactive dashboards and AI-powered insights and supports up to 25M rows of data.
- Pro (per user pricing): From $50 per user per month (billed annually), for 25–1,000 users, includes everything in Essentials, plus AI-infused dashboards and Spotter AI Agent (25 queries per user/month), and supports up to 250M rows of data.
- Pro (usage-based): From $0.10 per query, includes everything in Pro per user, and adds Analyst Studio.
- Enterprise (user or usage-based): Custom pricing, includes everything in Pro, plus unlimited users and data.
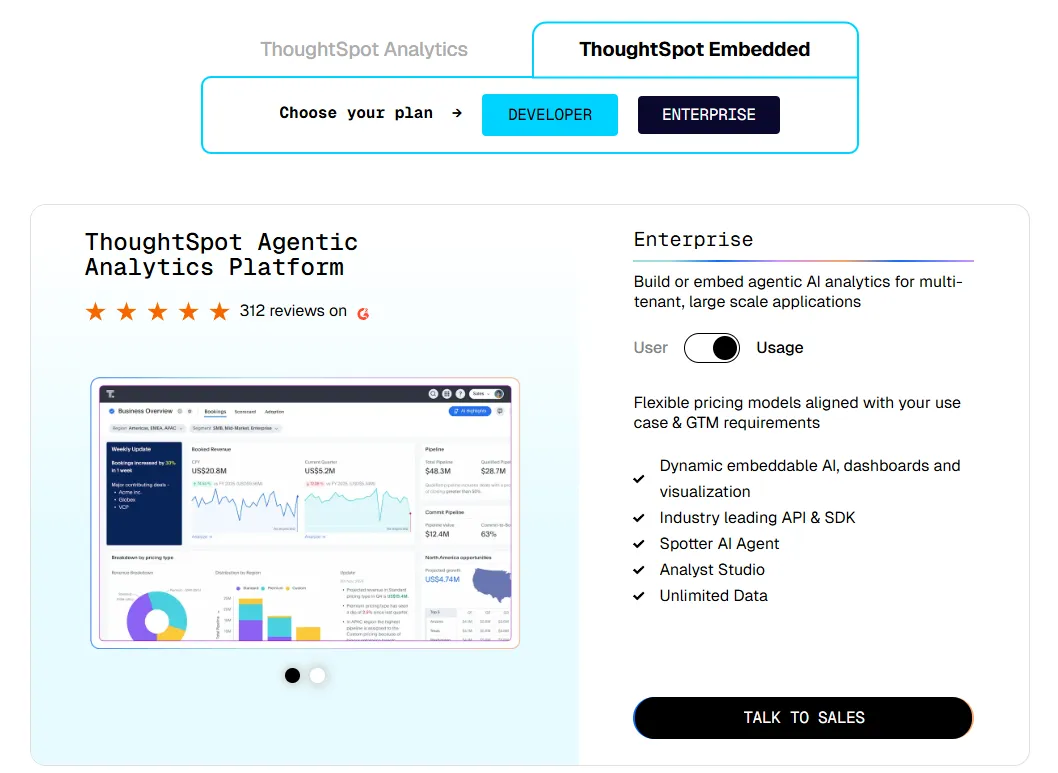
- ThoughtSpot Embedded:
- Developer: Free for 1 year, includes embeddable AI analytics, dashboards, and visualizations, APIs and SDKs, up to 10 users and 25M rows of data.
- Enterprise (user-based): Custom pricing, includes everything in Developer, plus unlimited data.
- Enterprise (usage-based): Custom pricing, everything in Enterprise, plus Spotter AI Agent and Analyst Studio.
ThoughtSpot pros and cons
✅ Search experience actually works for non-BI users.
✅ Spotter handles structured enterprise data well when the model is clean.
✅ Governance is mature enough for large rollouts.
❌ Two pricing structures (per user vs. usage-based) can get confusing at scale.
#3: Supaboard
Best for: Small teams that want AI-generated dashboards and chat-based analytics without a traditional BI modeling stack.
Similar to: ThoughtSpot, Metabase.
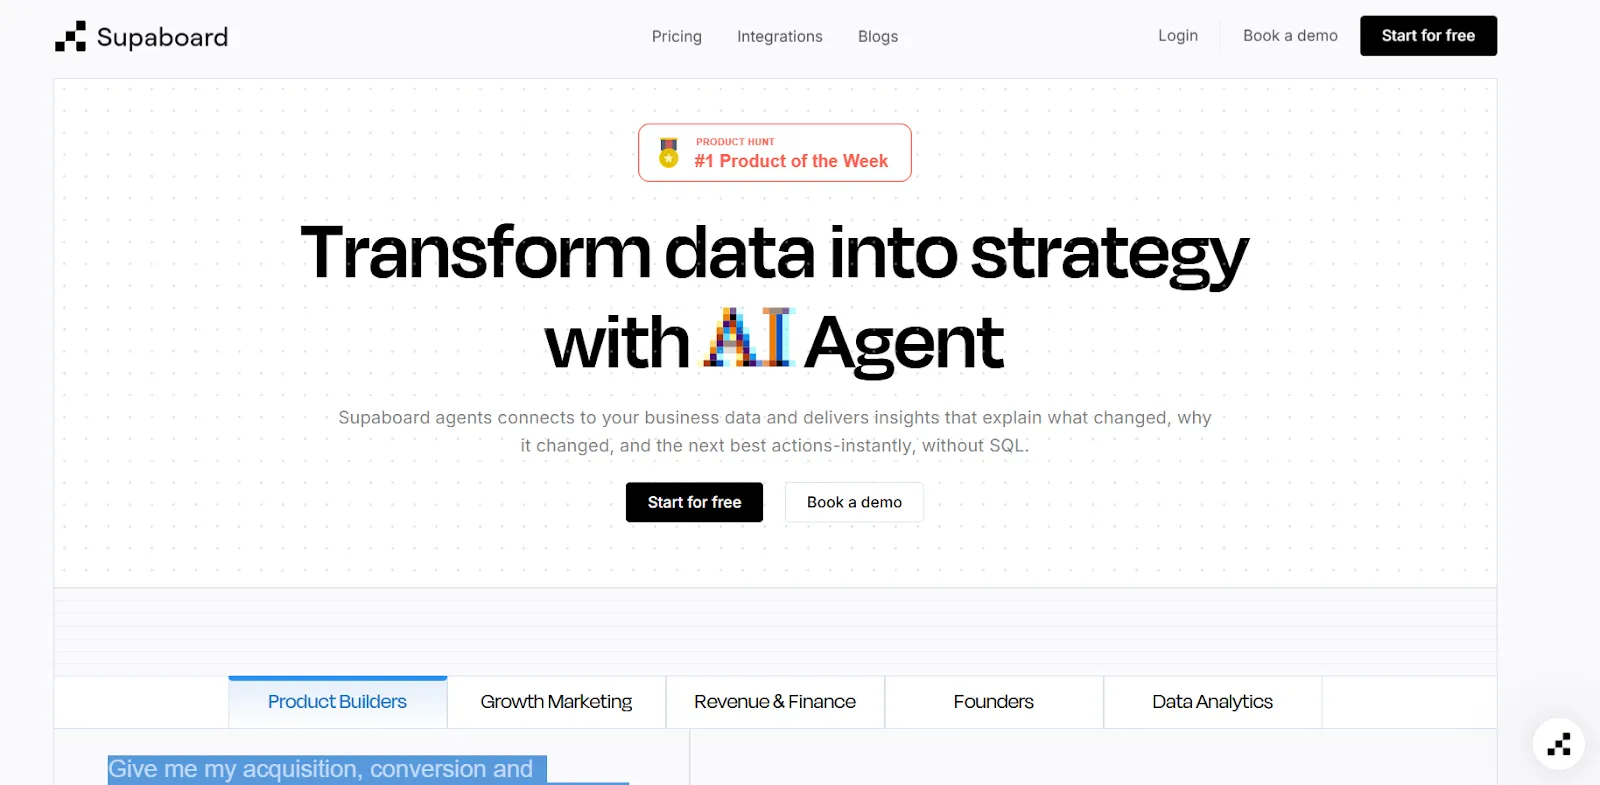
Supaboard connects to your data and generates dashboards on its own.
The whole product is built around trainable AI agents and natural language, so teams that don't want to maintain a modeling layer can get going quickly.
Supaboard's top features
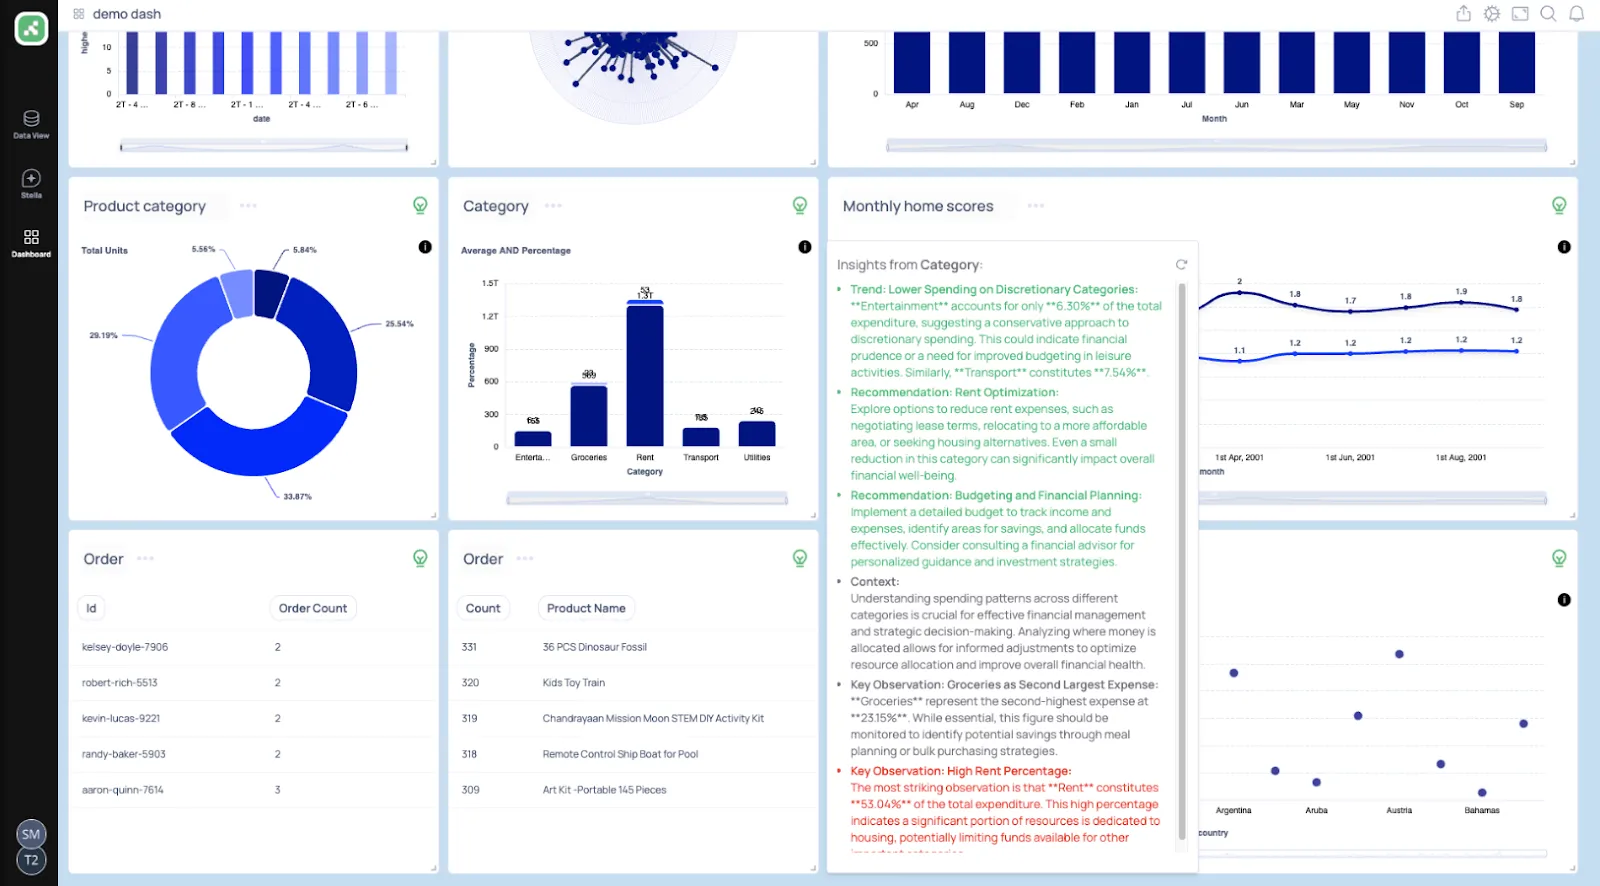
- Trainable AI agents: Build agents that learn your business rules, definitions, and SLAs, so answers come back grounded in your context.
- Natural-language data chat: Ask questions in plain English and get charts, metrics, explanations, and recommendations in one response.
- AI-generated real-time dashboards: Describe what you need, and Supaboard assembles interactive dashboards and KPI tables that update live.
- Slack and Teams bot: Push Supaboard answers and dashboards into chat so teams can ask without switching tools.
Supaboard pricing
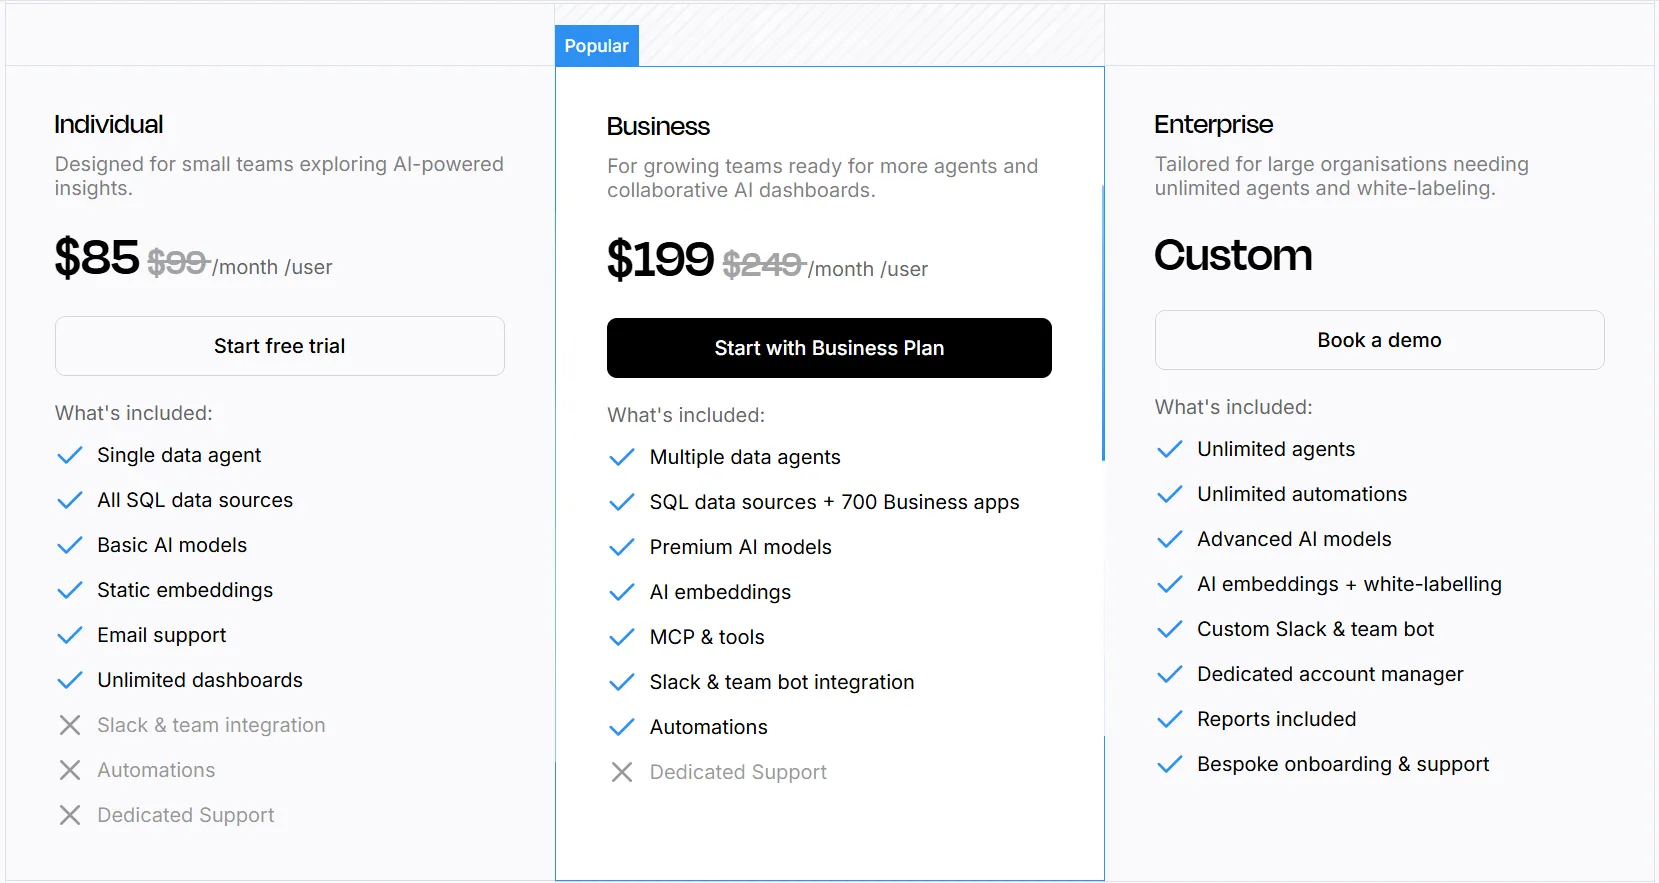
Three tiers, with a 14-day free trial on the first two:
- Individual: $85 per month for a single user. Includes the default AI agent, advanced AI models, static embeddings, unlimited dashboards, and email support.
- Business: $199 per month. Adds multiple users, custom agents, AI embeddings, Slack and Teams bot integration, and dedicated support.
- Enterprise: Custom pricing. Adds unlimited users and agents, white-labeled embeddings, custom bot setup, a dedicated account manager, and bespoke onboarding.
Supaboard pros and cons
✅ Quick to connect data sources, including large CSV and KPI files.
✅ Natural-language querying is genuinely accessible.
❌ Smaller community than other solutions on the market.
What are the best enterprise self-service BI platforms?
These four are the BI platforms that many enterprises are already running somewhere:
#1: Tableau
Best for: Analysts and enterprise teams that want best-in-class visualization with agentic analytics through Tableau Next.
Similar to: Microsoft Power BI, Qlik Sense.
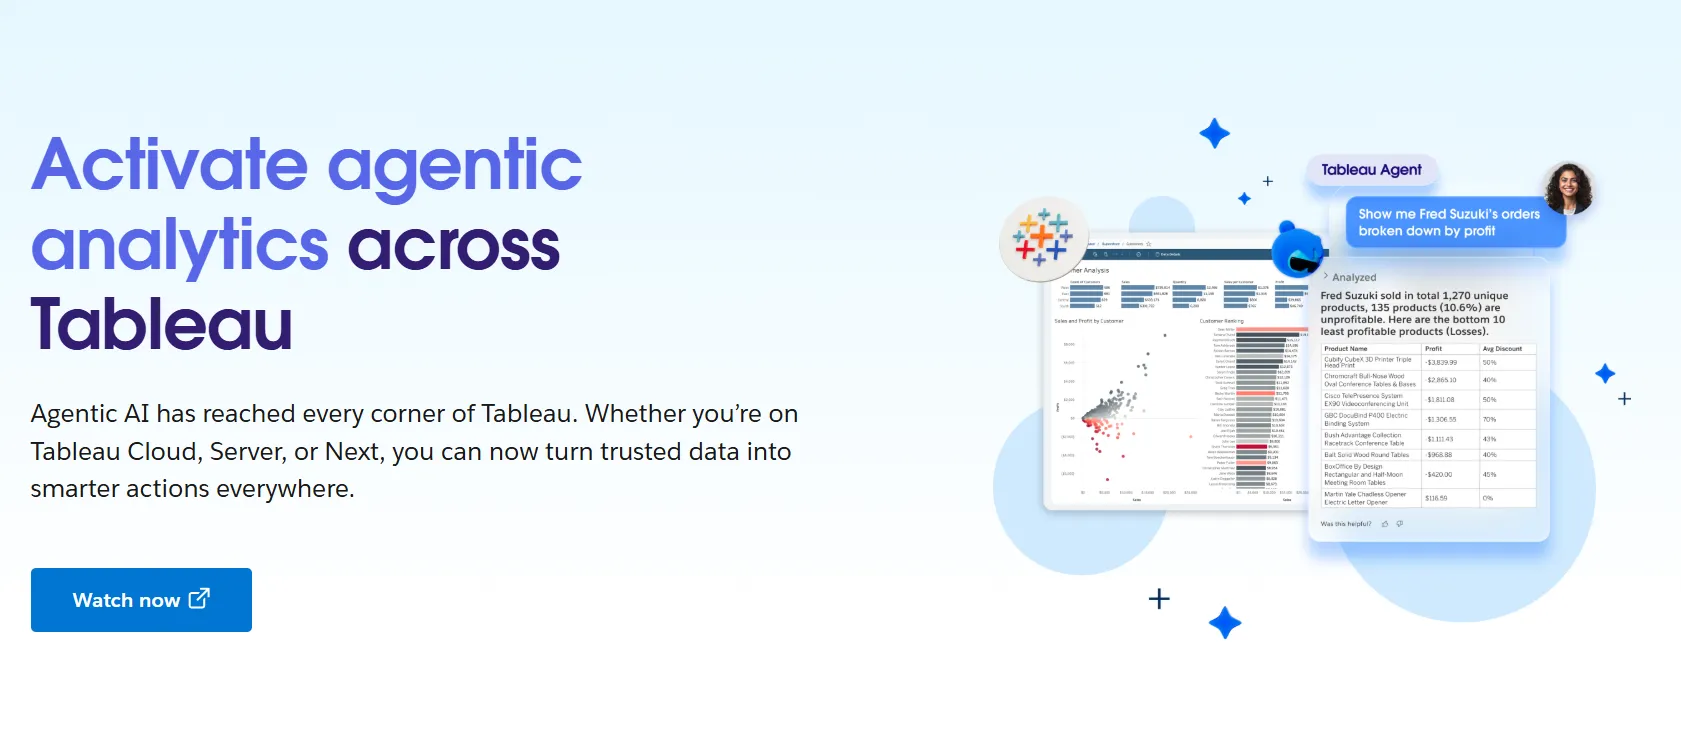
Tableau's been the visualization benchmark for two decades, and the drag-and-drop experience still sets the bar.
Tableau Next is the AI push: agents and natural-language queries running on Salesforce's Agentforce platform.
Tableau's top features
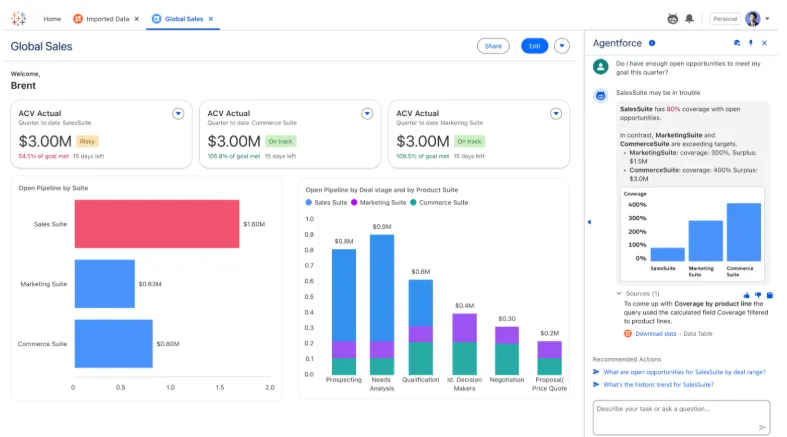
- VizQL drag-and-drop analytics: The engine that defined the category. Still the most polished visual analytics experience around.
- Tableau Next: Agents that surface insights and trigger actions in Slack and Salesforce workflows, not just inside Tableau.
- Tableau Pulse: Push-based metric summaries and trend alerts delivered in Slack and email.
- Centralized governance: Reusable metrics and centralized controls through Data Management, built to scale across thousands of users.
Tableau pricing
Tableau uses per-user, per-month pricing, with separate plans depending on whether you deploy Tableau in the cloud, on your own servers, or as part of its newer AI-driven offering:
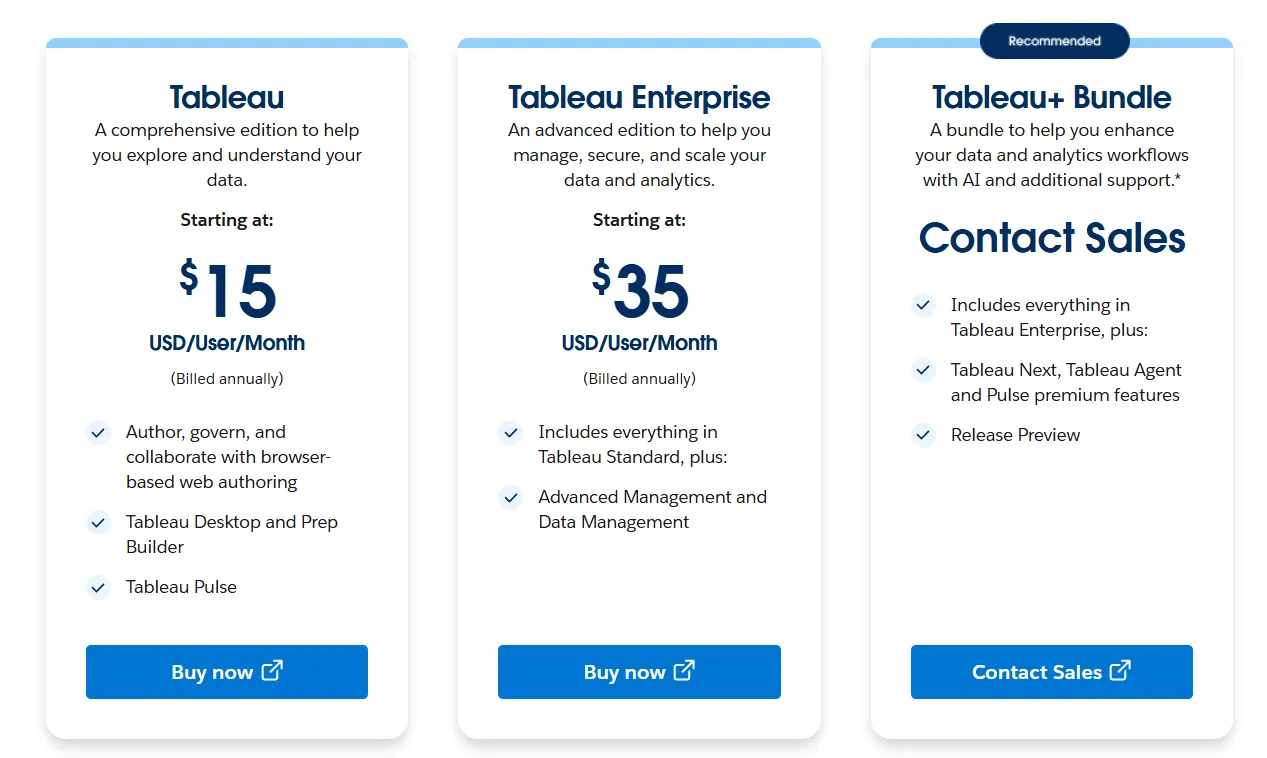
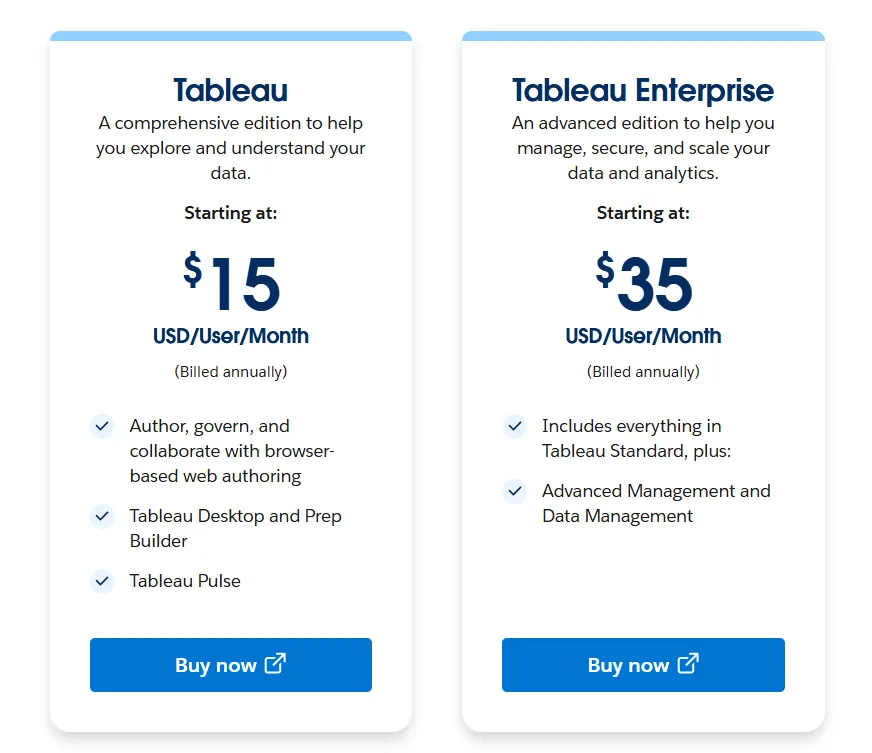
- Tableau Cloud has three pricing plans:
- Tableau Standard: Starts at $15/user/month, which includes browser-based authoring and collaboration, Tableau Desktop and Prep Builder, Tableau Pulse for metrics and insights.
- Tableau Enterprise: Starts at $35/user/month and includes everything in Standard, plus Advanced Management and Data Management for governance and scale.
- Tableau+ Bundle (Cloud + AI): Custom pricing, includes everything in Tableau Enterprise, plus Tableau Next, Tableau Agent, and Pulse premium features, with access to release previews and early AI capabilities.
- Tableau Server has two pricing plans:
- Tableau Standard: Starts from $15 per user/month, which includes authoring, governance, and collaboration and Tableau Desktop and Prep Builder.
- Tableau Enterprise: Starts from $35 per user/month, which includes everything in Standard, plus Advanced Management, Data Management, and eLearning.
- Tableau Next (agentic analytics) has 2 plans:
- Tableau Next: Starts from $40/month/seat, and includes Agentforce Tableau, Tableau Semantics, and its Native Slack integration.
- Tableau + Bundle: Custom pricing, which includes everything in Tableau Enterprise, plus Tableau Next, Tableau Agent and Pulse premium features.
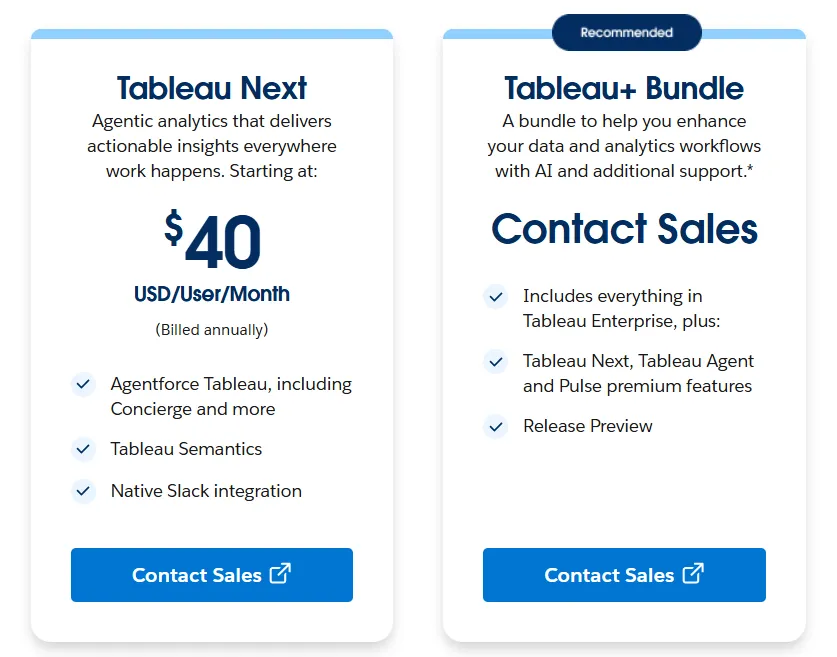
Tableau pros and cons
✅ Still the visualization leader.
✅ Tableau Next is a real move toward agentic analytics, not just a chat layer.
✅ Governance holds up at enterprise scale.
❌ Per-user pricing can scale fast for organizations rolling out broadly.
#2: Microsoft Power BI
Best for: Organizations standardized on Microsoft (Azure, Fabric, Office 365) that want BI tightly integrated with Copilot.
Similar to: Tableau, Sigma.
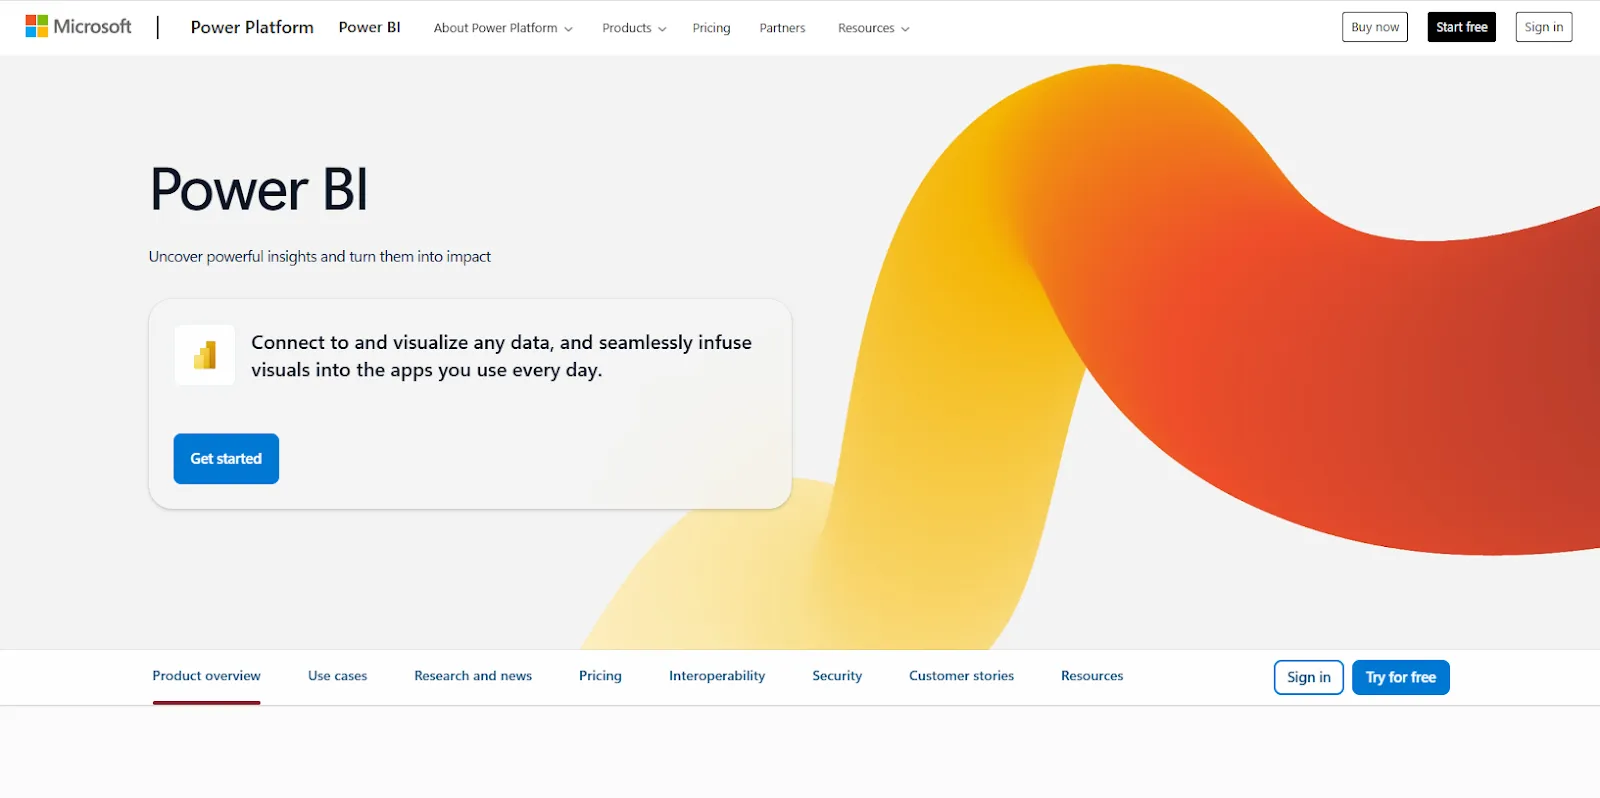
If your company runs on Microsoft, you're probably running Power BI already somewhere.
Copilot is the AI layer for natural-language querying and AI-assisted report building, sitting on top of the same DAX and dashboard experience analysts have used for years.
Power BI's top features
- Copilot integration: Ask questions in natural language, get answers grounded in your semantic model.
- DAX and semantic modeling: Dimensional modeling for analysts who want tight control over how data behaves across reports.
- Microsoft Fabric integration: Tight coupling with OneLake, Synapse, and the broader Microsoft data platform.
- Row-level security: Battle-tested for governed enterprise rollouts.
Power BI pricing
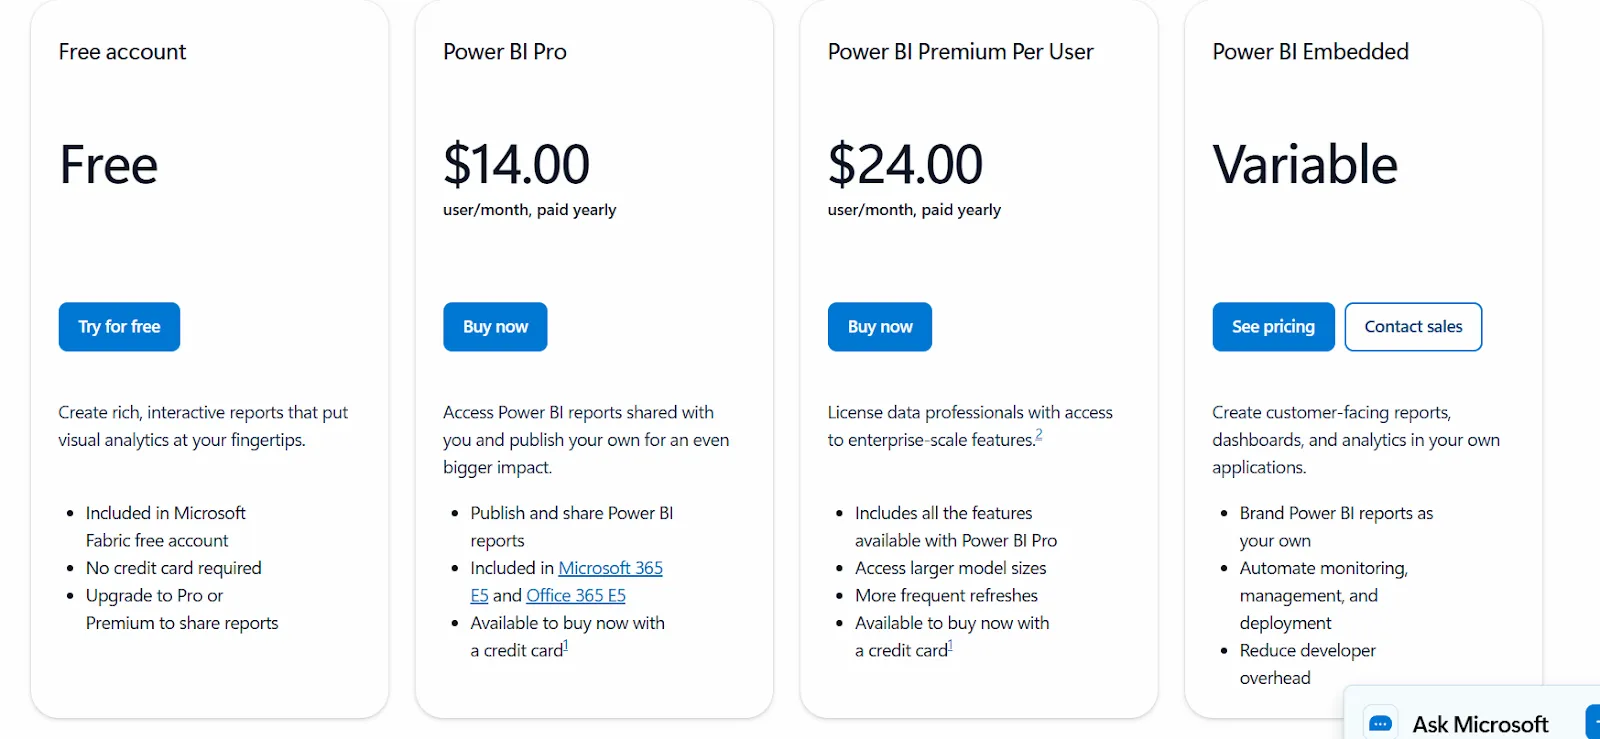
Power BI has a free tier for individual use (no sharing) and three paid options:
- Power BI Pro: $14 per user per month. Publishing, dashboard sharing, workspace collaboration, and embedding into Teams and SharePoint.
- Power BI Premium Per User: $24 per user per month. Larger model sizes, faster refreshes, paginated reports, advanced AI features.
- Power BI Embedded: Custom pricing. For embedding reports, dashboards, and analytics into your own customer-facing applications.
Power BI pros and cons
✅ Tight fit inside the Microsoft ecosystem.
✅ Copilot covers the everyday natural-language questions.
✅ Huge marketplace of custom visuals and connectors.
❌ For beginners, the learning curve can feel steep, particularly when you start working with data modeling and DAX formulas, according to a G2 review.
#3: Qlik Sense
Best for: Regulated industries that want interactive analytics with flexible deployment (cloud, on-prem, hybrid) and AI assists.
Similar to: Tableau, Sigma.
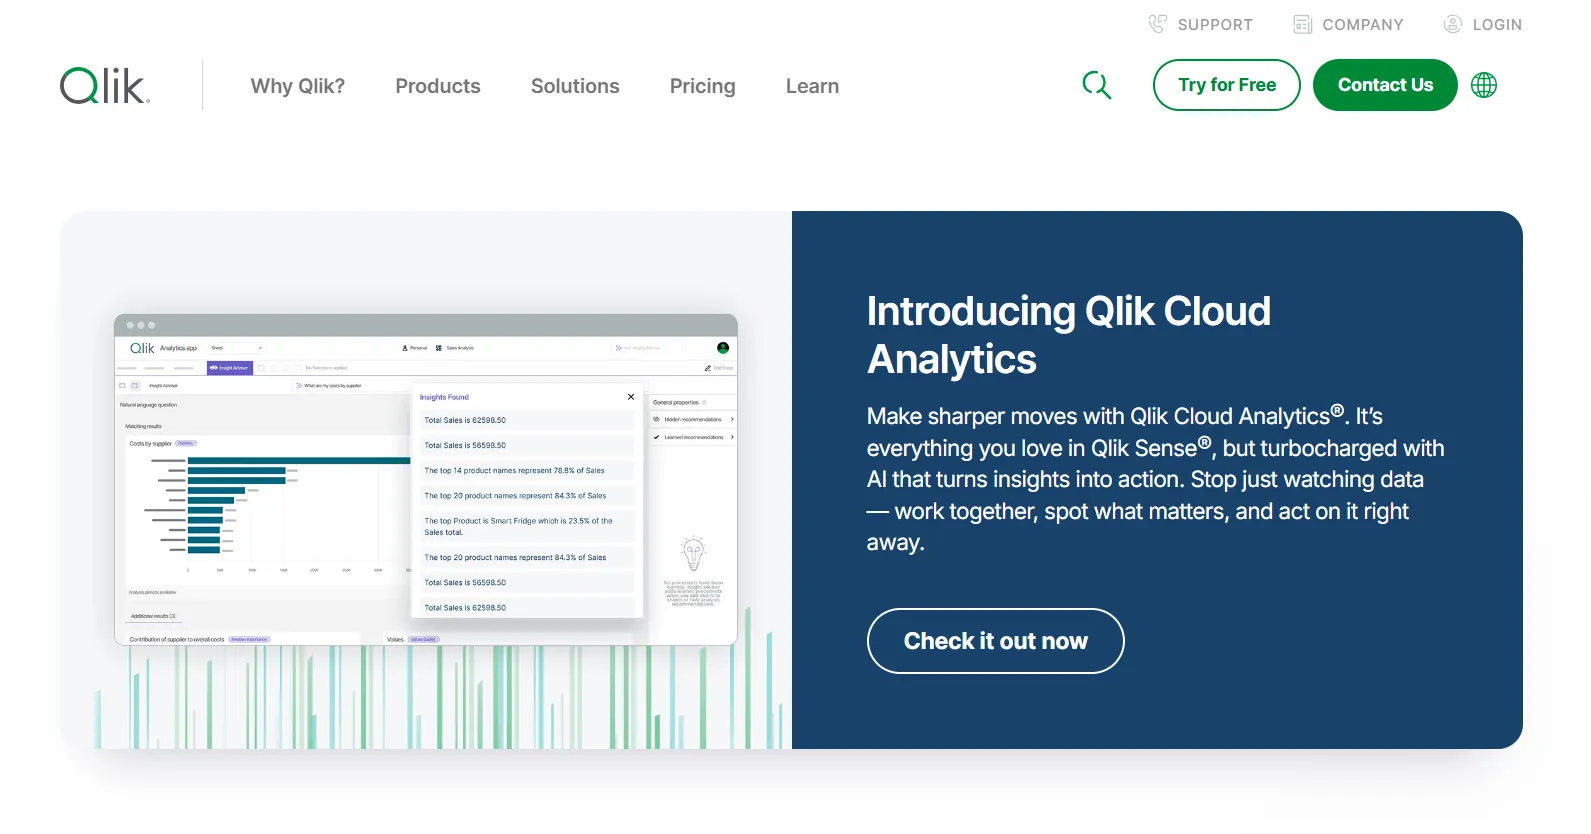
Qlik's associative engine is the differentiator.
Pick any value in any chart, and the whole interface recalculates around it, showing connected and unconnected data in real time with no pre-defined query paths needed.
Qlik Sense's top features
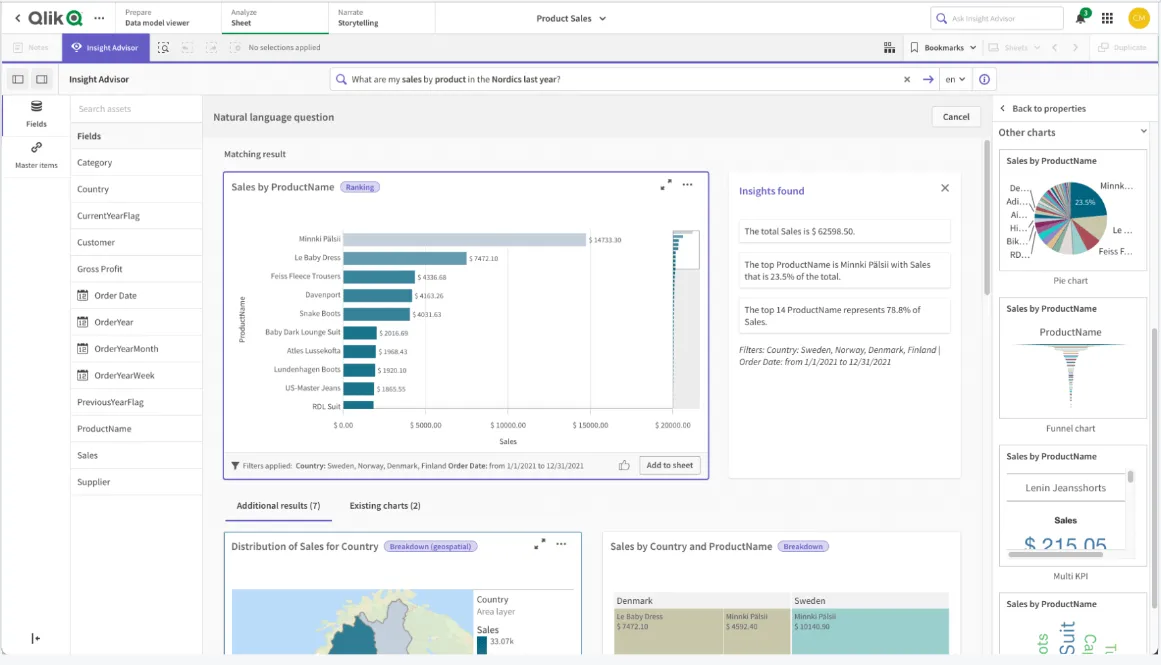
- Associative engine: Real-time recalculation across every chart as you select values. The signature Qlik feature.
- Qlik Insight Advisor: AI-generated insights, natural-language search, predictive features on top of the associative model.
- Real-time alerts: Monitor data changes and trigger automated actions when thresholds are crossed.
- Deployment flexibility: Cloud, on-prem, hybrid, all supported, which still matters in regulated industries.
Qlik Sense pricing
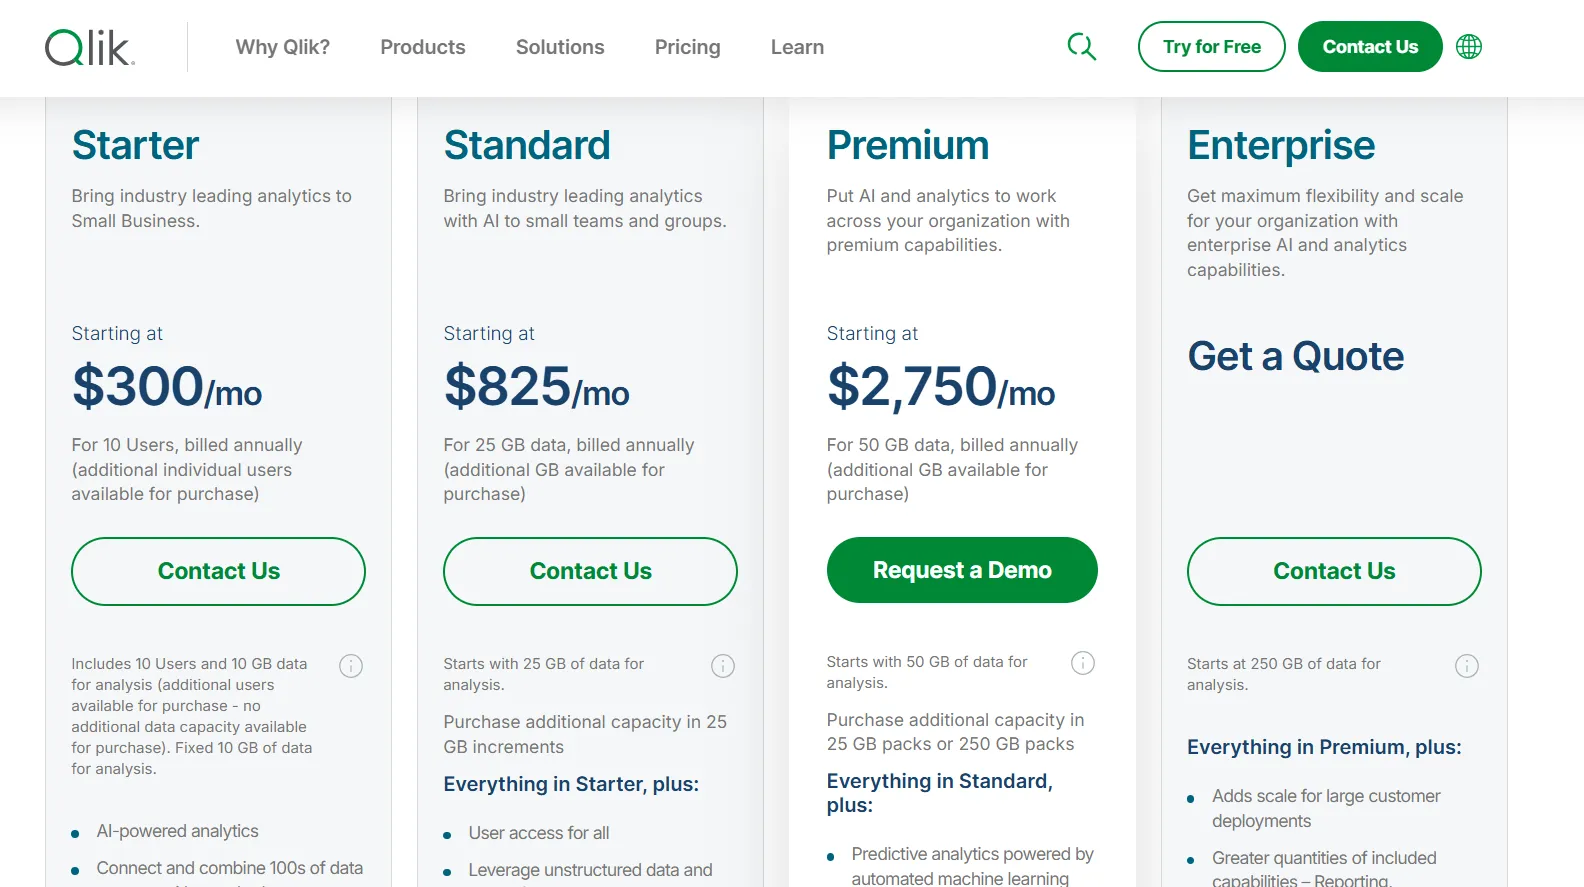
Qlik prices its Cloud Analytics platform (which includes Qlik Sense) on a capacity-based model tied to data volume, with annual billing across all tiers:
- Starter: $300/month for 10 users and 10 GB of data for analysis. Includes AI-powered analytics, hundreds of standard connectors, interactive dashboards, and the no-code automation builder.
- Standard: $825/month starting at 25 GB of data. Adds user access for all, GenAI for unstructured data, managed and shared spaces for governance, and 24x7 support.
- Premium: $2,750/month starting at 50 GB of data. Adds predictive analytics with automated machine learning, more GenAI capacity, anonymous public access, SAP and legacy system connectors, and guided customer success onboarding.
- Enterprise: Custom pricing starting at 250 GB of data. Adds larger app support (up to 50 GB per app), multi-region tenants, and a personalized customer success plan.
Qlik Sense pros and cons
✅ Associative engine is genuinely unique.
✅ Scales well on large, governed data.
❌ One user on G2 mentions that sometimes there are loading issues, especially when business intelligence is running updates.
#4: Domo
Best for: Teams that want data ingestion, dashboards, automation, and AI bundled into one platform from a single vendor.
Similar to: Tableau, Microsoft Power BI.
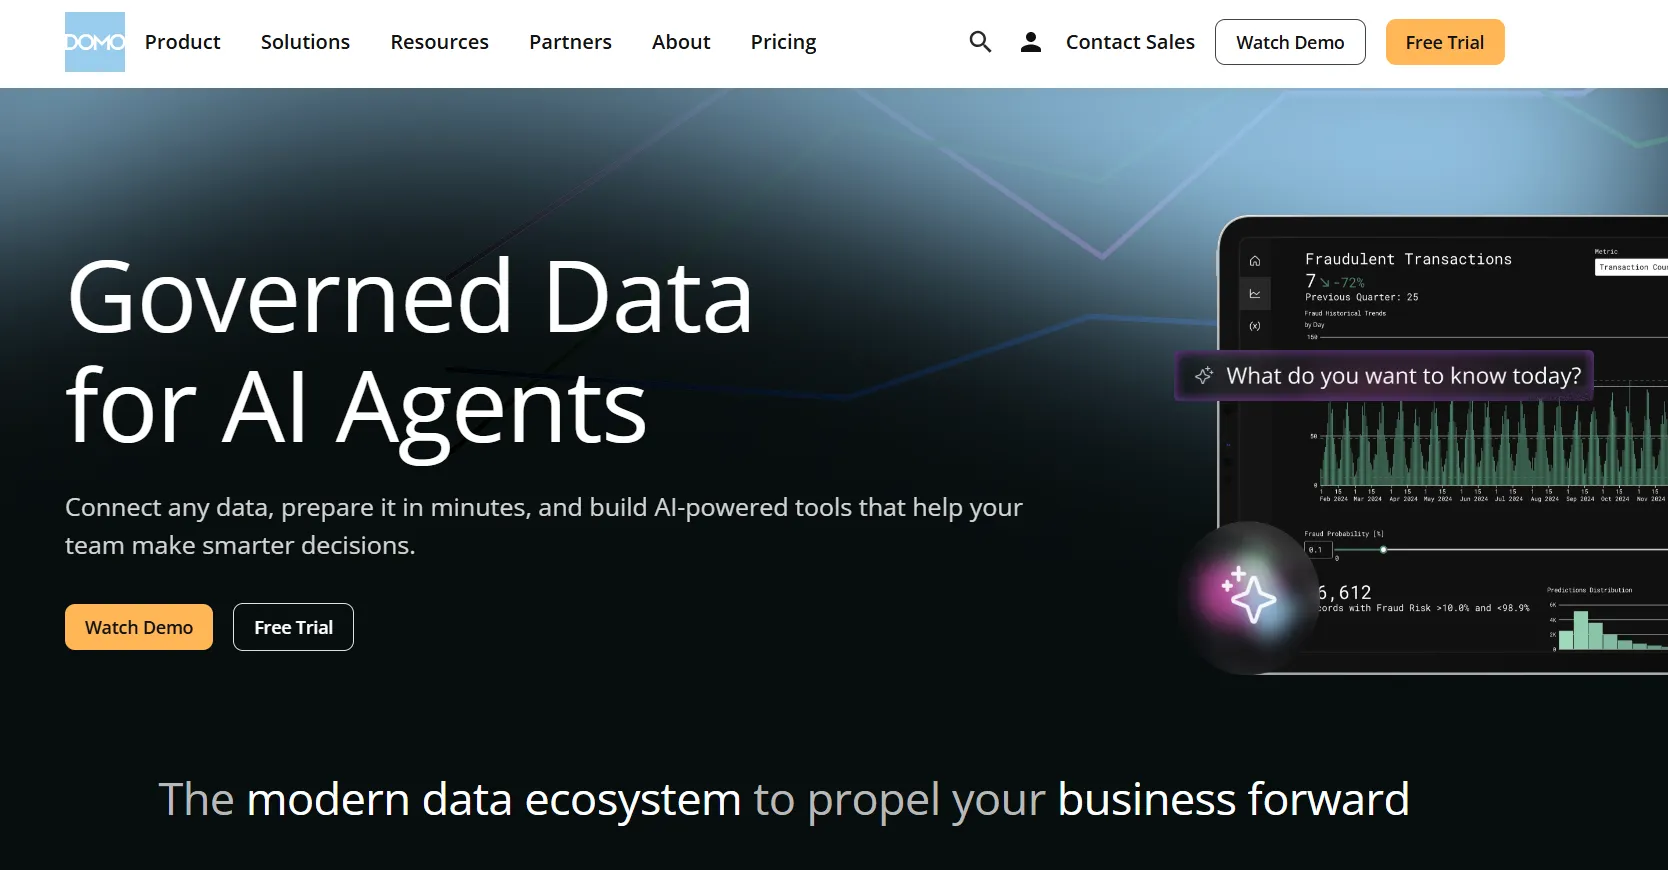
Domo bundles ingestion, dashboards, automation, alerts, and AI chat into one product.
That all-in-one positioning is a fit for teams who don't want to stitch together separate BI, ETL, and workflow tools.
Domo's top features
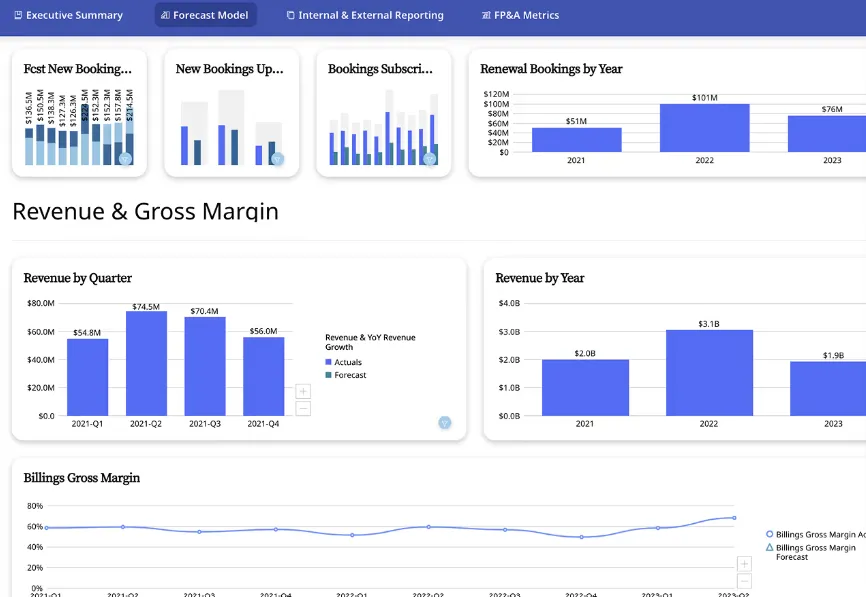
- Interactive dashboards: Real-time dashboards with built-in sharing and embedding.
- No-code analytics apps: Custom data-driven apps without pulling in a developer.
- AI chat and insights: Natural-language questions and automated trend surfacing on top of the dashboard layer.
- More than 1,000 connectors: A wide ingestion library with workflow automation baked into the platform.
Domo pricing
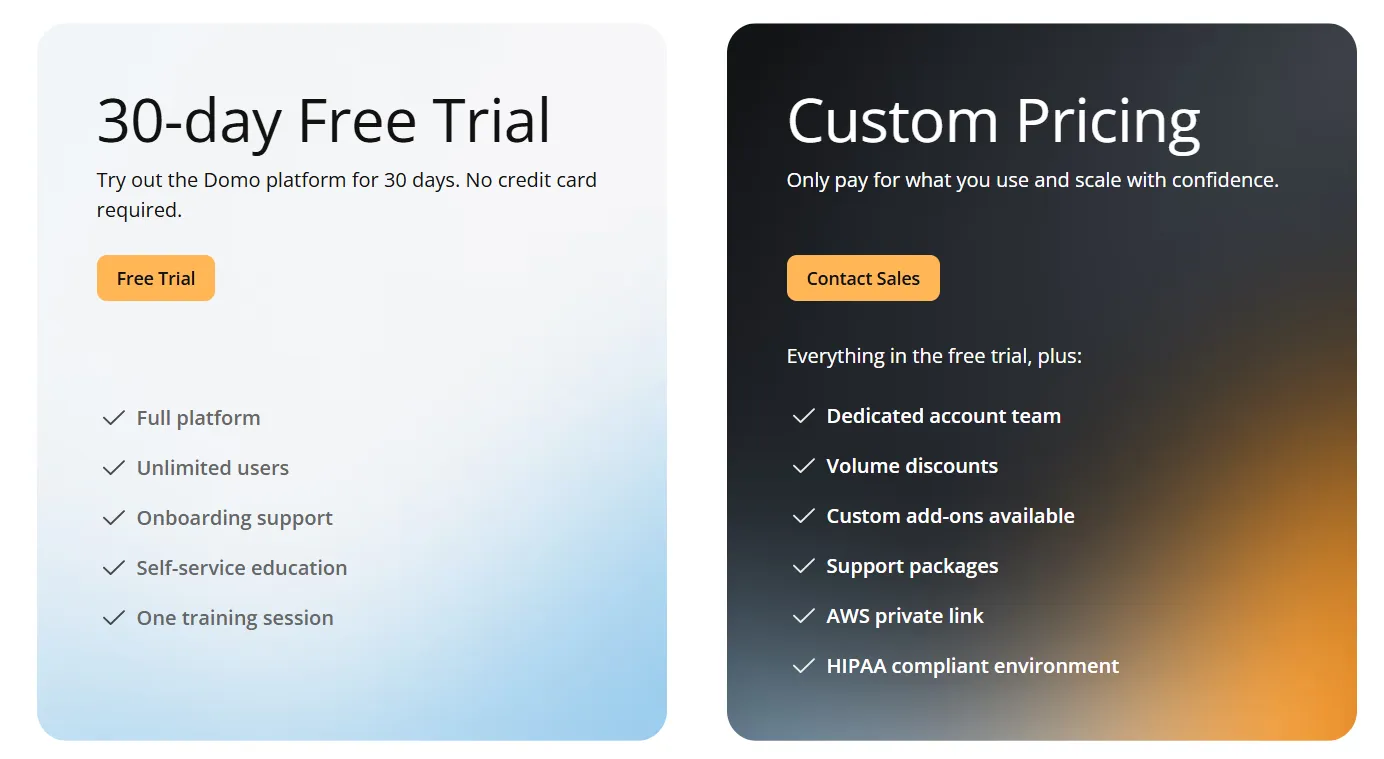
Domo’s pricing includes one paid plan with a free trial:
- Free trial: 30 days, no credit card, full platform access, onboarding support, and one guided training session.
- Paid plan: Usage-based, includes everything in the trial plus a dedicated account team, volume discounts, custom add-ons, and support packages.
Domo pros and cons
✅ Genuinely end-to-end, from ingestion to action.
✅ Workflow automation is stronger than most pure BI tools.
❌ Pricing is not disclosed. We covered affordable options in our Domo alternatives breakdown.
What are the best modern warehouse-native self-service BI tools?
If your data team already has dbt running and you need a usable frontend, these three are worth a look.
#1: Sigma
Best for: Finance, ops, and analyst teams that want spreadsheet-style analytics on live warehouse data with AI-assisted workflows.
Similar to: Omni, Metabase.
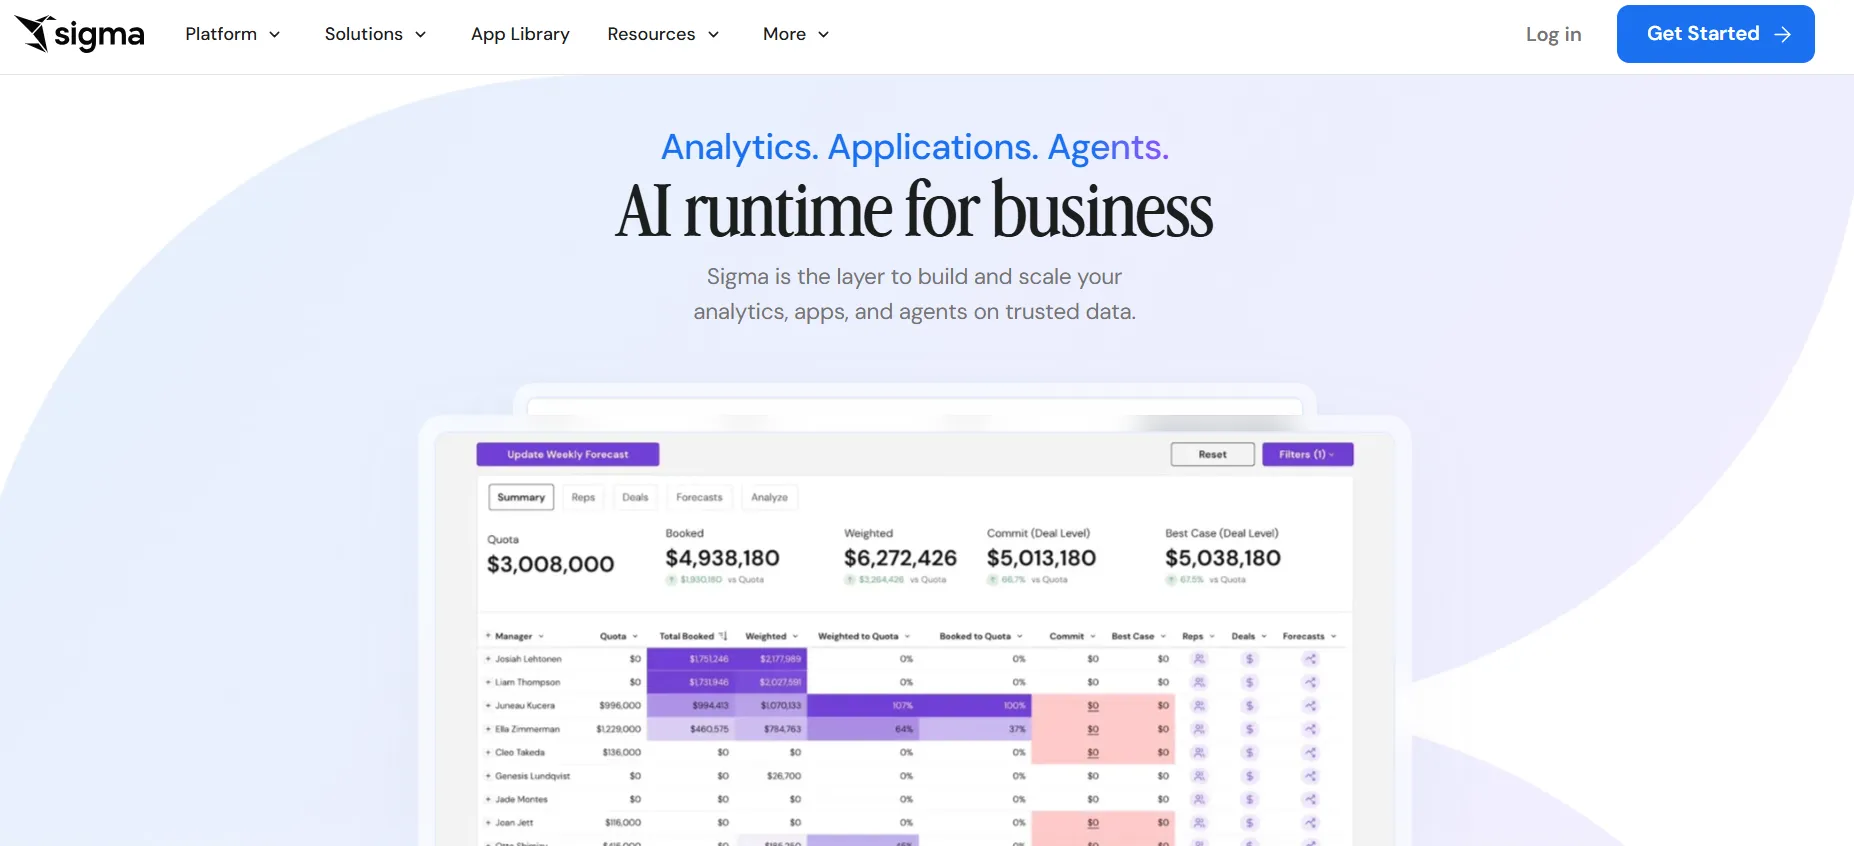
Think Excel, but connected straight to your warehouse.
Sigma runs live queries against Snowflake, BigQuery, Redshift, or Databricks while keeping a spreadsheet-style UI that anyone with Excel experience can pick up.
Sigma's top features
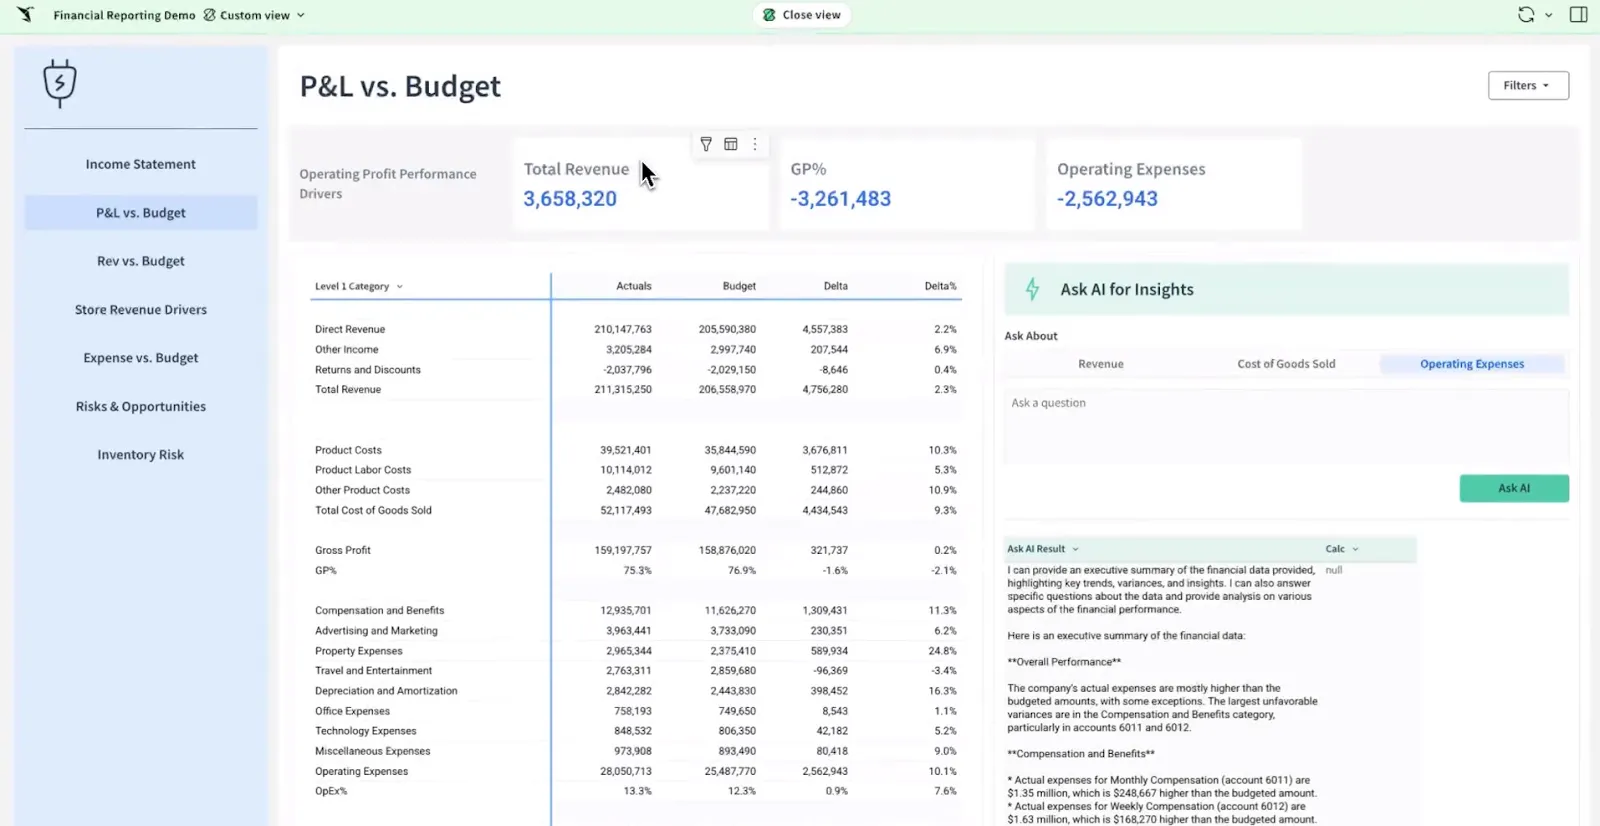
- Spreadsheet-style interface: Formulas, pivots, and tables on top of live warehouse data, no extracts.
- Ask Sigma AI: Natural-language queries plus AI-built dashboards, layered into the spreadsheet experience.
- AI Apps: Interactive apps for forecasting, planning, budgeting, and pipeline analysis without custom development.
- Warehouse-native: Every query runs live against your warehouse, no data movement.
Sigma pricing
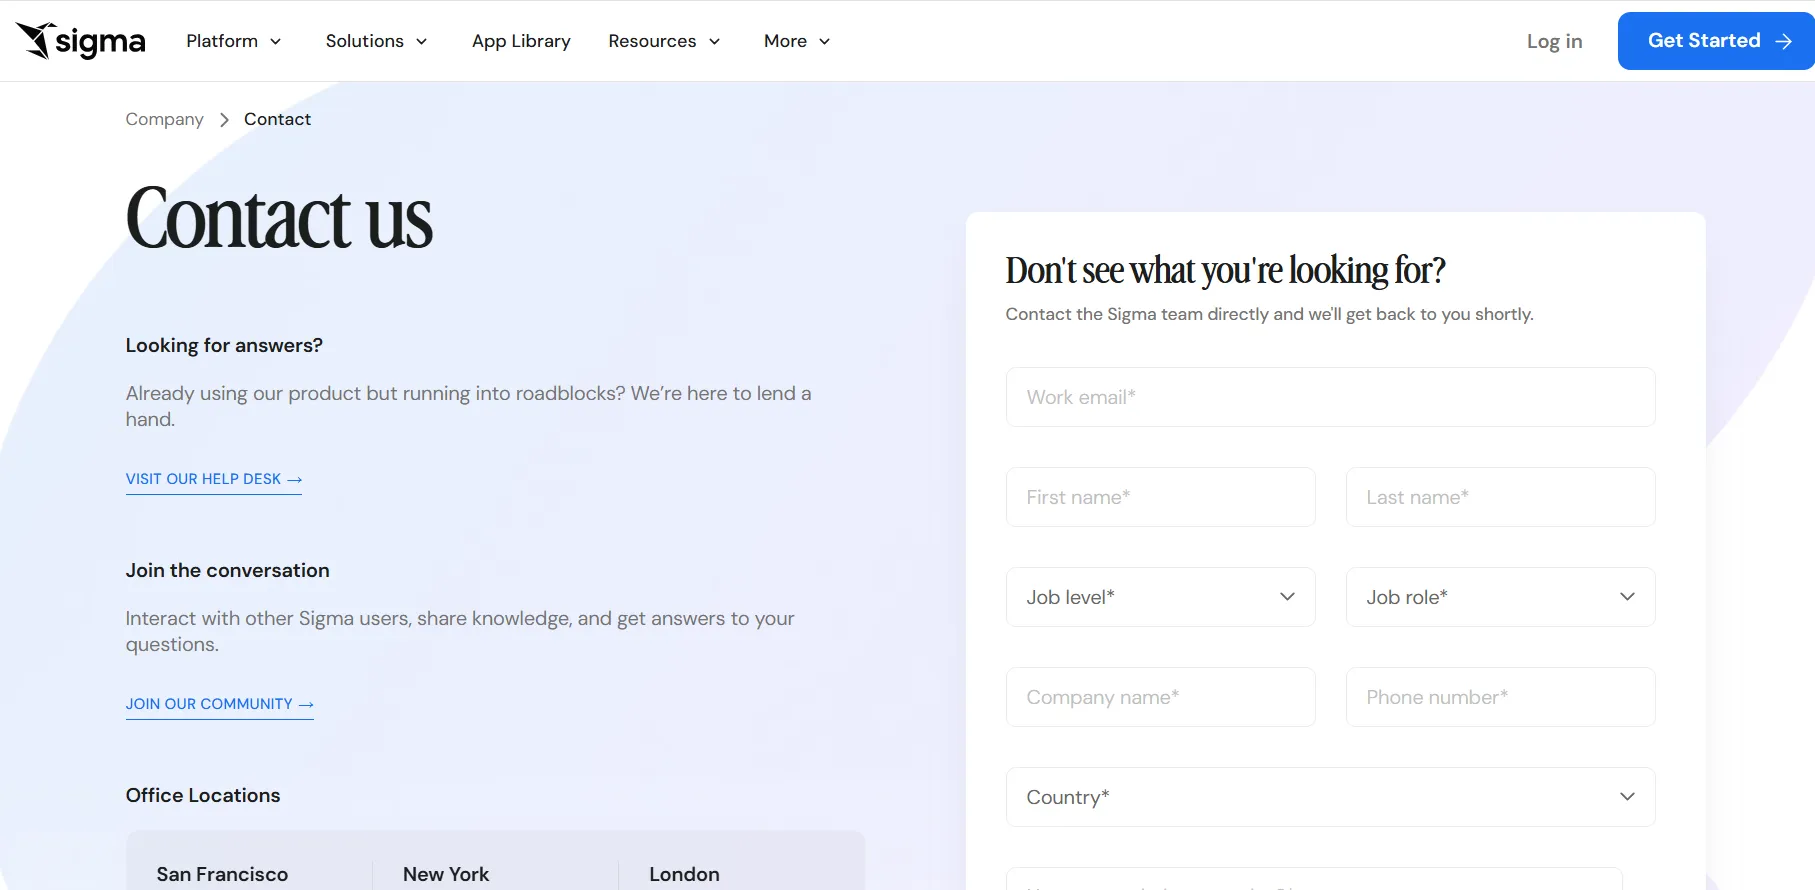
Sigma doesn't publish pricing, so you'll need to contact sales for a custom quote based on team size and data volume.
Sigma pros and cons
✅ Spreadsheet interface unlocks BI for non-analysts.
✅ Live warehouse queries keep numbers current.
✅ AI Apps work well for finance and ops use cases.
#2: Omni
Best for: Data teams that want a flexible semantic layer with self-service exploration, without the rigidity of LookML-style modeling.
Similar to: Sigma, Looker.
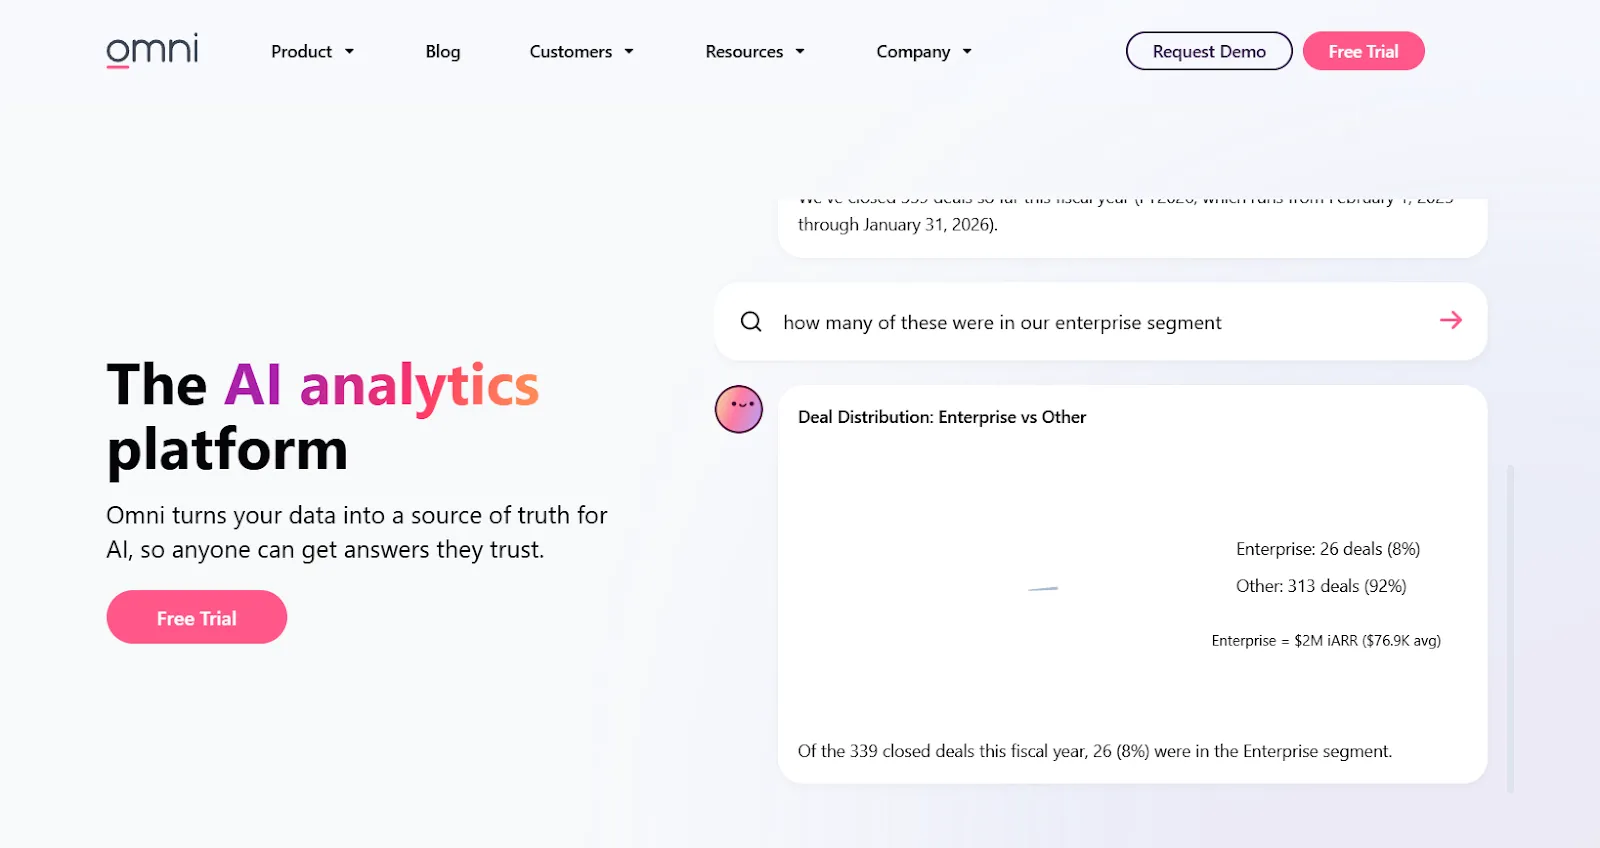
Omni's bet is on a metrics-first semantic model that gives you governed metrics without the heavy upfront modeling work LookML demands.
AI sits inside dashboards and workbooks for chart summaries, query generation, trend explanations, and next-step recommendations.
Omni's top features
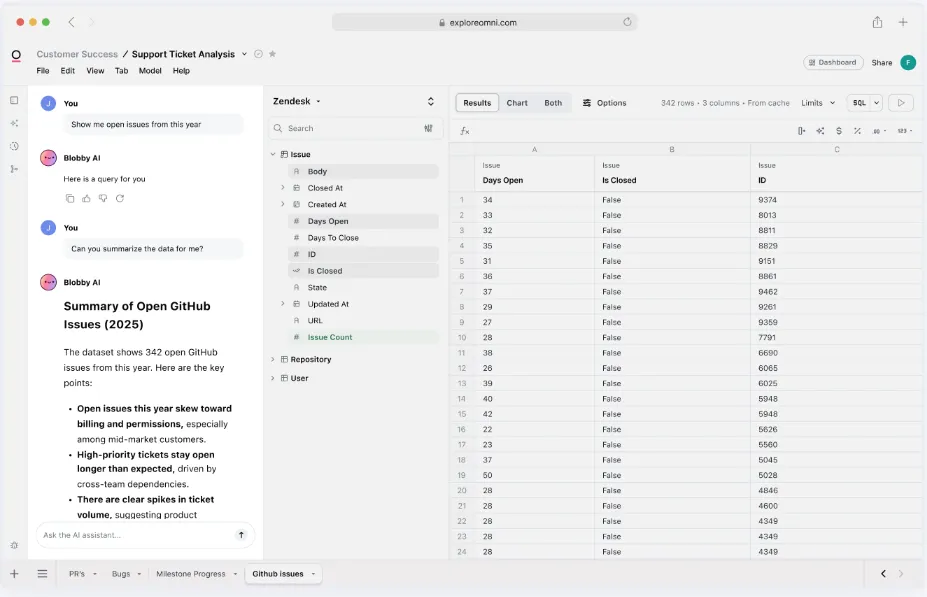
- Metrics-first modeling: Define metrics once in a centralized model that supports governed, reusable calculations.
- AI in dashboards and workbooks: Inline AI for chart summaries, query generation, trend explanations, and next-step suggestions.
- Spreadsheet-style exploration: Familiar spreadsheet interface for analyzing live warehouse data with governed metrics underneath.
- dbt integration: Direct integration with dbt models and the broader modern data stack.
Omni pricing
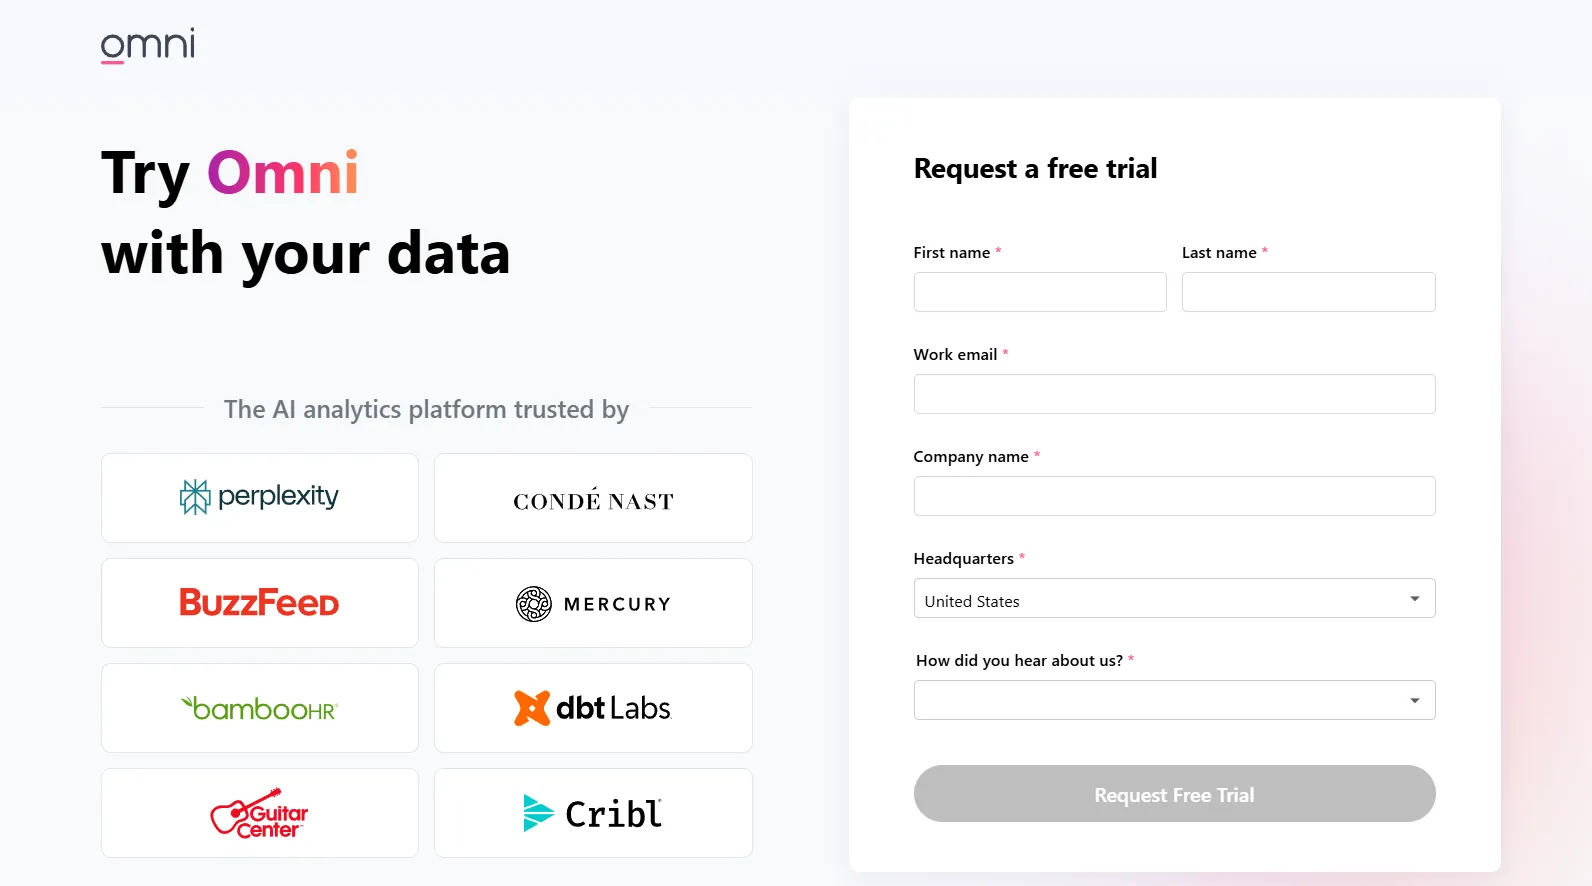
Omni doesn't publish subscription pricing. You can request a free trial on their website and get details from sales.
Omni pros and cons
✅ Drag-and-drop interface is easy to pick up.
✅ Strong dbt integration and direct warehouse querying.
#3: Metabase
Best for: Startups, product teams, and data-lean organizations that want fast self-service analytics with AI helpers and flexible embedding.
Similar to: Sigma, Omni.
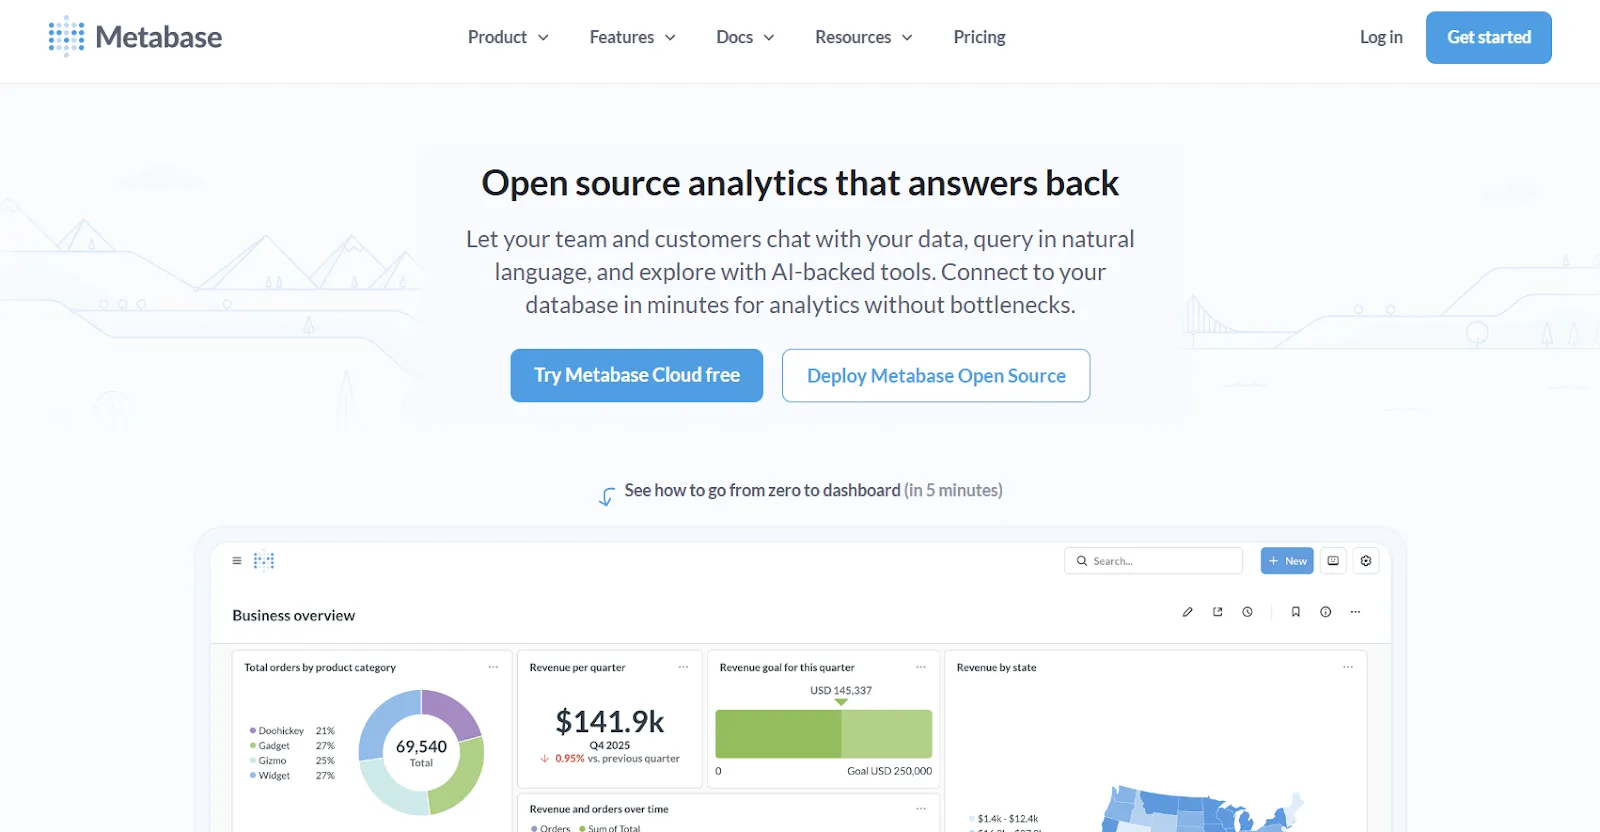
Metabase started as an open-source project and most teams can still self-host it for free.
Metabot AI handles the natural-language layer, and the click-to-explore model lets non-technical users dig into a chart without writing a new query.
Metabase's top features
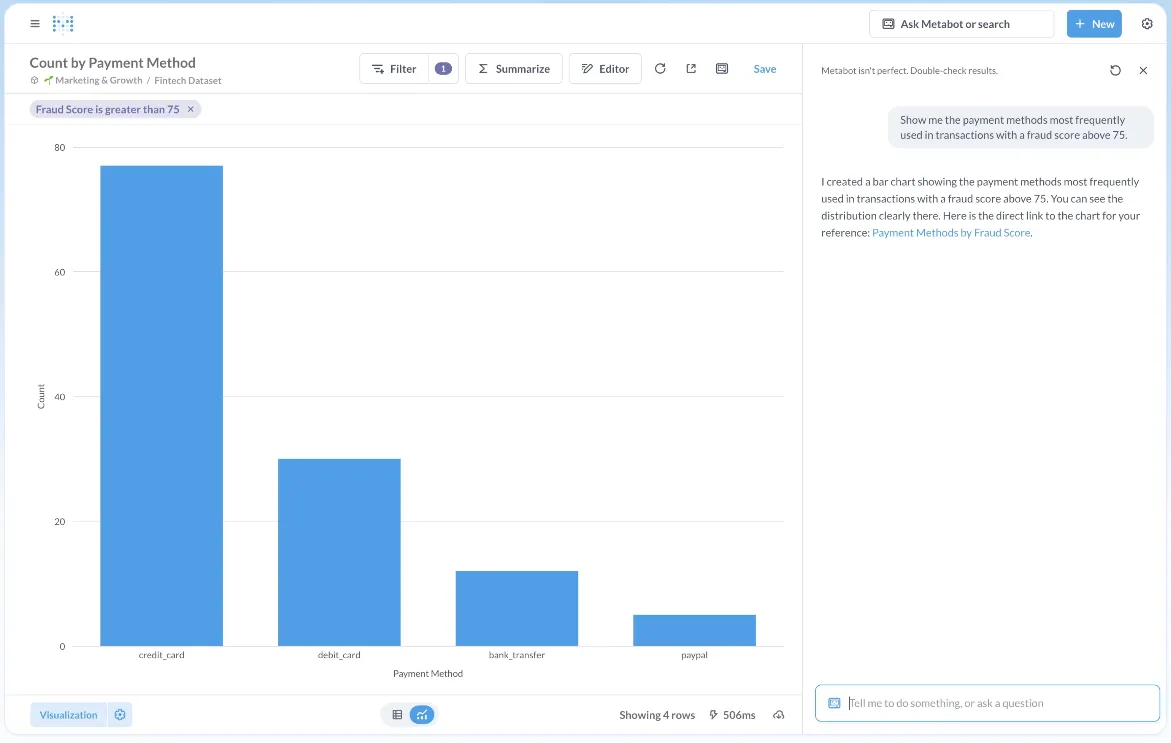
- Metabot AI: Natural-language queries that auto-generate SQL and charts.
- Visual query builder: No-code filtering, joining, and summarizing for non-technical users, with SQL escape hatch for analysts.
- Click-to-explore: Click any point on a chart to filter, pivot, or spin up a follow-up question.
- Embedded analytics: Solid embedding with signed URLs and row-level permissions for customer-facing products.
Metabase pricing
Metabase offers two pricing options depending on how you use the product: internal business intelligence or customer-facing embedded analytics.
- Business Intelligence:
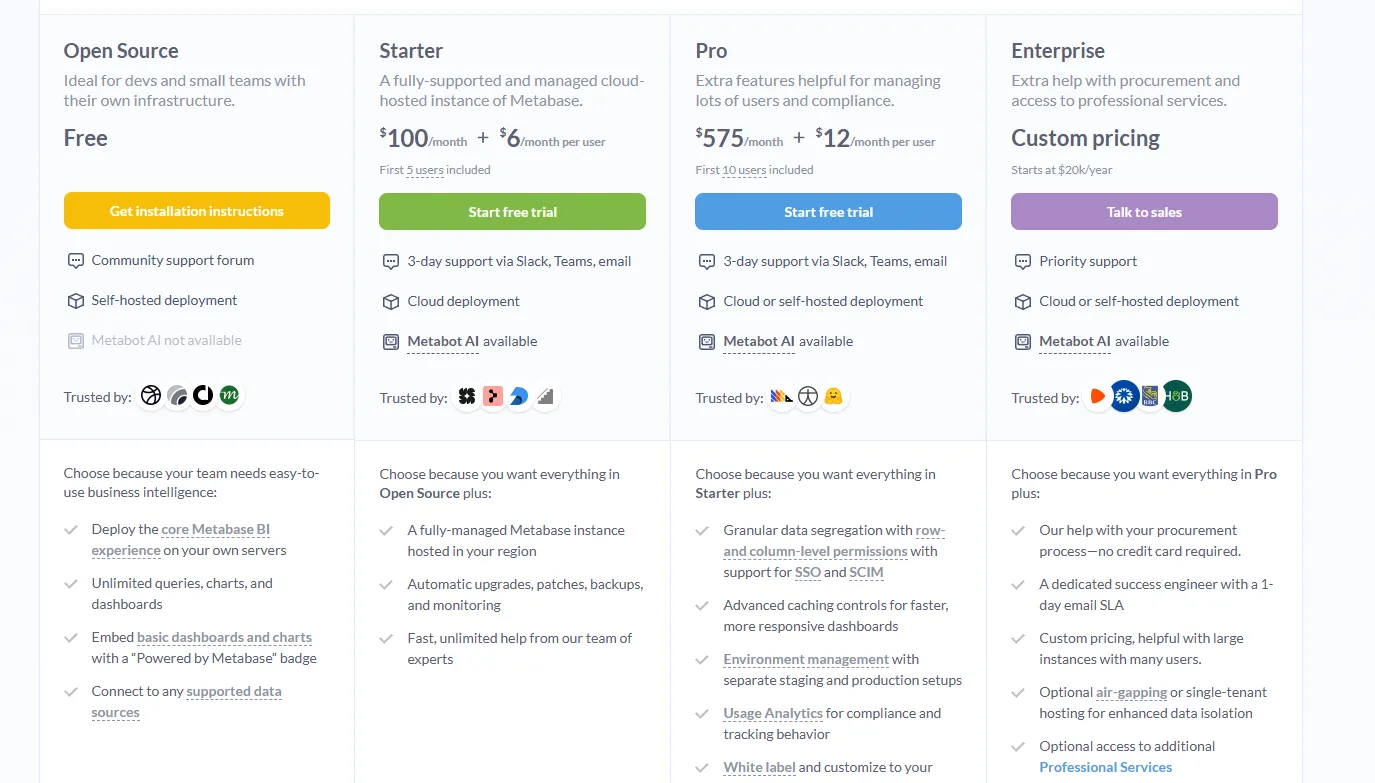
- Open Source (Self-hosted): Free, self-hosted deployment, includes unlimited queries, charts, and dashboards, connects to all supported data sources, basic embedding with “Powered by Metabase” branding, community support only.
- Starter (Cloud-hosted): $100/month + $6/user/month, first 5 users included, includes everything in Open Source, plus option to include Metabot AI (charged extra), automatic upgrades, backups, and monitoring, support via Slack, Teams, and email (3-day SLA).
- Pro: $575/month + $12/user/month, first 10 users included, cloud or self-hosted deployment, includes everything in Starter, plus row- and column-level permissions, SSO and SCIM support, advanced caching and performance controls, staging + production environments, usage analytics and audit visibility, white-labeling, and embedded analytics capabilities.
- Enterprise: Custom pricing (starts at $20k/year), includes everything in Pro, plus priority support, dedicated success engineer (1-day email SLA), optional single-tenant or air-gapped deployment, and optional professional services.
- Embedded Analytics pricing:
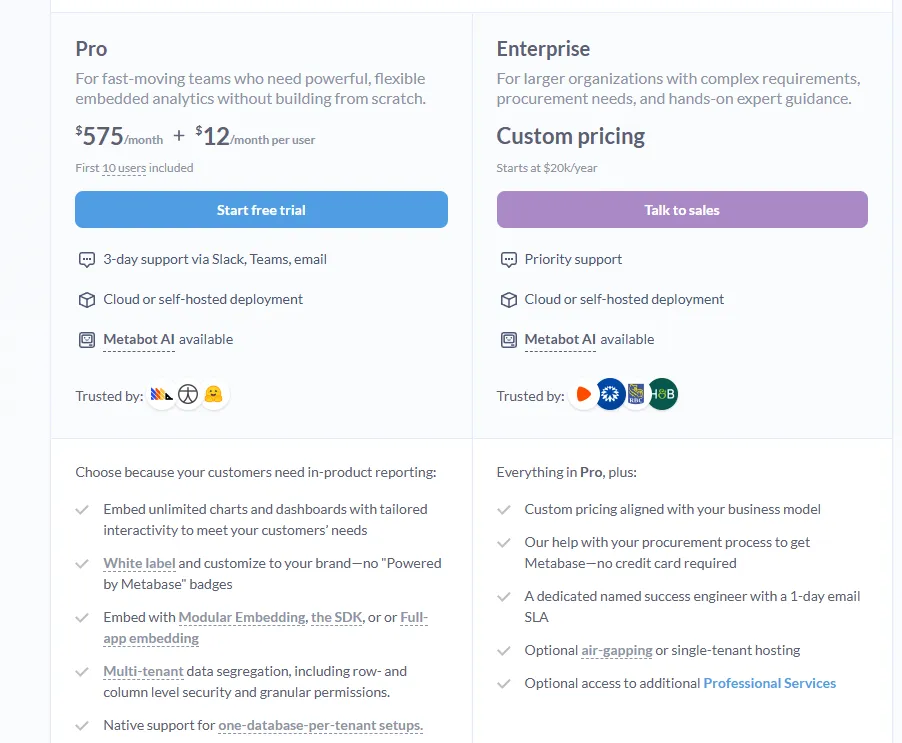
- Pro: $575/month + $12/user/month, first 10 users included, includes unlimited embedded dashboards and charts, full white-labeling, modular embedding, SDK, or full-app embedding, multi-tenant security (row- and column-level), one-database-per-tenant support, staging + production environments, usage analytics, internal BI for your team, and option to include Metabot AI (charged extra).
- Enterprise: Custom pricing (starts at $20k/year), includes everything in Pro, plus a dedicated success engineer, priority support, optional single-tenant or air-gapped hosting, and optional professional services.
Metabase pros and cons
✅ Free tier is genuinely useful.
✅ Approachable for non-technical users.
❌ A user on G2 believes that Metabase could benefit from having an AI assistant that understands the databases and assists in building queries
Get started for free with Dot
The reality is that most "self-service" BI tools are still self-service mainly for analysts.
The people they're aimed at, the marketing managers and finance leads and operations directors and founders, still need someone on the data team to set the tool up before they get anywhere with it.
We designed to close the gap of busy teams having to ask otherwise busy analysts for adhoc or comprehensive analysis.
Anyone in your company can ask Dot a question in plain English and get a written, explained answer back.
Here's what else you get when you sign up for Dot:
- A free plan with 300 one-time credits and full Pro feature access, no credit card required.
- Chat-based analysis in Slack, Microsoft Teams, email, or the Dot web app.
- Scheduled business reviews written for stakeholders, generated directly from your warehouse on whatever cadence you set.
- DotML semantic layer that learns from dbt, your existing semantic models, and analyst corrections over time.
- Direct connections to Snowflake, BigQuery, Redshift, Databricks, and most production SQL databases.
- Full SQL audit trail behind every answer, so analysts can validate any number before it goes out.
- Credit-based pricing that scales with usage, not seats, so a company-wide rollout doesn't break the budget.
➡️ Get started for free with Dot's free plan, or schedule a demo to see how it works with your data.
⚠️ Disclaimer: This article was last updated on May 27, 2026. If you spot any inaccuracies, contact us and we'll fact-check it.
Theo Tortorici
Theo writes about AI-powered analytics, data tools, and the future of business intelligence at Dot.